Chart Color Schemes
This analysis uses ABS Statistical Areas Level 2 (SA2) boundaries, which can materially differ from Suburbs and Localities (SAL) even when sharing similar names.
SA2 boundaries are defined by the Australian Bureau of Statistics and are designed to represent communities for statistical reporting (e.g., census and ERP).
Suburbs and Localities (SAL) represent commonly-used suburb/locality names (postal-style areas) and may use different geographic boundaries. For comprehensive analysis, consider reviewing both boundary types if available.
est. as @ -- *
ABS ERP | -- people | --
2021 Census | -- people
Sales Activity
Curious about local property values? Filter the chart to assess the volume and appreciation (including resales) trends and regional comparisons, or scroll to the map below view this information at an individual property level.
Find a Recent Sale
Sales Detail
Population
Sippy Downs lies within the top quartile of areas nationally for population growth performance according to AreaSearch analysis of recent, and medium to long-term trends
Based on AreaSearch's analysis, Sippy Downs' population is around 12,576 as of Nov 2025. This reflects an increase of 1,032 people (8.9%) since the 2021 Census which reported a population of 11,544 people. The change is inferred from the estimated resident population of 12,569 from the ABS as of June 2024 and an additional 235 validated new addresses since the Census date. This level of population equates to a density ratio of 866 persons per square kilometer, which is relatively in line with averages seen across locations assessed by AreaSearch. Sippy Downs' 8.9% growth since the 2021 census exceeded the SA3 area (7.4%) and the non-metro area, marking it as a growth leader in the region. Population growth for the area was primarily driven by overseas migration that contributed approximately 53.6% of overall population gains during recent periods, although all drivers including interstate migration and natural growth were positive factors.
AreaSearch is adopting ABS/Geoscience Australia projections for each SA2 area, as released in 2024 with 2022 as the base year. For any SA2 areas not covered by this data, and for years post-2032, Queensland State Government's SA2 area projections, released in 2023 based on 2021 data, are adopted. It should be noted that these state projections do not provide age category splits; hence where utilised, AreaSearch is applying proportional growth weightings in line with the ABS Greater Capital Region projections (released in 2023, based on 2022 data) for each age cohort. Moving forward with demographic trends, an above median population growth of non-metropolitan areas nationally is projected, with the area expected to grow by 2,290 persons to 2041 based on the latest annual ERP population numbers, reflecting a gain of 18.1% in total over the 17 years.
Frequently Asked Questions - Population
Development
AreaSearch analysis of residential development drivers sees Sippy Downs recording a relatively average level of approval activity when compared to local markets analysed countrywide
Sippy Downs has seen approximately 24 new homes approved annually. Between FY-21 and FY-25124 homes were approved, with an additional 26 approved so far in FY-26. On average, 9.5 people moved to the area each year for every dwelling built over these five financial years.
This high demand relative to supply typically puts upward pressure on prices and increases competition among buyers. New properties are constructed at an average expected cost of $196,000, which is below regional levels, indicating more affordable housing options for buyers. In FY-26, $65.6 million in commercial approvals have been registered, suggesting strong local business investment. However, Sippy Downs has significantly less development activity compared to the rest of Queensland, with 56.0% fewer approvals per person than the regional average. This constrained new construction often reinforces demand and pricing for existing dwellings. Nationally, development activity is also lower in Sippy Downs, reflecting market maturity and possible development constraints. New building activity shows a skew towards compact living, with 14.0% detached houses and 86.0% medium and high-density housing.
This shift from the area's current housing composition (64.0% houses) indicates decreasing availability of developable sites and reflects changing lifestyles and demand for more diverse, affordable housing options. The estimated population per dwelling approval in Sippy Downs is 1430 people, reflecting its quiet development environment. Population forecasts indicate that the area will gain 2,283 residents by 2041. If current development rates continue, housing supply may struggle to keep pace with population growth, potentially heightening buyer competition and supporting price increases.
Frequently Asked Questions - Development
Infrastructure
Sippy Downs has very high levels of nearby infrastructure activity, ranking in the top 10% nationally
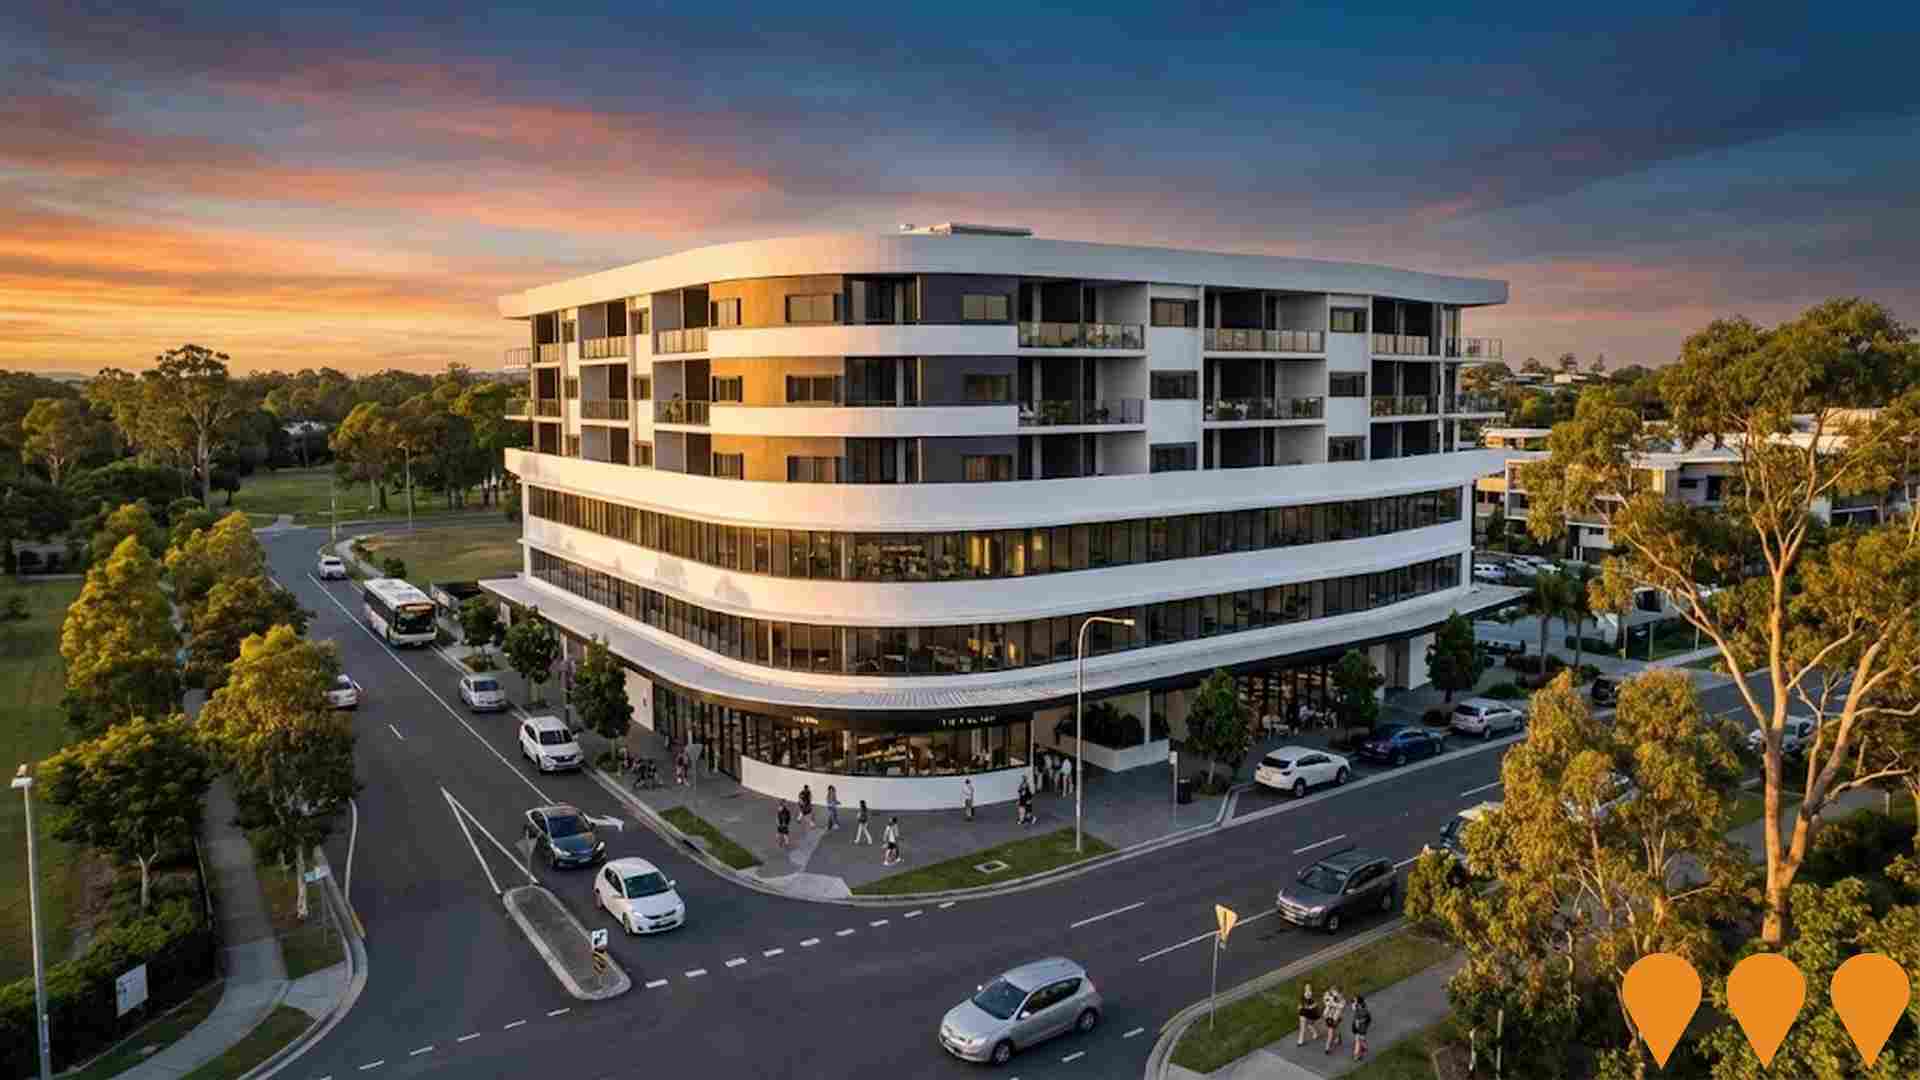
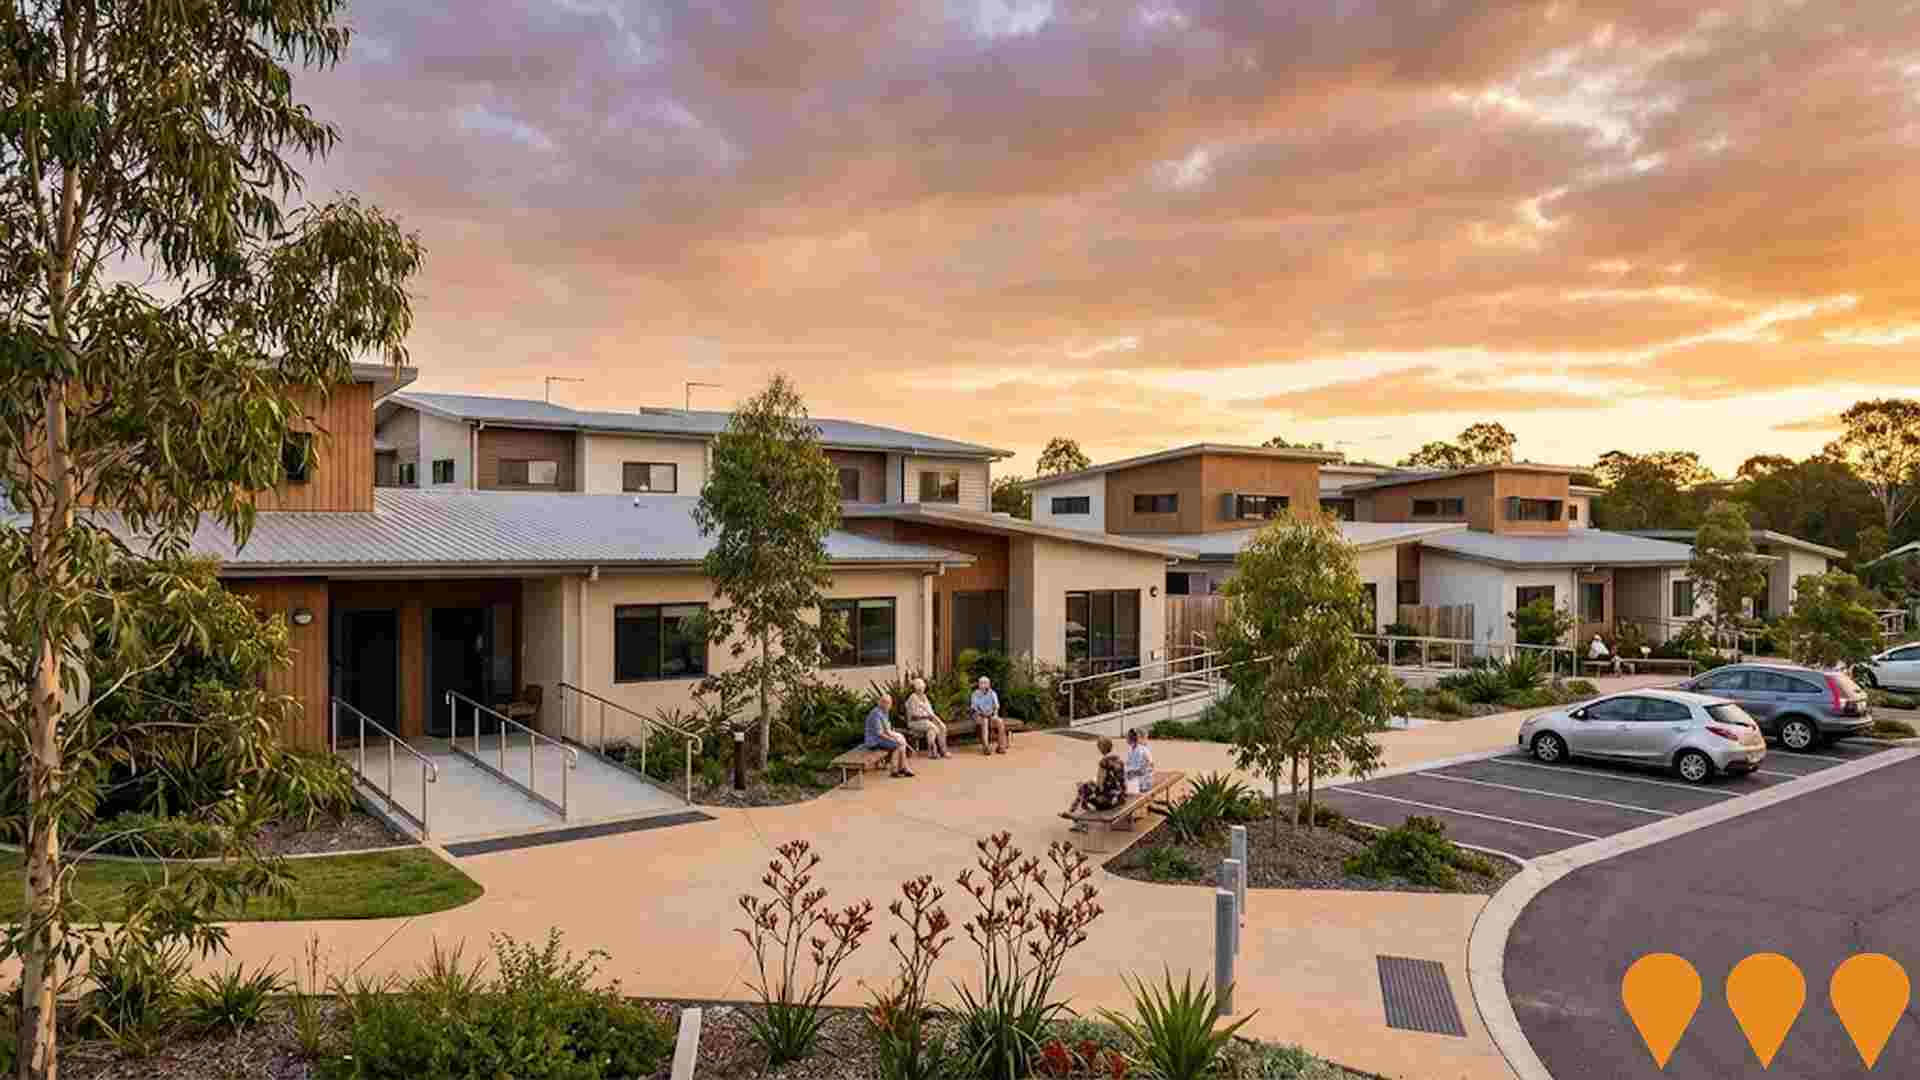
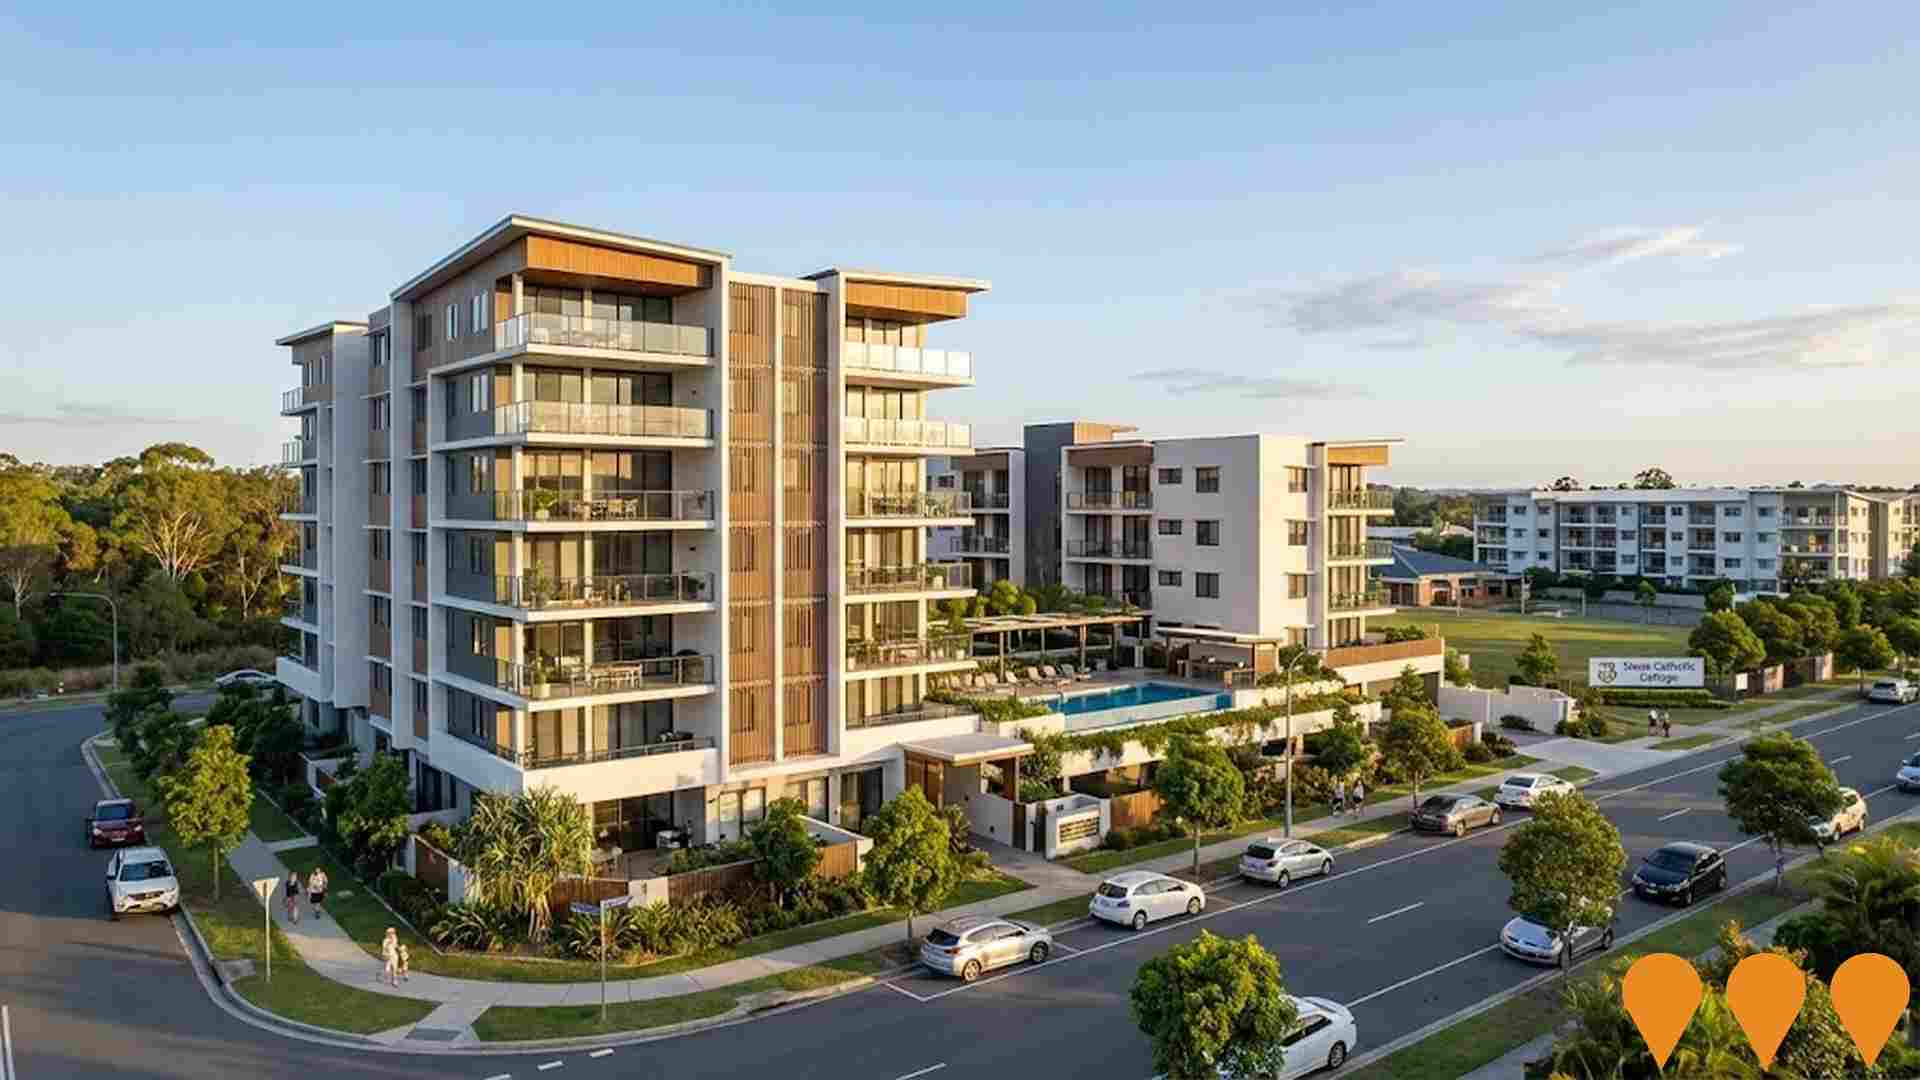
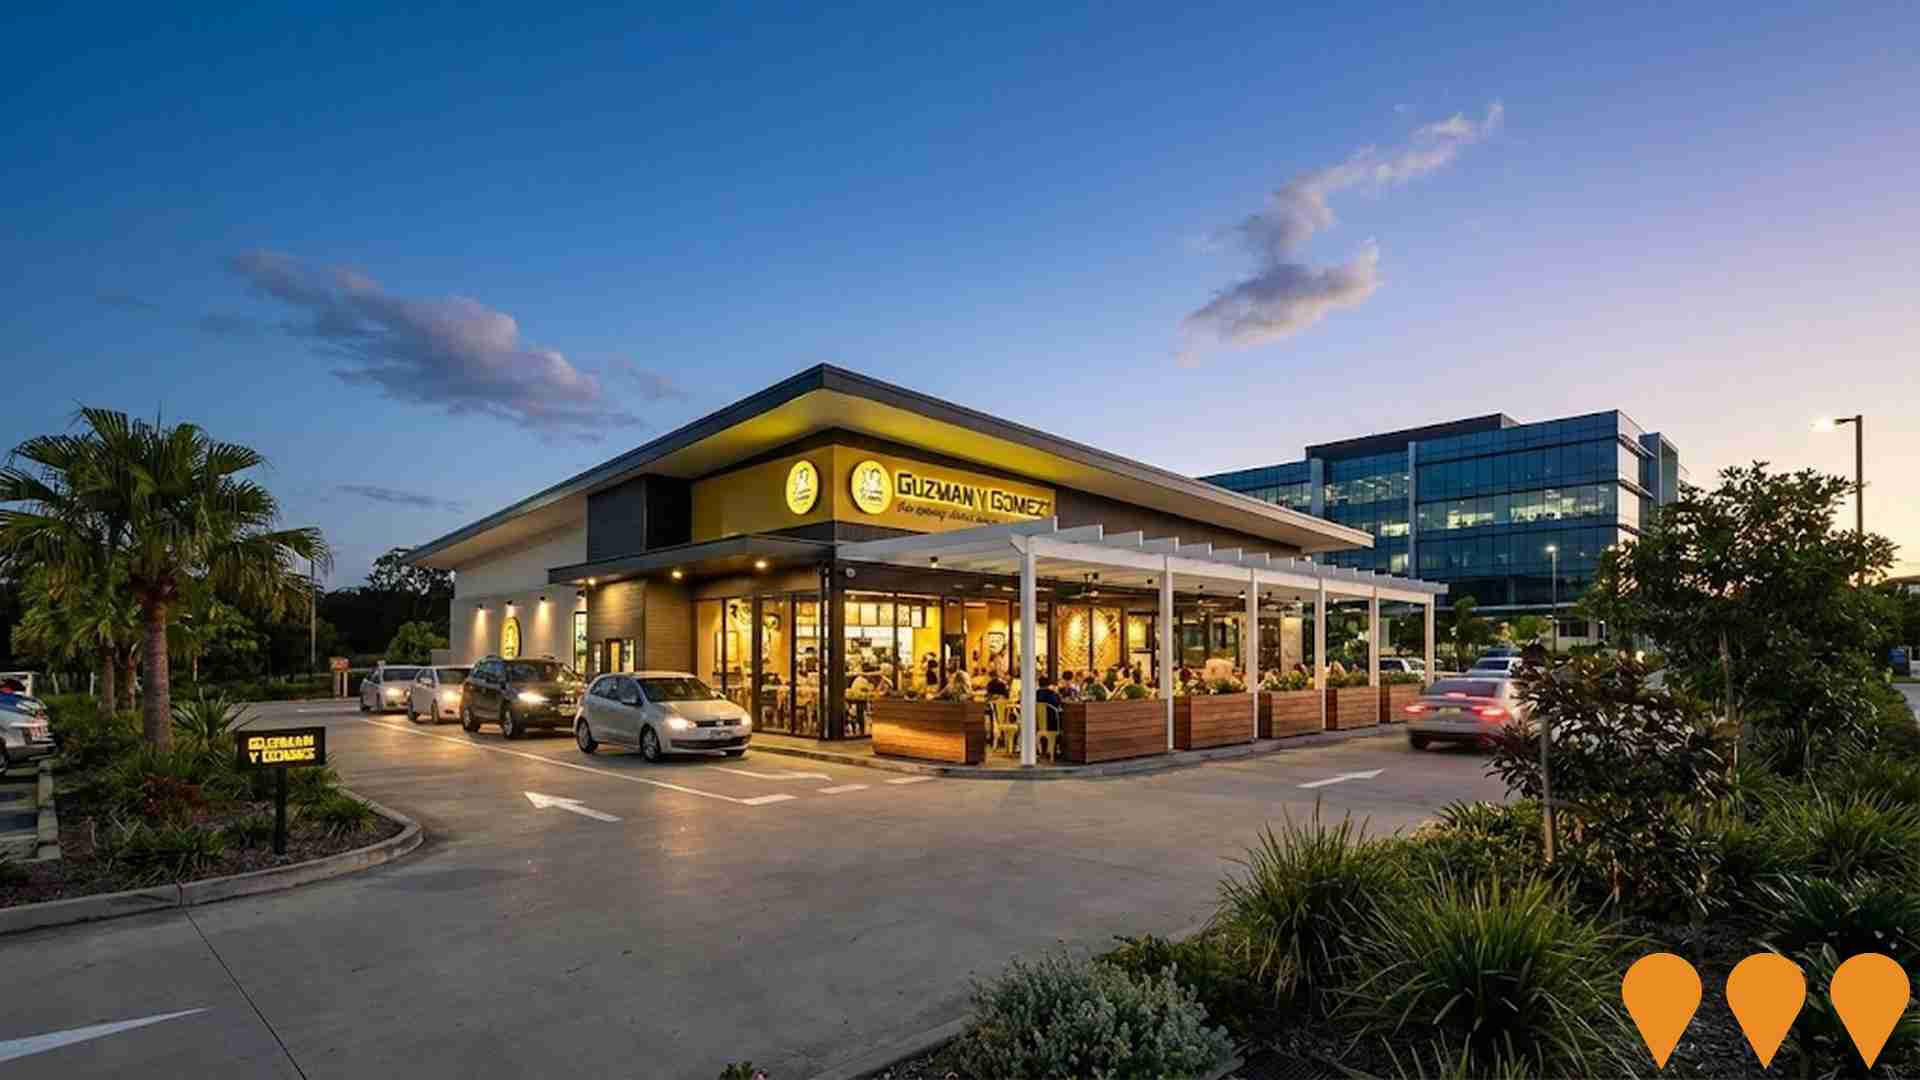
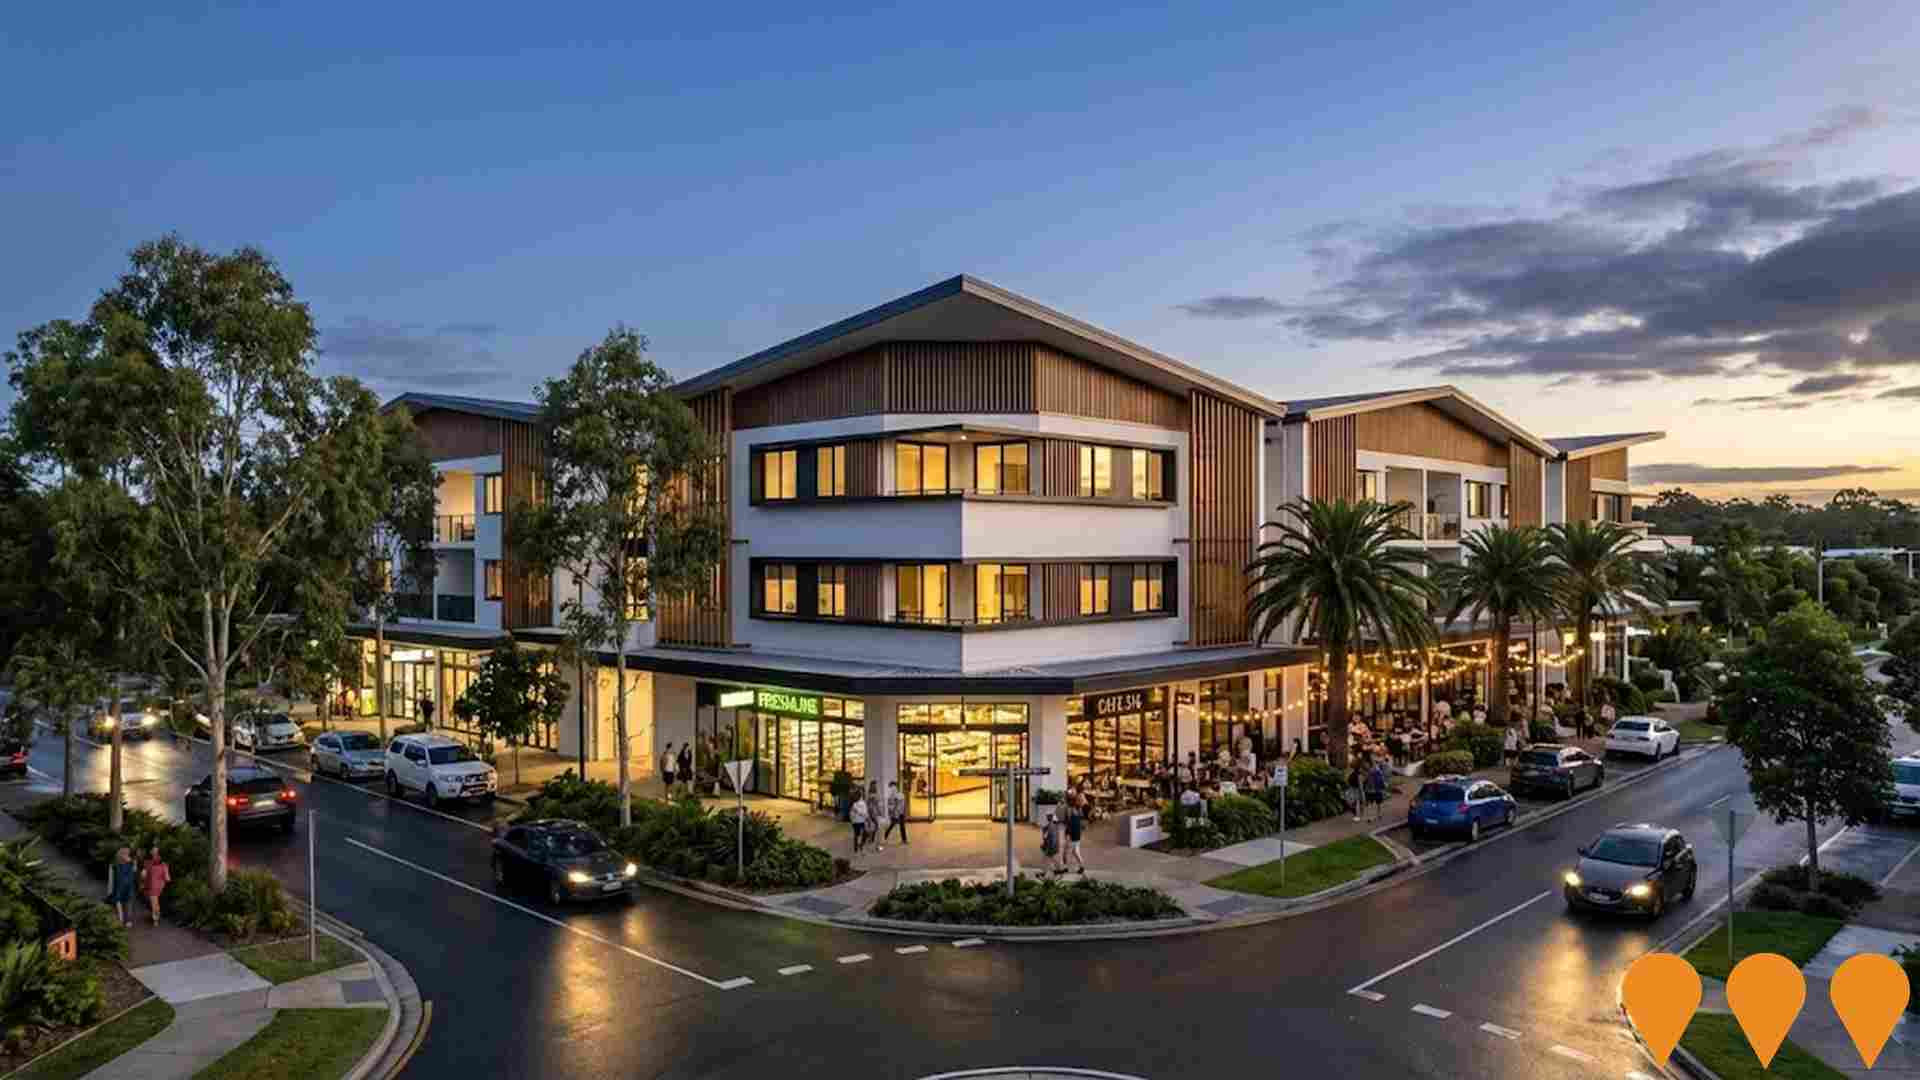
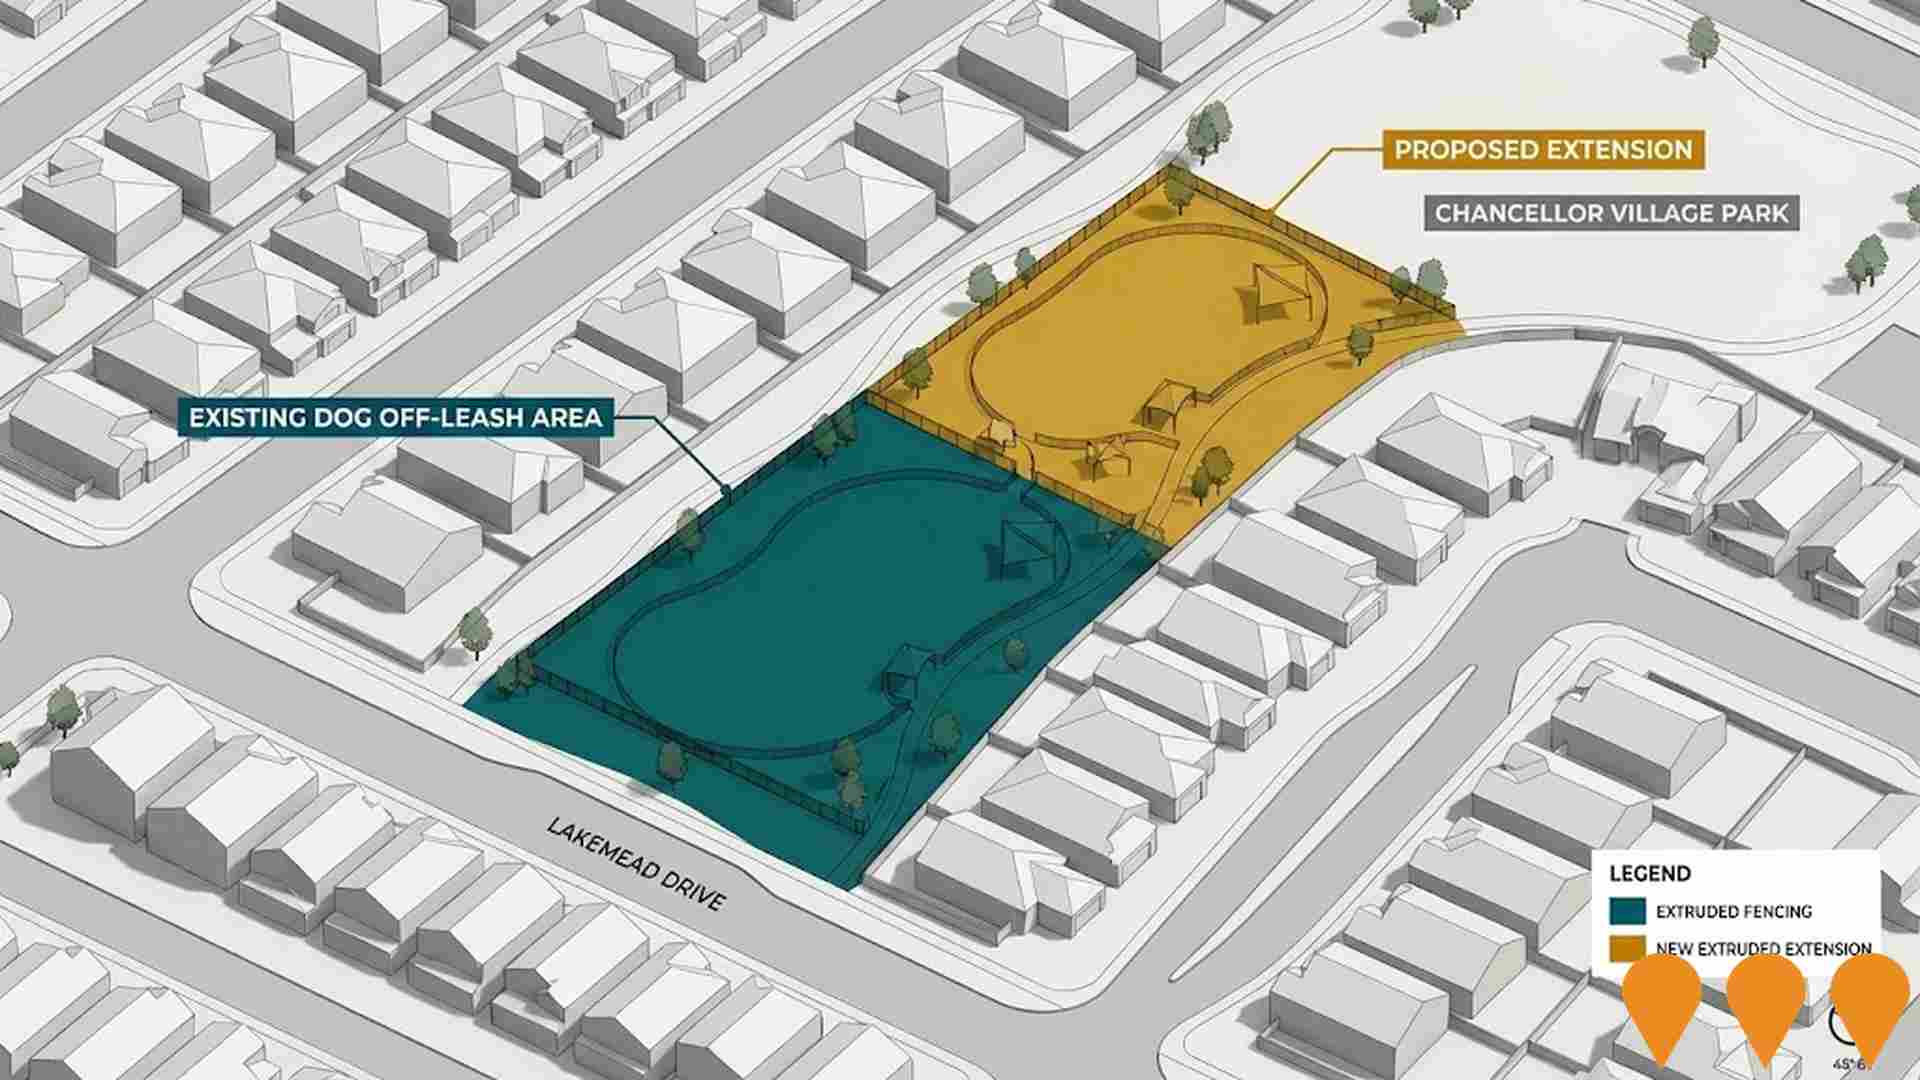
Changes to local infrastructure significantly impact an area's performance. AreaSearch identified 22 projects likely affecting the region. Notable ones include: 45 Sippy Downs Drive High Density Development, Sippy Downs - Palmview Local Plan Area, Sippy Downs (West) Queensland Fire Department Station, and Sippy Downs Social Housing Project. The following list details those most relevant.
Professional plan users can use the search below to filter and access additional projects.
INFRASTRUCTURE SEARCH
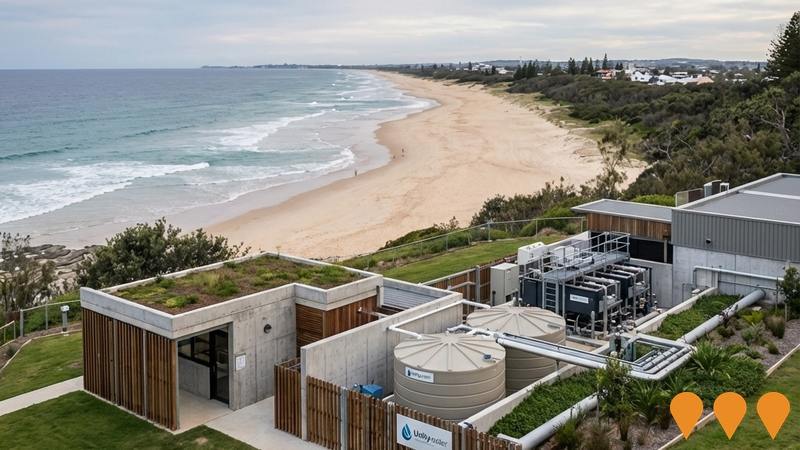
 Denotes AI-based impression for illustrative purposes only, not to be taken as definitive under any circumstances. Please follow links and conduct other investigations from the project's source for actual imagery. Developers and project owners wishing us to use original imagery please Contact Us and we will do so.
Frequently Asked Questions - Infrastructure
UnityWater Infrastructure Program 2023-2027
The major water and wastewater infrastructure investment program, valued at $1.8 billion over 2023-2027, covers the Sunshine Coast and Moreton Bay regions. It includes key components like the Aura and Harmony Program, focusing on treatment plants, pipeline upgrades, and water security to meet the needs of the growing population.
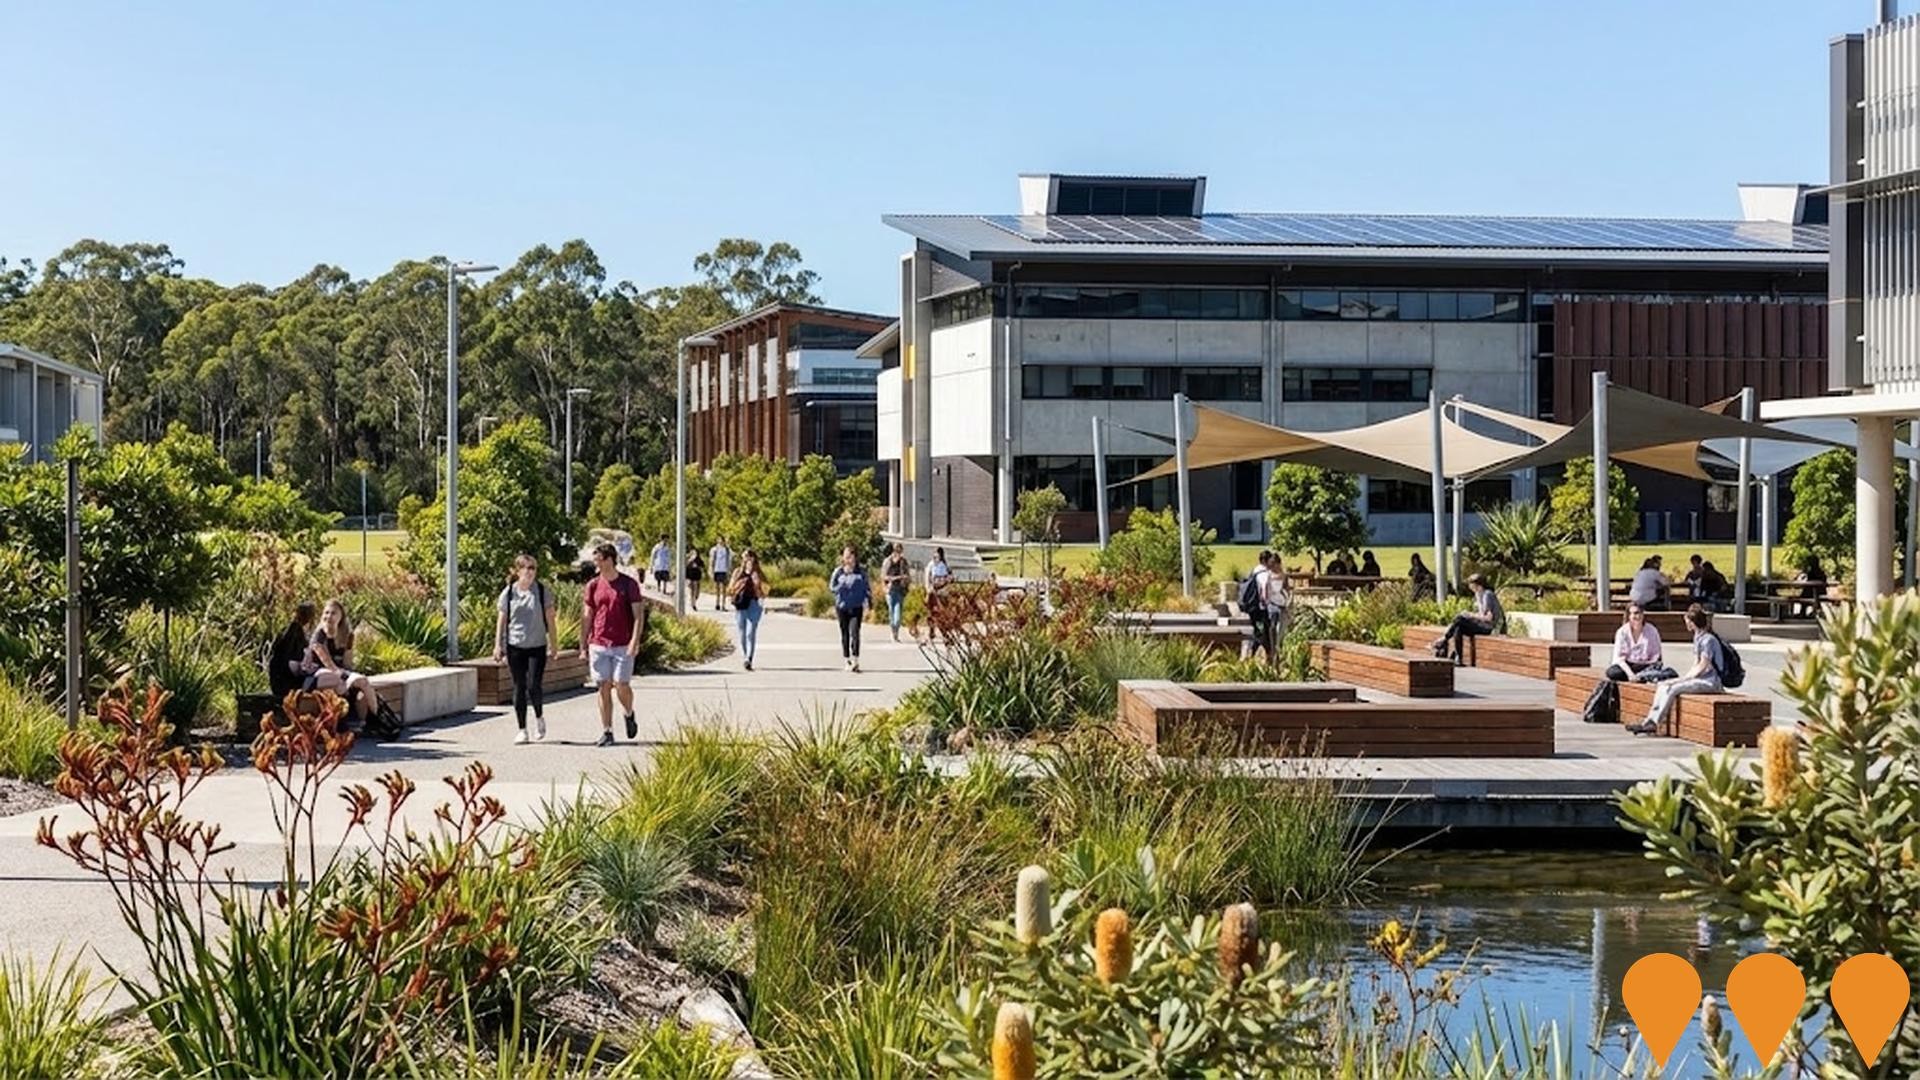
UniSC Sunshine Coast Campus Master Plan Development
The University of the Sunshine Coast (UniSC) is evolving its Sippy Downs campus with a **2023 Campus Master Plan**. This plan provides a strategic framework for future campus development and landscape amenity, focusing on a post-COVID environment. It is an evolution of the 2012 plan and guides future functionality through a **people, movement, and place design lens**, with an emphasis on **sustainability**, **Indigenous culture and knowledge (Design with Country)**, and **enhanced student experience**. The plan includes an extension of the main building axis, development on the northern boundary adjacent to Sippy Downs Drive, and the creation of a new campus heart and outdoor learning spaces. The previous major expansion mentioned in the original record seems to be Stage 2 of the UniSC Moreton Bay Campus (Petrie), which was completed in early 2024, but the masterplan is the current planning for Sippy Downs.
Central Sippy Downs Shopping Centre Development
A 3,556sqm mixed-use centre comprising 2 separate buildings over 2 levels located opposite the University of the Sunshine Coast campus. Anchored by Chipmunks Playland & Cafe, the centre includes commercial tenancies, food retailers, medical suites, a pharmacy, and recreational facilities with tenants including Dominos, Banjos, F45, Sushi Ari, Terry White Chemist, and Athletic Republic training centre. Connected to an existing Coles supermarket via shared driveways.

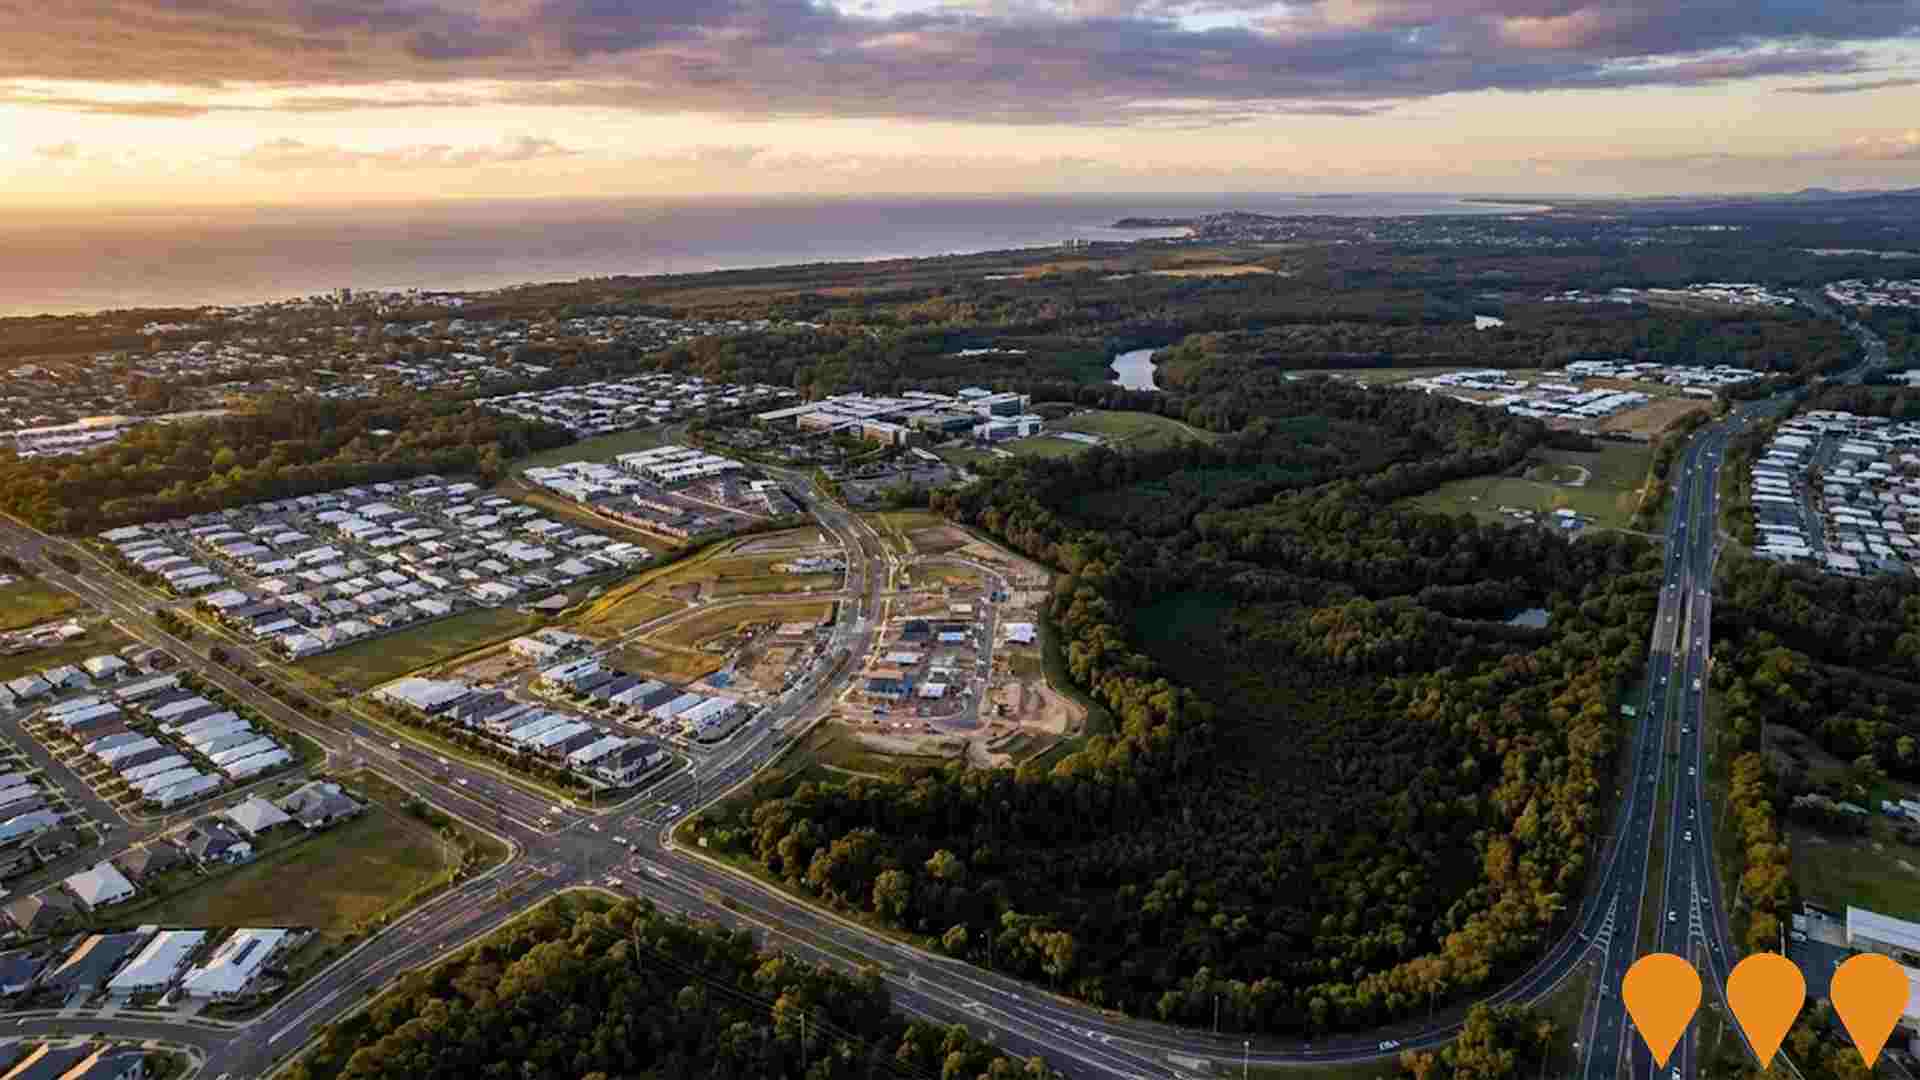
Sippy Downs - Palmview Local Plan Area
Part of the proposed new Sunshine Coast Planning Scheme currently under public consultation (July 15 - September 19, 2025). The Local Plan Area covers the central Sunshine Coast region east of Bruce Highway and south of Sunshine Motorway, encompassing Sippy Downs and Palmview communities, Mooloolah River National Park, conservation areas, and Lower Mooloolah River Greenspace. Focuses on land use planning, building heights, minimum lot sizes, growth opportunities near University of Sunshine Coast and Sippy Downs Town Centre, while managing constraints including flooding, conservation areas, and extractive resources. Will replace current Sunshine Coast Planning Scheme 2014 if adopted.
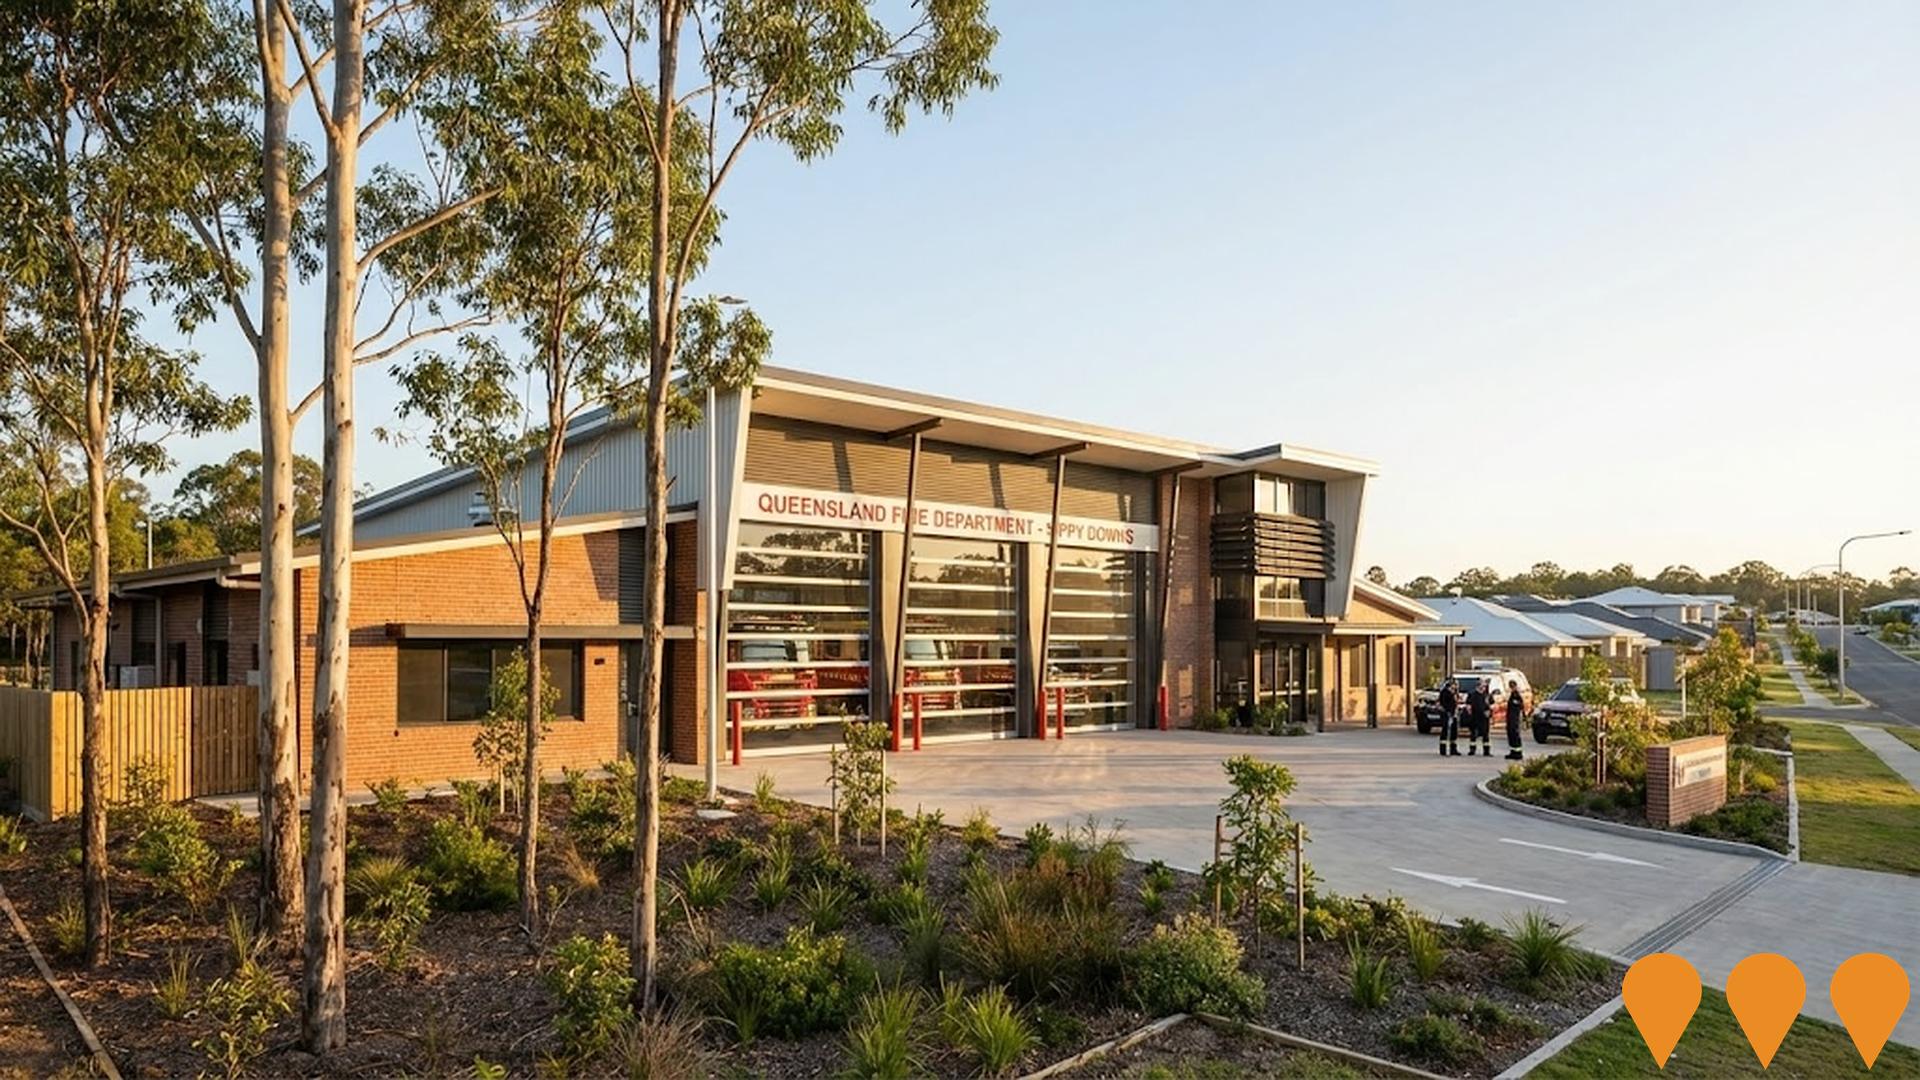
Sippy Downs (West) Queensland Fire Department Station
A new Queensland Fire Department station planned for Sippy Downs West to enhance emergency response capabilities and community safety in the growing Sunshine Coast corridor. Part of the state infrastructure pipeline with estimated value over $10 million.
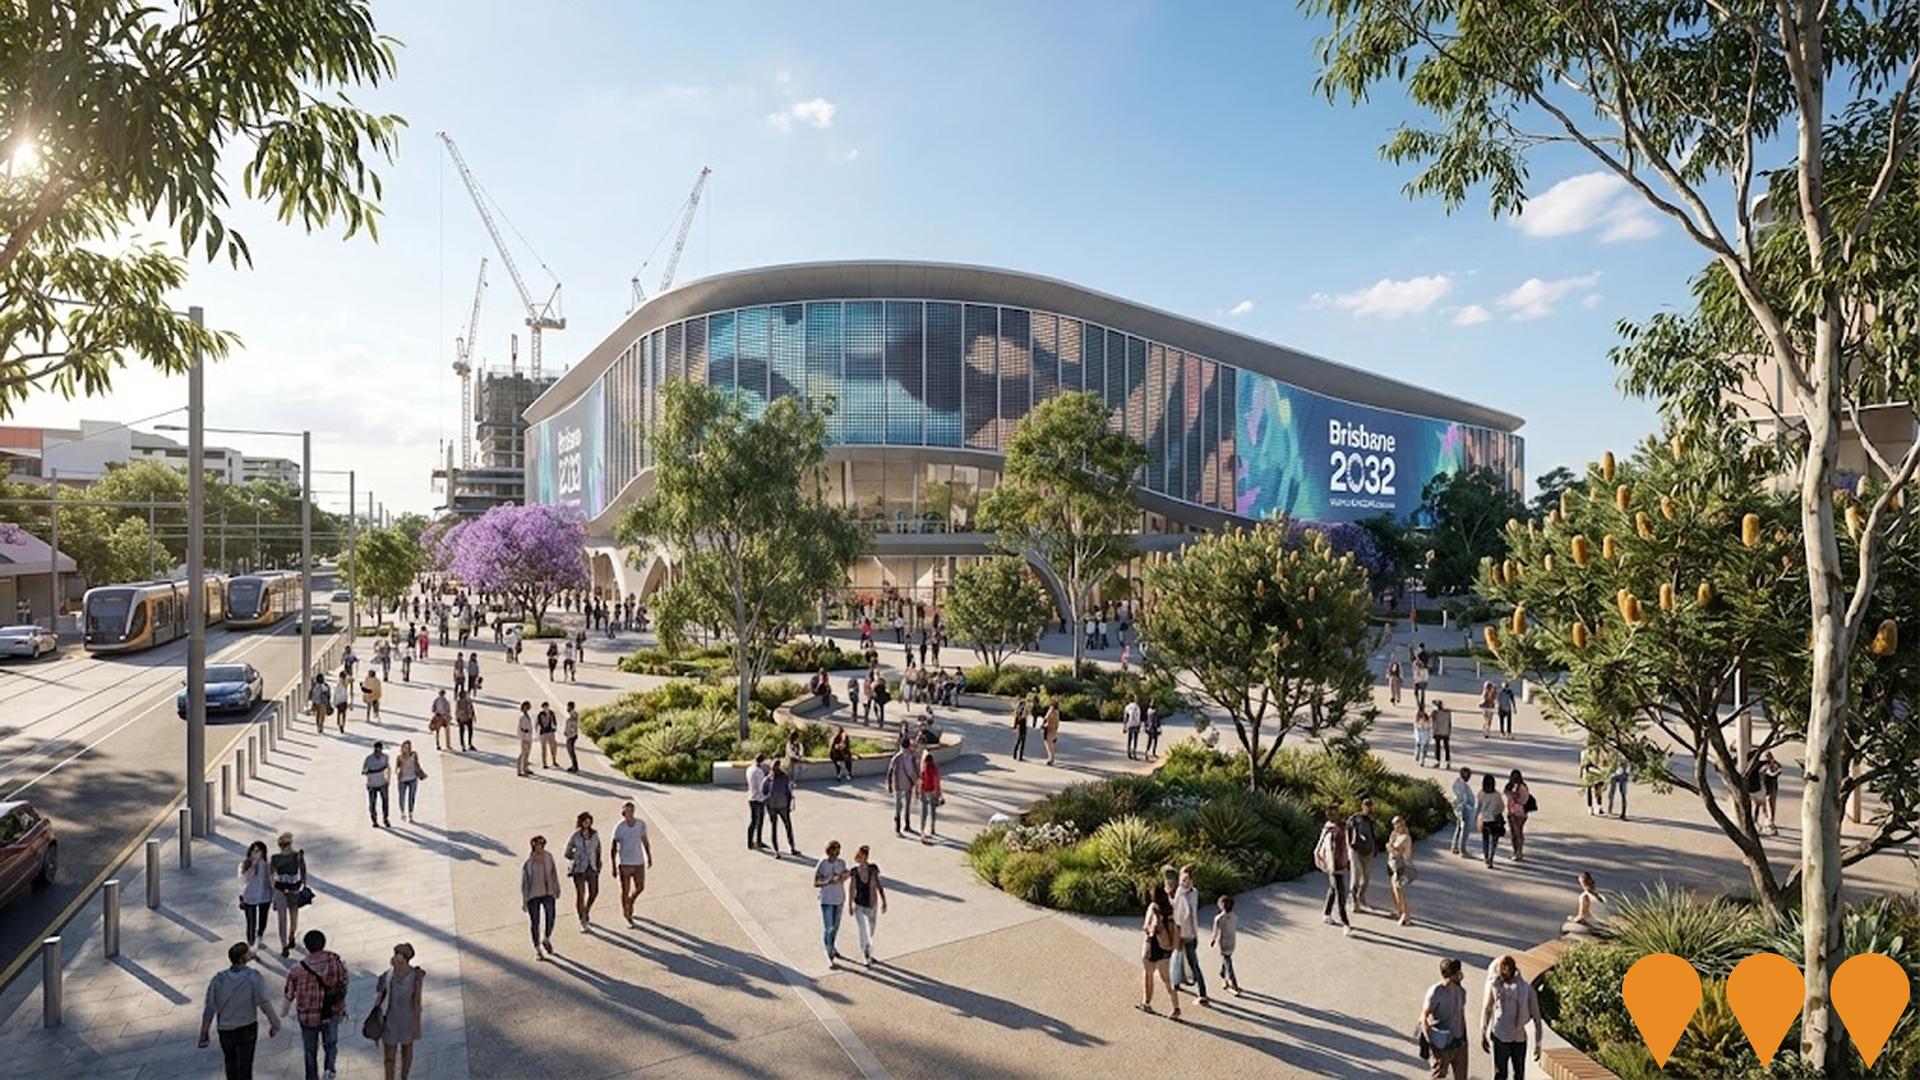
2032 Brisbane Olympic Games Basketball Events Indoor Sports Centre
Proposed indoor sports centre to host basketball events for the 2032 Brisbane Olympic Games. Located adjacent to University of the Sunshine Coast to leverage existing sports and accommodation infrastructure.
Palmview State Schools Complex
New state-of-the-art primary and secondary schools complex in Palmview, designed to serve the growing residential developments in the area. A new state secondary school opened for Term 1, 2023, with features including modern learning facilities, sports grounds, and community spaces.

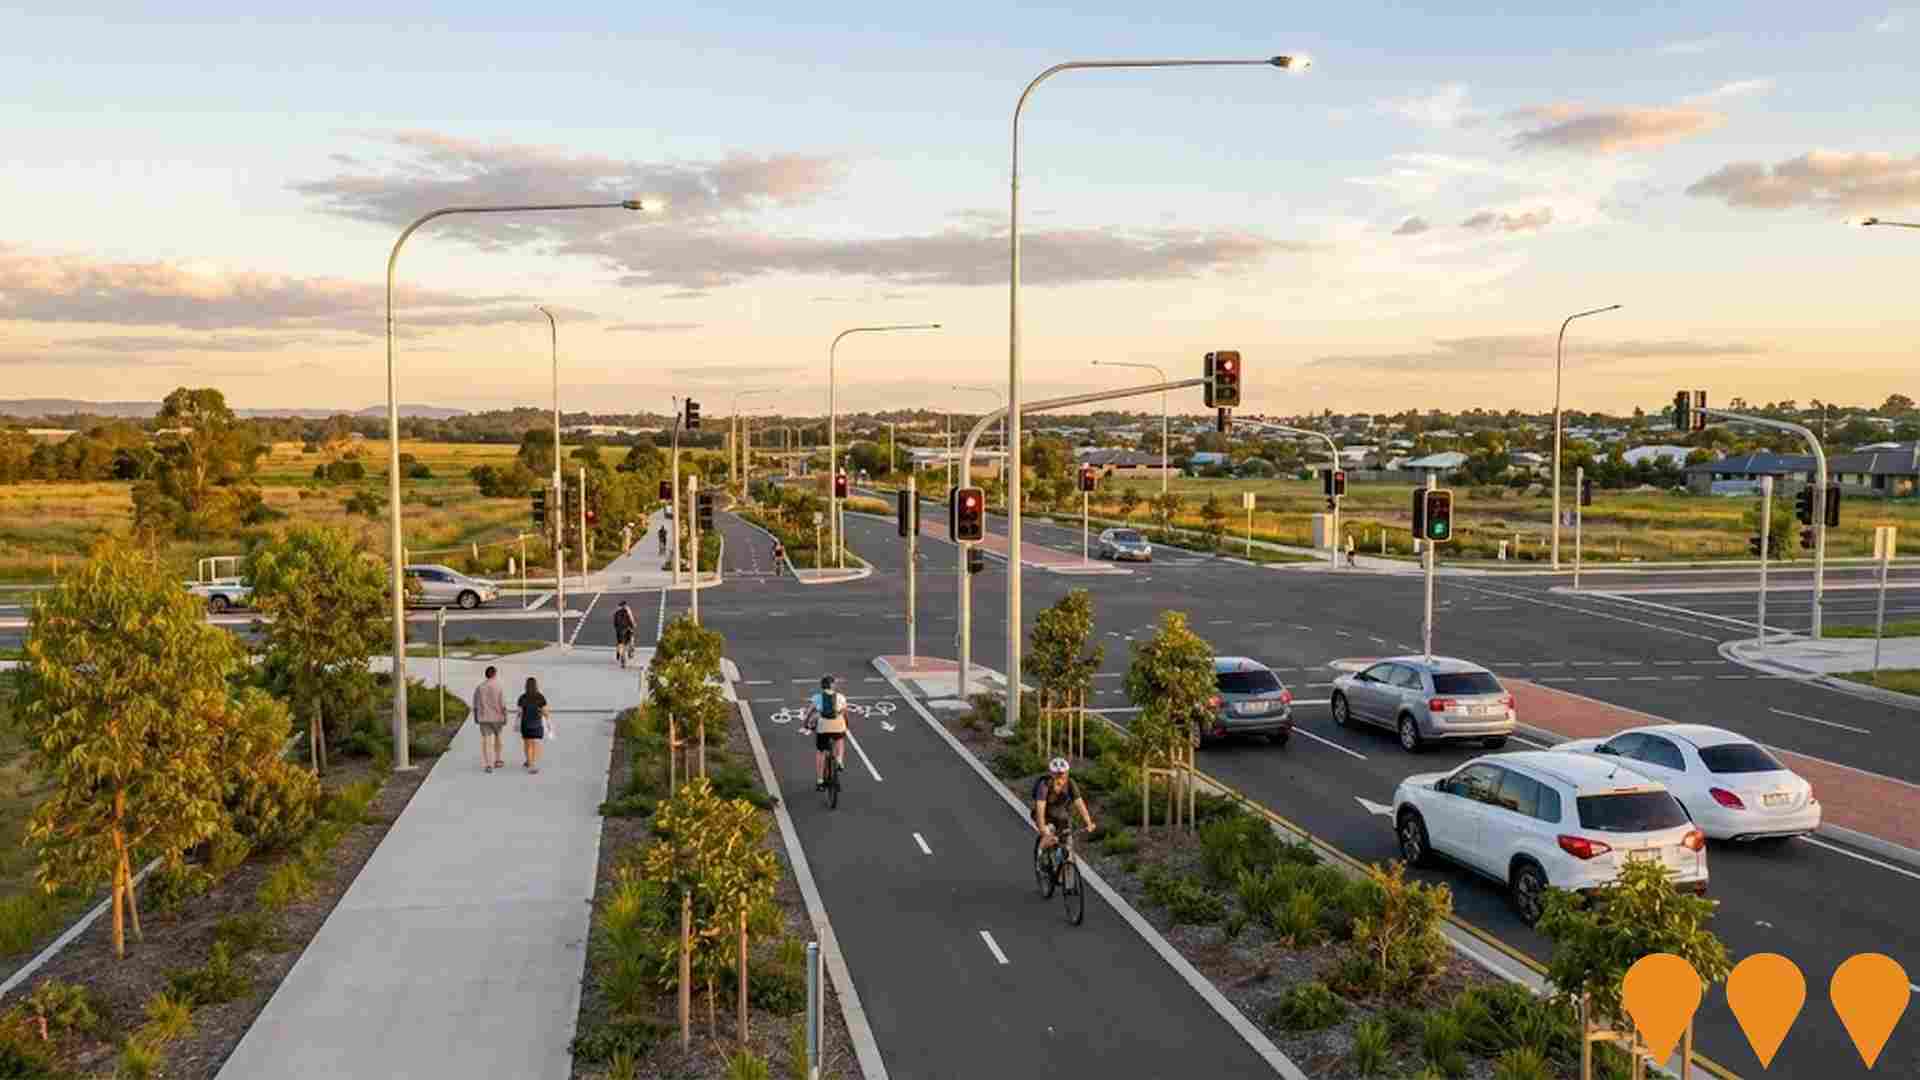
Sippy Downs Drive Upgrade to Four Lanes
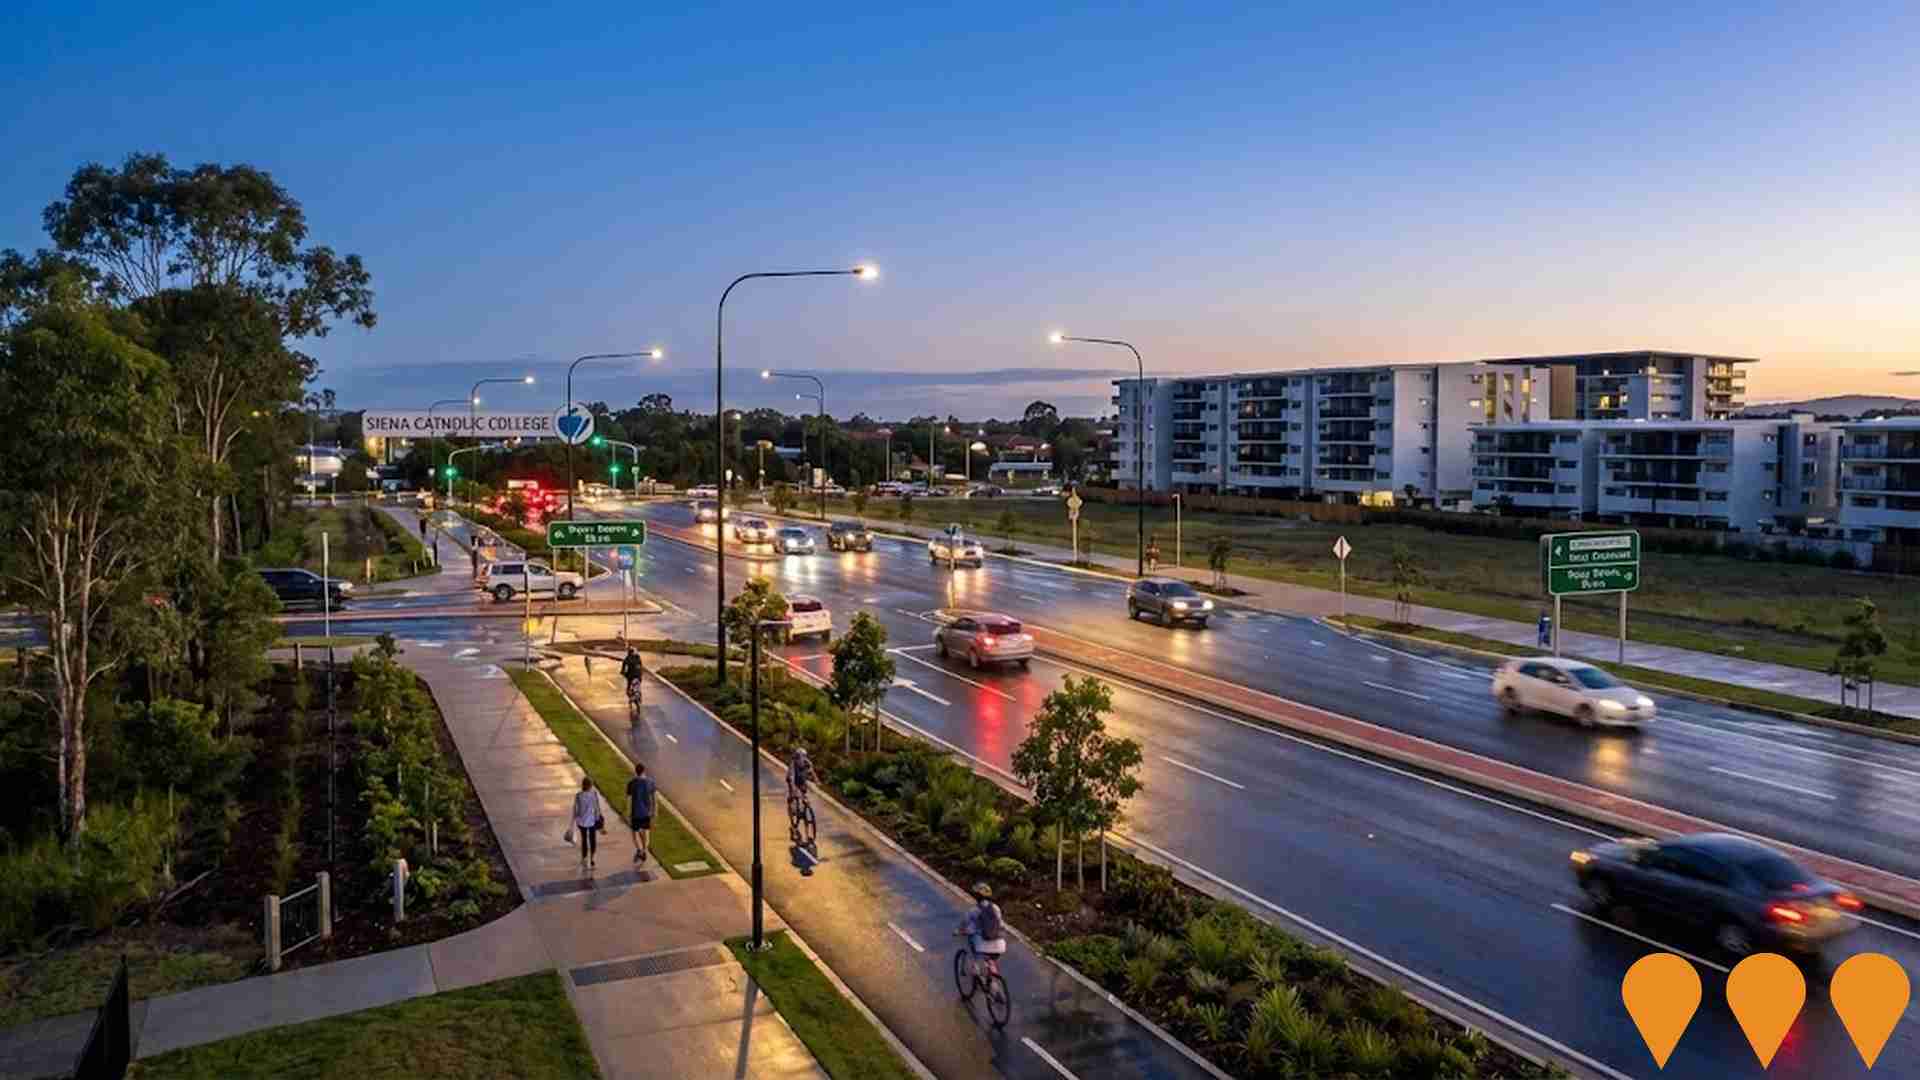
Four-stage upgrade of Sippy Downs Drive completed in December 2019, converting the road from single lanes to four lanes (two each way) between Sunshine Motorway and Siena Catholic College. Project included new traffic signals, cycle lanes, pedestrian facilities, landscaping and underground power installation. Now serves over 9000 daily users with improved traffic flow and safety.
Employment
AreaSearch analysis indicates Sippy Downs maintains employment conditions that align with national benchmarks
Sippy Downs has a skilled workforce with prominent representation in essential services sectors, an unemployment rate of 3.2% as of September 2025. The area's employment rate is 0.9% lower than the Rest of Qld's rate of 4.1%, with a workforce participation rate of 61.9%.
Employment is concentrated in health care & social assistance, retail trade, and accommodation & food sectors. Retail trade has particular specialization with an employment share 1.4 times the regional level, while agriculture, forestry & fishing shows lower representation at 0.9% compared to the regional average of 4.5%. Over the year to September 2025, labour force levels decreased by 2.7%, alongside a 2.1% employment decline, resulting in a 0.6 percentage point drop in unemployment rate. In contrast, Rest of Qld saw employment growth of 1.7% and labour force growth of 2.1%, with a 0.3 percentage point rise in unemployment rate.
As of 25-Nov-25, QLD employment contracted by 0.01%, losing 1,210 jobs, with the state unemployment rate at 4.2%. National employment forecasts from May-25 suggest an expansion of 6.6% over five years and 13.7% over ten years. Applying these projections to Sippy Downs's employment mix indicates potential local employment growth of 6.7% over five years and 13.8% over ten years, based on a simple weighting extrapolation for illustrative purposes.
Frequently Asked Questions - Employment
Income
Income levels sit below national averages according to AreaSearch assessment
AreaSearch's latest postcode level ATO data for financial year 2022 shows median income in Sippy Downs SA2 is $49,567 and average income is $69,648. Nationally, median income is $50,780 and average income is $64,844. By September 2025, estimated incomes are approximately $56,501 (median) and $79,392 (average), based on Wage Price Index growth of 13.99% since financial year 2022. Census 2021 income data shows Sippy Downs ranks between the 22nd and 34th percentiles for household, family, and personal incomes. Income brackets indicate 33.6% earn $1,500 - 2,999 (4,225 individuals), similar to metropolitan regions at 31.7%. Housing affordability pressures are severe with only 76.5% of income remaining, ranking at the 24th percentile. Sippy Downs' SEIFA income ranking places it in the 4th decile.
Frequently Asked Questions - Income
Housing
Sippy Downs displays a diverse mix of dwelling types, with a higher proportion of rental properties than the broader region
Dwelling structure in Sippy Downs, as per the latest Census, consisted of 64.3% houses and 35.7% other dwellings (semi-detached, apartments, 'other' dwellings). This compares to Non-Metro Qld's 74.1% houses and 25.9% other dwellings. Home ownership in Sippy Downs was at 22.3%, with the rest being mortgaged (38.5%) or rented (39.2%). The median monthly mortgage repayment was $1,889, lower than Non-Metro Qld's average of $2,000. The median weekly rent figure was $460, compared to Non-Metro Qld's $465. Nationally, Sippy Downs's mortgage repayments were higher at $1,889 against the Australian average of $1,863, while rents were substantially above the national figure of $375.
Frequently Asked Questions - Housing
Household Composition
Sippy Downs features high concentrations of group households, with a fairly typical median household size
Family households constitute 70.7% of all households, including 29.7% couples with children, 26.9% couples without children, and 12.9% single parent families. Non-family households comprise the remaining 29.3%, with lone person households at 23.0% and group households making up 6.4% of the total. The median household size is 2.6 people, which aligns with the average for the Rest of Qld.
Frequently Asked Questions - Households
Local Schools & Education
The educational profile of Sippy Downs exceeds national averages, with above-average qualification levels and academic performance metrics
Educational qualifications in Sippy Downs trail regional benchmarks, with 22.7% of residents aged 15+ holding university degrees compared to the national average of 30.4%. Bachelor degrees are most common at 16.3%, followed by postgraduate qualifications (4.5%) and graduate diplomas (1.9%). Trade and technical skills are prominent, with 39.1% of residents aged 15+ holding vocational credentials – advanced diplomas (11.4%) and certificates (27.7%). Educational participation is high, with 38.2% of residents currently enrolled in formal education.
This includes 13.8% in tertiary education, 9.9% in primary education, and 8.7% pursuing secondary education.
Frequently Asked Questions - Education
Schools Detail
Nearby Services & Amenities
Transport
Transport servicing is low compared to other areas nationally based on assessment of service frequency, route connectivity and accessibility
The analysis of public transportation in Sippy Downs shows that there are currently 36 active transport stops operating within the area. These stops serve a mix of bus routes, with a total of 6 individual routes providing service to these locations. The combined weekly passenger trips facilitated by these routes amount to 956.
The accessibility of public transportation in Sippy Downs is rated as good, with residents typically residing approximately 228 meters from the nearest transport stop. On average, across all routes, there are 136 trips per day, which equates to roughly 26 weekly trips per individual stop.
Frequently Asked Questions - Transport
Transport Stops Detail
Health
Health performance in Sippy Downs is lower than average with common health conditions somewhat prevalent across the board, though to a considerably higher degree among older age cohorts
Sippy Downs faces significant health challenges with common health conditions being somewhat prevalent across all age groups but to a considerably higher degree among older age cohorts.
The rate of private health cover is very high at approximately 54% of the total population (~6841 people). The most common medical conditions in the area are mental health issues and arthritis, impacting 9.2 and 8.7% of residents respectively, while 68.2% declare themselves as completely clear of medical ailments compared to 69.0% across Rest of Qld. As of 2016, 15.3% of Sippy Downs' residents are aged 65 and over (1921 people), which is lower than the 20.2% in Rest of Qld. Health outcomes among seniors present some challenges requiring more attention than the broader population.
Frequently Asked Questions - Health
Cultural Diversity
The level of cultural diversity witnessed in Sippy Downs was found to be slightly above average when compared nationally for a number of language and cultural background related metrics
Sippy Downs had a higher than average cultural diversity, with 11.4% of its population speaking languages other than English at home and 26.4% born overseas. Christianity was the predominant religion in Sippy Downs, comprising 45.1% of its population. Notably, Judaism was overrepresented compared to the rest of Queensland, making up 0.2% of Sippy Downs' population.
In terms of ancestry, the top three groups were English (30.9%), Australian (26.2%), and Scottish (8.2%). Some ethnic groups showed notable differences in representation: New Zealanders were overrepresented at 1.1%, South Africans at 0.9%, and Koreans at 0.6%.
Frequently Asked Questions - Diversity
Age
Sippy Downs's young demographic places it in the bottom 15% of areas nationwide
Sippy Downs has a median age of 32 years, which is significantly lower than the Rest of Qld average of 41 years and substantially under the Australian median of 38 years. Compared to Rest of Qld, Sippy Downs has a higher percentage of residents aged 15-24 (21.7%) but fewer residents aged 55-64 (7.1%). This concentration of 15-24 year-olds is well above the national average of 12.5%. Between the 2021 Census and now, the percentage of residents aged 25 to 34 has increased from 13.6% to 17.1%, while the percentage of residents aged 5 to 14 has decreased from 13.0% to 11.1%. Additionally, the percentage of residents aged 65 to 74 has dropped from 7.0% to 5.9%. Demographic modeling suggests that Sippy Downs' age profile will change significantly by 2041. The 25 to 34 age group is projected to grow by 52%, adding 1,114 residents to reach a total of 3,266. In contrast, both the 15 to 24 and 5 to 14 age groups are expected to have reduced numbers.
