Chart Color Schemes
This analysis uses ABS Statistical Areas Level 2 (SA2) boundaries, which can materially differ from Suburbs and Localities (SAL) even when sharing similar names.
SA2 boundaries are defined by the Australian Bureau of Statistics and are designed to represent communities for statistical reporting (e.g., census and ERP).
Suburbs and Localities (SAL) represent commonly-used suburb/locality names (postal-style areas) and may use different geographic boundaries. For comprehensive analysis, consider reviewing both boundary types if available.
est. as @ -- *
ABS ERP | -- people | --
2021 Census | -- people
Sales Activity
Curious about local property values? Filter the chart to assess the volume and appreciation (including resales) trends and regional comparisons, or scroll to the map below view this information at an individual property level.
Find a Recent Sale
Sales Detail
Population
Bundaberg North - Gooburrum is positioned among the lower quartile of areas assessed nationally for population growth based on AreaSearch's assessment of recent, and medium term trends
Bundaberg North - Gooburrum's population is 7,905 as of Nov 2025. This figure reflects an increase of 457 people since the 2021 Census, which reported a population of 7,448. The change is inferred from ABS data showing an estimated resident population of 7,909 in June 2024 and an additional 52 validated new addresses since the Census date. This results in a density ratio of 146 persons per square kilometer. Bundaberg North - Gooburrum's growth rate of 6.1% since the census is within 2.5 percentage points of the SA3 area's 8.6%, indicating competitive growth fundamentals. Interstate migration contributed approximately 63.6% of overall population gains during recent periods.
AreaSearch uses ABS/Geoscience Australia projections for each SA2 area, released in 2024 with a base year of 2022. For areas not covered by this data and years post-2032, Queensland State Government's SA2 area projections are adopted, released in 2023 based on 2021 data. These state projections do not provide age category splits, so AreaSearch applies proportional growth weightings using ABS Greater Capital Region projections for each age cohort, released in 2023 with a base year of 2022. Future population dynamics anticipate an increase just below the median for locations outside capital cities, with Bundaberg North - Gooburrum expected to increase by 563 persons to 2041 based on latest annual ERP population numbers, reflecting a total increase of 7.2% over the 17 years.
Frequently Asked Questions - Population
Development
Residential development activity is slightly higher than average within Bundaberg North - Gooburrum when compared nationally
Bundaberg North - Gooburrum has seen approximately 22 dwellings granted development approval annually. Over the past five financial years, from FY-21 to FY-25113 homes were approved, with an additional 2 approved so far in FY-26. Each year, around 5 new residents have arrived per dwelling constructed during these five years.
This demand significantly outpaces supply, typically leading to price growth and heightened buyer competition. New properties are being constructed at an average expected cost of $392,000. Commercial approvals this financial year total $2.3 million, indicating a predominantly residential focus. Compared to the rest of Queensland, Bundaberg North - Gooburrum exhibits substantially reduced construction activity, with 53.0% fewer approvals per person than the regional average. This limited new supply generally supports stronger demand and values for established properties.
Nationally, this area's activity also falls below average, suggesting its established nature and potential planning limitations. Current building activity consists solely of detached houses, preserving the area's traditional low-density character favoured by families seeking space. Notably, developers are constructing more detached housing than the existing pattern implies (77.0% at Census), reflecting persistent strong demand for family homes despite densification trends. The estimated population per dwelling approval is 492 people, indicating a quiet, low-activity development environment. According to AreaSearch's latest quarterly estimate, Bundaberg North - Gooburrum is projected to gain 567 residents by 2041. With current construction levels, housing supply should adequately meet demand, creating favourable conditions for buyers while potentially enabling growth that exceeds current forecasts.
Frequently Asked Questions - Development
Infrastructure
Bundaberg North - Gooburrum has moderate levels of nearby infrastructure activity, ranking in the top 50% nationally
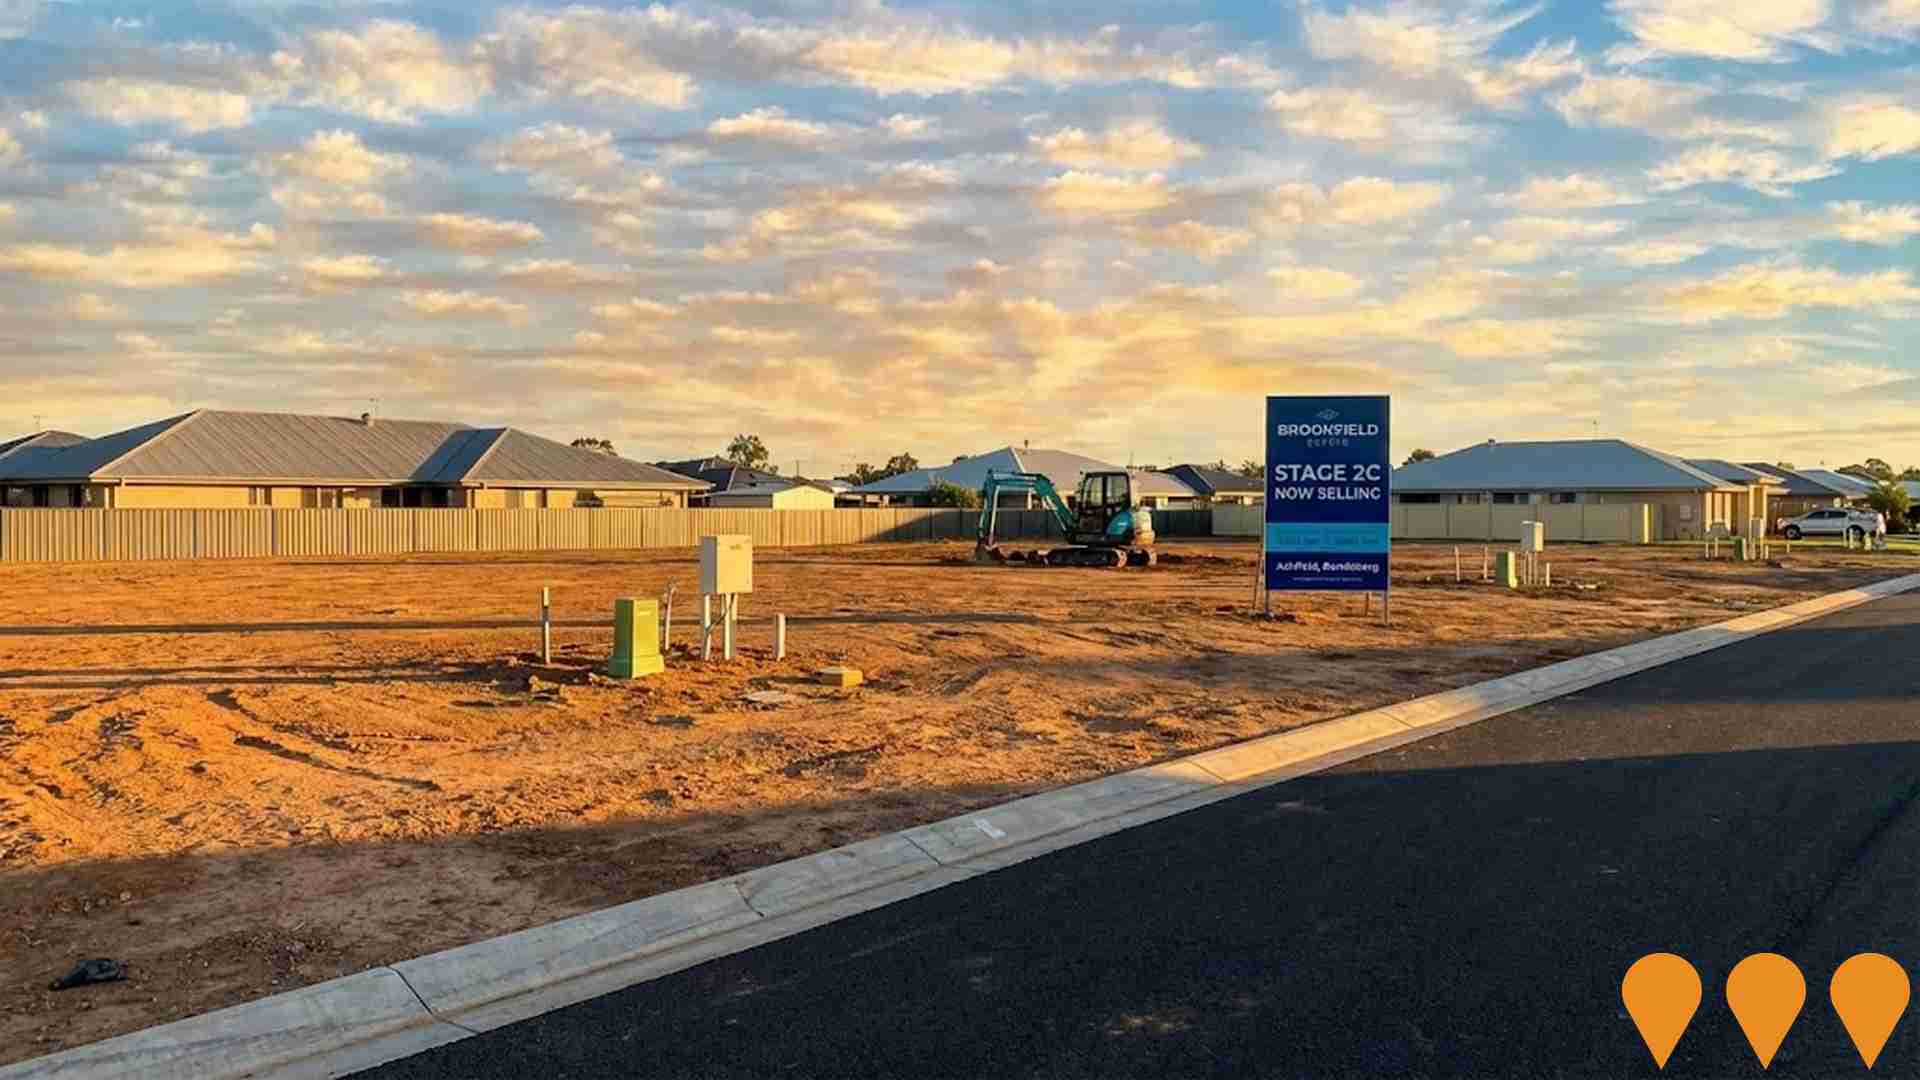
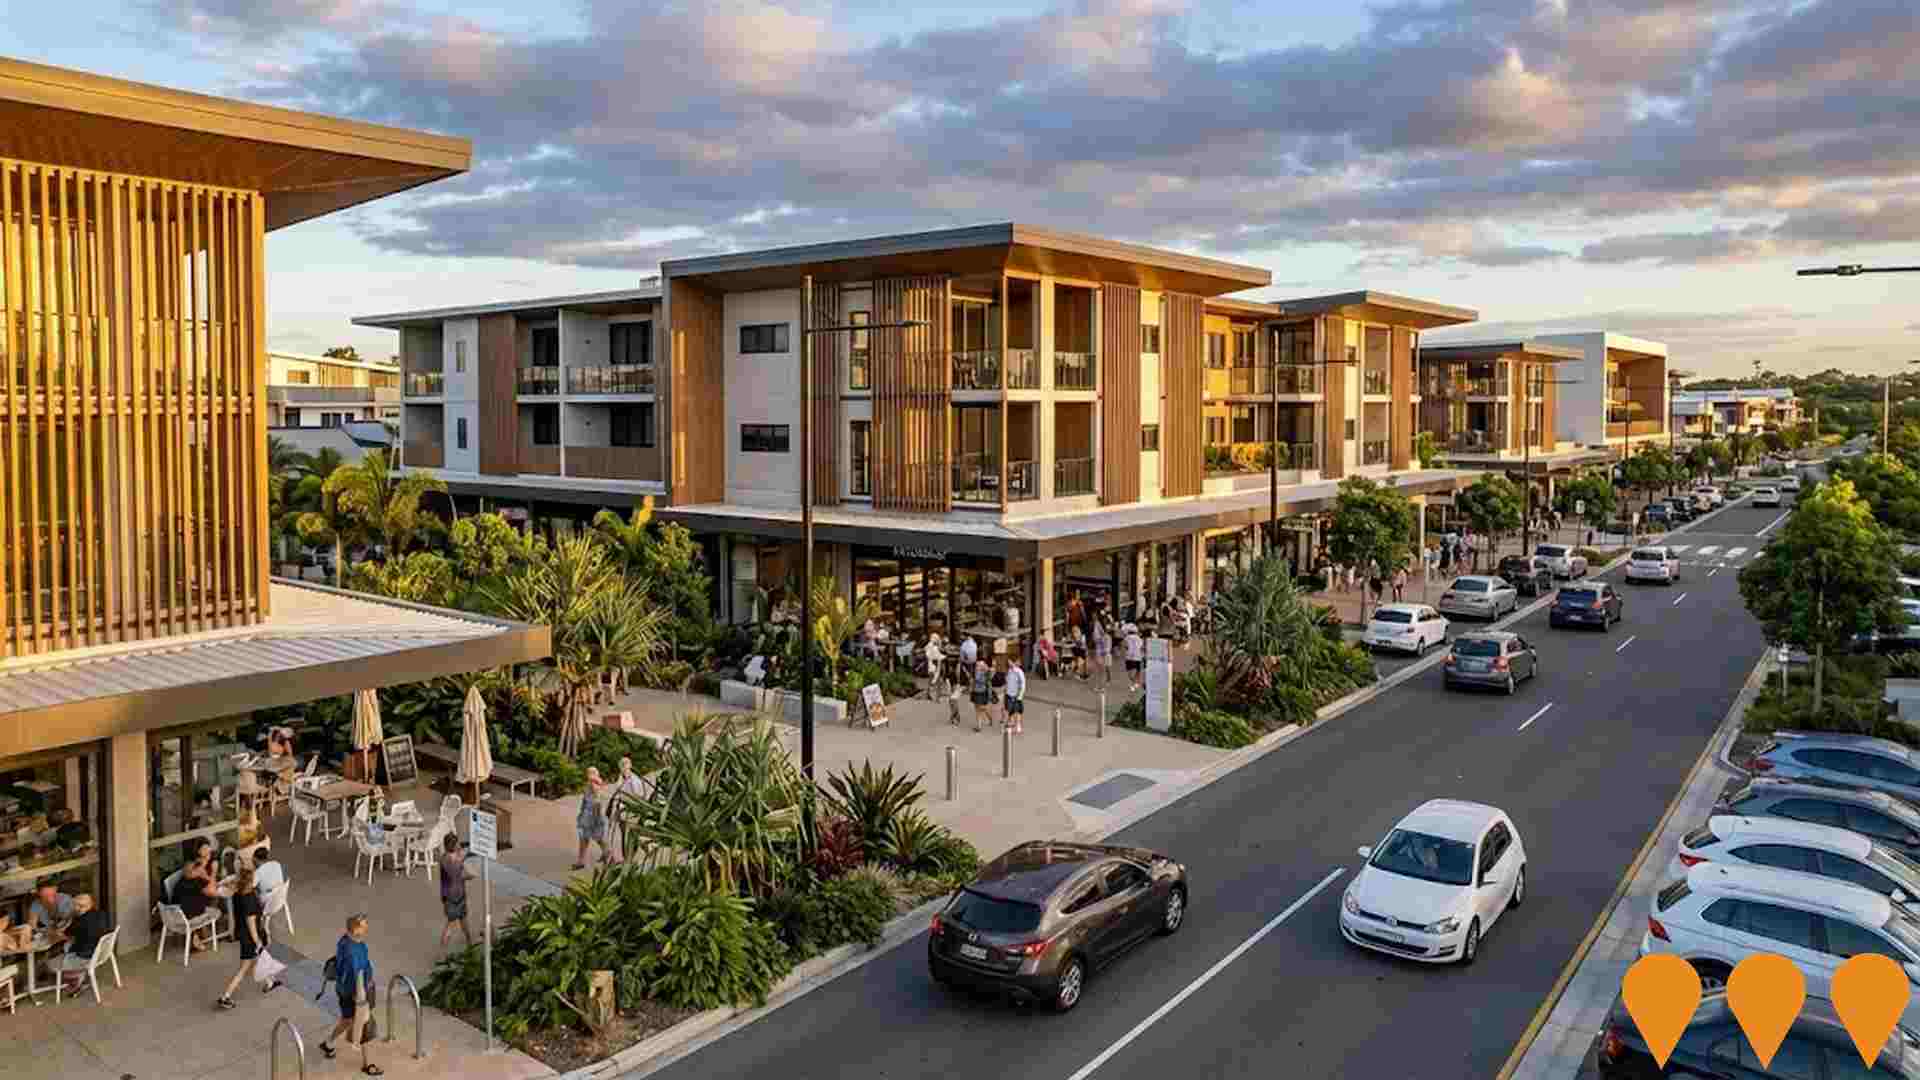
Changes to local infrastructure significantly influence an area's performance. AreaSearch has identified 21 projects likely impacting the area. Notable ones are Belle Eden Estate Extensions, Bundaberg Solar Farm, Brookfield Estate, and Edenbrook Estate. The following details those most relevant.
Professional plan users can use the search below to filter and access additional projects.
INFRASTRUCTURE SEARCH
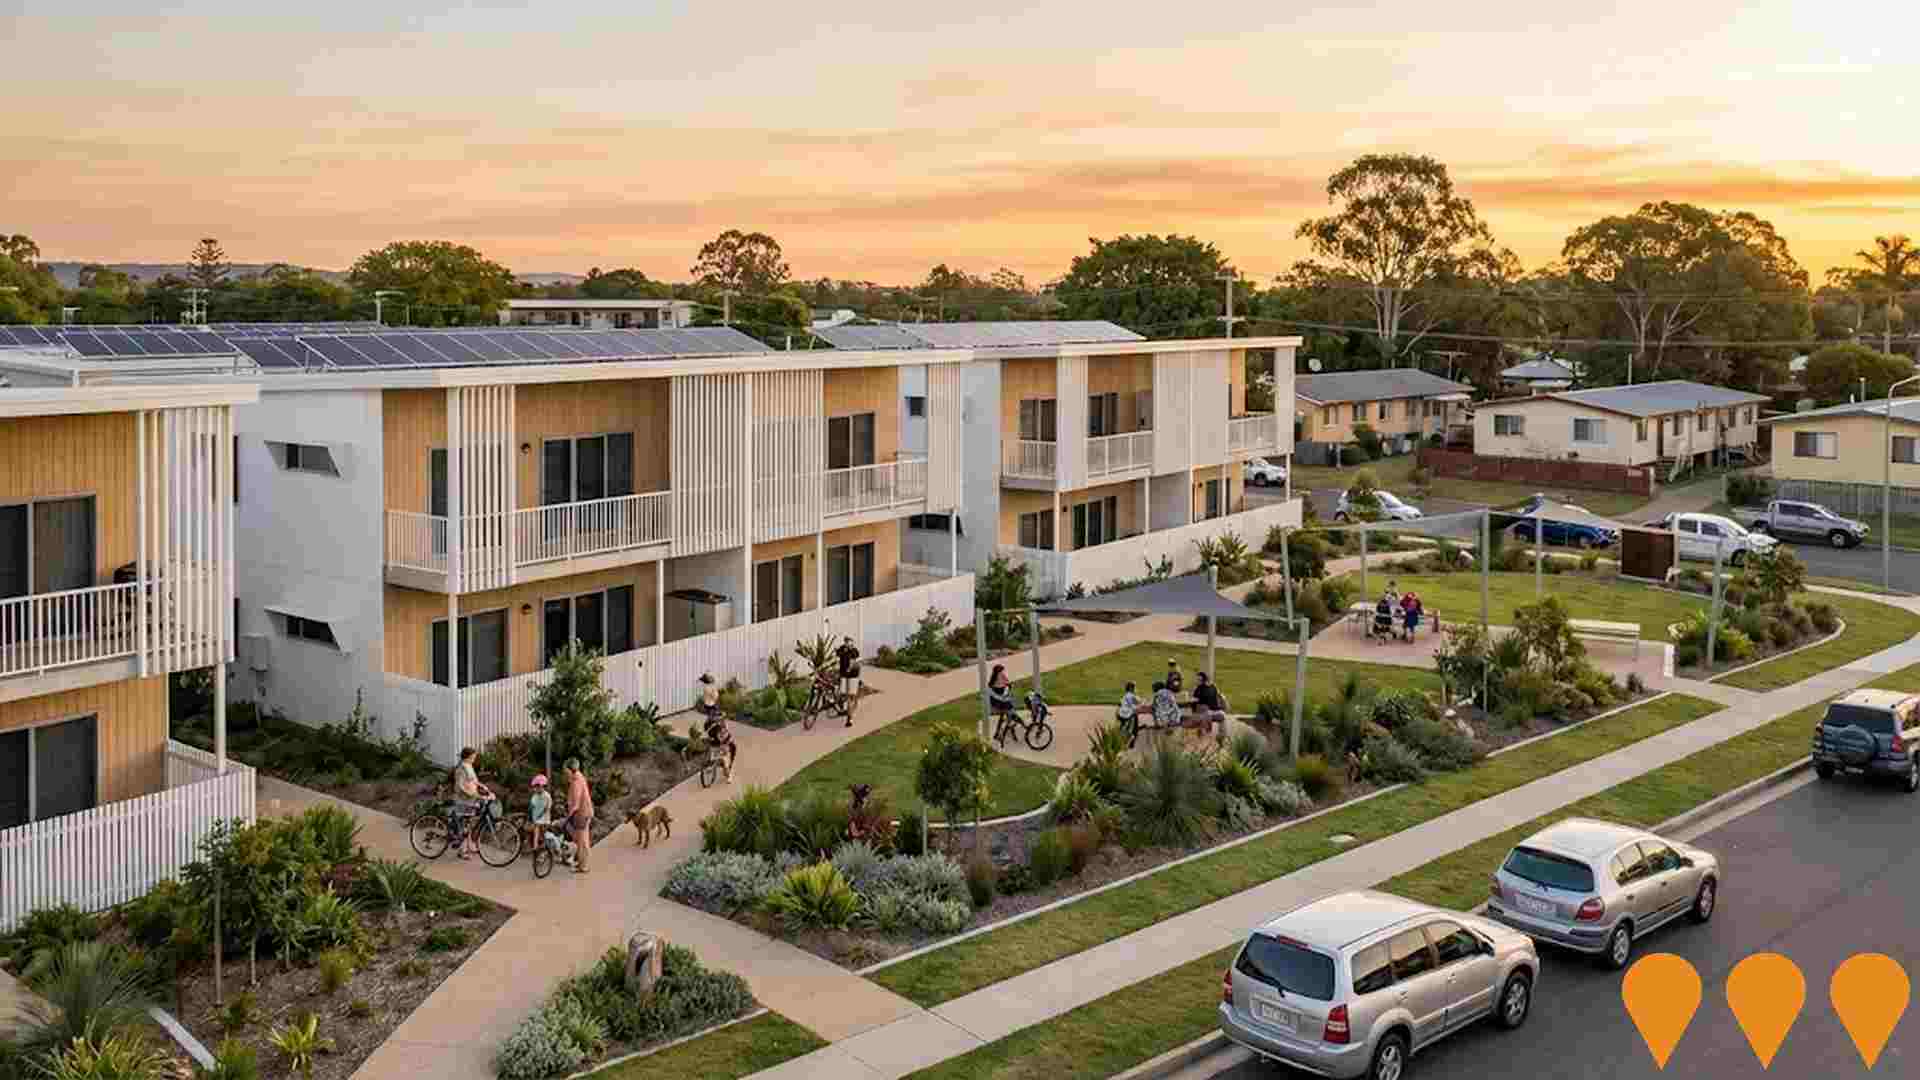
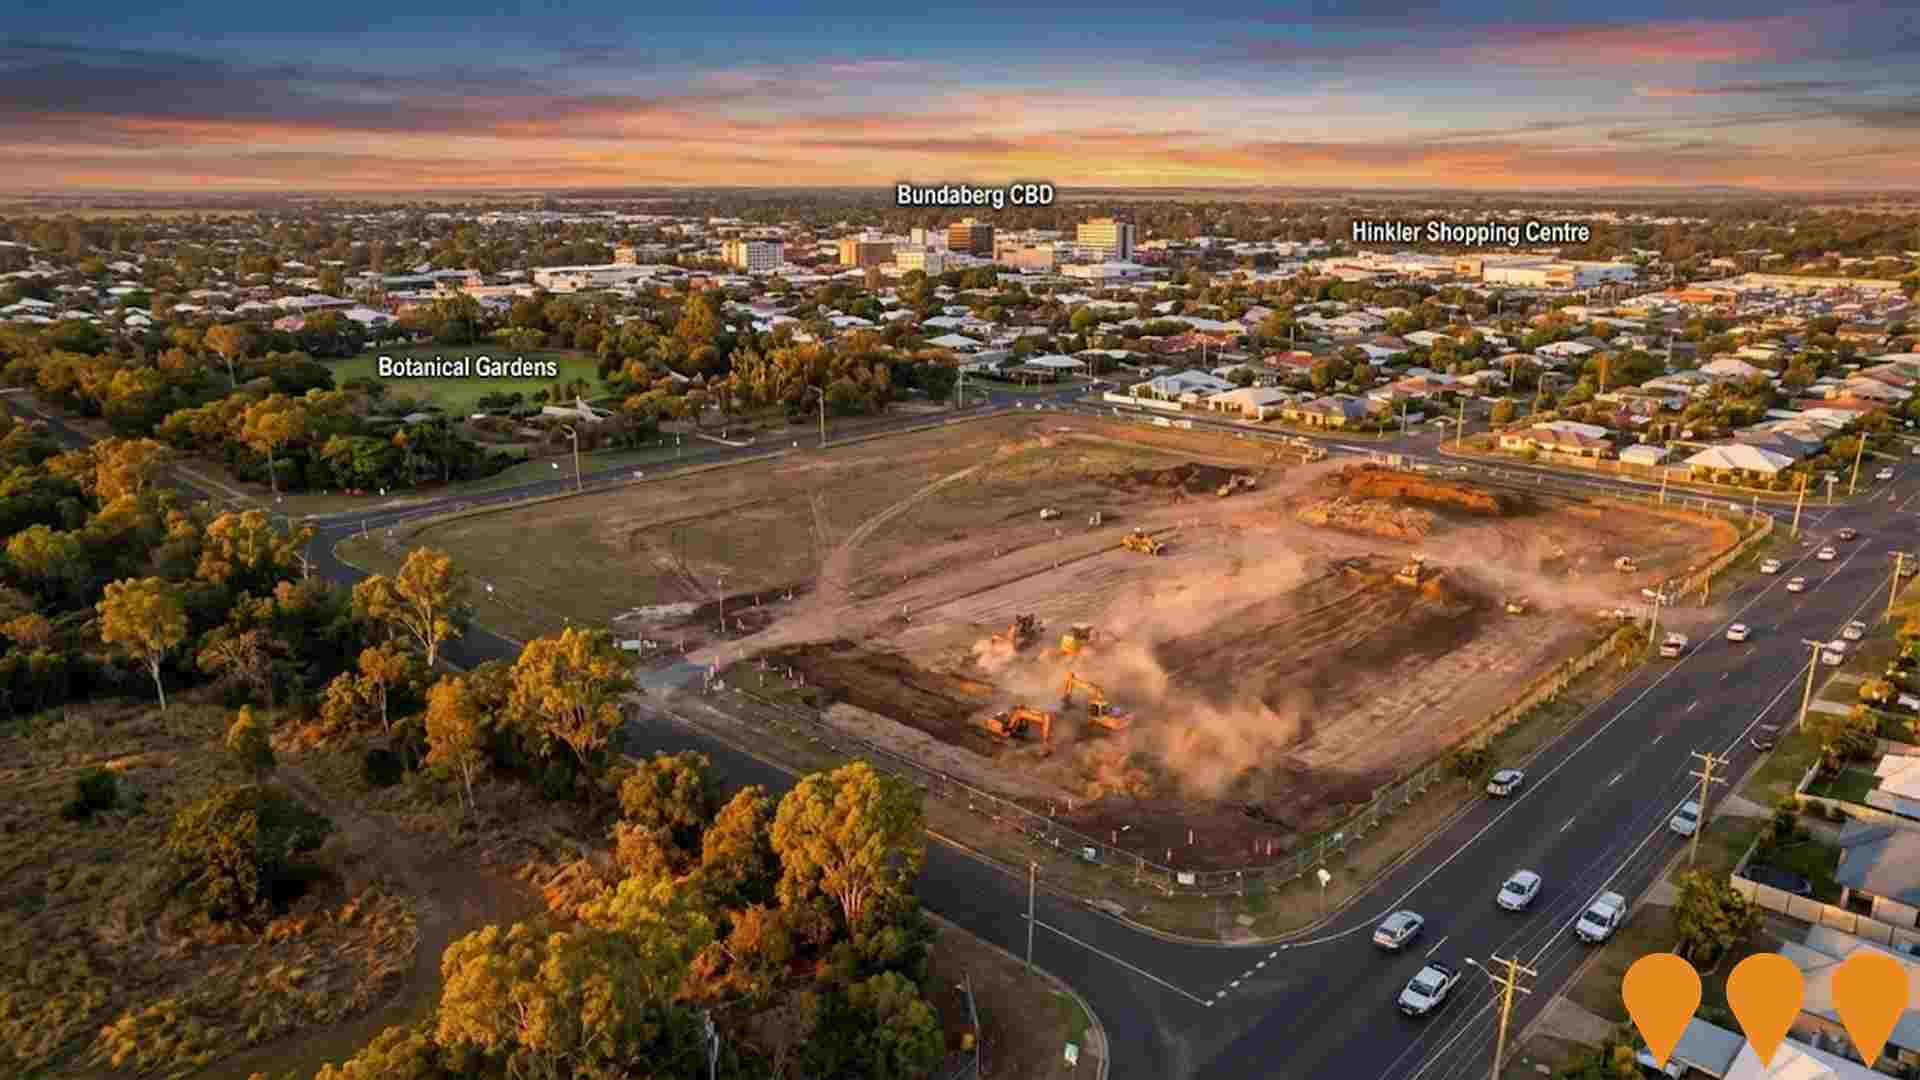
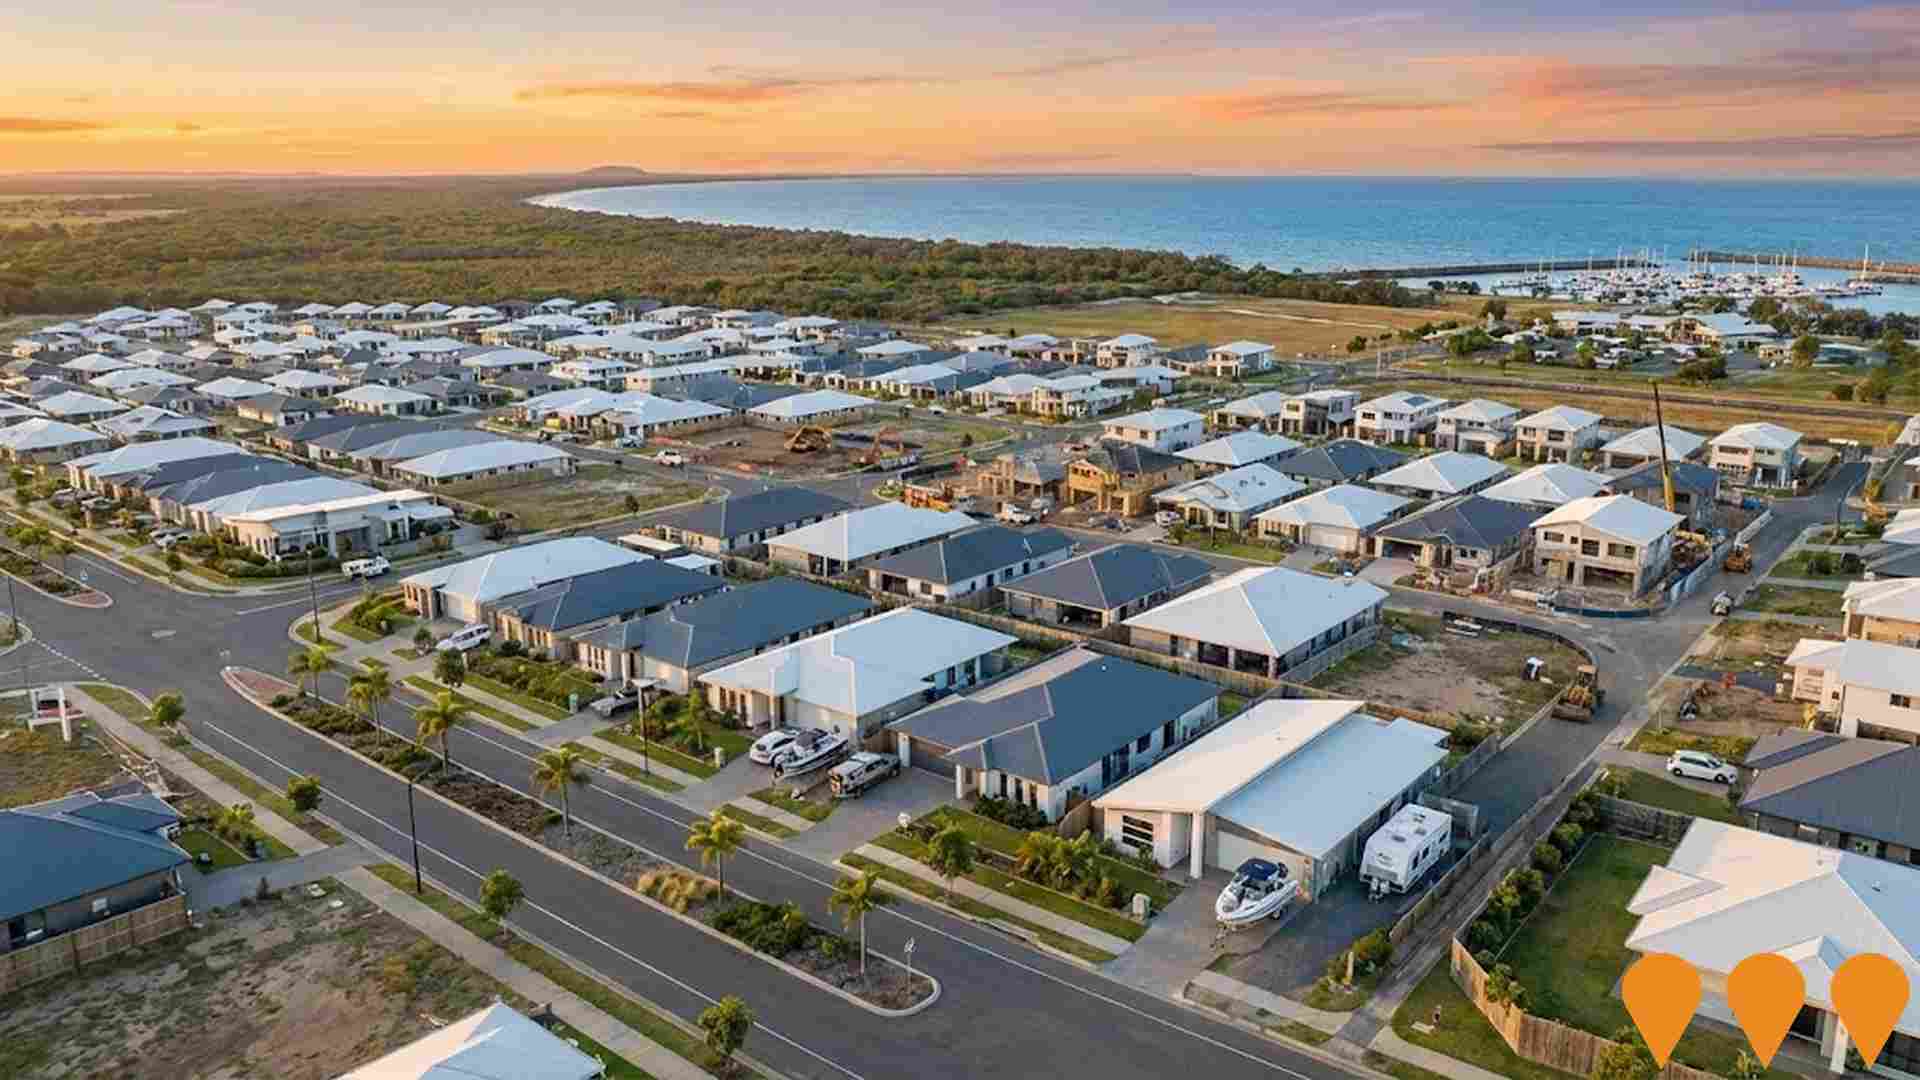
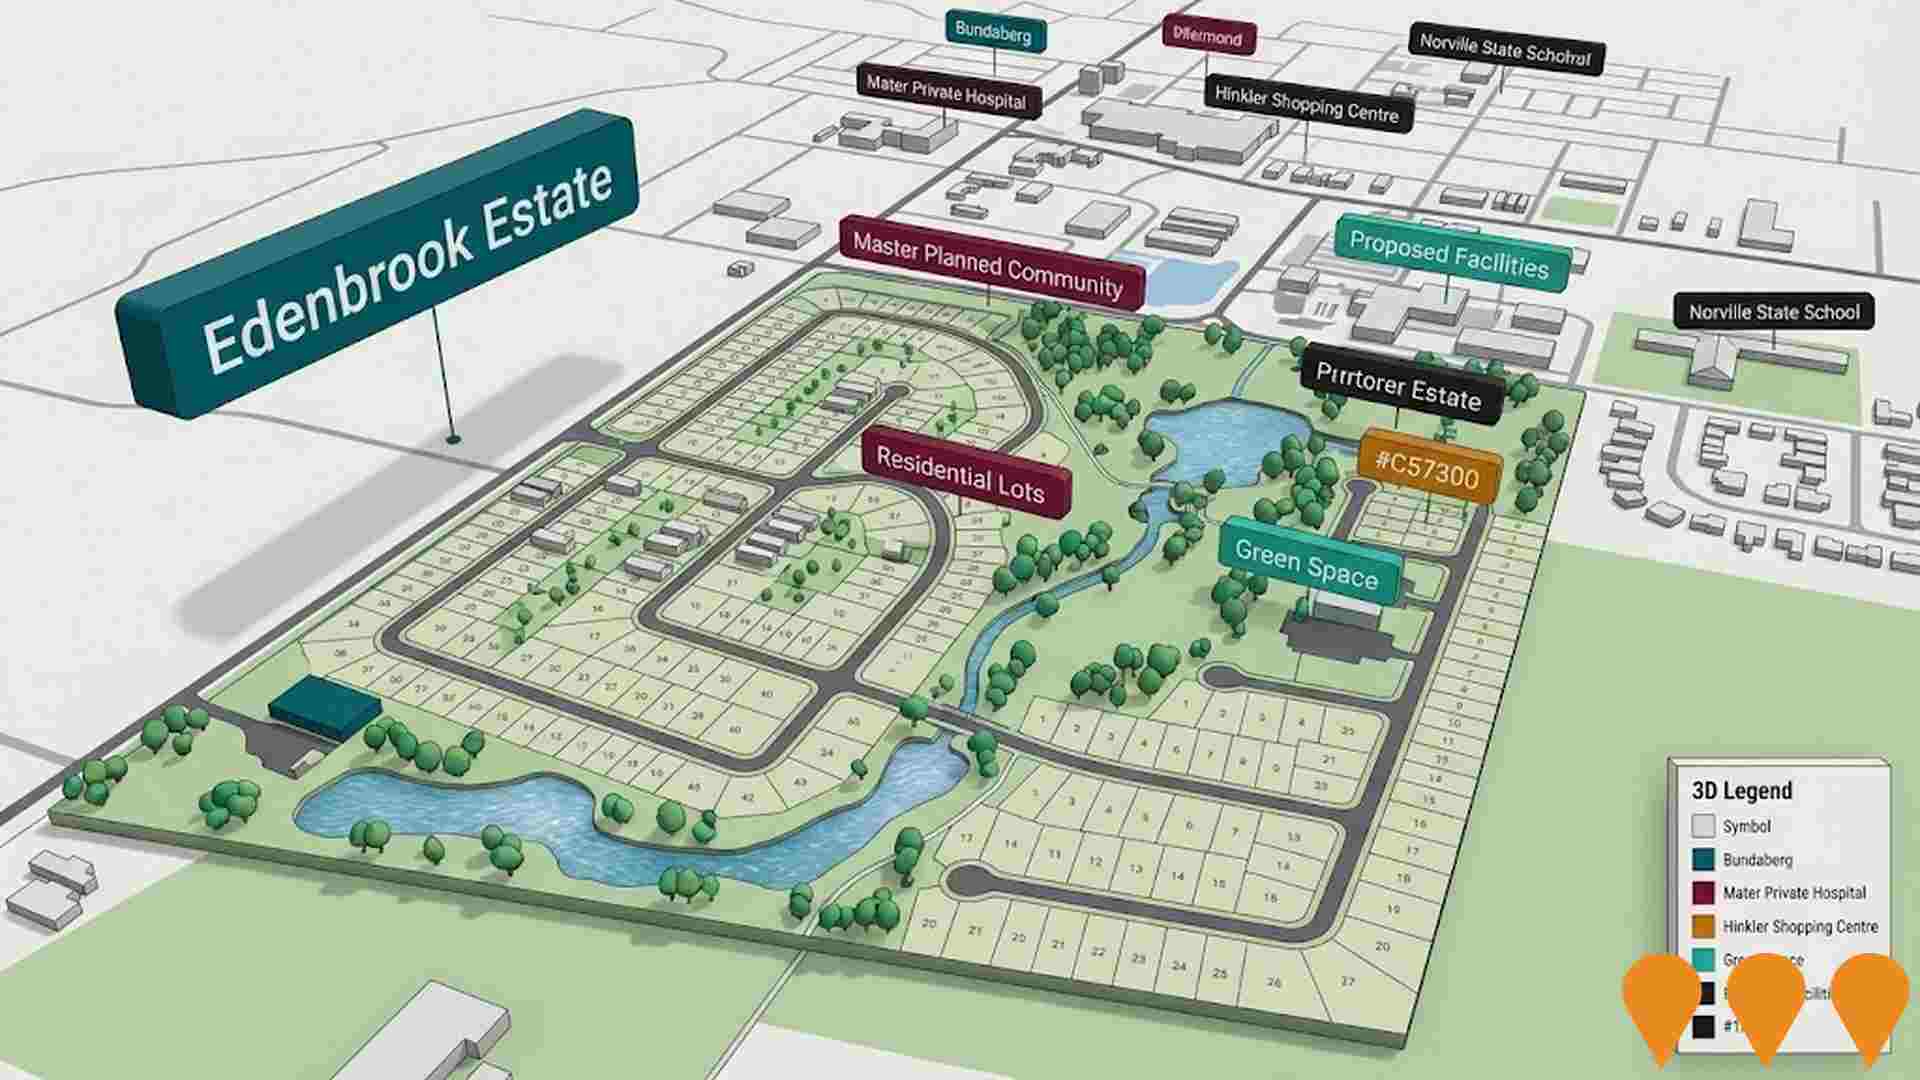
 Denotes AI-based impression for illustrative purposes only, not to be taken as definitive under any circumstances. Please follow links and conduct other investigations from the project's source for actual imagery. Developers and project owners wishing us to use original imagery please Contact Us and we will do so.
Frequently Asked Questions - Infrastructure
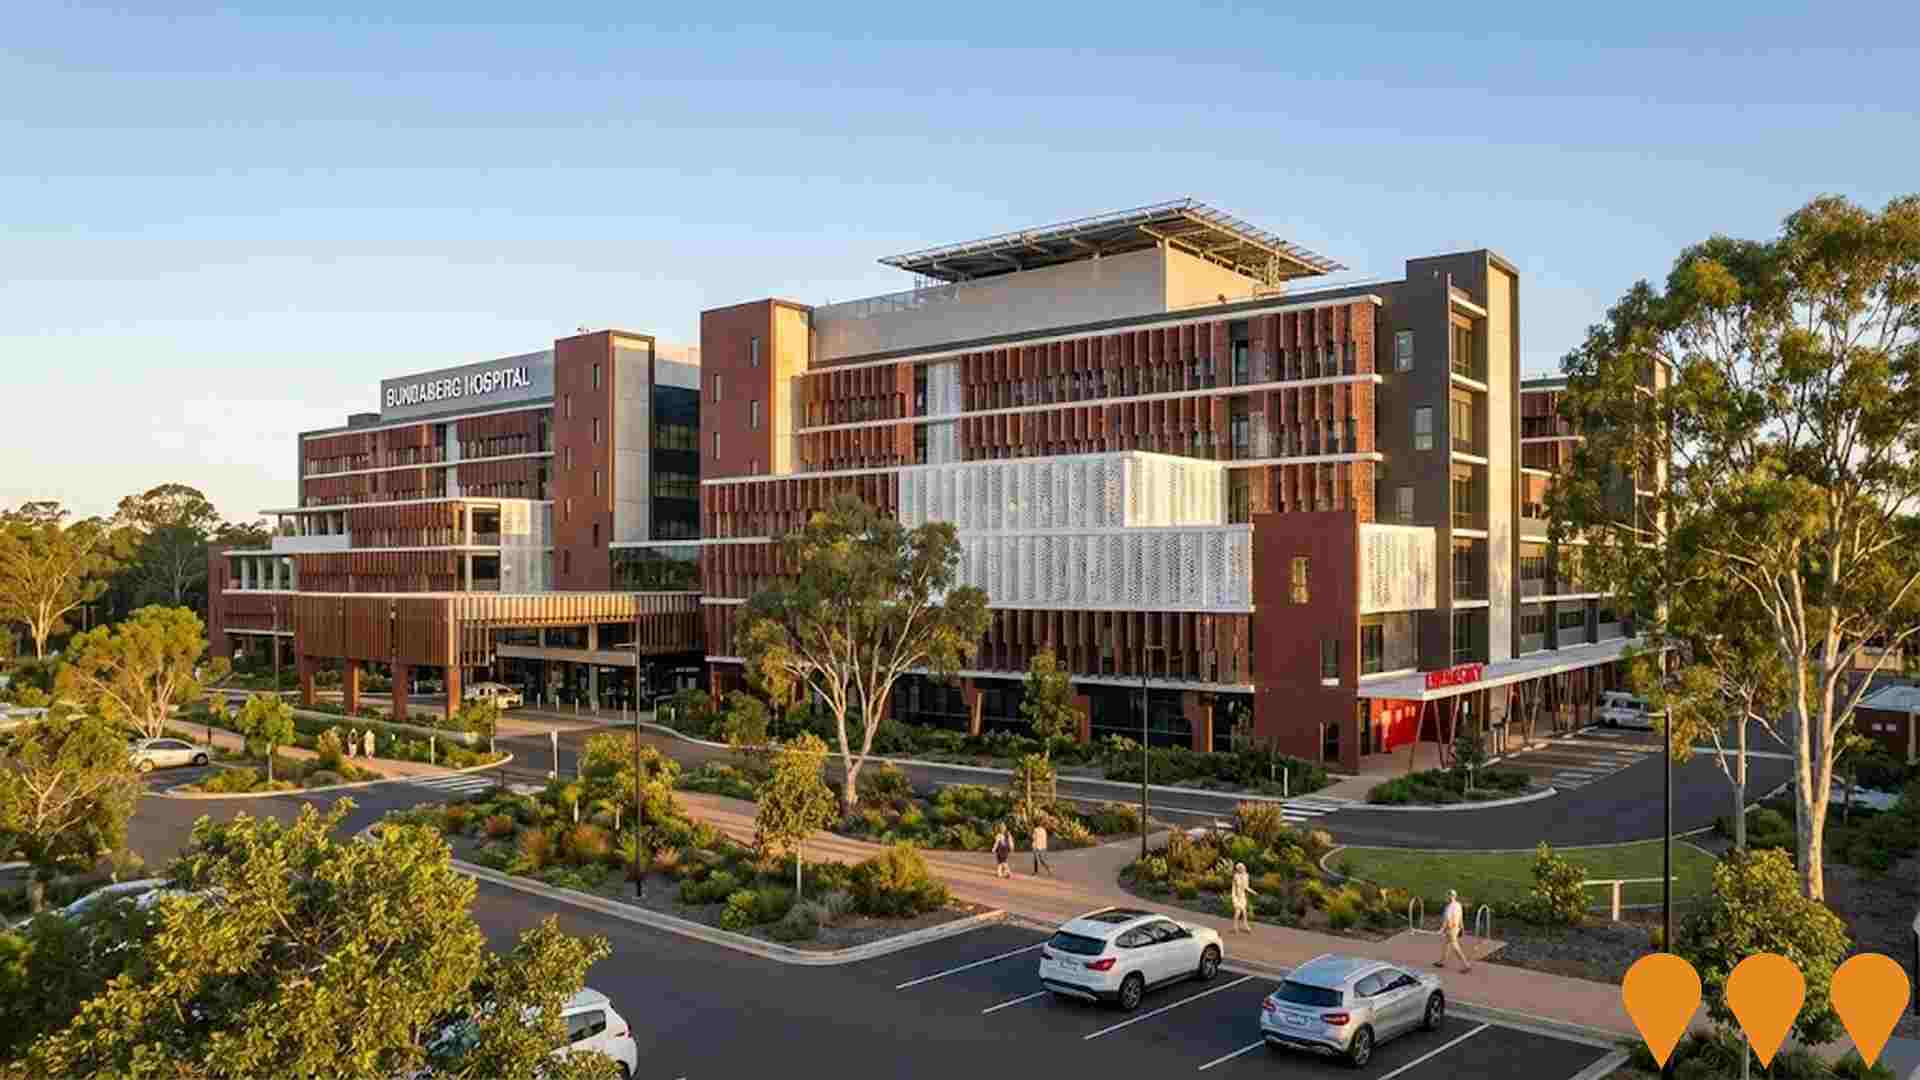
New Bundaberg Hospital
The $1.2 billion New Bundaberg Hospital is a greenfield public hospital development in Thabeban, replacing the existing Bundaberg Hospital on Bourbong Street. The six-storey acute facility will deliver more than 410 beds and bed alternatives (including at least 139 additional overnight beds), a larger emergency department, additional operating theatres with cardiology support, acute mental health beds, expanded outpatient and diagnostic services, teaching/training/research spaces, and a rooftop helipad. Delivered by CPB Contractors for Queensland Health and Wide Bay Hospital and Health Service under the Queensland Hospital Rescue Plan. Early works commenced May 2024; main construction ongoing, with completion targeted for 2027.
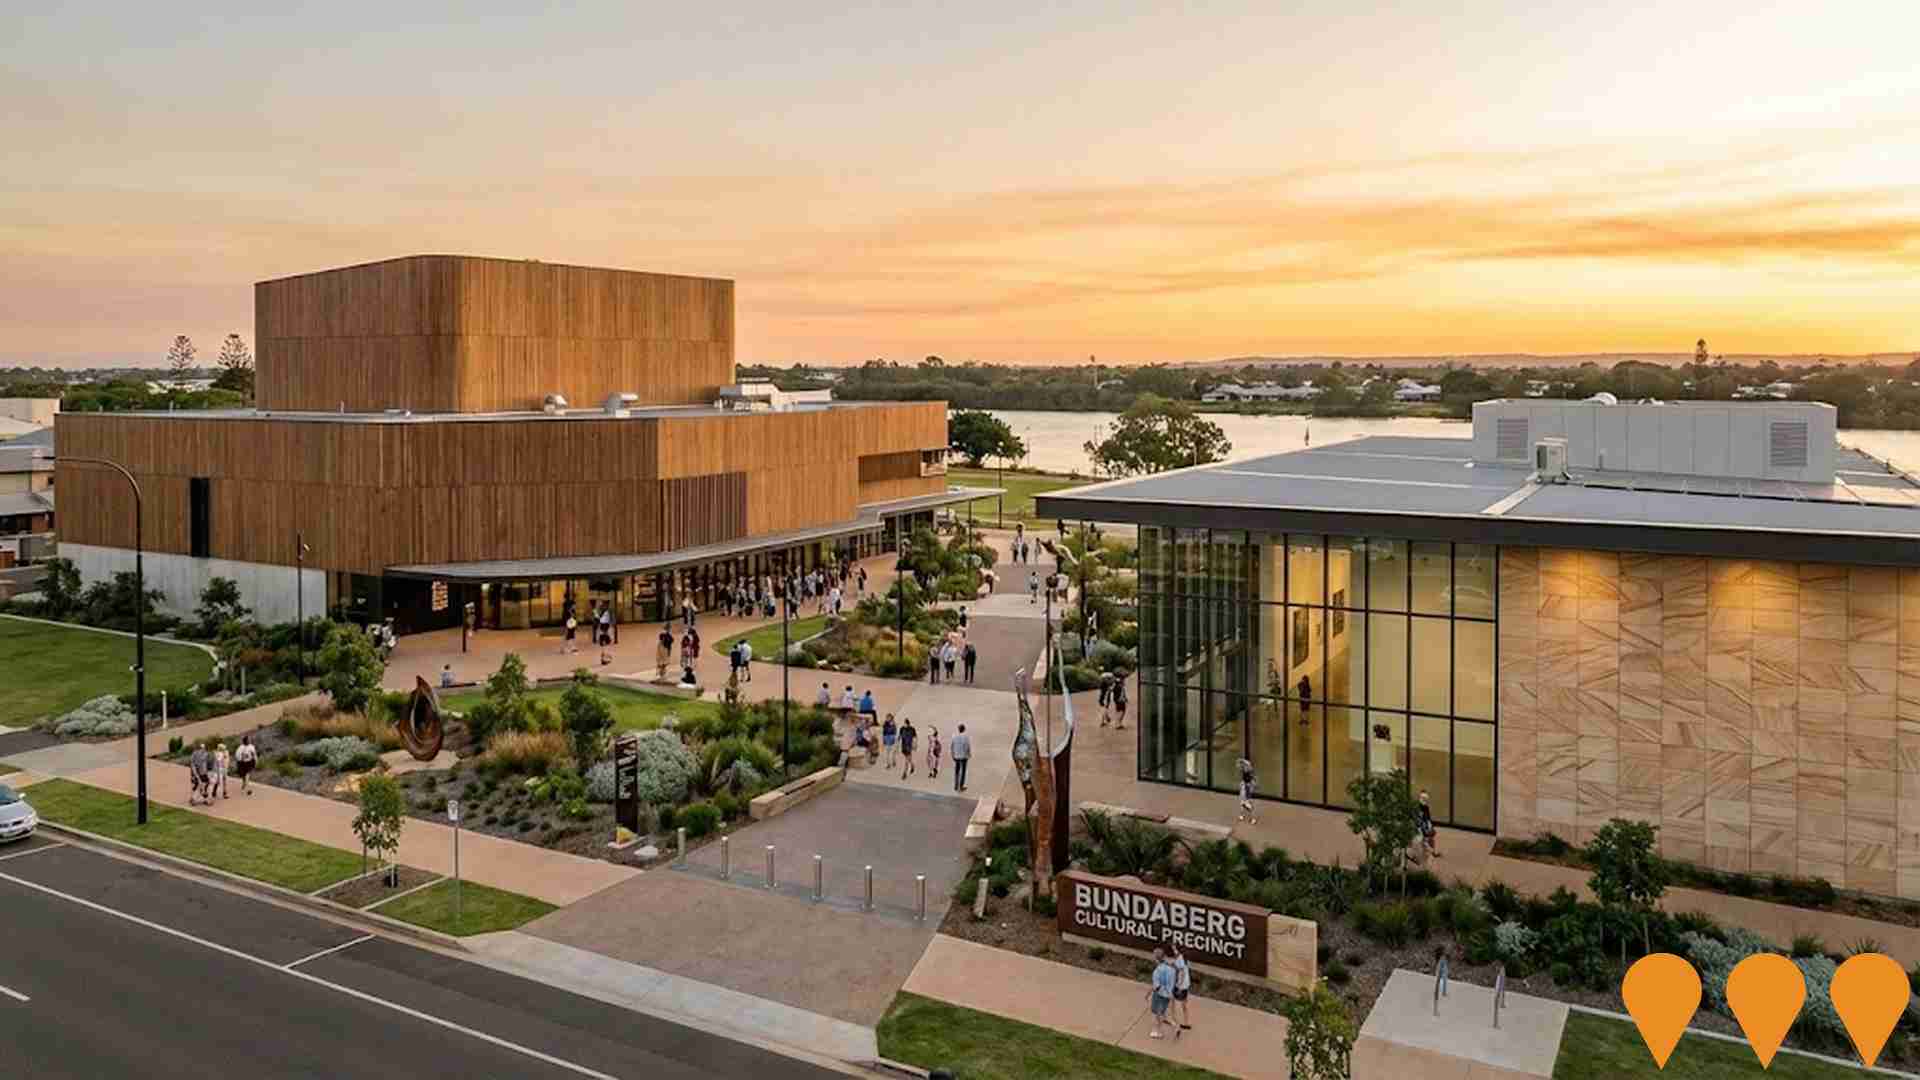
Bundaberg Civic and Cultural Precinct
A transformative civic and cultural arts precinct in Bundaberg's CBD to create a new city heart. The project includes a new regional art gallery and a 750-seat performing arts centre. The concept involves converting an existing carpark into an inner courtyard linking the historic School of Arts to the new gallery, with the performing arts centre creating a pedestrian spine. The precinct aims to reinvigorate the CBD, reconnect the city with the Burnett River, and create a vibrant community hub with new cultural infrastructure, public spaces, and pedestrian laneways. The project is part of a 20-year vision for the region.
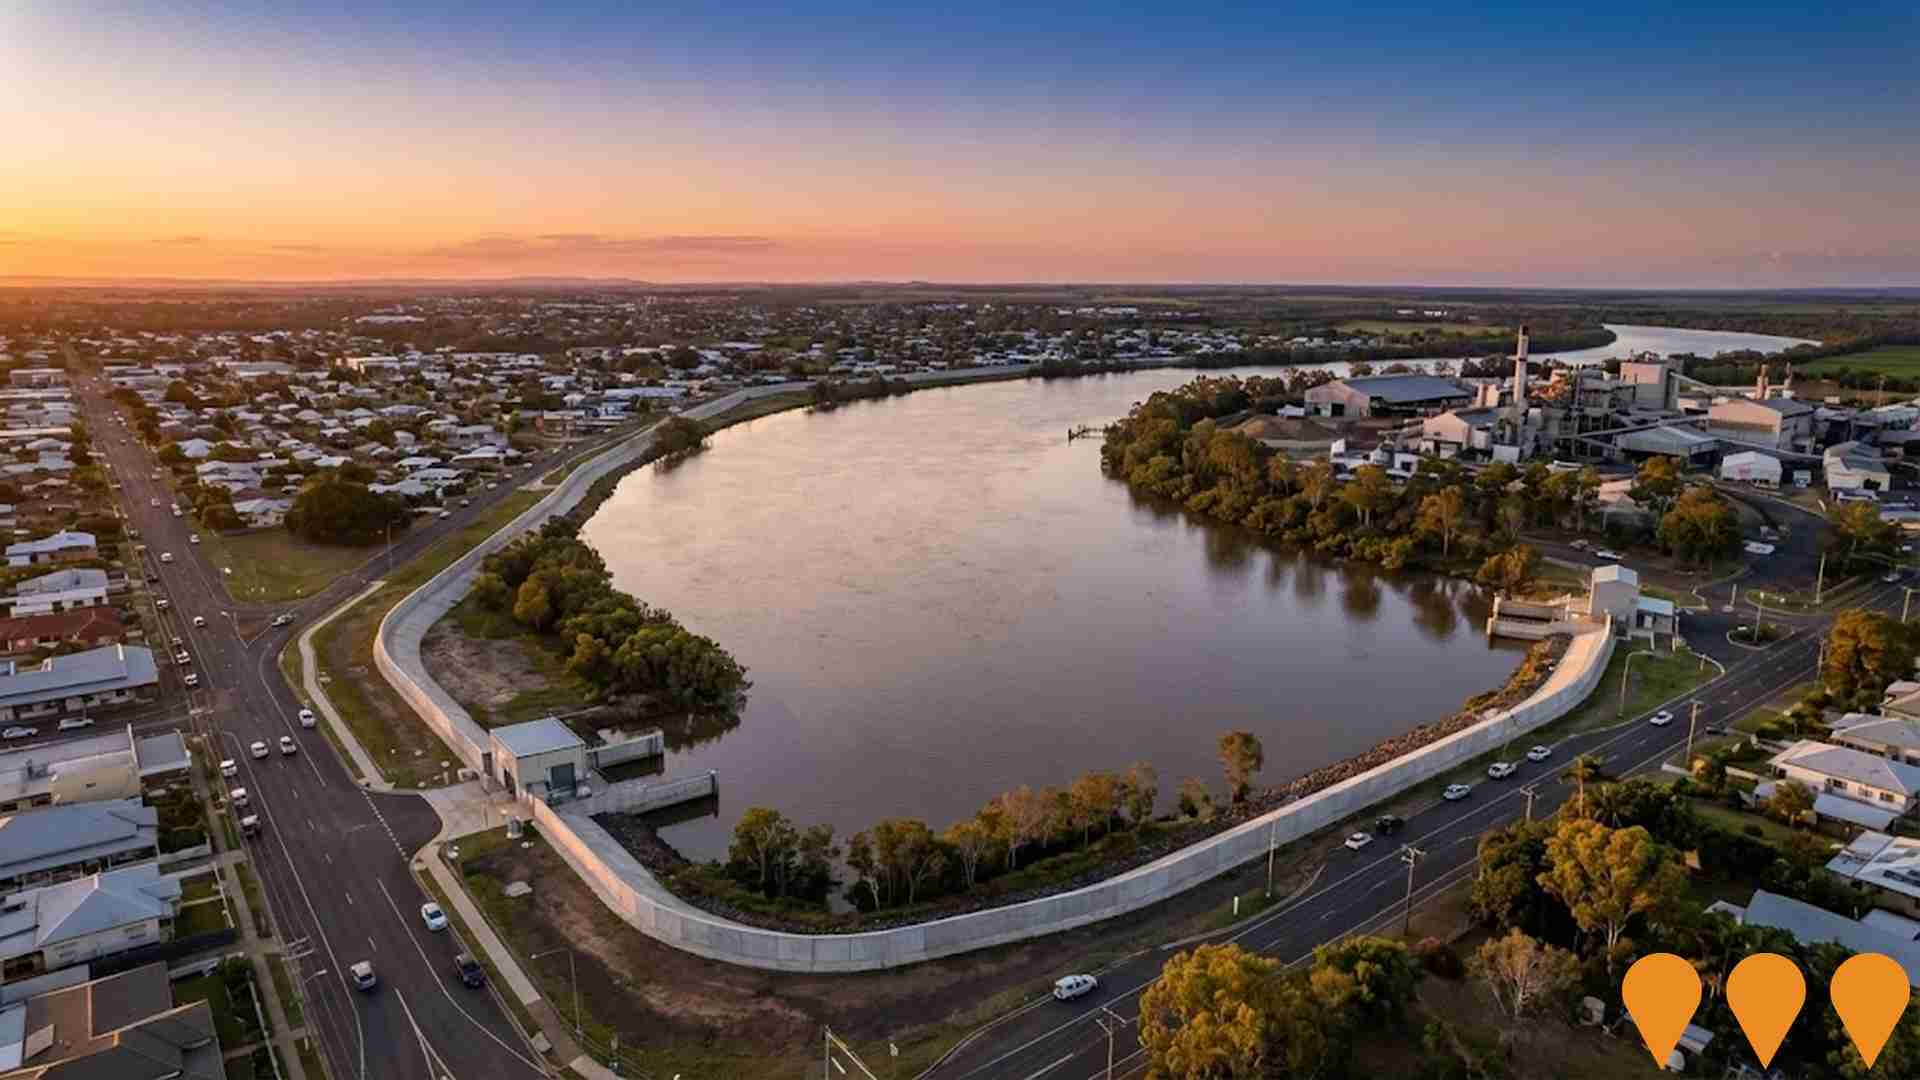
Bundaberg East Levee
A $174.7 million jointly funded Australian and Queensland Government project to construct a 1.7 km concrete flood levee with floodgates, flood doors and pump stations along the southern bank of the Burnett River between Walla Street and Millaquin Sugar Mill. The levee is designed to protect Bundaberg East, Bundaberg South and the CBD, including around 600 properties, from a Burnett River flood similar to the January 2013 event. The reference design includes concrete levee in two main sections crossing Saltwater Creek and Distillery Creek, while supporting long term economic development and local construction jobs. Construction expected to commence in 2025.
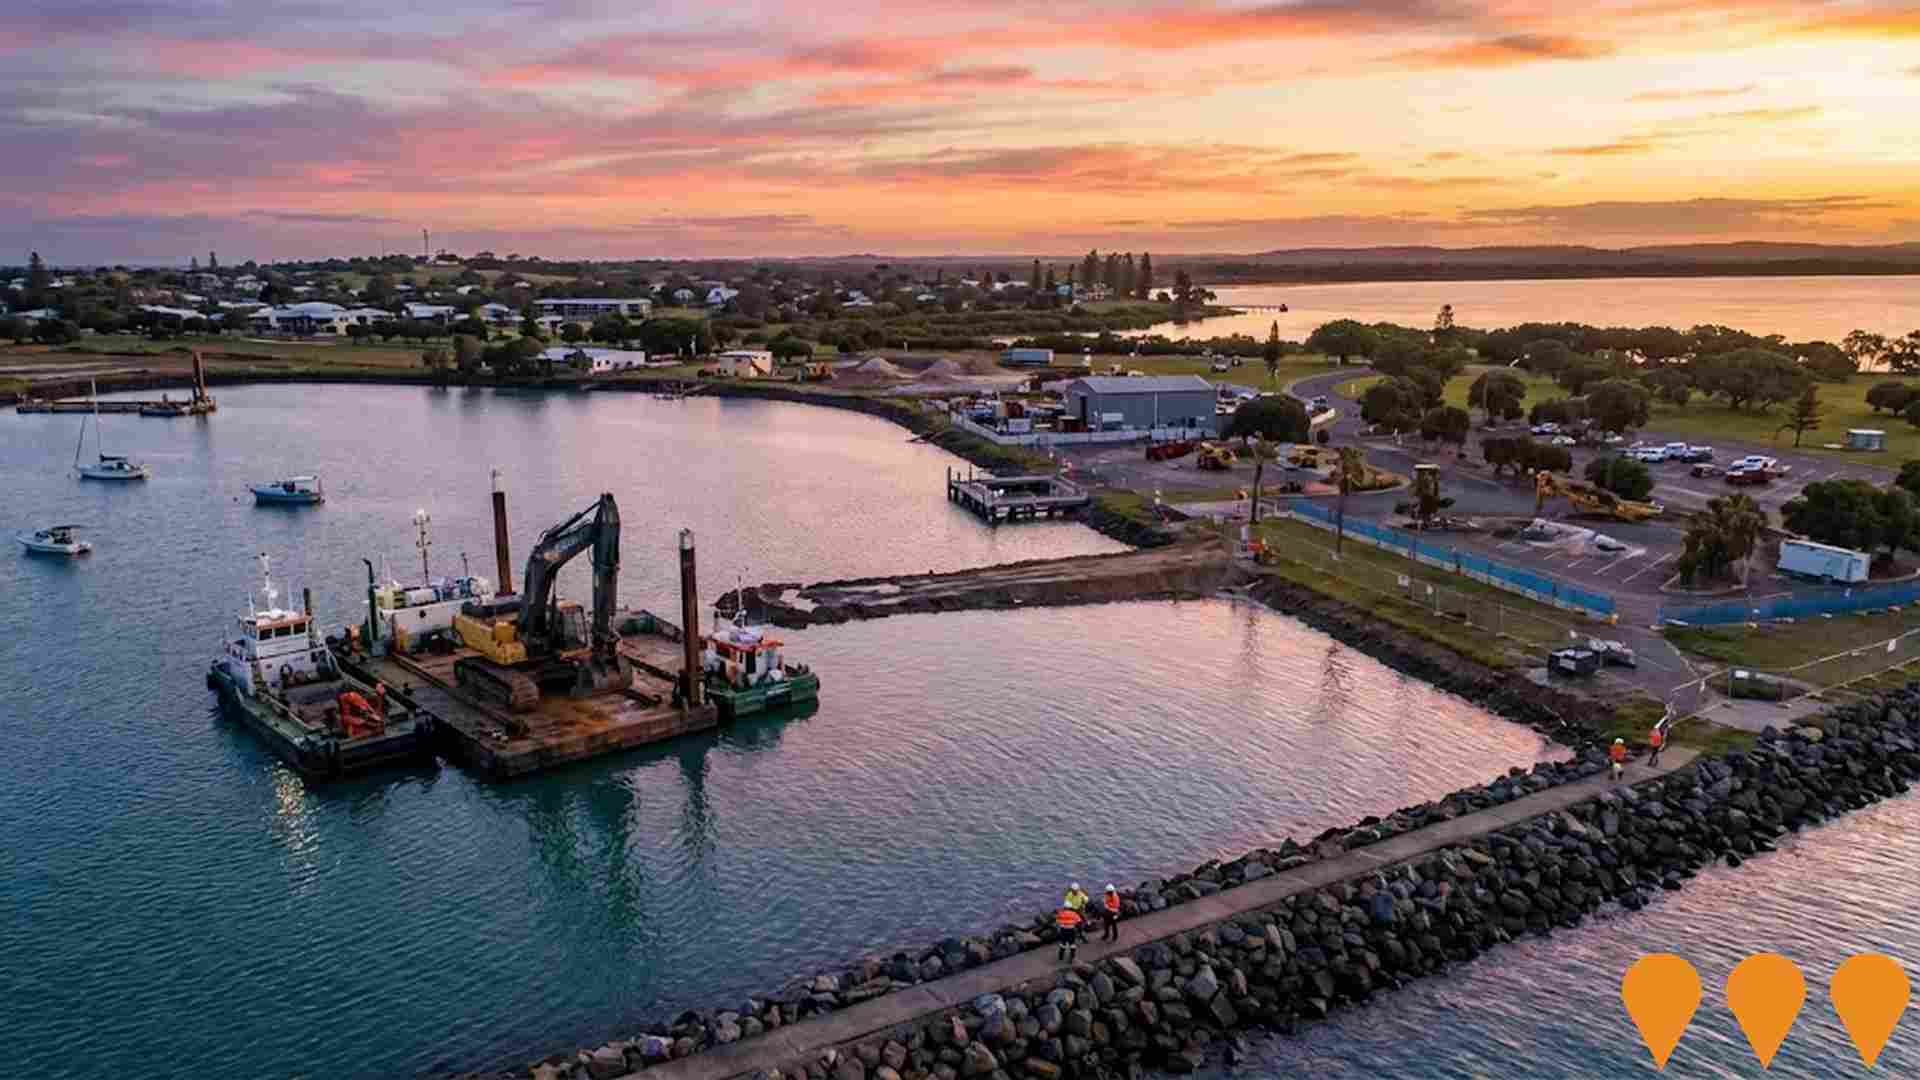
The Gateway Marina - Burnett Heads
A $250 million mixed use marina village on the shore of Burnett Heads Boat Harbour, planned for a 318 berth marina, low rise waterfront apartments and villas, short stay accommodation, hotel, retail, restaurants and cafes, and public boardwalks and open space. The project holds development approvals and dredging of the marina basin began in 2022, but in 2024 BH Developments QLD Pty Ltd entered liquidation and the approved project and site are now being marketed for sale by receivers, so future delivery depends on a new developer taking it forward.
Bundaberg Aquatic Centre
A state-of-the-art year-round aquatic facility featuring a covered 50m FINA-standard 10-lane competition pool, an indoor 25m lap pool, a heated program/hydrotherapy pool with accessible ramp entry, multipurpose rooms, Reformer Pilates studio, cafe, and equitable access features including ramps, lifts, and hoists. Co-located with the Bundaberg Multiplex to form a high-performance sports precinct. Includes sustainability features such as solar arrays, hybrid heating, and rainwater harvesting. Provides fitness, education, therapy, competition, and recreation opportunities for all ages and abilities, with approximately 165 parking spaces.

Bundaberg Solar Farm
A 100 MW solar photovoltaic farm located in the Bundaberg region, approximately 360 kilometers north of Brisbane. The facility features 168,399 solar modules installed across 146 hectares and is expected to have a 25-year lifespan. The project will generate approximately 200 GWh of clean energy annually, enough to power around 36,000 homes and offset 104,000 tonnes of CO2 emissions each year. Construction is being delivered by Monford Group as EPC contractor, with commercial operation expected to commence in Q3-Q4 2025. The project includes a Power Purchase Agreement with Telstra for 153 GWh per annum.
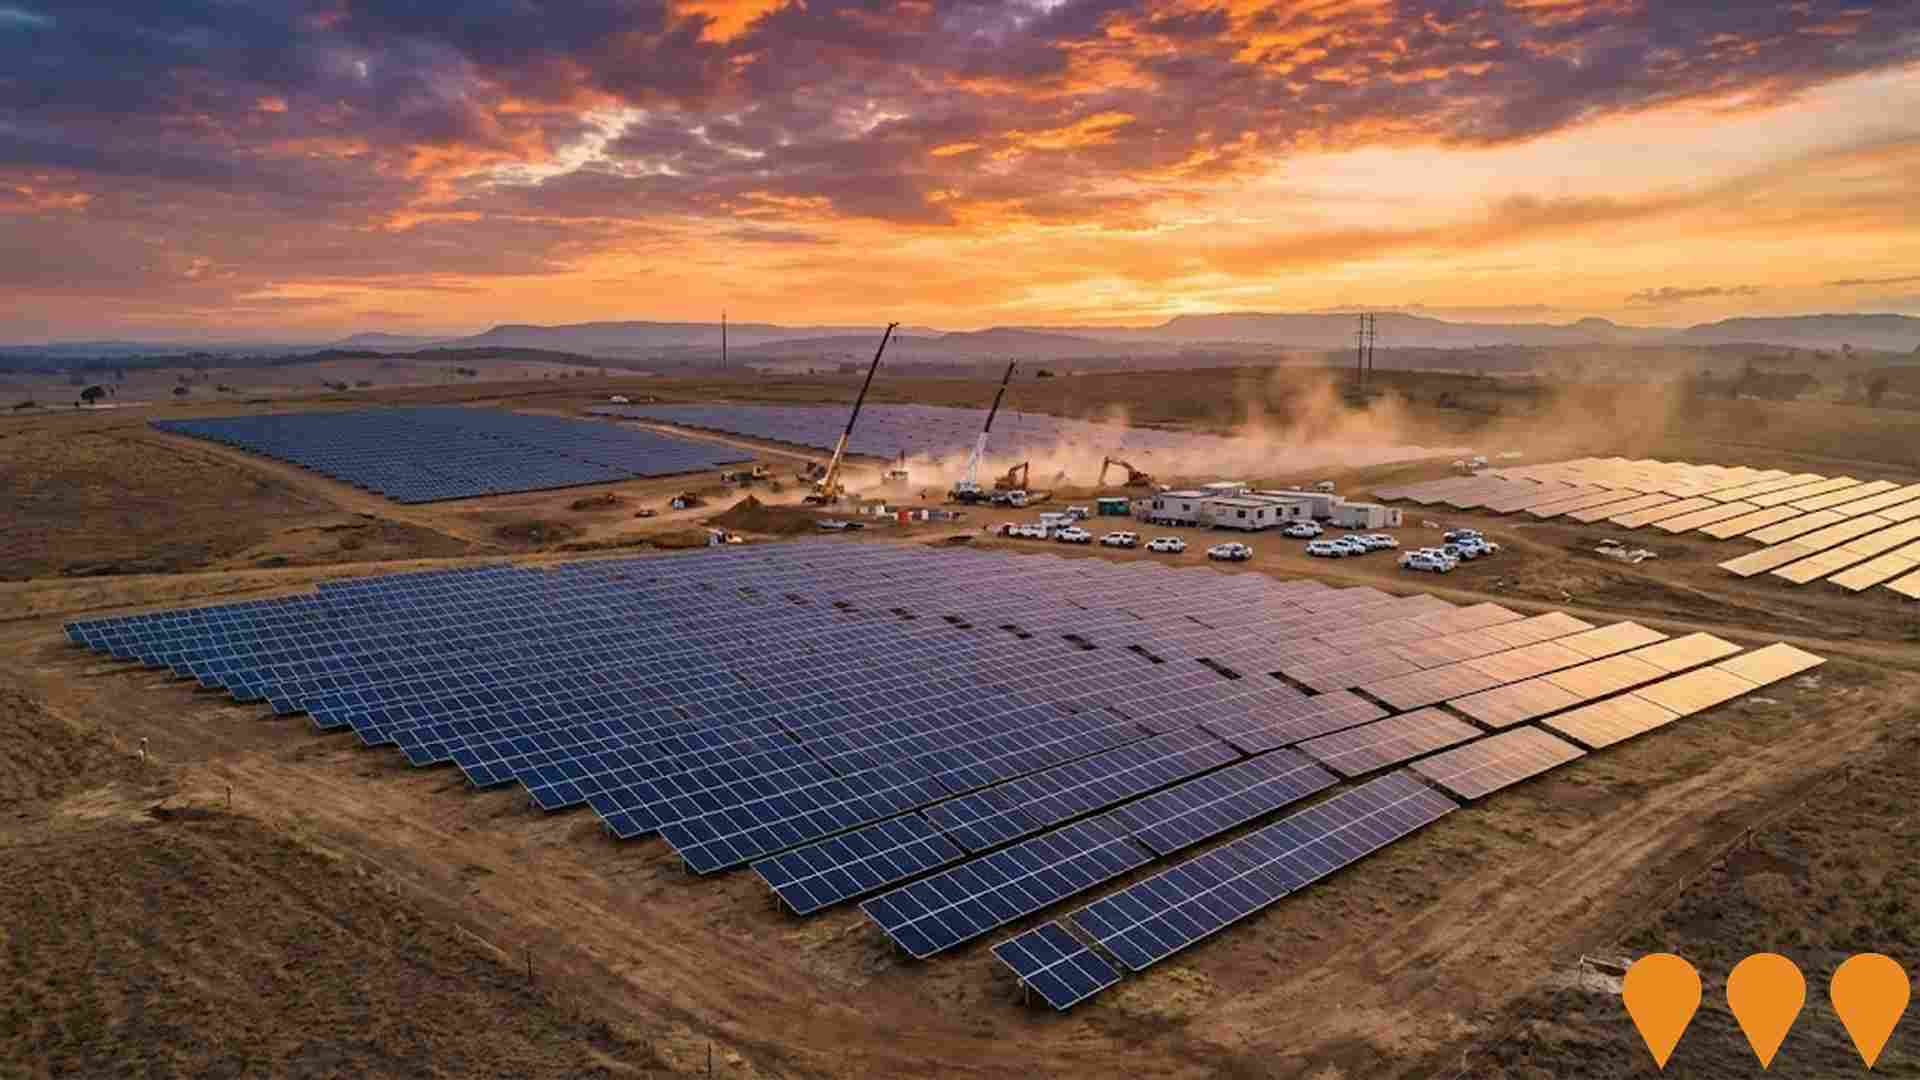
Belle Eden Estate Extensions
Two development sites: 23-hectare northern site for 150+ home sites (380 population) and 34-hectare southern site for 300+ home sites (750 population). Currently in final approval stages.
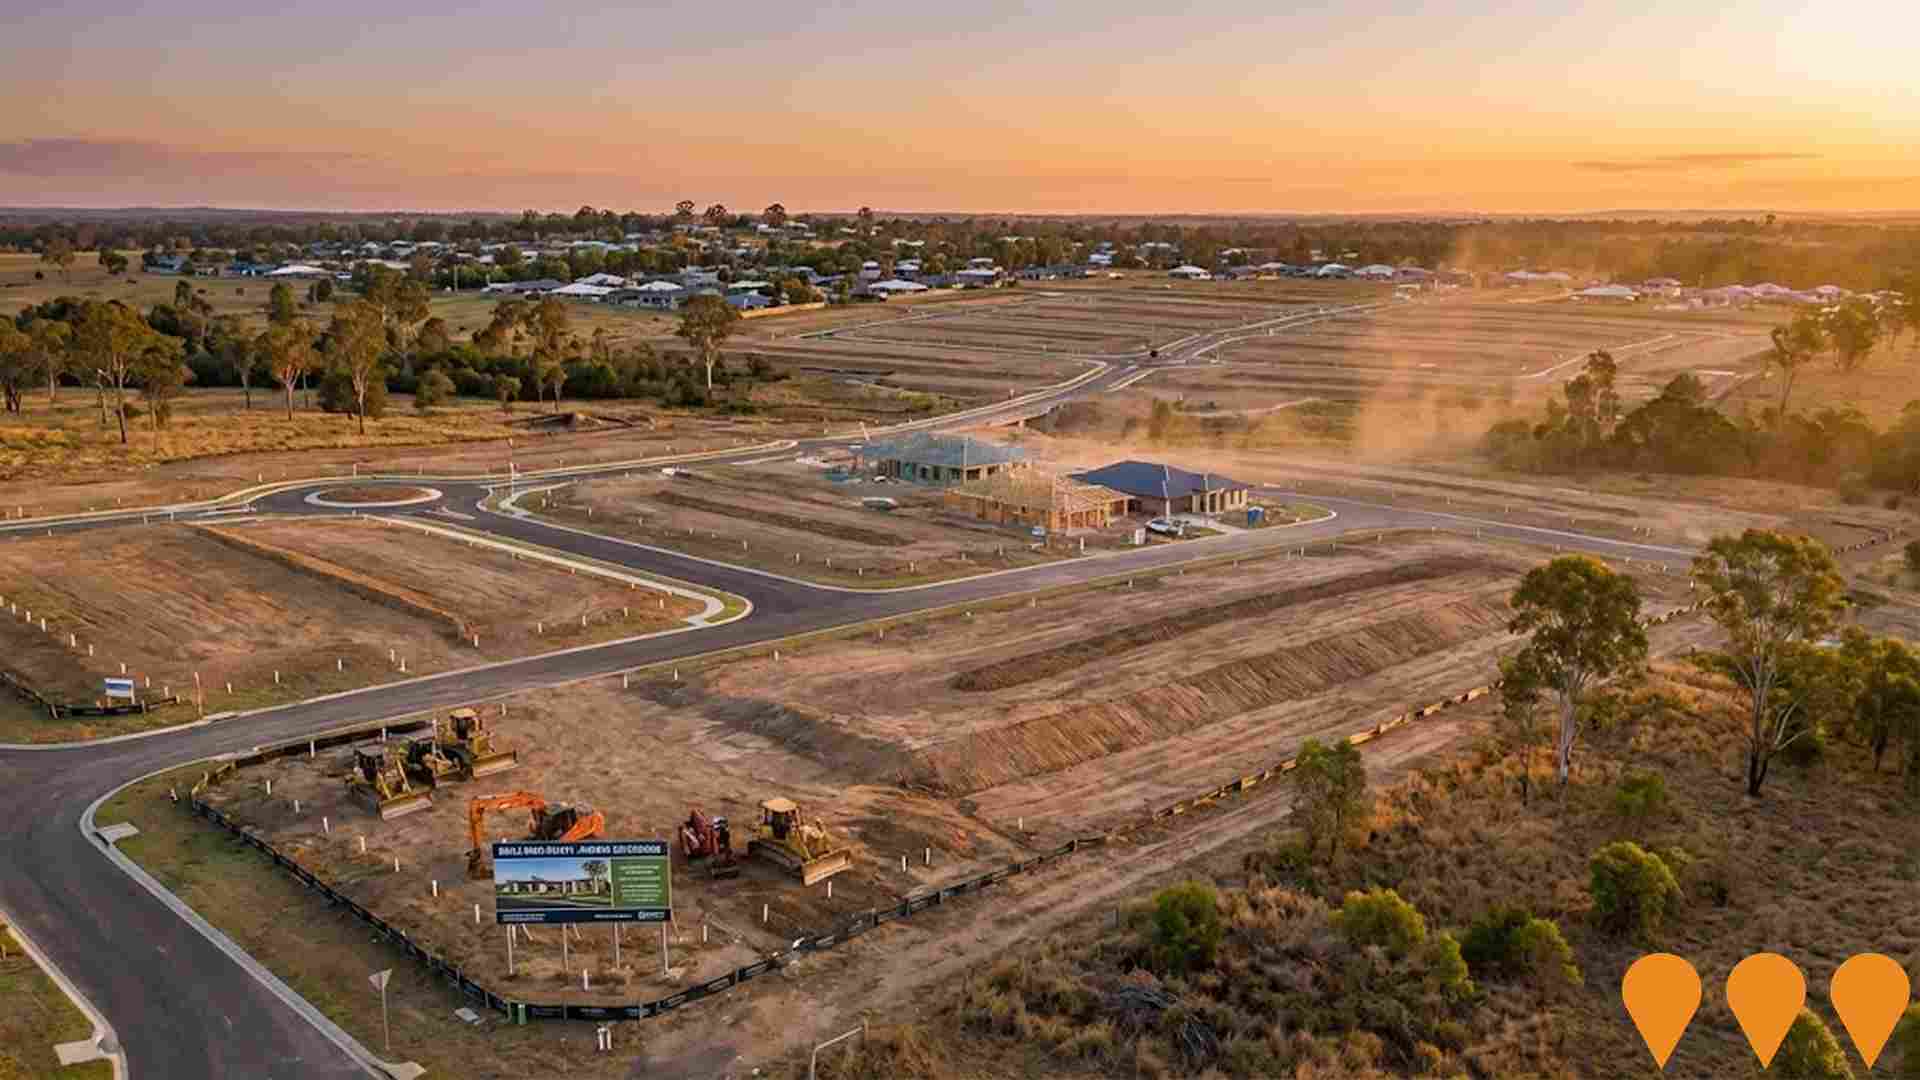
Edenbrook Estate
Premium master-planned residential community by Santalucia Corporation. Lots from 740m2-1,080m2 with 23m average frontages. Features high-speed internet, proximity to shopping, schools, and childcare facilities.
Employment
Employment performance in Bundaberg North - Gooburrum has been below expectations when compared to most other areas nationally
Bundaberg North - Gooburrum has a balanced workforce with both white and blue collar jobs. Essential services sectors are well represented, and the unemployment rate was 5.7% as of September 2024.
Employment growth over the past year was estimated at 9.5%. As of September 2025, there were 3603 residents in work, with an unemployment rate of 6.7%, which is 1.6 percentage points higher than the Rest of Qld's rate of 4.1%. Workforce participation was significantly lower at 46.6% compared to Rest of Qld's 59.1%. The dominant employment sectors among residents were health care & social assistance, retail trade, and agriculture, forestry & fishing.
The area had a strong specialization in agriculture, forestry & fishing with an employment share of 2.2 times the regional level. Professional & technical services had limited presence with only 3.0% employment compared to the regional average of 5.1%. Over the year to September 2025, employment increased by 9.5%, while labour force grew by 10.0%, leading to a rise in unemployment rate of 0.4 percentage points. By comparison, Rest of Qld had employment growth of 1.7% and unemployment rose by 0.3 percentage points. State-level data as of 25-Nov-25 shows Queensland's employment contracted by 0.01%, with the state unemployment rate at 4.2%. National employment forecasts from May-25 suggest national employment will expand by 6.6% over five years and 13.7% over ten years. Applying these projections to Bundaberg North - Gooburrum's employment mix suggests local employment should increase by 6.2% over five years and 13.3% over ten years, assuming no changes in population projections.
Frequently Asked Questions - Employment
Income
Income metrics place the area in the bottom 10% of locations nationally according to AreaSearch analysis
The Bundaberg North - Gooburrum SA2's median income among taxpayers in financial year 2022 was $41,997. The average income stood at $51,895 during the same period. These figures are lower than those of Rest of Qld, which had a median income of $50,780 and an average income of $64,844. By September 2025, based on Wage Price Index growth of 13.99%, the estimated median income would be approximately $47,872, and the average income would be around $59,155. Census data shows that incomes in Bundaberg North - Gooburrum fall between the 4th and 8th percentiles nationally for households, families, and individuals. The income bracket of $400 - $799 captures 31.7% of the community (2,505 individuals), whereas in metropolitan regions, the dominant bracket is $1,500 - $2,999 with 31.7%. After housing expenses, 86.2% of income remains, which ranks at the 6th percentile nationally.
Frequently Asked Questions - Income
Housing
Bundaberg North - Gooburrum is characterized by a predominantly suburban housing profile, with above-average rates of outright home ownership
Dwelling structure in Bundaberg North - Gooburrum, as evaluated at the Census 2016, comprised 76.8% houses and 23.1% other dwellings (semi-detached, apartments, 'other' dwellings). In comparison, Non-Metro Qld had 84.6% houses and 15.4% other dwellings. Home ownership in Bundaberg North - Gooburrum was 48.0%, with the remainder mortgaged (23.7%) or rented (28.3%). The median monthly mortgage repayment was $1,138, below Non-Metro Qld's average of $1,300 and Australia's average of $1,863. The median weekly rent figure was $280, compared to Non-Metro Qld's $285 and the national figure of $375.
Frequently Asked Questions - Housing
Household Composition
Bundaberg North - Gooburrum features high concentrations of lone person households, with a lower-than-average median household size
Family households constitute 66.5% of all households, including 18.5% couples with children, 34.5% couples without children, and 12.0% single parent families. Non-family households comprise the remaining 33.5%, with lone person households at 30.1% and group households at 3.3%. The median household size is 2.3 people, which is smaller than the Rest of Qld average of 2.4.
Frequently Asked Questions - Households
Local Schools & Education
Bundaberg North - Gooburrum faces educational challenges, with performance metrics placing it in the bottom quartile of areas assessed nationally
The area has university qualification rates of 12.0%, significantly lower than the Australian average of 30.4%. Bachelor degrees are the most common at 9.1%, followed by postgraduate qualifications (1.5%) and graduate diplomas (1.4%). Trade and technical skills are prevalent, with 39.2% of residents aged 15+ holding vocational credentials - advanced diplomas (8.1%) and certificates (31.1%). A total of 24.5% of the population is actively engaged in formal education, including 8.9% in primary, 8.3% in secondary, and 2.7% in tertiary education.
A substantial 24.5% of the population actively pursues formal education. This includes 8.9% in primary education, 8.3% in secondary education, and 2.7% pursuing tertiary education.
Frequently Asked Questions - Education
Schools Detail
Nearby Services & Amenities
Transport
Transport servicing is very low compared to other areas nationally based on assessment of service frequency, route connectivity and accessibility
Transport analysis shows 21 active stops operating in Bundaberg North - Gooburrum area. These stops serve a mix of bus routes, with two individual routes providing a total of 34 weekly passenger trips. Transport accessibility is limited, with residents typically located 665 meters from the nearest stop.
Service frequency averages four trips per day across all routes, equating to approximately one weekly trip per individual stop.
Frequently Asked Questions - Transport
Transport Stops Detail
Health
Health performance in Bundaberg North - Gooburrum is a key challenge with a range of health conditions having marked impacts on both younger and older age cohorts
Bundaberg North - Gooburrum faces significant health challenges, with various conditions affecting both younger and older age groups. Private health cover is low, at approximately 46%, compared to the national average of 55.3%.
The most prevalent medical conditions are arthritis (12.9%) and mental health issues (10.3%). Notably, 56.2% reported no medical ailments, slightly lower than the Rest of Qld's 59.1%. The area has a higher proportion of seniors aged 65 and over (29.6%, or 2,339 people), compared to Rest of Qld's 26.3%. Health outcomes among seniors are broadly similar to those of the general population.
Frequently Asked Questions - Health
Cultural Diversity
Bundaberg North - Gooburrum is considerably less culturally diverse than average when assessed alongside AreaSearch's national rankings for language and cultural background related metrics
Bundaberg North-Gooburrum, as of the 2016 Census, had a cultural diversity index below the national average. Its population was predominantly Australian-born citizens: 88.7% were citizens, and 87.4% were born in Australia. English was spoken at home by 95.0% of residents.
Christianity was the dominant religion, with 54.6% adherents, slightly higher than the 54.0% regional average. In terms of ancestry, the top three groups were English (32.2%), Australian (29.1%), and Scottish (8.5%). Notably, German ancestry was overrepresented at 6.8%, compared to the regional figure of 6.4%. Australian Aboriginal ancestry was also slightly higher at 3.5% versus 3.4%, while Maltese ancestry remained steady at 0.4%.
Frequently Asked Questions - Diversity
Age
Bundaberg North - Gooburrum hosts an older demographic, ranking in the top quartile nationwide
Bundaberg North - Gooburrum has a median age of 48, which is higher than Rest of Qld's figure of 41 and significantly higher than Australia's norm of 38. The 75-84 age group makes up 11.4% of the population compared to Rest of Qld's figure, while the 5-14 cohort stands at 8.7%. This concentration in the 75-84 group is well above Australia's national average of 6.0%. Post-2021 Census data shows that the 25 to 34 age group has increased from 11.0% to 12.6%, while the 45 to 54 cohort has declined from 11.3% to 9.3% and the 5 to 14 group has dropped from 10.5% to 8.7%. By 2041, Bundaberg North - Gooburrum is expected to see notable shifts in its age composition, with the 85+ group projected to grow by 84%, reaching 561 people from 305. The aging population dynamic is clear, with those aged 65 and above comprising 58% of projected growth. Conversely, population declines are projected for the 45 to 54 and 5 to 14 age groups.
