Lake Wendouree

Suburb (SAL)

Rest of Vic. / Ballarat


Data Sources ABSValuer GeneralRental BoardACARA Newest Aug 2026 · Refreshed ABS QuickStats SAL21447 How we calculate this
Chart Color Schemes
Loading map data ...
Suburb (SAL) Boundary Analysis

This analysis uses Suburbs and Localities (SAL) boundaries, which can materially differ from Statistical Areas (SA2) even when sharing the same name.

SAL boundaries are defined by Australia Post and the Australian Bureau of Statistics to represent commonly-known suburb names used in postal addresses.

Statistical Areas (SA2) are designed for census data collection and may combine multiple suburbs or use different geographic boundaries. For comprehensive analysis, consider reviewing both boundary types if available.

0 People

est. as @ -- *

2021 Census | -- people

Land Area
--
Land Area
Population Density
--
Density
Unemployment Rate
--
Unemployment
Development
--
Resi Approvals
Get My Report

Sales ActivityProperty Sales Trends in Lake Wendouree

Table Chart PROFILE FAQ

Curious about local property values? Filter the chart to assess the volume and appreciation (including resales) trends and regional comparisons, or scroll to the map below view this information at an individual property level.

Find a Recent Sale
Type Specified (1) | Limit 50

Sales Detail

Loading rental data…

DemographicsPopulation Growth in Lake Wendouree

Table Chart PROFILE FAQ

Lake Wendouree has an estimated 2,704 residents, down from 2,878 at the 2021 Census — a change of 174 people, or 6.0%. The population has thinned by an average 1.3% a year over five years, slower than 99% of areas nationally. That puts 592 residents on each square kilometre. Population is estimated from ABS Estimated Resident Population releases and GNAF address data, re-based from the 2021 Census and updated annually.

Detail

Lake Wendouree's resident count is projected to be approximately 2,704 in May 2026, according to analysis of ABS population adjustments and recent address records verified by AreaSearch since the Census. This represents a decline of 174 people (6.0%) from the 2021 Census count of 2,878 people. The estimate draws on a resident base of 2,703 calculated by AreaSearch using the June 2025 ABS ERP publication, alongside 7 validated new addresses registered after the Census. This population level yields a density of 591 persons per square kilometer, indicating low density with potential space for future construction.

Demographic expansion in recent times was almost exclusively driven by overseas migration. AreaSearch incorporates regional forecasts published in 2024 by the ABS and Geoscience Australia, using 2022 as their starting point. In instances where specific SA2 areas lack this coverage, projections from the VIC State Government released in 2023 are applied using a weighted method to aggregate population growth from LGA down to SA2 divisions. Growth rates across age brackets from these aggregated sources are also projected forward for the years 2032 to 2041. Looking at future patterns, population growth is expected to exceed the median for non-metropolitan areas nationally, with the locality projected to expand by 405 persons by 2041 under these aggregated SA2 projections, representing a total increase of 14.9% over the 16 years.

Frequently Asked Questions - Population

What is the latest population estimate for the suburb of Lake Wendouree?
Total population for the suburb of Lake Wendouree was estimated to be approximately 2,704 as at May 26. This is based upon an estimated resident population of 2,703 from the ABS up to June 2025.
How has the population in the suburb of Lake Wendouree changed since 2021?
The suburb of lake wendouree has lost approximately 174 people and shown a 6.05% decrease from the 2,878 people recorded at the 2021 Census period.
What is the population density in the suburb of Lake Wendouree?
The population density in the suburb of Lake Wendouree is estimated at 591 persons per square kilometer based on the latest population estimate.
How much has the population grown over the past 10 years in the suburb of Lake Wendouree?
Over the past 10 years, the population in the suburb of Lake Wendouree has shown a compound annual growth rate of -0.7% per annum.
What are the main drivers of population growth in the suburb of Lake Wendouree?
Population growth in the suburb of Lake Wendouree is driven by: Overseas migration (100.0%), Natural increase (0.0%), Interstate migration (0.0%). The primary driver is Overseas migration, contributing 100.0% of overall population gains.

Residential SupplyHousing Development & Building Approvals in Lake Wendouree

Table Chart PROFILE FAQ

Detail

Residential construction in the suburb of Lake Wendouree is highly restricted, averaging 1 dwelling approvals annually (amounting to 5 dwellings over the five-year period). This minimal level of building is typical for rural communities with limited housing needs and where construction is naturally constrained by local requirements and utility access. The restricted volume of data means individual building approvals can heavily distort yearly growth metrics and comparisons. The volume of construction in the suburb of Lake Wendouree is substantially lower than that of the Rest of Vic.. This level of activity is also below national benchmarks.

Recent approvals consist solely of detached houses, focusing on family-oriented options for those desiring a rural environment and extra land. New building projects show a stronger preference for standalone homes than current housing stock metrics (79.0% at Census), indicating sustained interest in family residences. The ratio of 5441 people per dwelling approval highlights this quiet, low-scale building environment. Long-term projections indicate that the suburb of Lake Wendouree will gain 404 residents by 2041, based on the most recent quarterly estimate from AreaSearch. If building activity remains at its current pace, housing availability may fall behind population increases, potentially intensifying competition among buyers and supporting price growth.

Frequently Asked Questions - Development

How many dwelling approvals have occurred in the suburb of Lake Wendouree recently?
Dwelling approval activity in the the suburb of Lake Wendouree area has seen 1 residential approvals over the past two financial years, based on AreaSearch's SA2 aggregation method. The suburb of Lake Wendouree's current population of 2,704 has been supported by 1 approvals on average over recent years.
How does the suburb of Lake Wendouree's development activity compare to the broader region?
The suburb of Lake Wendouree has seen 0.03 approvals per 100 people in recent years, compared to 0.82 approvals in the broader region. This means that one dwelling has been approved for every 5441 people in the suburb of Lake Wendouree, compared to one for every 156 in the broader region.
Is the suburb of Lake Wendouree keeping up with housing demand?
With the population expected to increase by 404 people by 2041, around 202 new dwellings will be necessary. Recent approval levels may be insufficient to meet these forecasts, considering the census average of 2.0 persons per dwelling. This indicates potential housing shortages if current approval trends continue.
What has been the trend in development approvals over the past five years in the suburb of Lake Wendouree?
Looking at development activity over the past five years, the suburb of Lake Wendouree's approval levels have been significantly below the yearly average of 1, showing a notable downturn in recent development.
How many dwellings will be needed to accommodate future population growth in the suburb of Lake Wendouree?
The population in the suburb of Lake Wendouree is expected to grow by 404 people by 2041, necessitating approximately 202 new dwellings. This calculation is based on the current census average of 2.0 persons per dwelling in the area.
How does recent development compare to population growth in the suburb of Lake Wendouree?
Over the past five years, the suburb of Lake Wendouree has seen 5 residential approvals while population has remained stable or declined, indicating potential market oversupply.
Are there opportunities for residential developers in the suburb of Lake Wendouree?
With dwelling approval activity running at an average of 1 approvals per year and a population of 2,704, there appears to be a supply shortfall relative to projected demand, presenting strong opportunities for residential developers. With the population expected to increase by 404 people by 2041, around 202 new dwellings will be necessary. Current approval trends may be insufficient to meet forecast demand, indicating strong development opportunities.
Approvals Pipeline Development applications near Lake Wendouree

Development applications around Lake Wendouree

Development approvals is a new addition to AreaSearch. We’re actively expanding council coverage and refining the dataset — details and statuses for some councils may be partial. Check back regularly for the latest pipeline.
Application search is not available in Victoria. AreaSearch holds 15 applications for Lake Wendouree, but they are a record of past activity rather than a current register. Victoria has no state-wide planning portal and its council coverage is uneven, so we have switched the search off here rather than return partial answers. We are currently investigating a solution. No credits are charged for Victorian applications, and building approvals from the ABS and the major projects we track are unaffected.

SOURCE: Planning portals and council registers, compiled by AreaSearch. Distance & bearing measured from the suburb midpoint.

Project PipelineInfrastructure & Major Projects in Lake Wendouree

PROFILE FAQ

AreaSearch tracks 42 current infrastructure and development projects close to Lake Wendouree, worth an estimated $5.85 billion. 10 are already under construction and 15 are due for completion within three years. The pipeline spans communities, precincts & urban renewal, transport & logistics and residential development. Records are compiled from Infrastructure Australia, state agencies, council planning portals and public announcements, reviewed and updated daily, then ranked by proximity, construction stage, completion horizon and project scale.

Detail

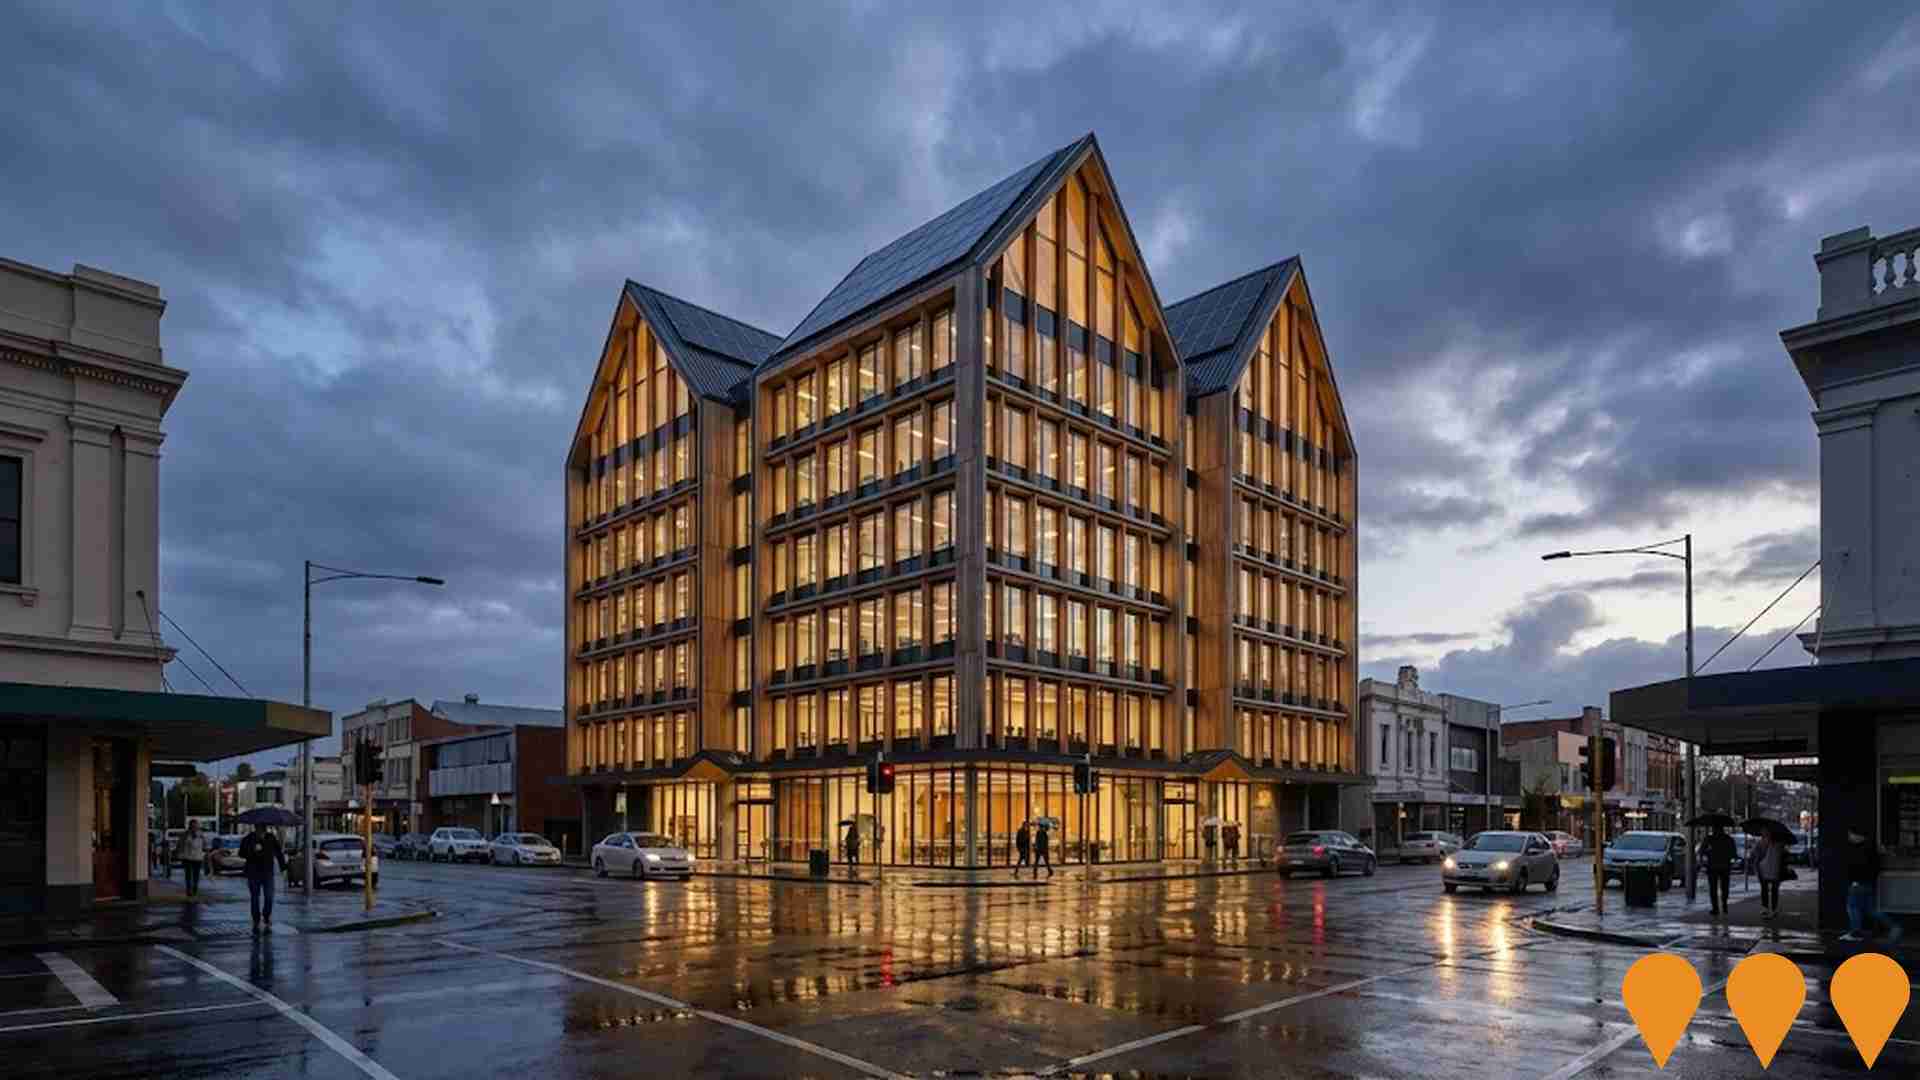
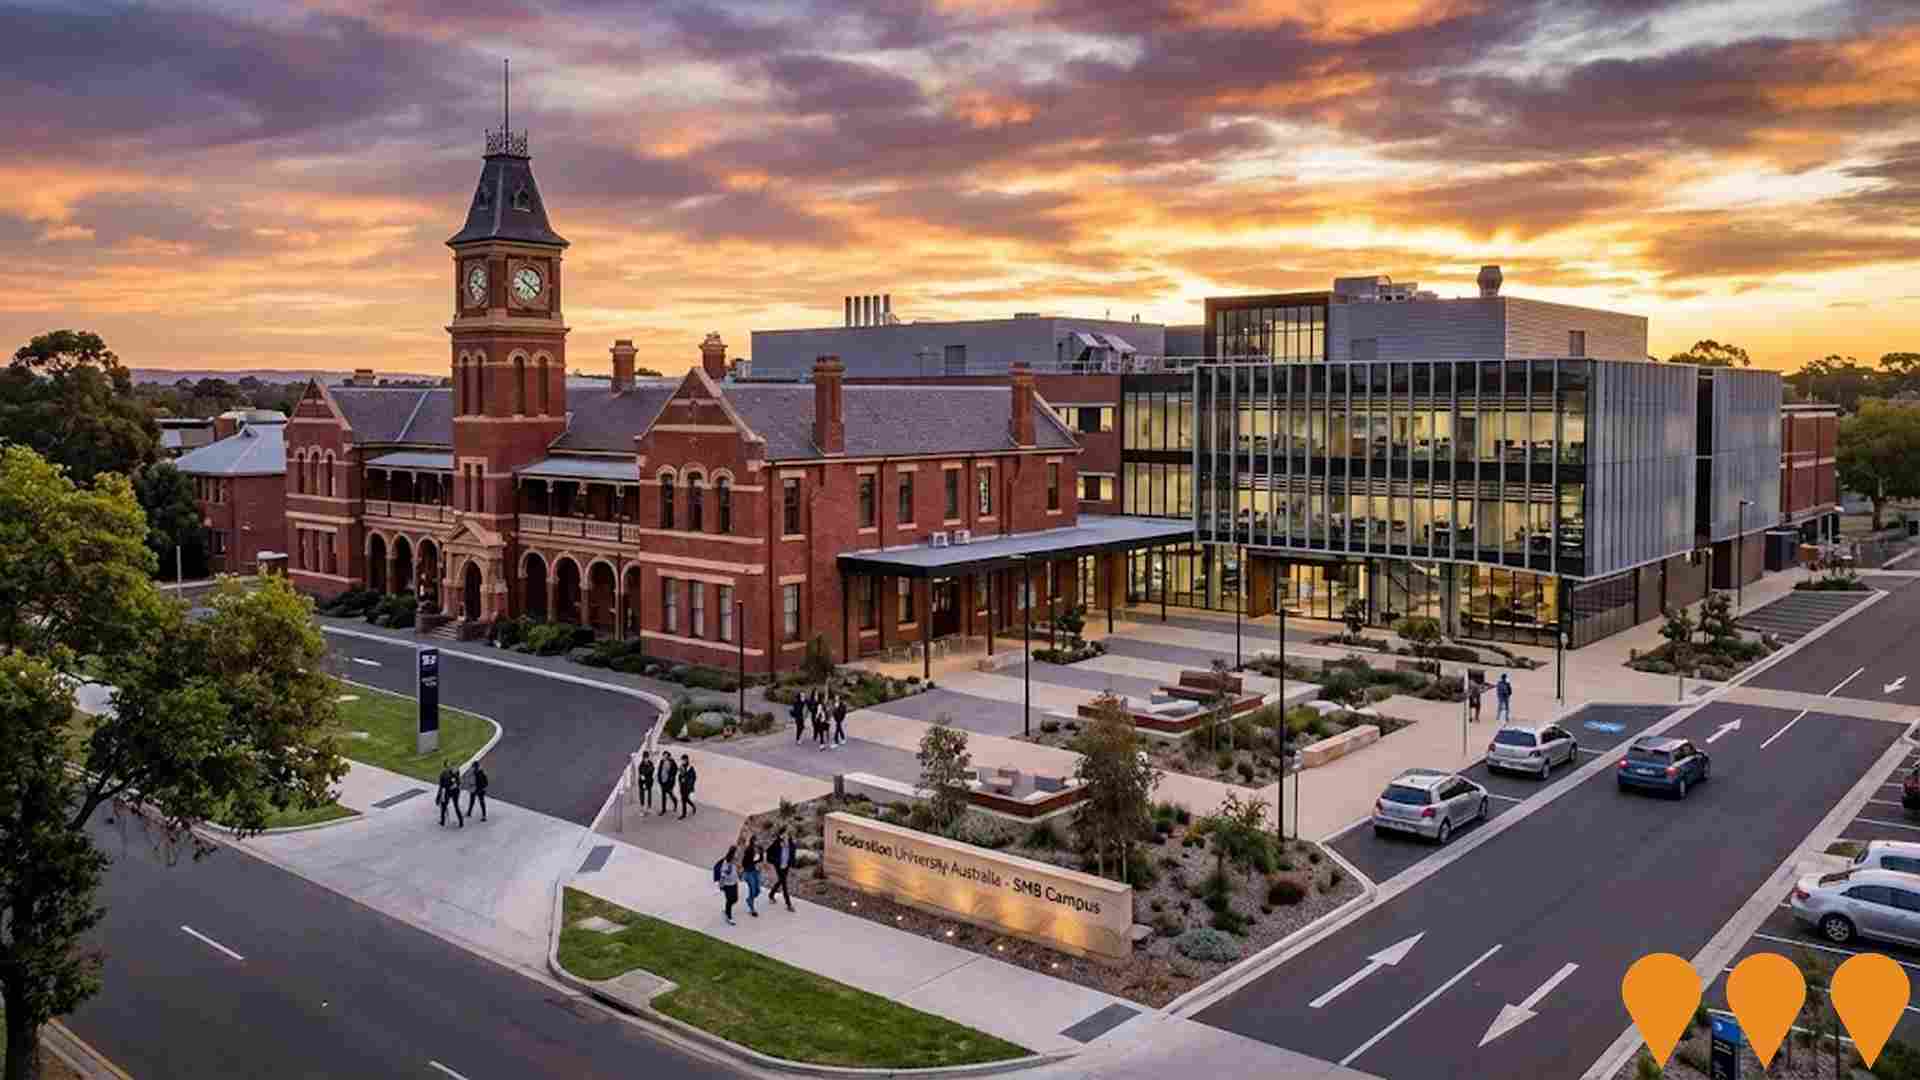
Changes in local infrastructure, significant construction projects, and zoning amendments are major drivers of regional performance. AreaSearch has identified 7 projects that are likely to impact this locality. The primary developments include the Ballarat Base Hospital Redevelopment, the Federation University SMB Campus Redevelopment, the Ballarat Co-Operative Education and Skills City Centre, and the Ballarat Major Events Precinct Upgrades, with details of the most significant initiatives provided below.

Professional plan users can use the search below to filter and access additional projects.

INFRASTRUCTURE SEARCH

All Selected

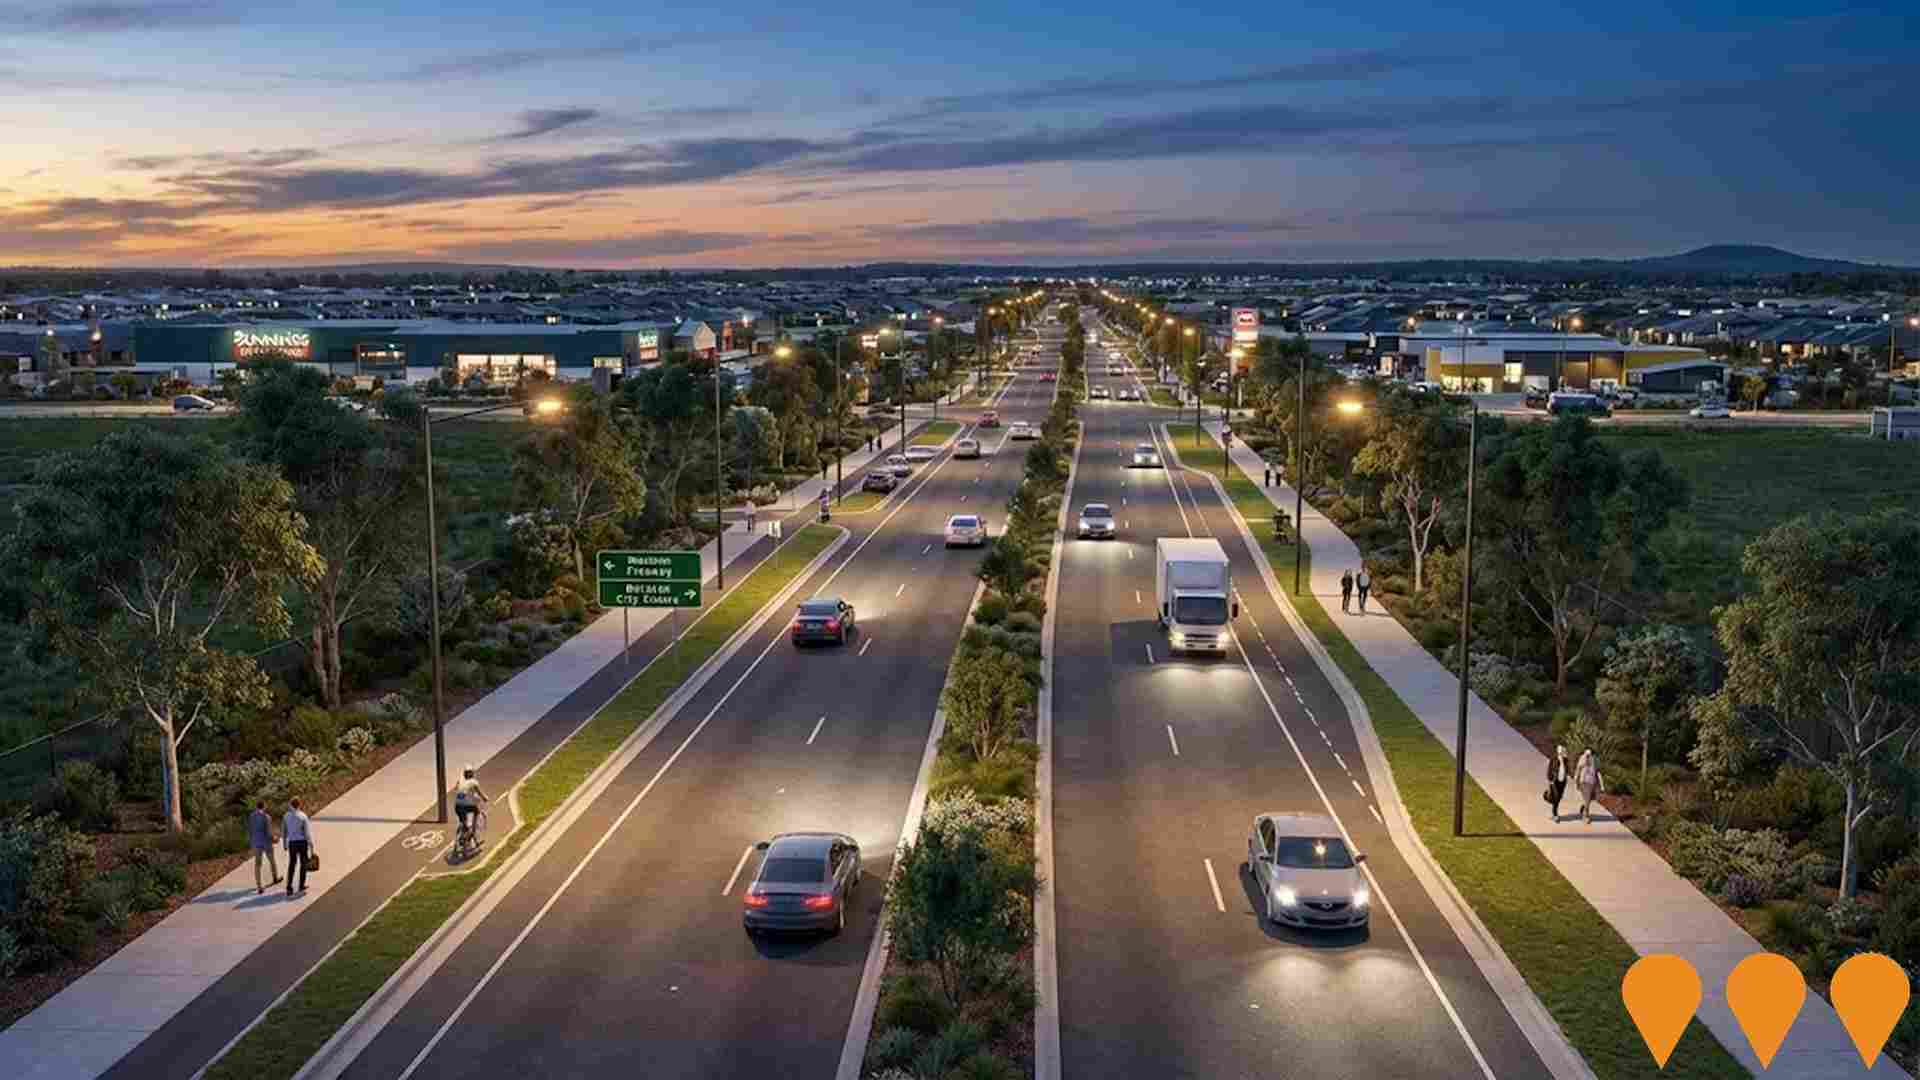
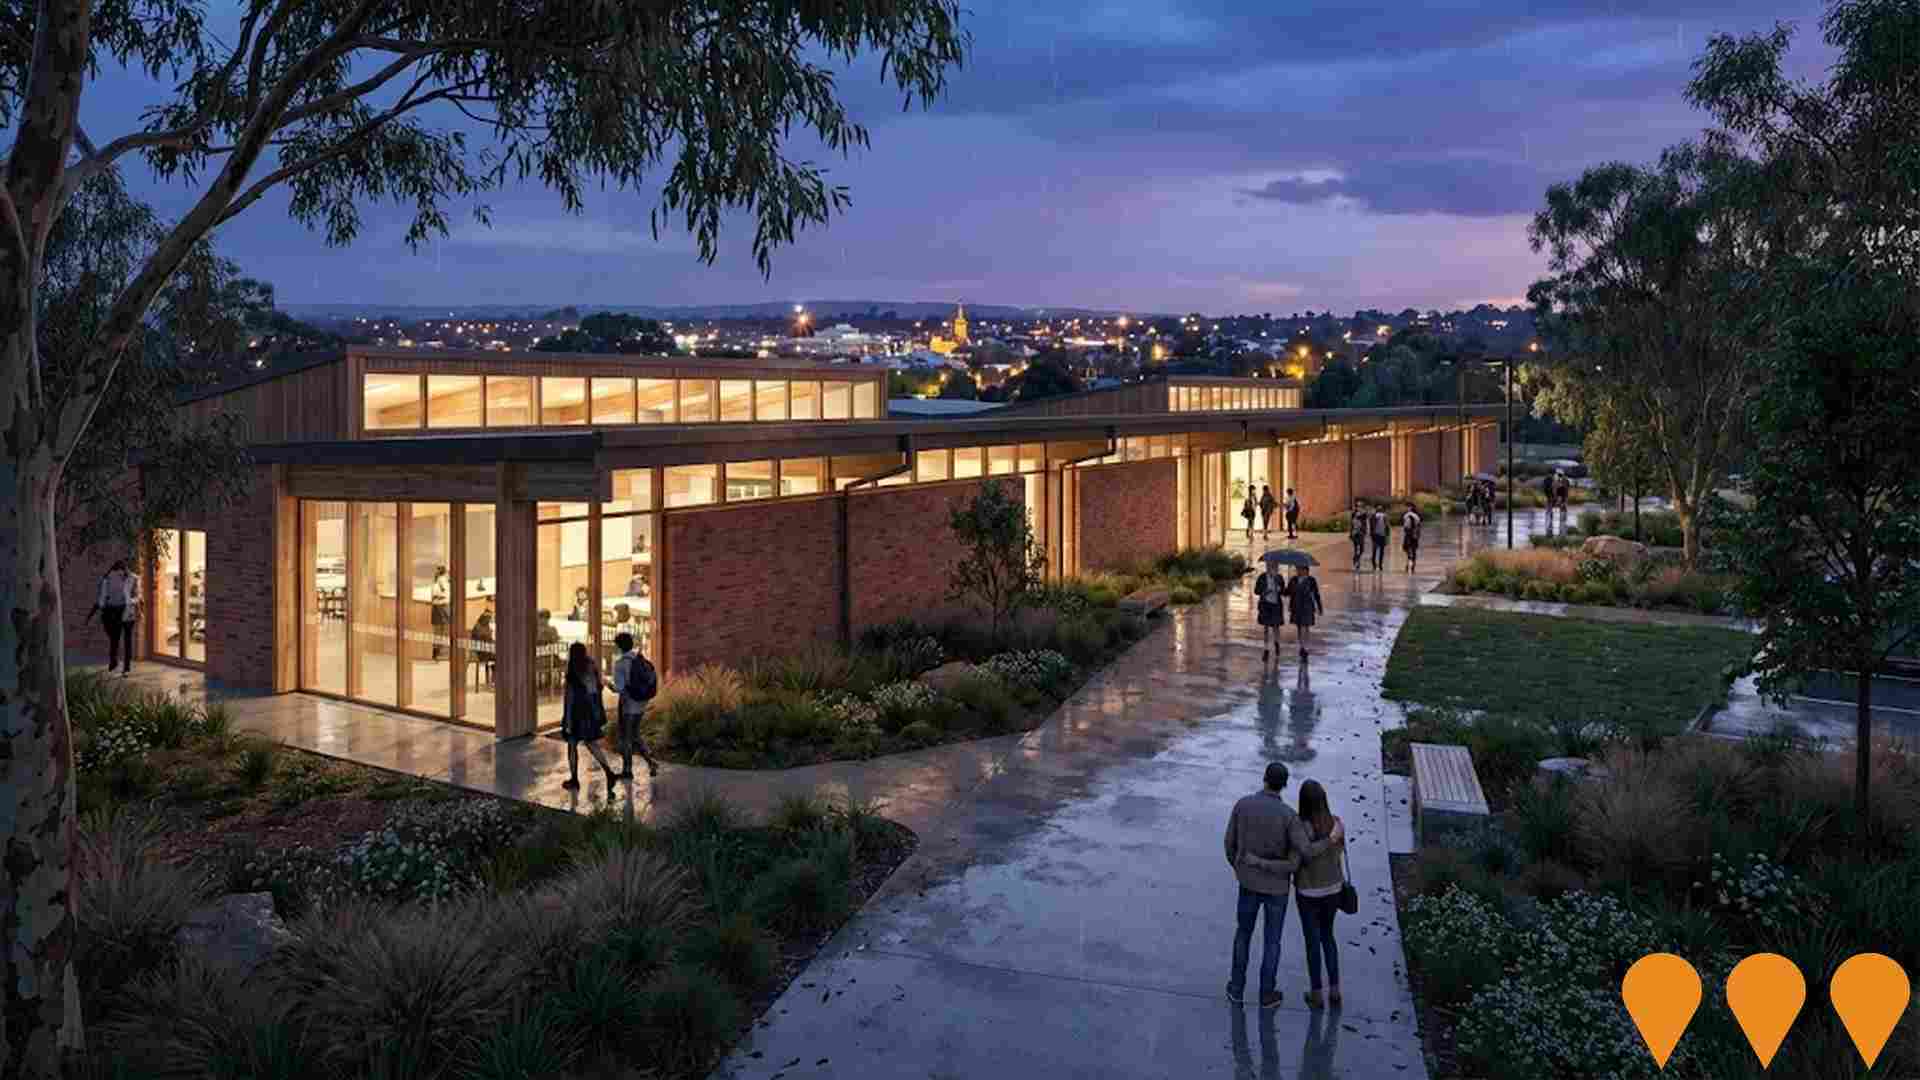
AI Generated Denotes AI-based impression for illustrative purposes only, not to be taken as definitive under any circumstances. Please follow links and conduct other investigations from the project's source for actual imagery. Developers and project owners wishing us to use original imagery please Contact Us and we will do so.

Frequently Asked Questions - Infrastructure

What are some of the major infrastructure and planning changes likely to influence the suburb of Lake Wendouree?
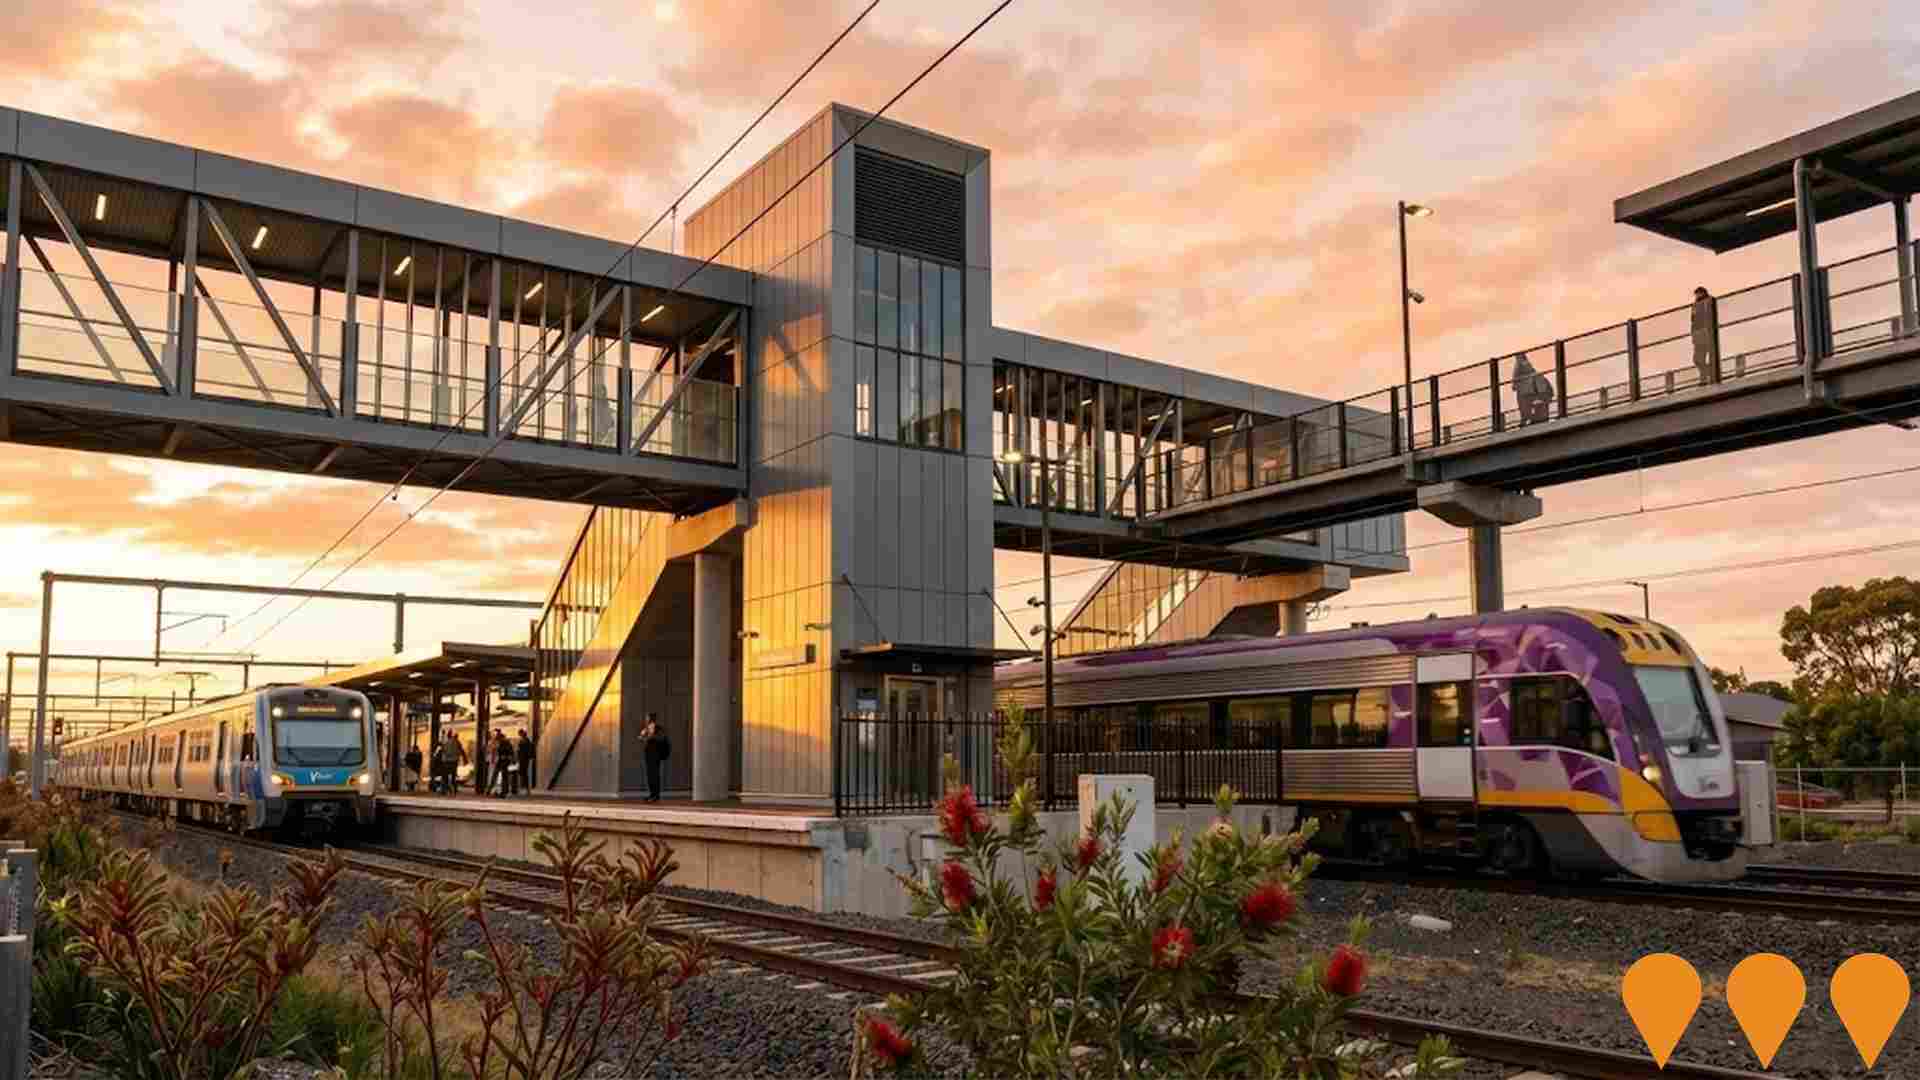
Key infrastructure and planning changes likely to influence the suburb of Lake Wendouree include: Ballarat Base Hospital Redevelopment (Construction); Federation University SMB Campus Redevelopment (Planning); Ballarat Co-Operative Education and Skills City Centre (Planning); Ballarat Major Events Precinct Upgrades (Construction); and Ballarat Line Upgrade (Completed). These projects represent significant developments that will shape the area's future infrastructure landscape.
What types of infrastructure projects are impacting the suburb of Lake Wendouree?
Infrastructure development impacting the suburb of Lake Wendouree spans multiple sectors including Transport & Logistics, Education & Training, and Communities, Precincts & Urban Renewal, among others.
What is the scale of infrastructure investment impacting the suburb of Lake Wendouree?
Infrastructure investment analysis indicates substantial capital deployment exceeding $5.6 billion in projects that will impact the extended area, with a notable concentration of investment within the immediate the suburb of Lake Wendouree vicinity.
How does the suburb of Lake Wendouree's infrastructure development compare to other areas?
The suburb of Lake Wendouree ranks in the top 20% nationally for infrastructure development, reflecting exceptional investment activity compared to similar areas across the country.
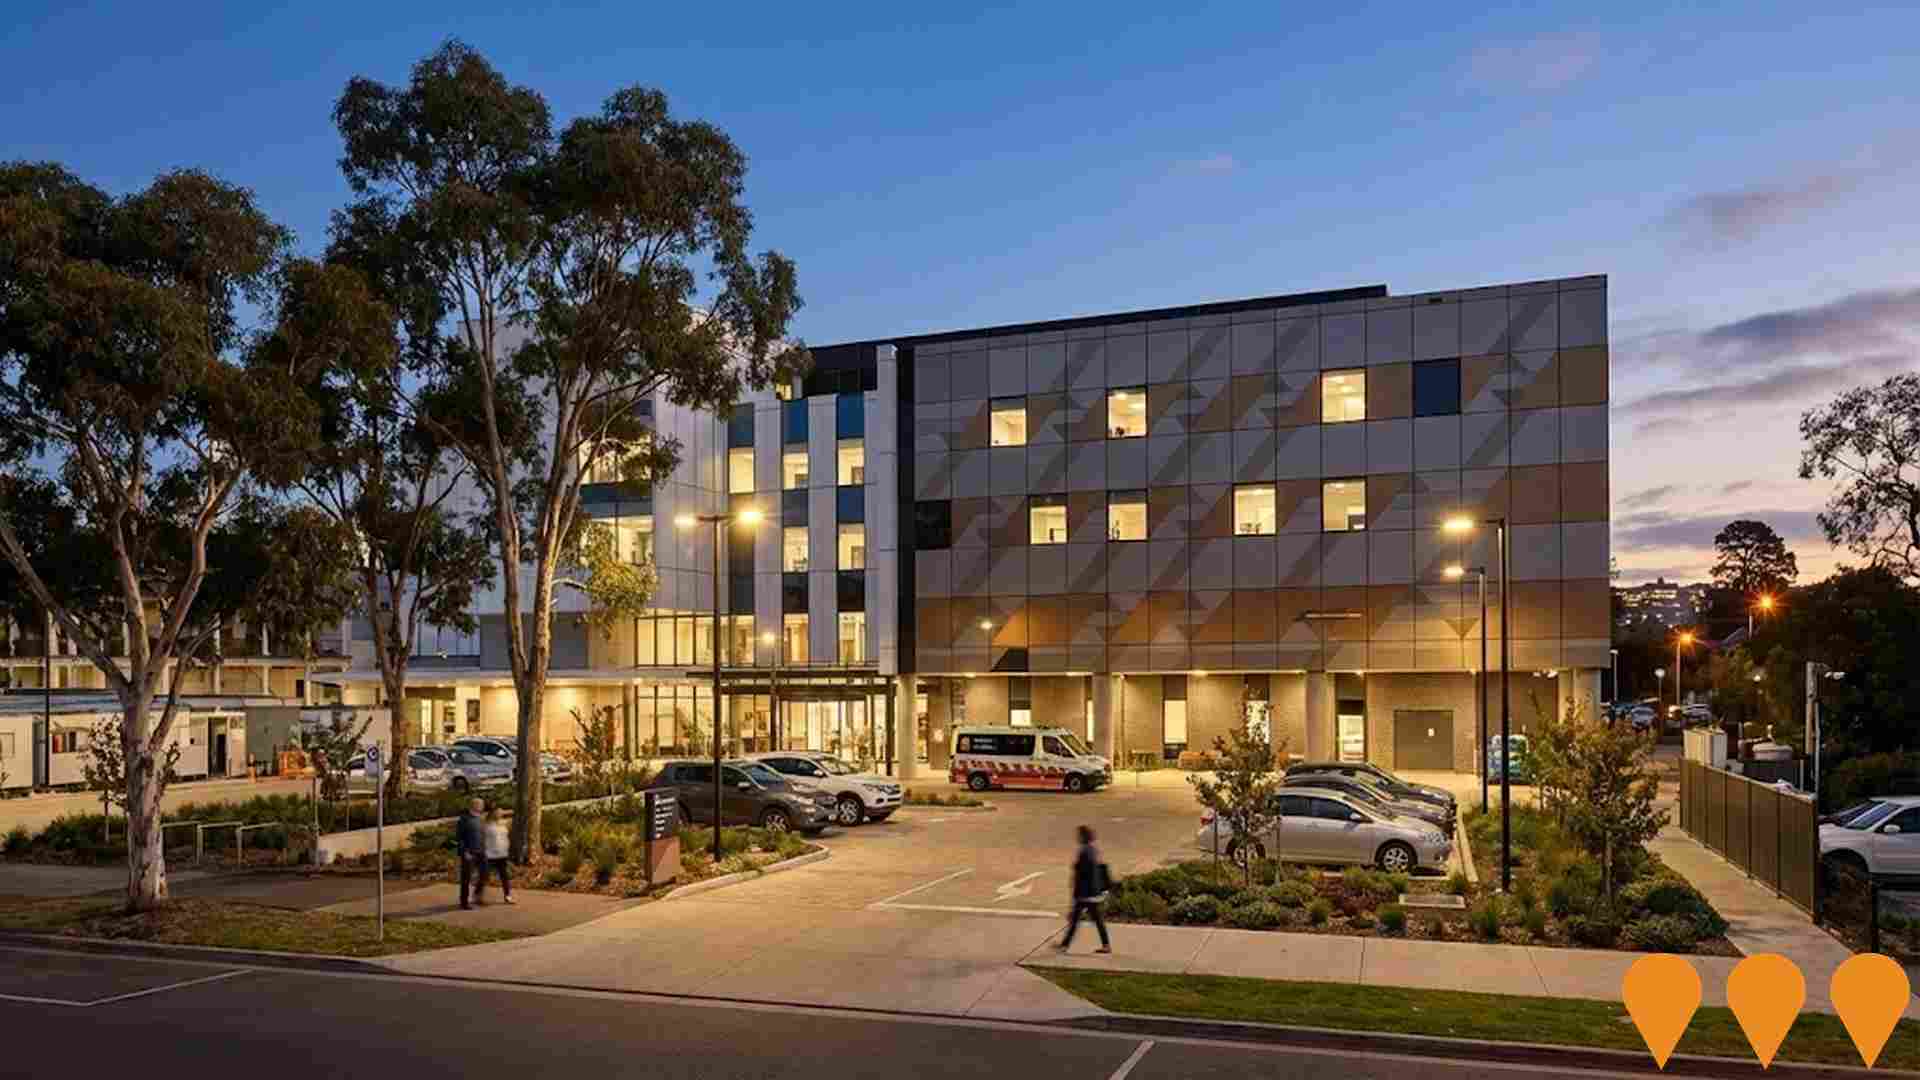
Ballarat Base Hospital Redevelopment
Category: Health
Stage: Construction | Est. Comp: 2027
Source / Links: Link 1   Link 2  

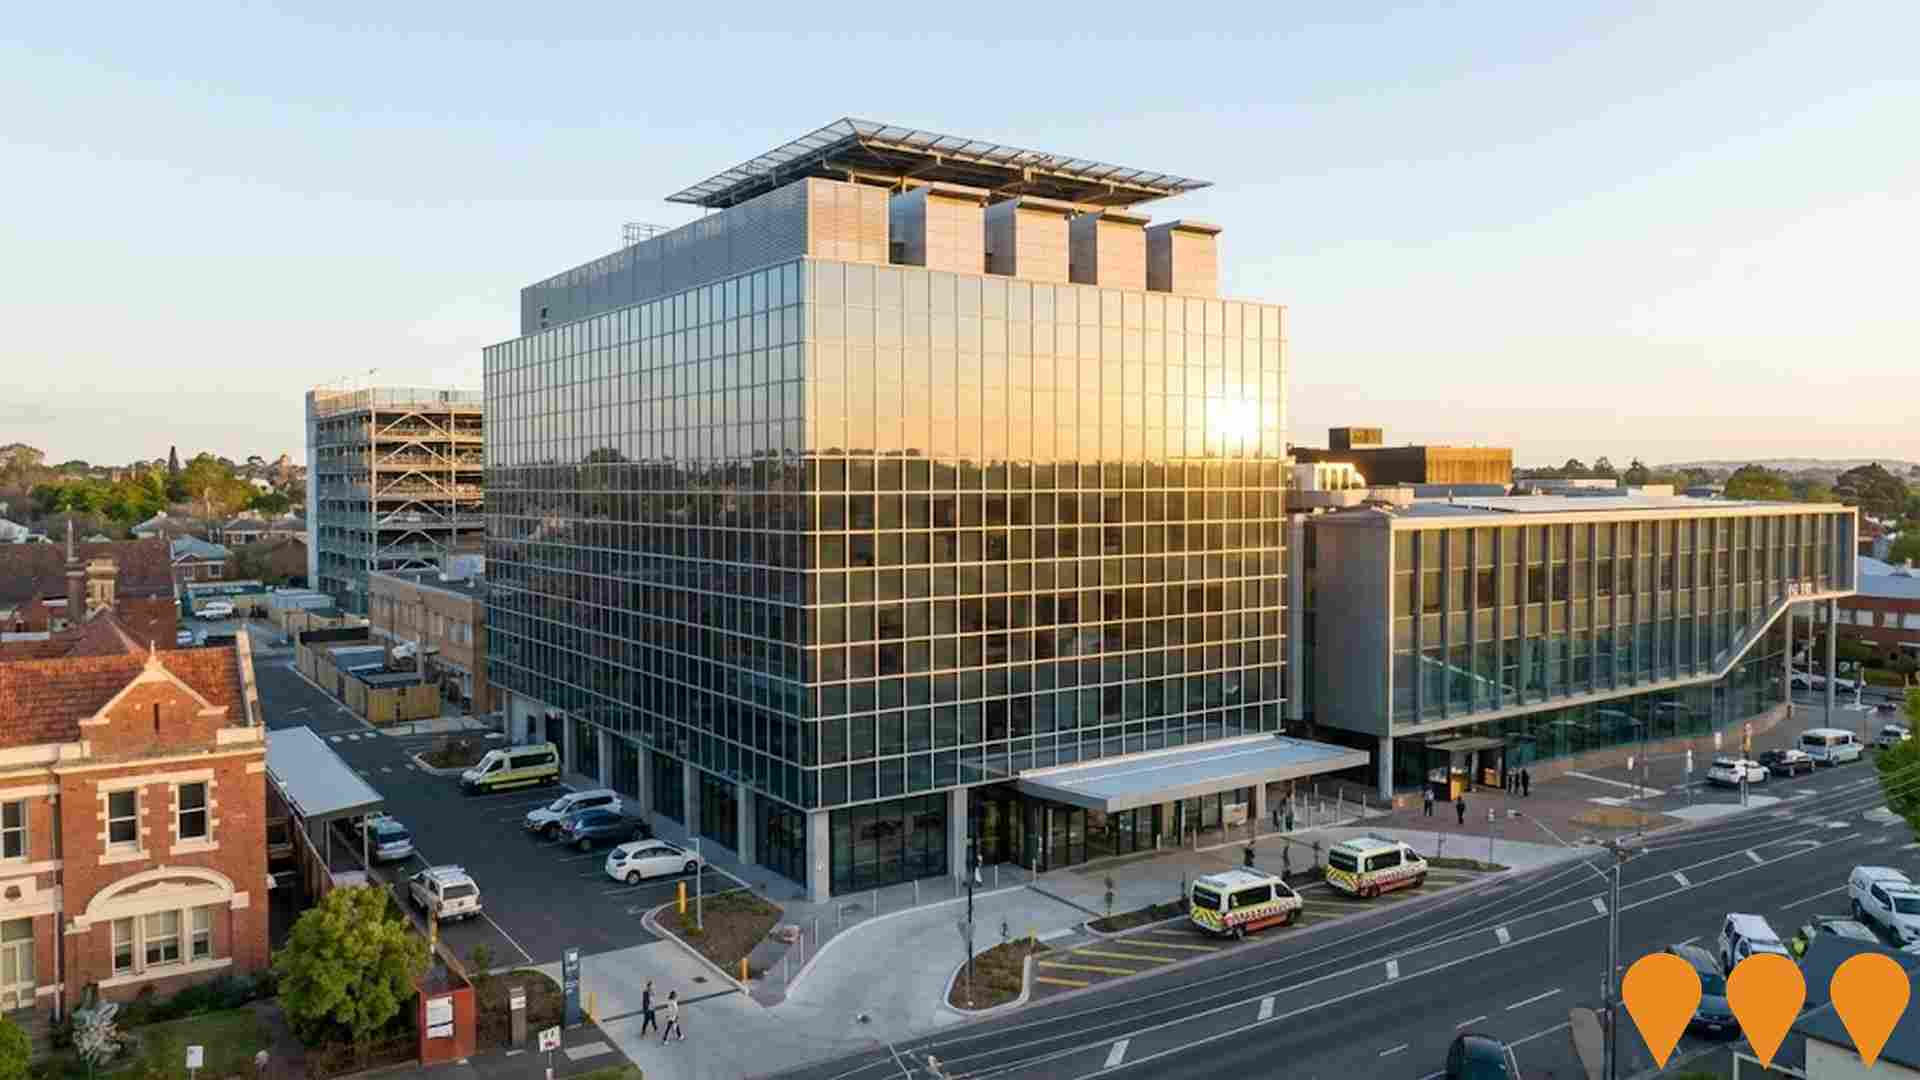
The $655 million Ballarat Base Hospital Redevelopment is in its third and final stage, building a new seven-level hospital tower delivered by Built in partnership with the Victorian Health Building Authority and Grampians Health. The tower will include a new main entrance off Sturt Street, a new emergency department with an integrated mental health, alcohol and other drugs hub, a women and children's hub, a state-of-the-art operating theatre suite, an expanded critical care floor, a new helipad, and around 100 extra inpatient and short stay beds.As of late 2025, structural works on the new tower are well advanced, with vertical concrete pours progressing and four tower cranes operating on site. Earlier stages have already delivered a six-storey central energy plant and support services building on Drummond Street, and an expanded multi-deck carpark adding 400 spaces. Once complete, the upgraded hospital will treat at least 18,000 more emergency patients and 14,500 additional inpatients per year, supporting around 4,000 extra surgeries annually. The project is on track for completion in 2027.
Health

Ballarat Major Events Precinct Upgrades
Category: Sports & Recreation
Stage: Construction | Est. Comp: 2026
Source / Links: Link 1   Link 2  

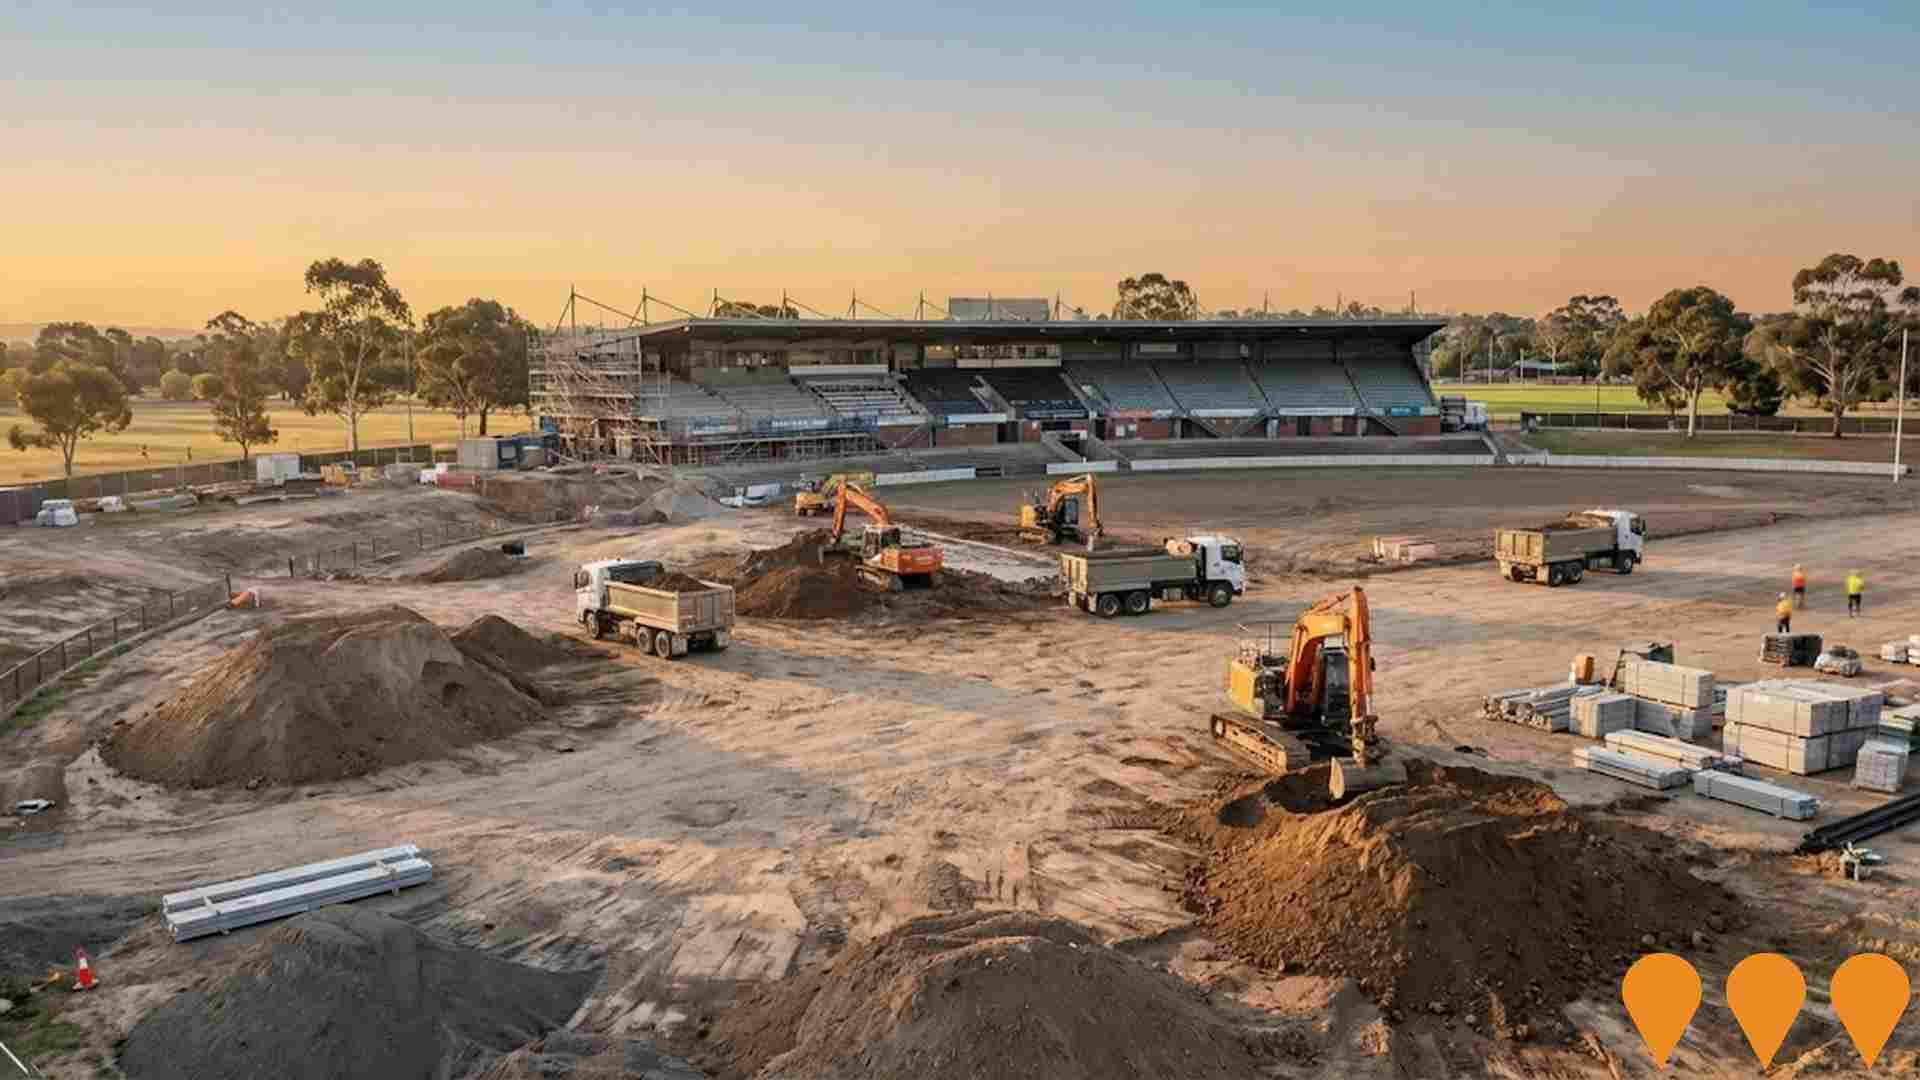
The Ballarat Major Events Precinct project involves a major redevelopment of Mars Stadium and the surrounding Eureka Sports Precinct in Wendouree. Delivered by Development Victoria in partnership with the City of Ballarat and Wadawurrung Traditional Owners Aboriginal Corporation, the project includes 5,000 new permanent seats at Mars Stadium (increasing total capacity to 10,000) and a new Ballarat Regional Athletics Centre on the former showgrounds site with a synthetic track, pavilion, and light towers. It also features accessibility improvements, water-sensitive urban design, and extensive landscaping.The design highlights a structural timber roof and Wadawurrung-inspired brickwork patterning. Construction is underway and expected to be completed in late 2026.
Sports & Recreation

Wendouree Station Precinct Structure Plan and Urban Design Framework
Category: Precincts & Urban Renewal
Stage: Planning | Est. Comp: 2028
Source / Links: Link 1   Link 2  

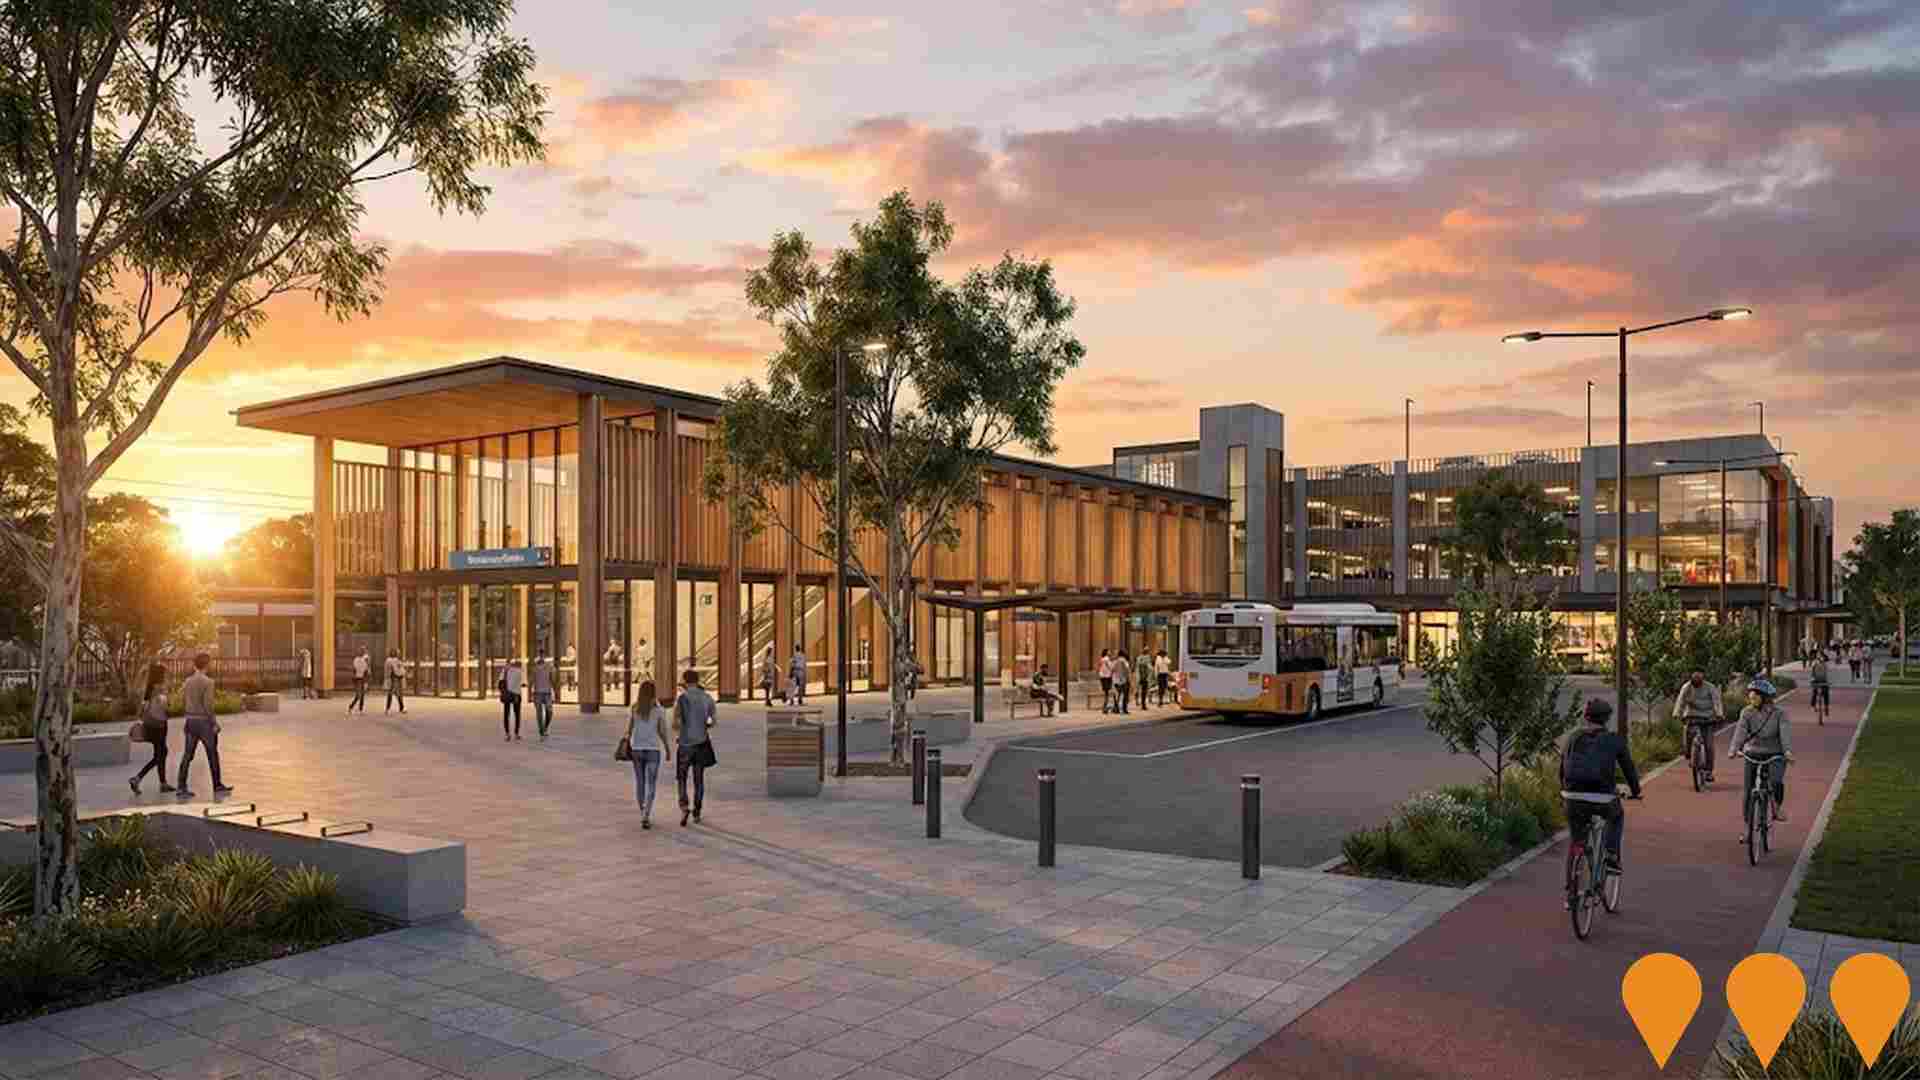
The City of Ballarat is preparing a new Precinct Structure Plan and Urban Design Framework for the Wendouree Station precinct as part of its Urban Renewal Program, initiated in 2024. The plan will guide land use, built form, housing development, employment retention and growth, transport integration, contamination management, and environmental and heritage outcomes around Wendouree train station. It supersedes the 2019 Wendouree Station Masterplan and will provide the strategic justification required to amend the Ballarat Planning Scheme.Community engagement is planned in two stages, commencing late 2025, including a Discussion Paper followed by a Draft Structure Plan and Urban Design Framework for public comment.
Precincts & Urban Renewal

Albert Street Social Housing Development
Category: Residential Development
Stage: Approved | Est. Comp: 2026
Source / Links: Link 1   Link 2  

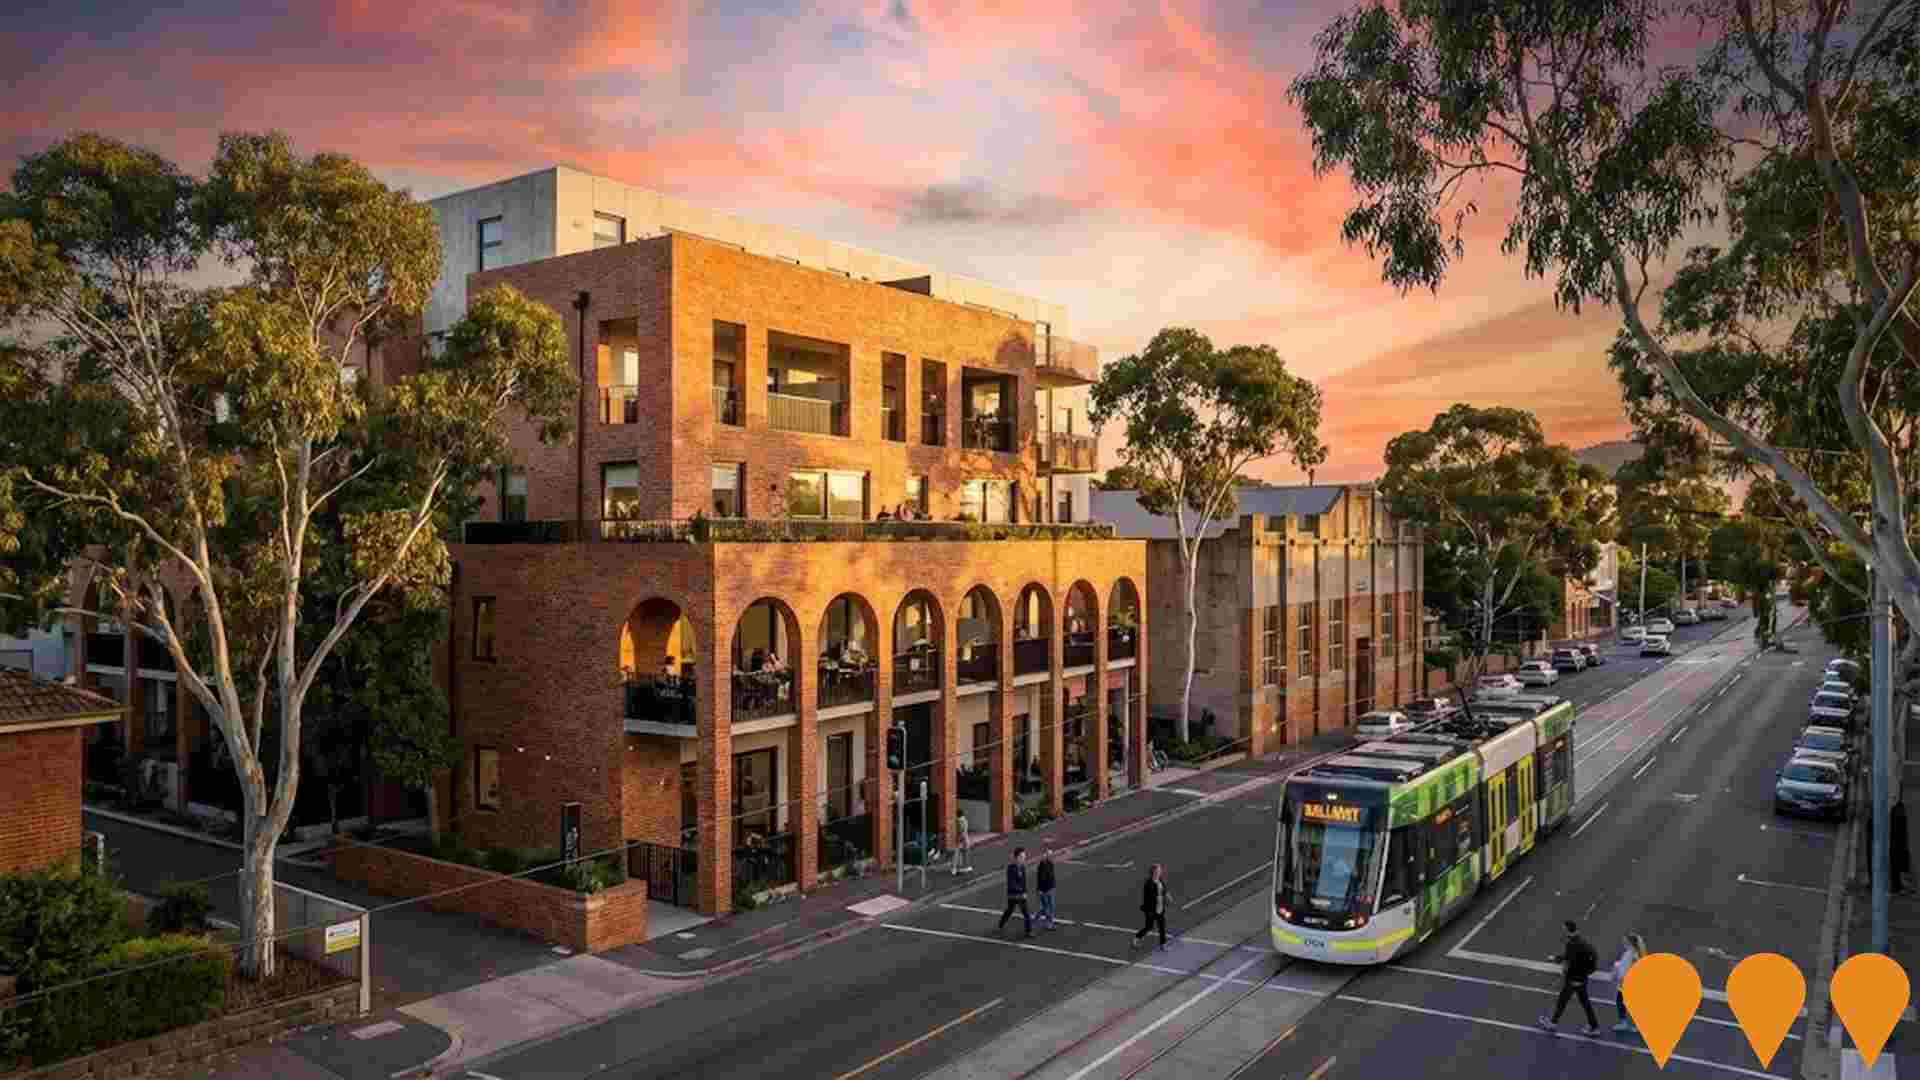
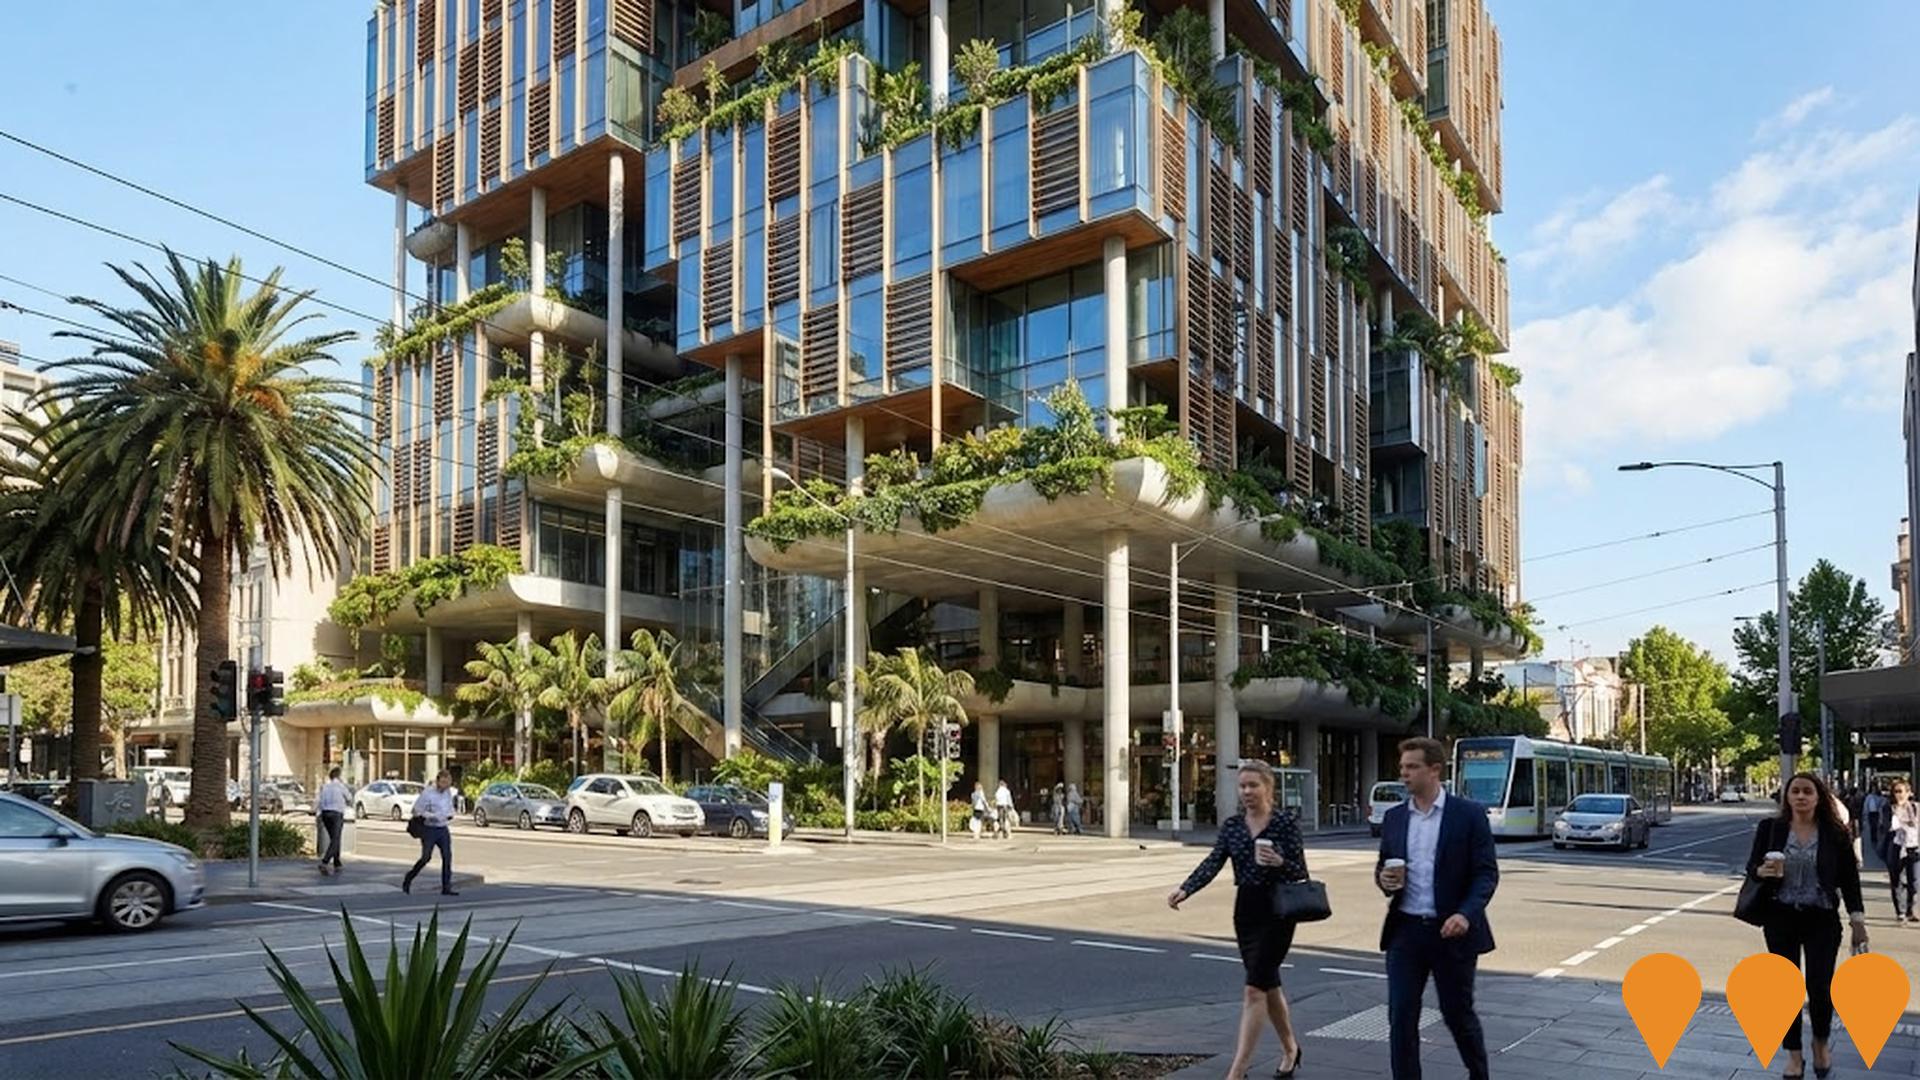
A $15.5 million social and affordable housing development at 119 Albert Street, Ballarat. Delivered by Uniting Housing and designed by MGS Architects, the four-storey building provides 24 new one- and two-bedroom apartments to support vulnerable people on the Victorian Housing Register.
Residential Development

Eastwood Community Hub
Category: Communities, Precincts & Urban Renewal
Stage: Construction | Est. Comp: 2027
Source / Links: Link 1   Link 2  

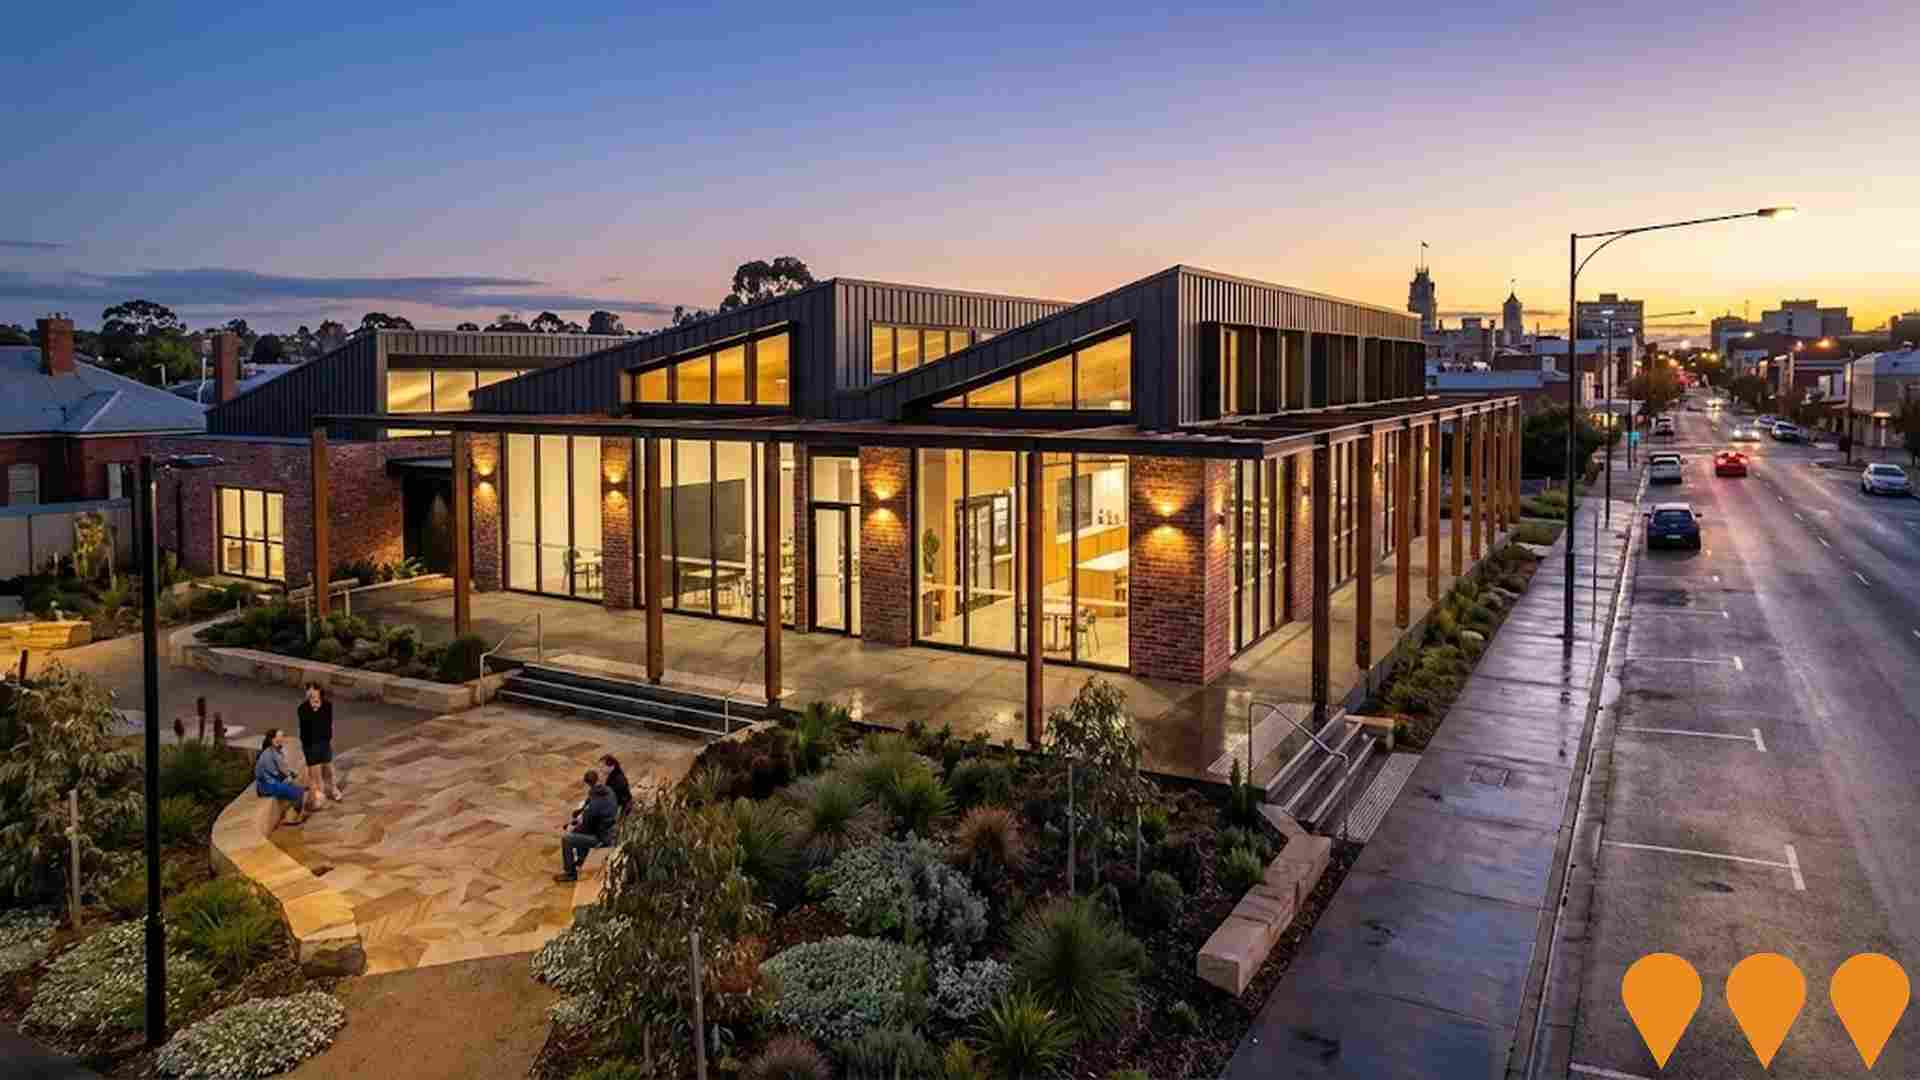
A $17.54 million redevelopment of the Eastwood Leisure Complex in central Ballarat, replacing the 1940s-era facility with a contemporary, fully accessible multipurpose community hub. Jointly funded by the City of Ballarat and the Federal Government's Growing Regions Program, the project involves demolishing the outdated buildings, while retaining and recladding the existing basketball stadium. The new hub features a main hall for 275 people, training rooms, flexible meeting spaces, a conference and event space, and a 5-star Green Star target.
Communities, Precincts & Urban Renewal

Learmonth Road Retail Hub
Category: Precincts & Urban Renewal
Stage: Completed | Est. Comp: 2026
Source / Links: Link 1   Link 2  

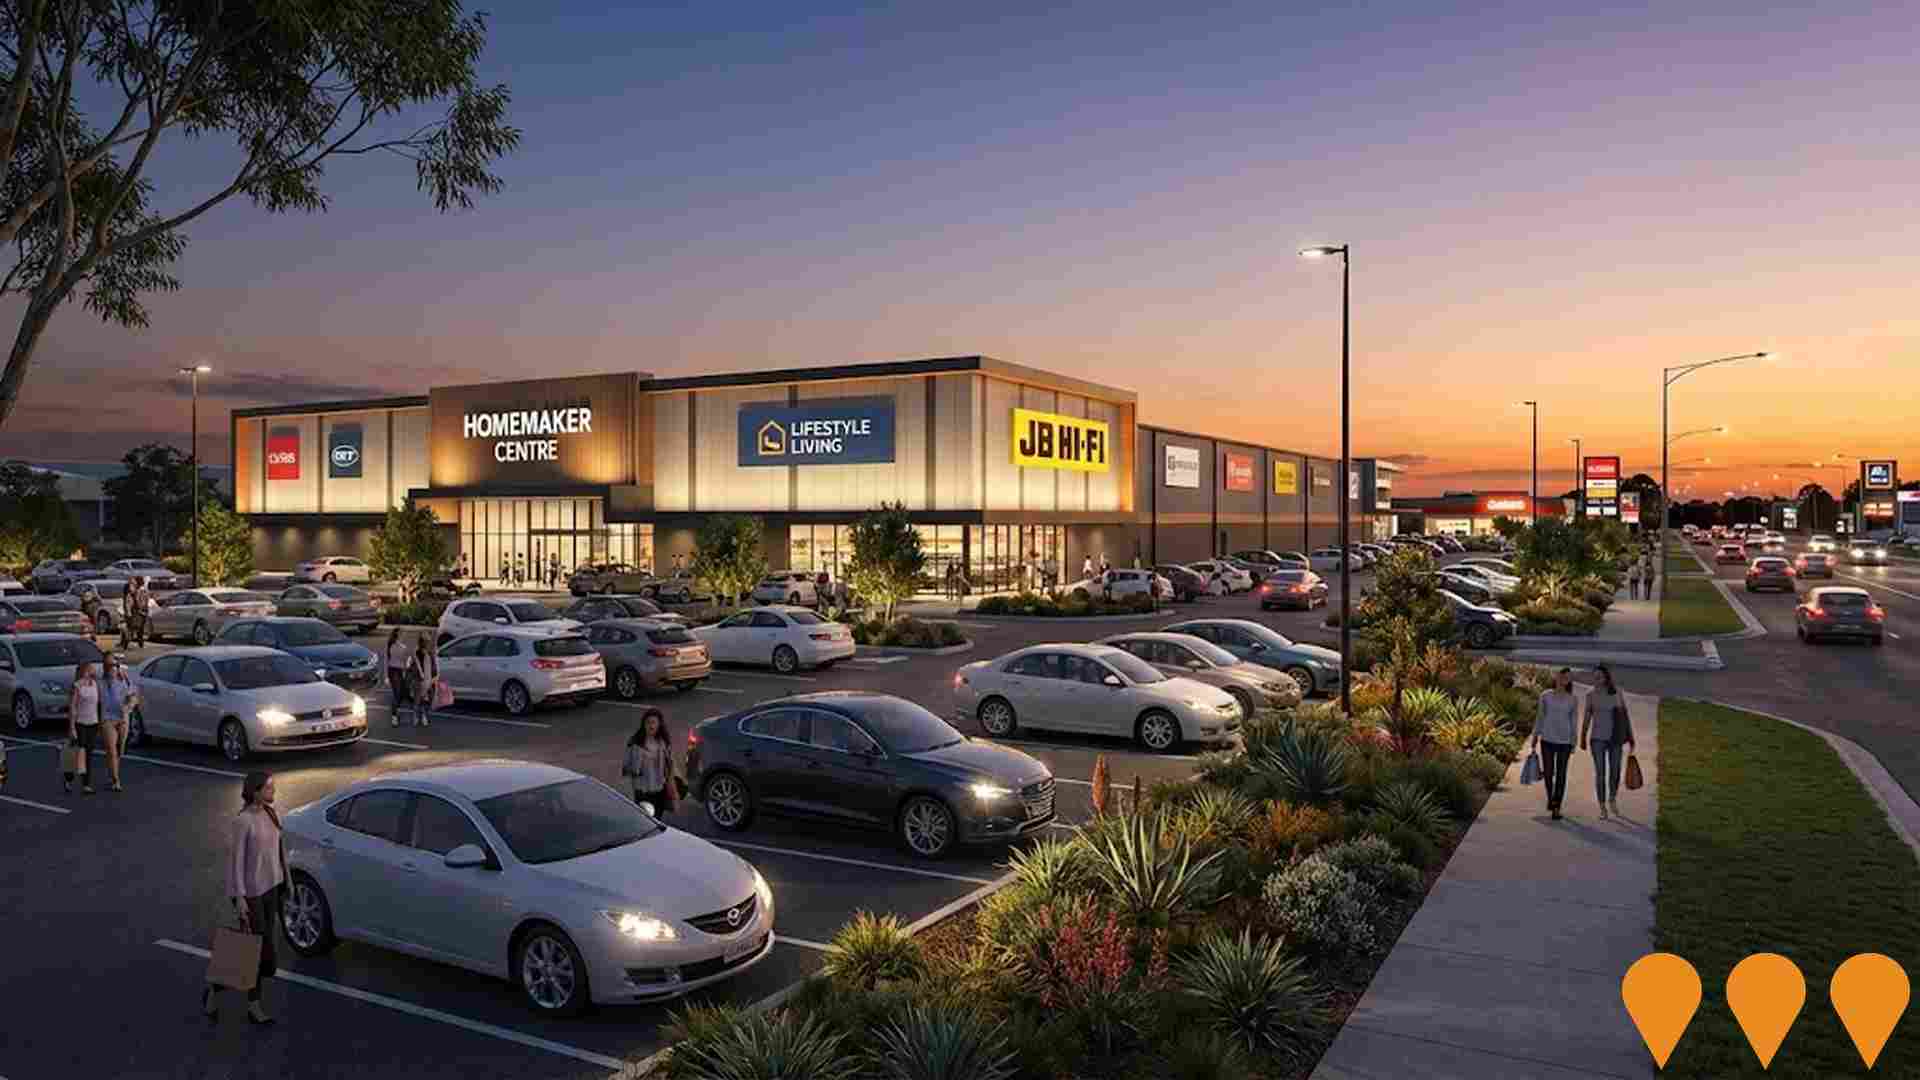
A large-format retail destination in Wendouree spanning approximately 29,450 square metres, completed in early 2026. Designed for homemaker and lifestyle brands, the centre features over 360 on-site car parks and tenancies ranging from 1,000 to 2,700 square metres. Tenants include Amart Furniture, Forty Winks, Pillow Talk, Nick Scali, Eureka Furniture, Suave, Adriatic Furniture, and discount retailer Choice. The site occupies a strategic golden mile location on Learmonth Road with high visibility and approximately 20,000 daily passing vehicles.
Precincts & Urban Renewal

La Trobe Street Saleyards Redevelopment
Category: Communities, Precincts & Urban Renewal
Stage: Construction | Est. Comp: 2028
Source / Links: Link 1   Link 2  

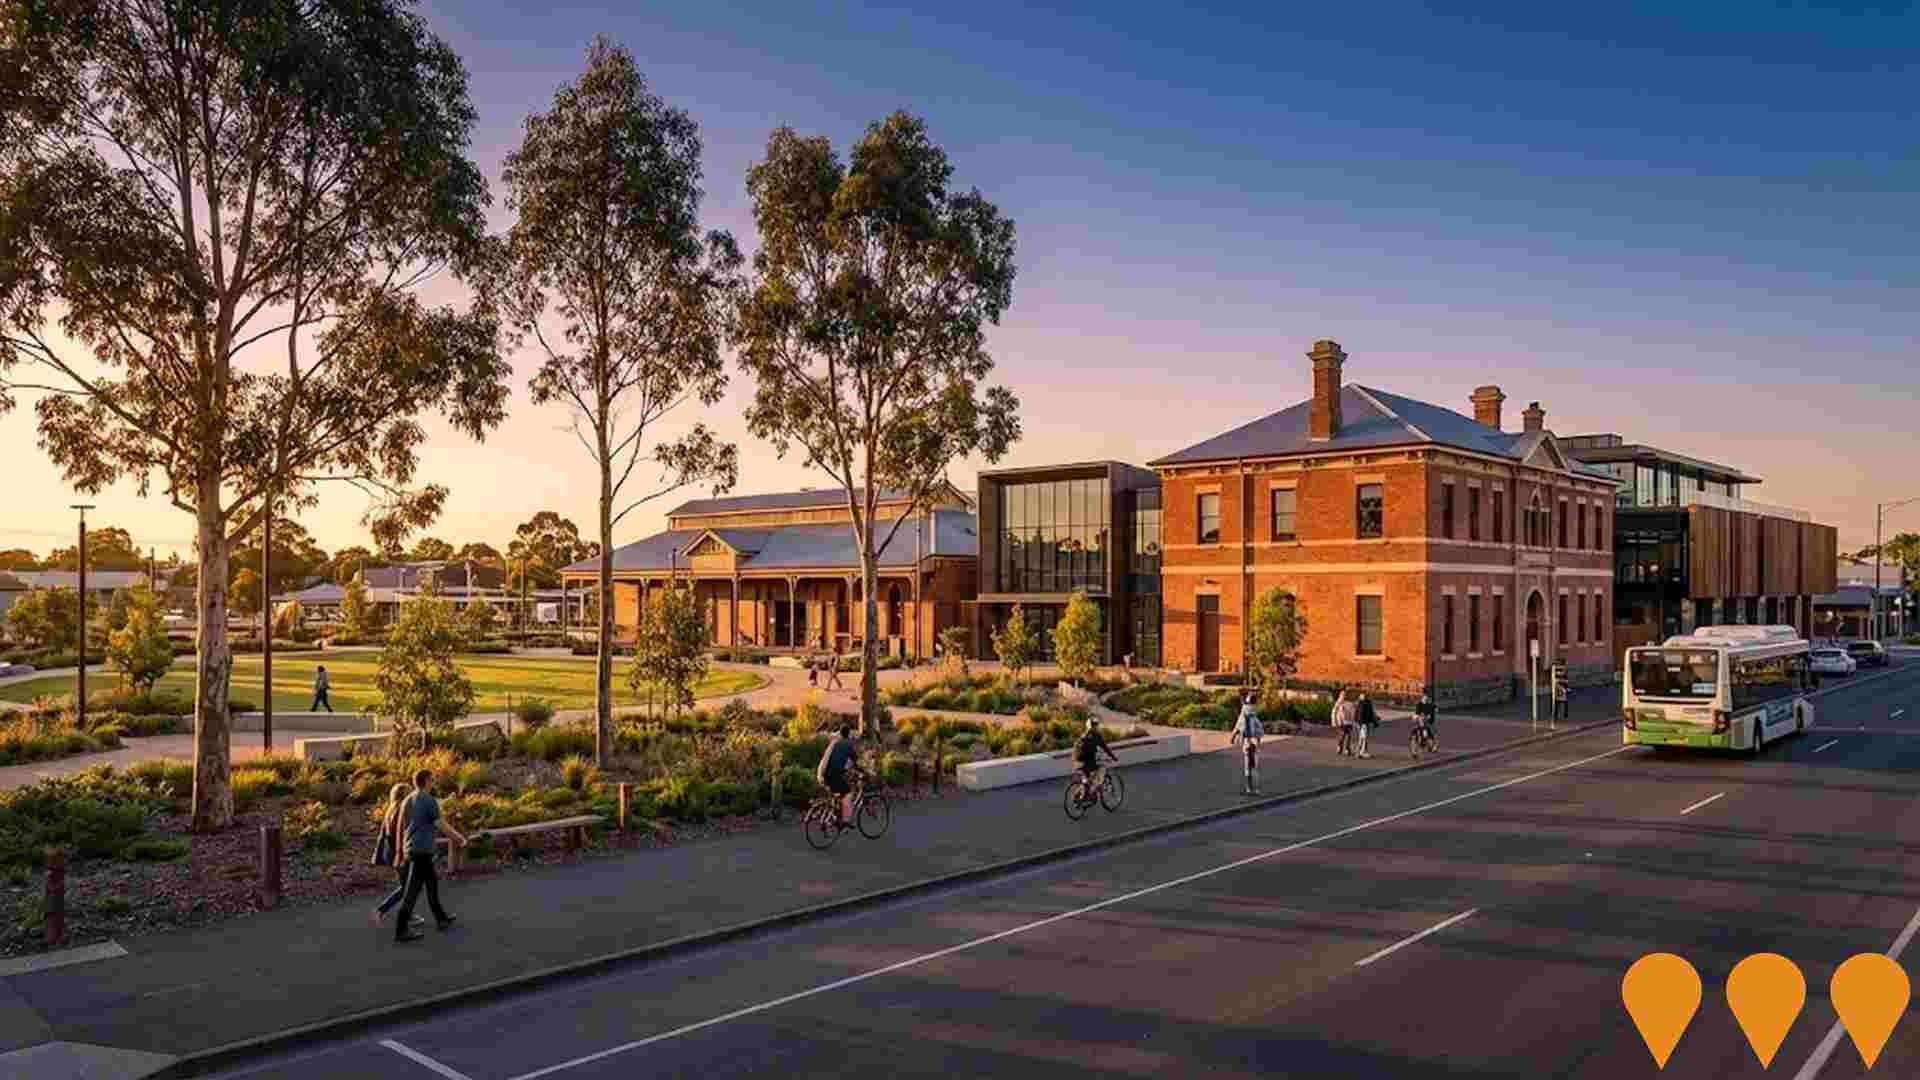
Redevelopment of the historic 12-hectare former Ballarat Saleyards site into a revitalized precinct for employment, creative industries, and residential use. Following its closure in 2018, the site is undergoing extensive remediation and demolition of non-heritage structures, expected to be completed by late 2026. The master plan balances future housing supply with the preservation of locally significant heritage elements including the 1909 Administration Building and Selling Pavilion.
Communities, Precincts & Urban Renewal

Wendouree Library and Learning Centre
Category: Arts & Culture
Stage: Planning | Est. Comp: 2028
Source / Links: Link 1   Link 2  

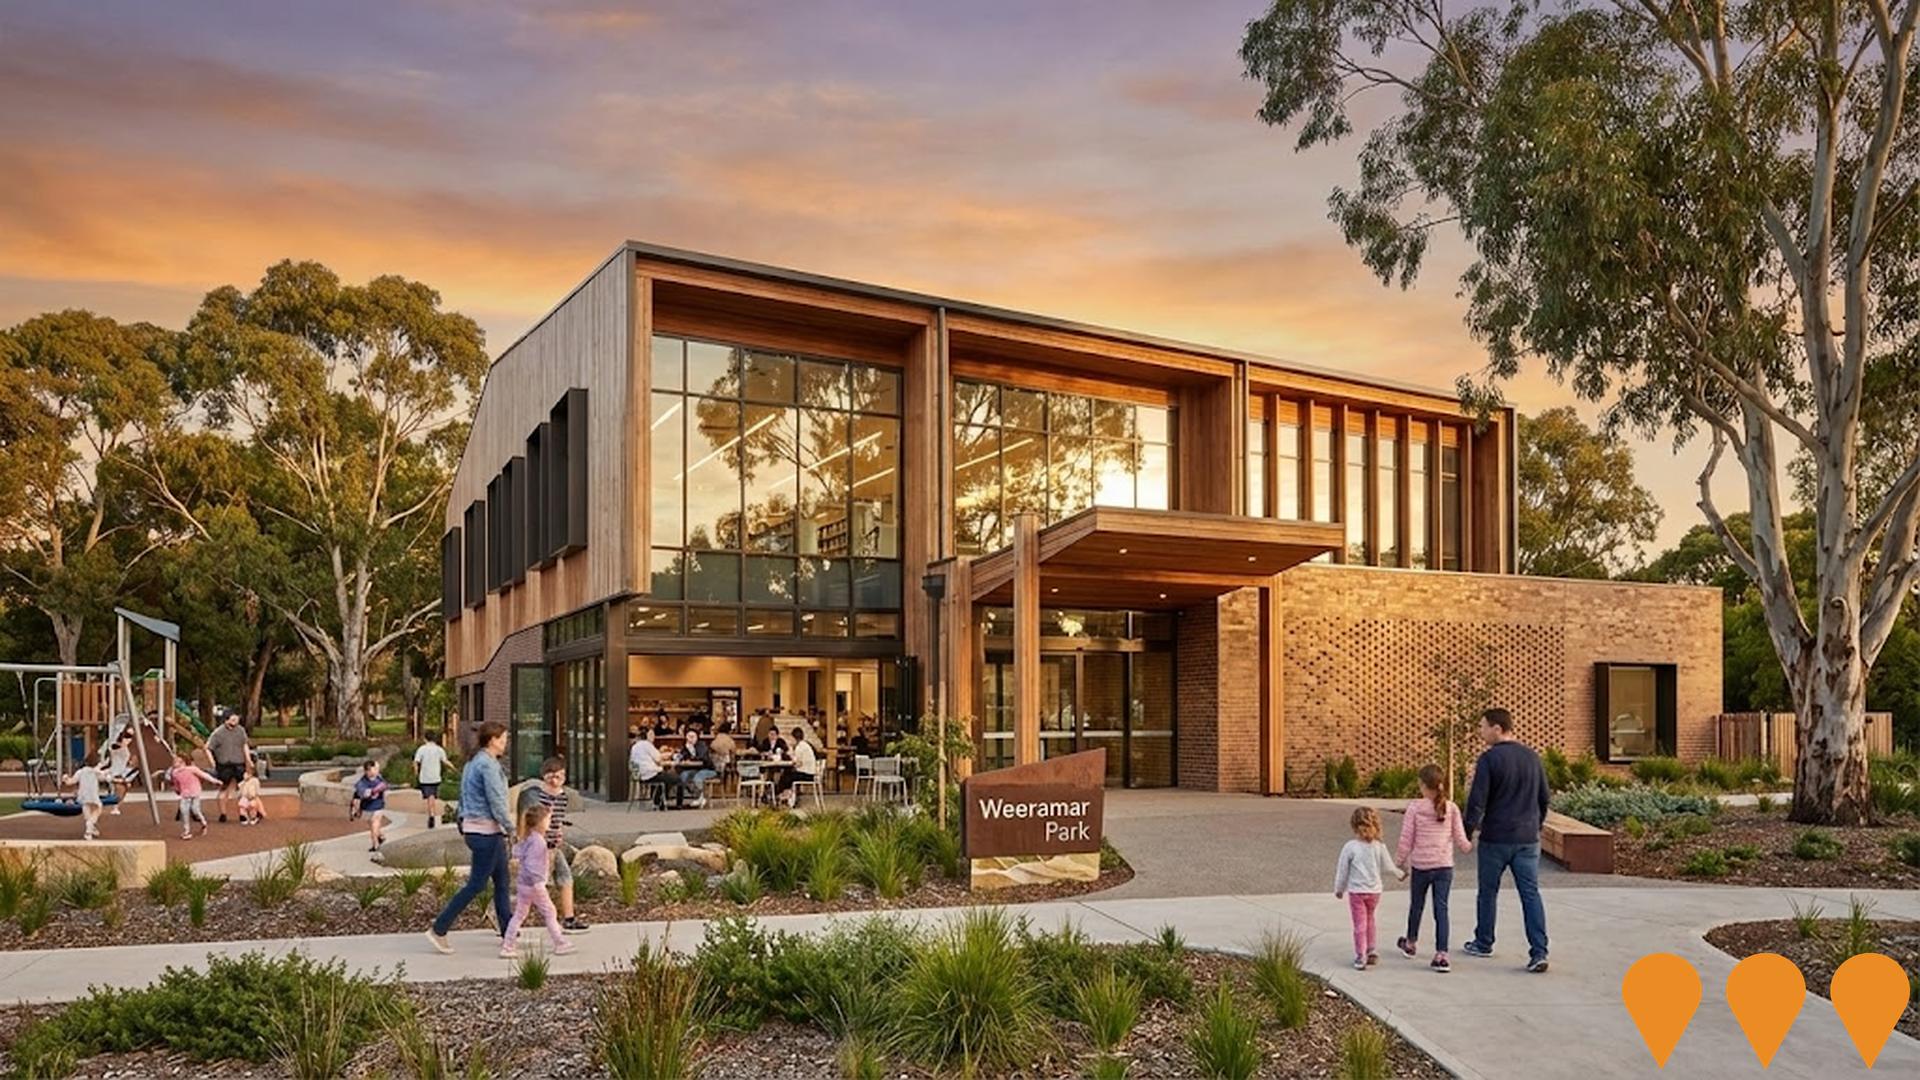
A proposed 2,700 sqm double-storey library and learning centre at Weeramar Park that will replace the existing Wendouree Library at Stockland Wendouree. The facility will include a modern library, City of Ballarat customer service point, Visitor Information Centre services, Parent Place, maker space, study and activity areas, relaxation spaces, cafe and free WiFi. Haskell Architects, with Porter Architects, is completing the detailed design following appointment in June 2025. Community engagement on the detailed design has been undertaken and the project remains a Tier 1 advocacy priority while the City of Ballarat seeks State and Federal Government funding for construction.
Arts & Culture

Jobs & IndustryEmployment Trends in Lake Wendouree

Table Chart PROFILE FAQ

1,345 residents of Lake Wendouree are employed, from a labour force of 1,367. Unemployment sits at 1.6%, with participation at 58.5%. Weighted for its industry mix, the area's sectors are forecast to grow about 7.3% nationally over five years. That reflects industry composition only and makes no allowance for local population growth. The working-day population is estimated at 2,972, about 110% of the resident population, so the area draws in more workers than it sends out. Unemployment and labour force come from ABS Small Area Labour Markets, updated quarterly; the industry and occupation profile is from the 2021 Census.

Detail

The local labor pool is highly qualified, with a strong concentration in essential services and an unemployment rate of only 1.6%, according to AreaSearch calculations from regional statistics. As of March 2026, there are 1,345 residents in employment, representing an unemployment rate 2.1% lower than the Regional Vic. average of 3.7%, while labor market participation is slightly low at 58.5% compared to the regional benchmark of 61.1%. Census records indicate that a moderate 22.4% of employed locals worked from home, though this figure may reflect pandemic-era restrictions. The primary sectors employing local residents are health care & social assistance, education & training, and construction.

Job concentration in health care & social assistance is particularly pronounced, registering at 1.4 times the regional norm. Conversely, agriculture, forestry & fishing is underrepresented, employing just 2.4% of local workers compared to 7.5% in Regional Vic.. The Census ratio of 0.7 workers for every resident points to an above-average availability of local employment. AreaSearch evaluated SALM and ABS data that were combined from larger statistical regions for the period ending March 2026. The analysis showed the labour force shrank by 0.6% while employment fell by 1.0%, which pushed the unemployment rate up by 0.4 percentage points. In contrast, Regional Vic. saw employment drop by 0.1% and the labour force decline by 0.3%, resulting in unemployment decreasing by 0.2 percentage points. Jobs and Skills Australia released national employment forecasts from May-25 that provide additional context for future demand in Lake Wendouree. These forecasts span five and ten-year horizons and have been overlaid with the local employment profile to project growth trends. National employment is projected to grow by 6.6% over five years and by 13.7% over ten years, though expansion varies considerably across industry sectors. When these sectoral forecasts are applied to Lake Wendouree’s employment composition, the area is expected to see employment rise by 7.3% over five years and by 15.0% over ten years. This estimation uses a basic weighting method for demonstration only and does not incorporate localized population projections.

Frequently Asked Questions - Employment

What is the employment situation in the suburb of Lake Wendouree?
As of March 2026, the suburb of Lake Wendouree has approximately 1,345 employed residents with an unemployment rate of 1.6%. This very low unemployment rate indicates a tight labour market with strong demand for workers. The area ranks in the top 25% nationally for employment performance, indicating a robust job market.
How does the suburb of Lake Wendouree's unemployment rate compare to the broader region?
As of March 2026, the unemployment rate in the suburb of Lake Wendouree stands at 1.6%, which is 2.1 percentage points below Regional Vic.'s rate of 3.7%. This lower unemployment rate suggests stronger local employment conditions. For comparison, the national unemployment rate is 4.2%.
What are the major employment sectors in the suburb of Lake Wendouree?
The employment landscape in the suburb of Lake Wendouree is dominated by several key sectors. The largest employers are health care & social assistance (23.2% of employment), education & training (12.9%), and construction (8.3%). Other significant employers include professional & technical and retail trade.
How has employment changed recently in the suburb of Lake Wendouree?
Over the past year to March 2026, the suburb of Lake Wendouree has experienced a decline in employment, with total jobs decreasing while the labour force decreased. As a result, the unemployment rate has rise. By comparison, Regional Vic. saw employment decreased and its unemployment rate dropped.
What is the workforce participation rate in the suburb of Lake Wendouree?
The workforce participation rate in the suburb of Lake Wendouree is 58.5%, which represents the proportion of working-age residents who are either employed or actively seeking work. This moderate participation rate suggests some residents may face barriers to workforce entry. The local rate trailing the Regional Vic. average of 61.1%, showing similar workforce dynamics to the broader region.
Which industries are over-represented in the suburb of Lake Wendouree's employment market?
The suburb of lake wendouree shows notable specialization in health care & social assistance, which employs 23.2% of the local workforce compared to 16.8% regionally. This moderate specialization indicates some local strength in the sector. The area also shows above-average employment in 3 other sectors, contributing to a distinctive economic profile.
What are the employment growth prospects for the suburb of Lake Wendouree?
Based on Jobs and Skills Australia projections applied to the suburb of Lake Wendouree's industry mix, employment is expected to grow by 7.3% over the next five years and 15.0% over ten years. This exceeds the national forecast of 6.6% over five years, suggesting the area's industry composition is well-positioned for future growth. Steady growth is anticipated across multiple sectors, providing diverse employment opportunities.
How does the job market in the suburb of Lake Wendouree compare nationally?
The suburb of lake wendouree's employment market shows strong performance nationally, ranking in the top 25% of areas assessed by AreaSearch. This indicates robust employment conditions and economic vitality compared to other regions. Recent job advertisement trends show the broader employment region saw a 8.8% decline, ranking 33.0rd out of 37 regions nationally.
What employment opportunities exist for skilled workers in the suburb of Lake Wendouree?
Skilled workers will find excellent opportunities in the suburb of Lake Wendouree, with knowledge-intensive sectors comprising 48.7% of local employment. Key sectors for skilled workers include health care & social assistance (23.2%), education & training (12.9%), and professional & technical (8.3%). With projected employment growth of 7.3% over five years, demand for skilled workers is expected to remain strong.

EarningsHousehold Income in Lake Wendouree

Table Chart PROFILE FAQ

Median household income in Lake Wendouree is $1,953 a week (about $102,000 a year), with median personal income at $1,010 a week. ATO records put median taxable income at $60,869 a year against an average of $77,879. Household income is from the 2021 Census; taxable income is from ATO Taxation Statistics for the latest financial year available, indexed forward using the ABS Wage Price Index.

Detail

The latest postcode-level data from the ATO for financial year 2023 shows that personal earnings are significantly above the national average, with a median of $60,869 and an average of $77,879. By comparison, Regional Vic. has a median income of $50,954 and an average of $62,728. Factoring in a Wage Price Index rise of 9.62% since financial year 2023, current estimates correspond to roughly $66,725 for the median and $85,371 for the average as of March 2026. Data from the 2021 Census places individual income at the 79th percentile ($1,010 weekly) and household earnings at the 62nd percentile.

The largest single income cohort comprises 25.2% of residents (681 people) earning in the $4000+ bracket, contrasting with Regional Vic. where the $1,500 - 2,999 range is largest at 30.3%. High earners are highly visible, with 35.2% earning over $3,000 weekly, pointing to substantial local spending power. Residents retain 90.2% of their income after meeting housing costs, and the area ranks in the 8th decile on the SEIFA income index.

Frequently Asked Questions - Income

What is the median taxable income in the suburb of Lake Wendouree?
Based on Wage Price Index adjustments to March 2026, the estimated median taxable income in the suburb of Lake Wendouree is approximately $66,725. The official ATO data from FY-23 recorded a median of $60,869.
What is the average taxable income in the suburb of Lake Wendouree?
Based on Wage Price Index adjustments to March 2026, the estimated average taxable income in the suburb of Lake Wendouree is approximately $85,371. The official ATO data from FY-23 recorded an average of $77,879.
How does the median taxable income in the suburb of Lake Wendouree compare to the region?
Based on Wage Price Index adjustments to March 2026, the estimated median taxable income in the suburb of Lake Wendouree is approximately $66,725 compared to $55,856 in Regional Vic.. The official ATO data from FY-23 shows $60,869 and $50,954 respectively.
How does the average taxable income in the suburb of Lake Wendouree compare to the region?
Based on Wage Price Index adjustments to March 2026, the estimated average taxable income in the suburb of Lake Wendouree is approximately $85,371 compared to $68,762 in Regional Vic.. The official ATO data from FY-23 shows $77,879 and $62,728 respectively.
What are the main income cohorts in the suburb of Lake Wendouree according to the 2021 Census?
As per the 2021 Census, the income bracket containing the largest proportion (~25.2% / 681 persons) of the suburb of Lake Wendouree's population is the $4000+ cohort.
How do the main income cohorts in the suburb of Lake Wendouree compare to the region?
The largest income cohort in the suburb of Lake Wendouree is the $4000+ group, representing about 25.2% of the population. In comparison, Regional Vic.'s largest income cohort is the $1,500 - 2,999 group, representing 30.3% of its population, according to the 2021 Census.
What is the median household income in the suburb of Lake Wendouree according to the 2021 Census?
The 2021 Census data indicates that the median household income in the suburb of Lake Wendouree is $1,953/wk.
What is the median family income in the suburb of Lake Wendouree according to the 2021 Census?
According to the 2021 Census, the median family income in the suburb of Lake Wendouree is $2,879/wk.
What is the median personal income in the suburb of Lake Wendouree according to the 2021 Census?
The 2021 Census shows that the median personal income in the suburb of Lake Wendouree is $1,010/wk.
How does the suburb of Lake Wendouree's income rank nationally?
The suburb of Lake Wendouree shows a median taxpayer income of $60,869 and an average of $77,879 according to the latest postcode level ATO data aggregated by AreaSearch for FY-23. This is very high nationally, contrasting with Regional Vic.'s median income of $50,954 and average income of $62,728. Based on Wage Price Index growth of 9.62% since FY-23, current estimates would be approximately $66,725 (median) and $85,371 (average) as of March 2026.
What is the disposable income in the suburb of Lake Wendouree?
The estimated disposable income in the suburb of Lake Wendouree is $7,636 per year according to AreaSearch analysis.
How does the suburb of Lake Wendouree's disposable income compare to the region?
The suburb of lake wendouree's disposable income is $7,636 compared to $5,209 for Regional Vic., based on AreaSearch analysis.

Housing StockHousing & Dwellings in Lake Wendouree

Table Chart PROFILE FAQ

Lake Wendouree had 1,145 occupied dwellings at the 2021 Census, 79% detached houses and 2% apartments. 23% are owned with a mortgage, 25% rented and 52% owned outright. At that Census the median rent was $321 a week and the median mortgage repayment $2,106 a month. Rent absorbs 16.4% of household income here and mortgage repayments 24.9%. Dwelling stock, tenure and housing costs are 2021 Census measures — the only source that counts dwellings at this boundary size.

Detail

Residential property types in the suburb of Lake Wendouree at the time of the last Census consisted of 79.1% separate houses and 20.9% semi-detached dwellings, apartments, or other formats, compared to 90.1% houses and 9.9% other structures across Regional Vic.. Home ownership was high at 52.1% compared to Regional Vic., with remaining households holding mortgages (22.5%) or renting (25.4%). The median monthly home loan repayment of $2,106 was notably higher than the regional average of $1,430, while weekly rent averaged $321 compared to the regional figure of $285. On a national level, monthly mortgage commitments are higher than the Australian median of $1,863, whereas weekly rental costs are lower than the country-wide figure of $375.

Frequently Asked Questions - Housing

What percentage of homes are owned vs rented in the suburb of Lake Wendouree?
In the suburb of Lake Wendouree, 52.1% of homes are owned outright, 22.5% are owned with a mortgage, and 25.4% are rented.
What percentage of dwellings in the suburb of Lake Wendouree are houses?
According to the latest data, 79.1% of dwellings in the suburb of Lake Wendouree are houses.
What percentage of dwellings in the suburb of Lake Wendouree are apartments or units?
In the suburb of Lake Wendouree, 2.1% of dwellings are apartments or units, with an additional 18.8% being semi-detached dwellings.
What is the level of outright home ownership in the suburb of Lake Wendouree?
Outright home ownership in the suburb of Lake Wendouree stands at 52.1%, compared to 40.9% in Regional Vic..
What is the median monthly mortgage repayment in the suburb of Lake Wendouree?
The median monthly mortgage repayment in the suburb of Lake Wendouree is $2,106, compared to $1,430 in Regional Vic..
What is the median weekly rent in the suburb of Lake Wendouree?
The median weekly rent in the suburb of Lake Wendouree is $321, compared to $285 in Regional Vic..
What is the distribution of rental prices in the suburb of Lake Wendouree?
In the suburb of Lake Wendouree, 2.8% of rentals are $0-149/week, 56.2% are $150-349/week, 36.7% are $350-649/week, 2.8% are $650-949/week, and 1.4% are $950+/week.
What is the average monthly housing cost in the suburb of Lake Wendouree?
The aggregate monthly housing cost in the suburb of Lake Wendouree is $827, which represents the average monthly cost across all housing types.
What percentage of income do residents spend on housing in the suburb of Lake Wendouree?
In the suburb of Lake Wendouree, households with mortgages typically spend 24.9% of their income on mortgage repayments, while renters spend 16.4% of their income on rent.
How crowded are homes in the suburb of Lake Wendouree?
The average persons per bedroom ratio in the suburb of Lake Wendouree is 0.7, indicating the level of household density.
How does housing affordability in the suburb of Lake Wendouree compare to the region?
Housing affordability in the suburb of Lake Wendouree shows mortgage holders spending 24.9% of income on repayments (vs 23.8% regionally), while renters spend 16.4% of income on rent (vs 20.6% regionally).
What types of dwellings are most common in the suburb of Lake Wendouree?
The dwelling mix in the suburb of Lake Wendouree consists of 79.1% detached houses, 18.8% semi-detached dwellings, 2.1% apartments, and 0.0% other dwelling types.
What is the weighted average housing cost based on tenure mix in the suburb of Lake Wendouree?
Accounting for the local ownership mix, the weighted average monthly housing cost is approximately $827. This accounts for outright owners paying no housing costs, mortgage holders paying $2,106/month, and renters paying $1,390/month.
How affordable is housing in the suburb of Lake Wendouree relative to local incomes?
Housing in Lake Wendouree consumes approximately 9.8% of median household income ($8,456 monthly), indicating costs are highly affordable. The generally accepted benchmark is that housing should not exceed 30% of household income.
How do proposed developments compare to existing housing types in the suburb of Lake Wendouree?
No recent development applications are recorded for this area.

HouseholdsHousehold Composition in Lake Wendouree

Table Chart PROFILE FAQ

Lake Wendouree counted 1,145 households at the 2021 Census, averaging 2.2 people each. 25% are couples with children, against 34% couples without children. 32% of households are people living alone, and families average 2.0 children. Household and family composition is measured only by the Census, so these are 2021 figures.

Detail

Families make up 65.3% of local households, consisting of 24.5% couples with offspring, 34.2% couples without children, and 6.9% single parents. Non-family living arrangements account for the remaining 34.7% of households, with single-person households representing 32.0% and shared households comprising 2.0%. The median household size of 2.2 people is below the Regional Vic. average of 2.4.

Frequently Asked Questions - Households

How many households are in the suburb of Lake Wendouree?
As of the 2021 Census, the suburb of Lake Wendouree had 1,145 households. Based on population growth patterns, this has decreased by approximately 6.0% to an estimated 1,076 households today.
What is the typical household size?
The median household size in the suburb of Lake Wendouree is 2.2 people. This compares to 2.4 in Regional Vic. and reflects the area's household composition mix.
What types of households are most common?
Family households dominate at 65.3% of all households. The remaining households consist of lone person households (32.0%), group households (2.0%), and other household types (0.1%).
How are families structured in the area?
Among the 747 family households, 24.5% are couples with children, 34.2% are couples without children at home, and 6.9% are single parent families. This mix shapes local demand for schools, family services, and housing types.
How does the suburb of Lake Wendouree compare to regional household patterns?
Compared to Regional Vic., the suburb of Lake Wendouree shows distinct household patterns. This higher proportion of single-person households drives demand for smaller dwellings and different community services.
What is the average family size?
Families in the suburb of Lake Wendouree have an average of 2.0 children, slightly above the Regional Vic. average of 1.8. This influences local demand for child-related services and larger family homes.
What are the marriage patterns in the suburb of Lake Wendouree?
Marriage patterns reveal 54.4% of the adult population are currently married, while 25.3% have never married. This compares to 46.3% married and 34.0% never married across Regional Vic..
How significant are single-person households?
Single-person households represent 32.0% of all households in the suburb of Lake Wendouree, similar to the regional average of 29.3%. This affects demand for smaller dwellings and single-person accommodation.
Are shared living arrangements common?
Group households (unrelated people sharing) account for 2.0% of households, well below the Regional Vic. average of 2.9%. This low rate suggests limited student or young professional shared accommodation.
Loading household composition data...

EducationSchools & Education in Lake Wendouree

Table Chart PROFILE FAQ

43.6% of adults in Lake Wendouree hold a university qualification, including 26.8% with a bachelor degree and 11.2% with postgraduate qualifications, higher than 84% of areas nationally. A further 14.6% hold a vocational qualification. 3 schools serve the area, with 1,296 enrolment places and an average ICSEA of 1,087 against a national benchmark of 1,000. Qualifications come from the 2021 Census; school enrolments, ICSEA and results come from ACARA's current release.

Detail

Academic credentials in the suburb of Lake Wendouree are significantly higher than the broader region, with 43.6% of residents aged 15+ holding tertiary degrees, compared to 21.7% in Rest of Vic. and 24.6% in the wider SA4 territory. This educational profile supports access to knowledge-intensive careers. Bachelor degrees are held by 26.8% of residents, followed by postgraduate degrees at 11.2% and graduate diplomas at 5.6%. Vocational and technical training is also well represented, with 26.5% of the population aged 15+ holding a qualification, including 11.9% with advanced diplomas and 14.6% with certificates.

Student representation is high, with 27.7% of the local population currently engaged in study. This group includes 9.8% in high schools, 8.7% in primary schools, and 5.7% enrolled in higher education.

Frequently Asked Questions - Education

What percentage of people in the suburb of Lake Wendouree have university qualifications?
43.6% of people aged 15 and over in the suburb of Lake Wendouree have university qualifications, compared to 21.7% in the broader region.
What percentage of people in the suburb of Lake Wendouree have no formal qualifications?
29.8% of people aged 15 and over in the suburb of Lake Wendouree have no formal qualifications, compared to 40.4% regionally.
How does the suburb of Lake Wendouree's education level compare to national averages?
The suburb of lake wendouree ranks in the 84th percentile nationally for education based on AreaSearch's analysis of qualification and performance metrics.
What types of qualifications are most common in the suburb of Lake Wendouree?
The most common qualifications in the suburb of Lake Wendouree are: Bachelor Degree (26.8%), Certificate (14.6%), Advanced Diploma (11.9%).
What proportion of the suburb of Lake Wendouree's population is currently attending educational institutions?
27.7% of the population in the suburb of Lake Wendouree is currently engaged in formal education, with 8.7% in primary school, 9.8% in secondary school, 5.7% at university.
What is the ICSEA score for schools in the suburb of Lake Wendouree?
The average ICSEA (Index of Community Socio-Educational Advantage) score for schools in the suburb of Lake Wendouree is 1087, indicating average socio-educational advantage (national average is 1000).
How many schools are located within the suburb of Lake Wendouree?
There are 3 schools within the suburb of Lake Wendouree, with a combined enrollment of approximately 1,296 students.
What types of schools are available in the suburb of Lake Wendouree?
The suburb of lake wendouree includes 1 primary school, 2 secondary schools.

Schools Detail

AmenitiesServices & Amenities in Lake Wendouree

PROFILE FAQ
Explore the surrounds Search this catchment for any place type — schools, cafés, supermarkets, transport — and drop your own custom points on the map.
Open

Getting AroundTransport & Commuting in Lake Wendouree

Table Chart PROFILE FAQ

Public transport in Lake Wendouree reaches 20 stops on 3 routes, timetabled for about 530 services a week. The typical home sits about 200 m from its nearest stop. Buses carry the largest share of public transport commuters. Households keep an average of 1.3 vehicles. Stop and service counts are built from operators' published GTFS timetables and refresh with each timetable release; vehicle ownership is from the 2021 Census.

Detail

Transport analysis shows 20 active public transport stops in the suburb of Lake Wendouree. These locations are served by 3 distinct routes, providing 525 passenger services weekly. Accessibility is rated as highly favorable, with residents living an average of 196 meters from their nearest transit point. The area is primarily residential, and most workers commute out of the suburb, with private cars being the primary mode of travel at 87%, followed by walking at 10% and cycling at 2%. Households own an average of 1.3 vehicles, which is lower than the regional benchmark.

Working from home was recorded for 22.4% of residents at the 2021 Census, which may have been influenced by pandemic conditions. Service frequency averages 75 daily journeys across the network, representing about 26 weekly departures for each stop.

Frequently Asked Questions - Transport

How many public transport stops are in Lake Wendouree?
There are 20 public transport stops within the suburb of Lake Wendouree.
How frequent are the transport services in Lake Wendouree?
the suburb of Lake Wendouree has 525 weekly trips across 3 routes, averaging 75 trips per day.
How far are residents from public transport in Lake Wendouree?
On average, residential properties are 196 meters from the nearest transport stop.

Transport Stops Detail

HealthcareHealth Services in Lake Wendouree

Table Chart PROFILE FAQ

62.7% of residents in Lake Wendouree report no long-term health condition. 7.7% need daily assistance with core activities, and 57.6% hold private health cover. The standardised death rate runs at 5.9 per 1,000 residents. Health conditions, assistance needs and insurance are 2021 Census measures; the death rate comes from current ABS releases.

Detail

Health indicators show positive trends, with analysis of death rates and medical conditions matching national averages. The prevalence of common health problems is low among both younger and older cohorts, and private medical insurance coverage is high, held by approximately 58% of the population (~1,556 people). This exceeds the rate of 50.5% recorded across Regional Vic.. Arthritis and mental health challenges are the most frequently reported conditions, affecting 10.4% and 8.4% of the population, respectively. Meanwhile, 62.7% of residents reported having no chronic medical conditions, compared to 63.4% across Regional Vic..

Health status among working-age locals is typical. The demographic profile shows that 32.4% of residents are aged 65 and over (876 people), which is higher than the regional share of 23.9%. Health outcomes for these older residents are favorable, with national standings comparable to the broader population.

Frequently Asked Questions - Health

How many people in the suburb of Lake Wendouree have private health insurance?
Around 57.6% of people in the suburb of Lake Wendouree are covered by private health insurance, which compares to 50.5% in the broader region of Regional Vic..
What percentage of the population requires ongoing medical assistance in the suburb of Lake Wendouree?
In the suburb of Lake Wendouree, 7.7% of the population is identified as requiring ongoing medical assistance. This figure is slightly different from the regional average, where 6.9% of people in Regional Vic. require similar assistance.
How prevalent is asthma in the suburb of Lake Wendouree?
7.4% of people in the suburb of Lake Wendouree are diagnosed with asthma. In comparison, 8.7% of the population across Regional Vic. is affected by asthma.
What percentage of people have diabetes in the suburb of Lake Wendouree?
Diabetes affects 3.5% of the the suburb of Lake Wendouree population, while in the surrounding region, 4.6% of people are diagnosed with diabetes.
What is the percentage of people with heart disease in the suburb of Lake Wendouree?
5.8% of people in the suburb of Lake Wendouree have heart disease. Across the region of Regional Vic., 4.4% of the population is affected by heart disease.
How does the suburb of Lake Wendouree compare to the region in terms of overall private health coverage?
In the suburb of Lake Wendouree, 57.6% of the population are estimated to have private health insurance. Comparatively, Regional Vic. sees an estimated private health coverage rate of 50.5%.

Ancestry & LanguageCultural Diversity in Lake Wendouree

Table Chart PROFILE FAQ

Lake Wendouree is largely Australian-born, at 86.9% of residents, with 5.4% speaking a language other than English at home. The largest reported ancestries are English (31.0%) and Australian (24.7%). Ancestry, language and country of birth are counted only by the Census, so these are 2021 figures.

Detail

Cultural diversity metrics are below the regional average, with 86.9% of residents born in Australia, 91.1% holding citizenship, and 94.6% using only English at home. The predominant religious affiliation is Christianity, representing 58.0% of the population, compared to 47.3% across Regional Vic.. Looking at ancestral backgrounds, the three largest groups are English at 31.0%, Australian at 24.7%, and Irish at 14.4%. Certain other ethnic backgrounds show distinct concentrations compared to regional averages, with Scottish heritage overrepresented at 10.9% (compared to 8.8% regionally), Dutch at 1.9% (compared to 1.7%), and Welsh at 0.7% (compared to 0.4%).

Frequently Asked Questions - Diversity

What is the level of cultural diversity in the suburb of Lake Wendouree?
Lake Wendouree was found to be below average in terms of cultural diversity, with 86.9% of its population born in Australia, 91.1% being citizens, and 94.6% speaking English only at home.
What is the most common religion in the suburb of Lake Wendouree?
The main religion in Lake Wendouree was found to be Christianity, which makes up 58.0% of people in Lake Wendouree. This compares to 47.3% across Regional Vic..
What are the top countries of origin in the suburb of Lake Wendouree?
In terms of ancestry (country of birth of parents), the top three represented groups in Lake Wendouree are English, comprising 31.0% of the population, Australian, comprising 24.7% of the population, and Irish, comprising 14.4% of the population. Additionally, there are notable divergences in the representation of certain other ethnic groups: Scottish is notably overrepresented at 10.9% of Lake Wendouree (vs 8.8% regionally), Dutch at 1.9% (vs 1.7%) and Welsh at 0.7% (vs 0.4%).
How does the percentage of people born overseas compare to the regional average?
13.1% of the the suburb of Lake Wendouree population was born overseas, compared to 13.2% regionally.
What percentage of the the suburb of Lake Wendouree population speaks a language other than English at home?
5.4% of the population in the suburb of Lake Wendouree speaks a language other than English at home, compared to 7.6% in the wider region.
How many people in the suburb of Lake Wendouree identify as Australian Aboriginal?
0.4% of the the suburb of Lake Wendouree population identifies as Australian Aboriginal, compared to 1.4% in the region.
What is the citizenship status of the population in the suburb of Lake Wendouree?
91.1% of the the suburb of Lake Wendouree population holds citizenship, compared to 88.6% in the wider region.

Age StructureAge Profile of Lake Wendouree

Table Chart PROFILE FAQ

The median resident of Lake Wendouree is 52, older than 95% of areas nationally. That is 1 year younger than at the 2021 Census. 18.2% of residents are aged 15 to 34. Age cohorts are not raw Census counts: the Census split is re-based to the latest ABS population estimates and state projections.

Detail

The median age of 52 years in the suburb of Lake Wendouree is much higher than the Regional Vic. average of 43 and the national average of 38. Compared to the regional population, there is an overrepresentation of residents aged 85+ (6.7% locally) and an underrepresentation of those aged 25 - 34 (7.0%). Since 2021, the 25 to 34 age bracket has increased from 5.9% to 7.0% of the population. In contrast, the 45 to 54 cohort decreased from 13.6% to 12.4%, and the 65 to 74 bracket declined from 15.3% to 14.2%.

Long-term population forecasts for 2041 point to significant changes, with the 25 to 34 group projected to grow fastest at 56%, adding 105 people to reach 295, while declines are projected for the 15 to 24 and 55 to 64 brackets.

Frequently Asked Questions - Age

What is the median age in the suburb of Lake Wendouree?
According to the latest data, the median age in the suburb of Lake Wendouree is 52 years.
How does the suburb of Lake Wendouree's median age compare to broader areas?
At 52 years, Lake Wendouree is 9 years older than the Regional Vic. average (43 years) and 14 years older than the national average (38 years).
What age groups are over-represented in the suburb of Lake Wendouree?
The most over-represented age group in the suburb of Lake Wendouree compared to the Regional Vic. region is the 85+ group, making up 6.7% of the population.
What age groups are under-represented in the suburb of Lake Wendouree?
The most under-represented age group in the suburb of Lake Wendouree compared to the Regional Vic. region is the 25 - 34 group, making up 7.0% of the population.
Are there age groups with notable population variances?
Yes, certain age groups in the suburb of Lake Wendouree show significant variance compared to the Regional Vic. region. The most over-represented age groups are 85+ year-olds (6.7% vs 2.8%) and 75-84 year-olds (11.5% vs 8.3%). The most under-represented age groups are 25-34 year-olds (7.0% vs 11.2%) and 0-4 year-olds (3.4% vs 5.3%).
What is the percentage of children (0-14 years) in the suburb of Lake Wendouree?
The percentage of children aged 0-14 years in the suburb of Lake Wendouree is 13.7%.
What is the percentage of older people (65+ years) in the suburb of Lake Wendouree?
The percentage of people aged 65 and over in the suburb of Lake Wendouree is 32.4%.

Data & MethodBoundaries, Sources & Method for Lake Wendouree

Data currency Refreshed

9 of 14 data sections on this page were updated within the last 12 months — the newest current to Aug 2026.

Everything is aggregated to the Suburb (SAL) boundary shown above, on a 2021 Census baseline. Only 3 sections — housing, households and cultural diversity — still wait on the 2026 Census.

The ledger — source, cycle and currency by section

Section Source & update cycle Currency
Updated within the last 12 months 9 sections
Population ABS, GNAF, Geoscience Australia Annual (ABS ERP) May 2026 3 months ago headline measures · 2021 Census baseline
Re-based to the ABS Estimated Resident Population (June 2025 release) and updated with new dwellings from GNAF address data. Current to May 2026, with the 2021 Census supplying the small-area baseline.
Age profile ABS, Geoscience Australia, State governments Annual May 2026 3 months ago headline measures · 2021 Census baseline
Age cohorts are re-based to the latest ABS population estimates and state projections, current to May 2026. Each cohort is held as a Census baseline and a current estimate.
Development & approvals ABS, GNAF Monthly (ABS approvals) Jun 2026 2 months ago headline measures · May 2026 baseline
Property sales & rents Valuer General, Rental Board, ABS Weekly sales, quarterly rents Aug 2026 this month all 21 measures
Sales from the state Valuer General register, refreshed weekly, and rents from quarterly rental bond lodgements. Both are read live each time this page loads, current to Aug 2026.
Infrastructure projects Infrastructure Australia, Local governments Daily May 2026 3 months ago all 2 projects tracked here
Project pipeline maintained continuously from Infrastructure Australia, state agencies, local government and public announcements. Records are added and revised daily; this area was last updated May 2026.
Employment ABS, DEWR, JSA Quarterly (ABS SALM) Mar 2026 5 months ago headline measures · 2021 Census baseline
Unemployment and labour force from ABS Small Area Labour Markets, current to Mar 2026. The growth outlook applies Department of Employment (now Jobs and Skills Australia) forecasts for all 19 industry divisions to the local industry mix, so it measures sector composition rather than local expansion and makes no allowance for population growth. Job demand comes from the same agency via its Internet Vacancy Index; industry and occupation structure from the 2021 Census.
Education ABS, ACARA Annual (ACARA) Aug 2026 this month headline measures · 2021 Census baseline
Transport ABS, State Transport Departments Each timetable release Jul 2026 last month headline measures · 2021 Census baseline
Services & amenities Provider directories, ACECQA Continuous Jul 2026 last month all 14 measures
Annual and financial-year sources 2 sections
Income ABS, ATO Annual (ATO) FY 2023 3 years ago headline measures · 2021 Census baseline
ATO taxable income statistics for FY 2023, indexed forward using the Wage Price Index. Census household income provides the distribution detail.
Health ABS, ATO Annual 2024 2 years ago headline measures · 2021 Census baseline
Census-measured — next update: 2026 Census 3 sections No more current small-area source exists for these, so they are labelled as Census-measured rather than implied to be current.
Housing ABS 5-yearly (Census) 2021 Census next update 2026 all 30 measures
Households ABS 5-yearly (Census) 2021 Census next update 2026 all 18 measures
Cultural diversity ABS, Geoscience Australia 5-yearly (Census) 2021 Census next update 2026 all 44 measures

"Currency" is the most recent release feeding that section. Where the Census supplies the structural baseline underneath a current headline figure, the row says so.

How the numbers are built

Population

The Census provides the small-area baseline, aggregated from mesh blocks to this boundary. It is then re-based to the ABS Estimated Resident Population (June 2025 release), and new dwellings built since Census night are counted from address data — 7 validated new addresses here. The headline figure is therefore a current estimate for May 2026, not a 2021 count (2,878 at the 2021 Census → 2,704 now). Annual growth rates are compound (CAGR), not simple averages.

Age profile

Cohort shares are not raw Census counts. Every cohort is held as a pair — the Census baseline and a current estimate — and the split is re-based using ERP and state population projections, current to May 2026. Median age is the Census median plus modelled change since. Charts that show both are labelled "2021 Census vs Current Estimate".

Property sales

Sourced from the state valuation authority's sales register — current, not Census, and refreshed weekly. Medians are calculated from settled transactions in the period shown; periods with very low transaction counts are flagged or suppressed, because a handful of sales can move a median substantially.

Rents

Derived from state rental bond lodgement data, by dwelling type and bedroom count. Bonds are lodged at the start of a new tenancy, so this reflects new lettings, not the whole rented stock.

Development & infrastructure

Building approvals come from current ABS releases; development applications are collected from council and state planning portals; the infrastructure pipeline is compiled from Infrastructure Australia and local government sources. Applications are matched to this boundary by address or coordinates, so very recent lodgements may not yet appear.

Employment & income

Industry and occupation structure comes from the Census, but the headline labour-market indicators do not. Unemployment and labour force are derived from ABS Small Area Labour Markets (quarterly). The employment outlook applies Department of Employment forecasts for all 19 industry divisions to this area's own industry mix (the agency is now Jobs and Skills Australia), as does the Internet Vacancy Index used for job demand. Because it is weighted on industry composition alone, that outlook carries no allowance for local population growth — in fast-growing areas the real rise in local jobs will typically be higher. Income combines Census household income with ATO taxable-income statistics for FY 2023, indexed forward using the Wage Price Index.

Education, transport & amenities

School enrolments, ICSEA and performance come from ACARA's current release, not the Census. Public transport stops and service frequency are derived from GTFS timetable feeds published by state transport departments. Services and amenities are proximity and count scores built from provider directories, refreshed on their own cycle. The Census contributes only the travel-to-work and qualification measures.

Rankings and benchmarks. Where we rank this area, the comparison set is every area of the same boundary type — suburbs against suburbs, SA2s against SA2s. Benchmarks compare this area against its greater capital city region and the national figure for the same measure and period.

Limits worth knowing. Small areas carry larger error margins, and the ABS introduces small random adjustments to Census counts to protect confidentiality — so totals may not sum exactly. Estimates re-based from regional data describe the area's expected trajectory, not a direct count of it. Figures are indicative for research and are not financial, planning or valuation advice.

Cross-check us. The Census baseline for this boundary is at ABS 2021 Census QuickStats (SAL21447). QuickStats reports 2021 only — the figures on this page are more current wherever the ledger shows a later date.

Common questions about this page

How do Lake Wendouree suburb boundaries differ from Statistical Areas?
This page uses Suburbs and Localities (SAL) boundaries (suburb-style geography). SAL represents commonly-known suburb names used in addresses, while Statistical Areas (SA2) are designed for census/statistical reporting. Even when sharing the same name, SAL and SA2 boundaries often cover different geographic areas with different populations.
Where does the data on this Lake Wendouree page come from?
AreaSearch compiles this page from official and industry sources — including ABS, Geoscience Australia, Valuer General, Provider directories, DEWR, JSA, State Transport Departments and ACARA — then aggregates them to the boundary shown and calculates the rankings, growth rates and benchmarks itself. Property sales come from the state valuation authority, rents from state rental bond lodgements, development applications from council and state planning portals, school data from ACARA, and public transport from state transport departments.
Is the Lake Wendouree data on this page just from the 2021 Census?
No. Most of this page is maintained well beyond the Census. Sourced entirely from current releases: development & approvals (Jun 2026), property sales & rents (Aug 2026), infrastructure projects (May 2026) and services & amenities (Jul 2026). Built on a Census baseline but carrying newer measures on top: population (to May 2026), age profile (to May 2026), employment (to Mar 2026), income (to FY 2023), education (to Aug 2026), transport (to Jul 2026) and health (to 2024). Population and age cohorts in particular are re-based to the latest ABS Estimated Resident Population rather than left at 2021 counts. Only housing, households and cultural diversity remain wholly Census-based, because no more current small-area dataset exists for those measures.

Nearby Areas