Chart Color Schemes
This analysis uses Suburbs and Localities (SAL) boundaries, which can materially differ from Statistical Areas (SA2) even when sharing the same name.
SAL boundaries are defined by Australia Post and the Australian Bureau of Statistics to represent commonly-known suburb names used in postal addresses.
Statistical Areas (SA2) are designed for census data collection and may combine multiple suburbs or use different geographic boundaries. For comprehensive analysis, consider reviewing both boundary types if available.
est. as @ -- *
2021 Census | -- people







Curious about local property values? Filter the chart to assess the volume and appreciation (including resales) trends and regional comparisons, or scroll to the map below view this information at an individual property level.
Find a Recent Sale

Sales Detail
Ballarat East has an estimated 5,972 residents, up from 5,937 at the 2021 Census. 169 new addresses have been validated here since Census night. That puts 999 residents on each square kilometre. Population is estimated from ABS Estimated Resident Population releases and GNAF address data, re-based from the 2021 Census and updated annually.
Detail
According to AreaSearch's evaluation of broader regional ABS demographic releases alongside post-Census validated address counts, the suburb of Ballarat East has an estimated population of approximately 5,972 as of Aug 2026. This indicates an expansion of 35 people (0.6%) compared to the 5,937 people recorded in the 2021 Census. Such growth is calculated from an estimated resident population of 5,955, derived by AreaSearch from the ABS's recent ERP update (June 2025) plus 169 newly verified addresses following the Census. The suburb of Ballarat East exhibits a density of 998 persons per square kilometer, aligning closely with typical benchmarks recorded across AreaSearch locations.
Inbound overseas migration represented virtually the entire source of local population expansion across recent timeframes. Projections for each SA2 district utilise 2024 ABS and Geoscience Australia models pegged to a 2022 baseline, while unmapped SA2 localities rely on 2023 VIC State Government Regional/LGA figures aggregated via weighted methods to the SA2 tier. Projected age-cohort growth from these groupings has likewise been modeled for all territories across the 2032 to 2041 period. Looking ahead, long-term demographic modelling places the suburb of Ballarat East within the highest quartile for population growth among Australia's regional districts, with SA2 aggregations forecasting an addition of 1,678 persons by 2041, representing a cumulative increase of 27.8% across the 16 years.
Frequently Asked Questions - Population
167 new dwellings have been approved in Ballarat East over the past five years, an average of 33 a year. That places the area in the 51st percentile for residential development activity nationally, about 6 approvals per 1,000 residents a year. Of the 42 dwellings approved in the latest reporting year, 90% were detached houses and the rest townhouses or apartments. Approvals are currently running at an annualised 79, running ahead of that longer-run average. Figures come from ABS building approvals aggregated to this Suburb (SAL) boundary and are updated monthly as the ABS releases them.
Detail
An evaluation of ABS building approval records by AreaSearch shows that Ballarat East has generated an annual average of approximately 33 residential approvals, accumulating to roughly 167 homes over the preceding 5 financial years. Within FY-25 to date, 79 approvals have been logged. With an average of just 0.2 new residents per year per dwelling constructed across the past 5 financial years (from FY-21 to FY-25), the addition of housing stock continues to match or outstrip local demand, ensuring extensive choices for buyers and capacity for future demographic expansion. Furthermore, newly constructed residences carry an average value of $325,000—sitting beneath regional benchmarks to provide cost-effective options for buyers.
The locality's residential emphasis is further underlined by $4.8 million in non-residential commercial approvals logged in the current financial year. Relative to Rest of Vic., new residential approval volumes per capita in Ballarat East track at approximately two-thirds the rate, placing the area in the 80th percentile across the country. Residential construction consists of 90.0% standalone houses and 10.0% semi-detached dwellings or apartments, preserving established suburban streetscapes geared toward spacious family living. The presence of roughly 121 people per dwelling approval reflects the low-density nature of the district. Demographic projections derived from AreaSearch's latest quarterly estimates indicate Ballarat East will expand by 1,661 residents by 2041. Should current construction volumes persist, housing supply could fall short of demographic additions, which may intensify competition among purchasers and place upward pressure on property values.
Frequently Asked Questions - Development
Development applications around Ballarat East
SOURCE: Planning portals and council registers, compiled by AreaSearch. Distance & bearing measured from the suburb midpoint.
AreaSearch tracks 2 current infrastructure and development projects inside Ballarat East, worth an estimated $28 million. A further 43 sit in the immediately surrounding suburbs, taking the tracked pipeline within reach of the area to $5.33 billion. 12 are already under construction and 11 are due for completion within three years. The pipeline spans residential development, communities, precincts & urban renewal and education & training. Records are compiled from Infrastructure Australia, state agencies, council planning portals and public announcements, reviewed and updated daily, then ranked by proximity, construction stage, completion horizon and project scale.
Detail
Regional performance is heavily shaped by infrastructure developments, planning frameworks, and capital projects. AreaSearch has pinpointed 19 distinct initiatives positioned to influence the local area. Among the most notable works are The Meadows on Eureka Estate, Urban Ripple: Restoring our Yarrowee River and its Little Creeks, Eastwood Community Hub, and Sovereign Hill Master Plan: Gold Vault, with critical projects itemized below.
Professional plan users can use the search below to filter and access additional projects.
INFRASTRUCTURE SEARCH
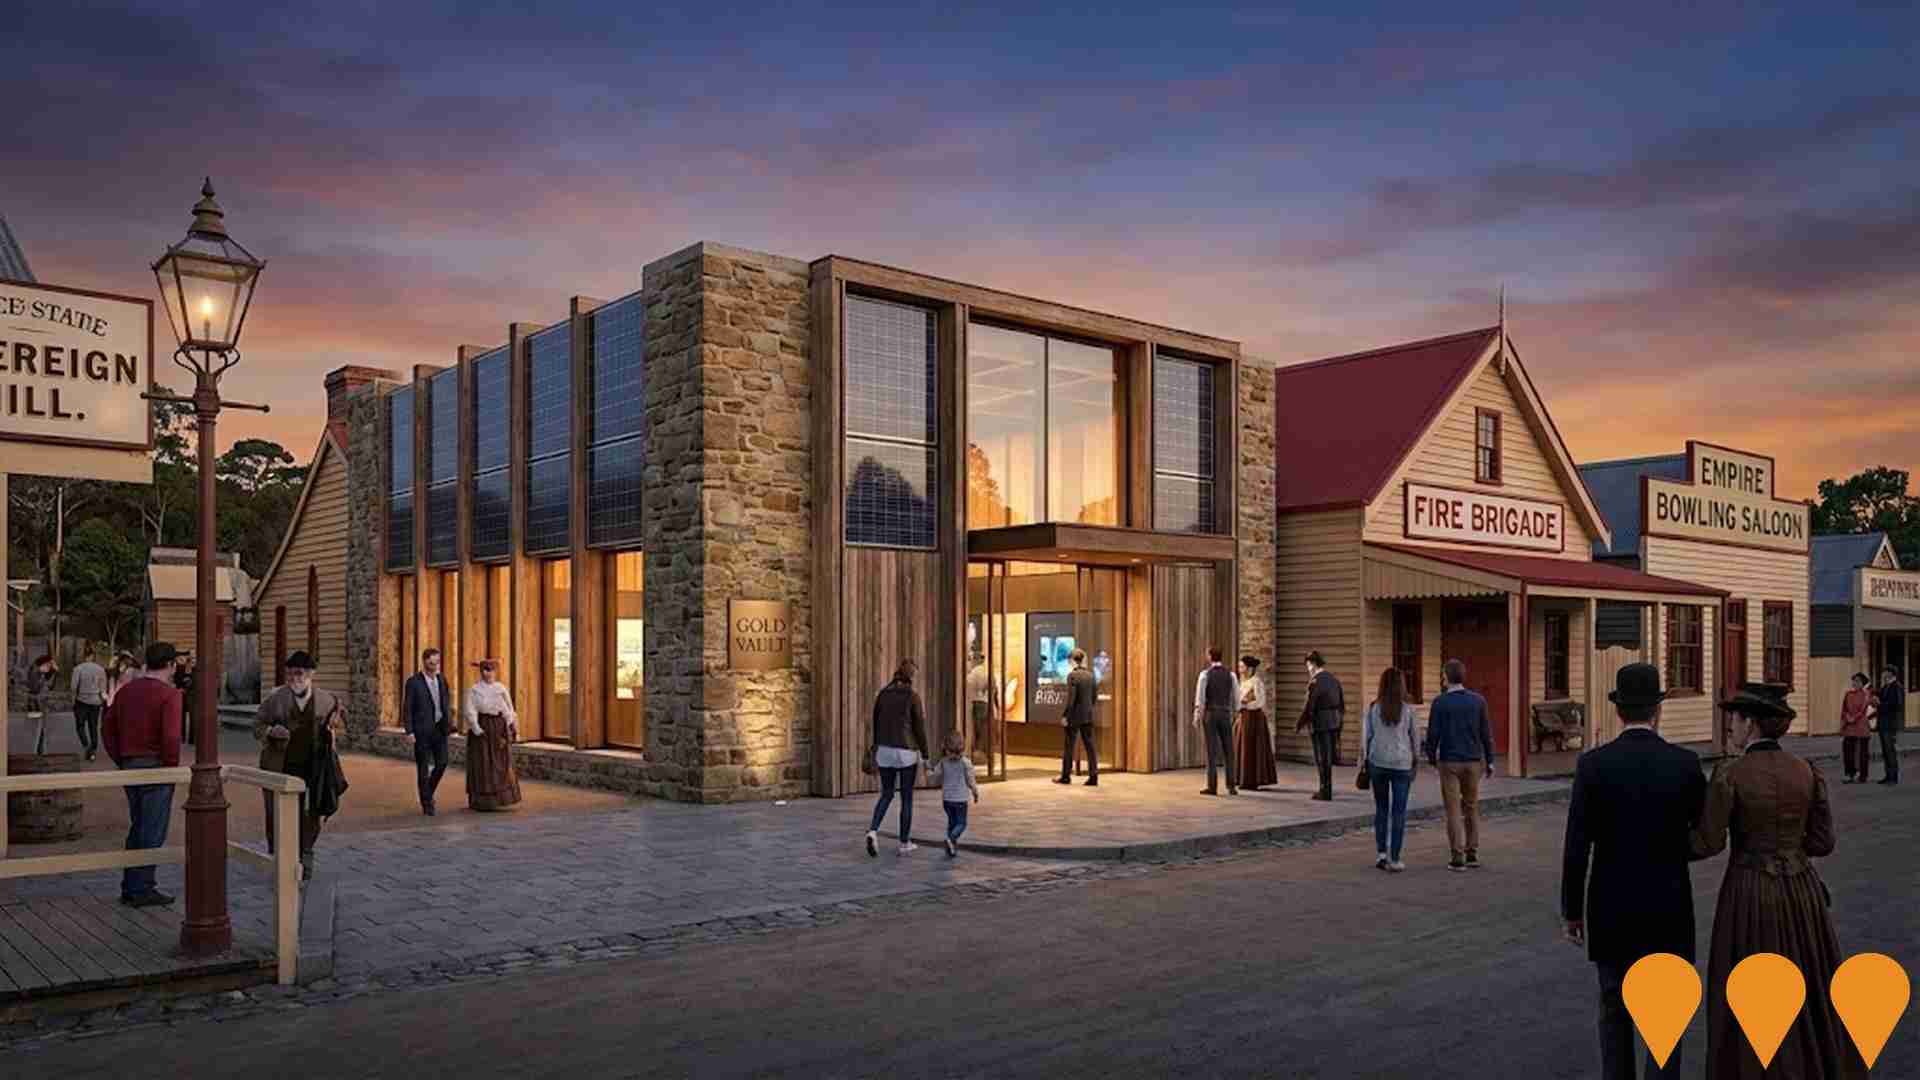
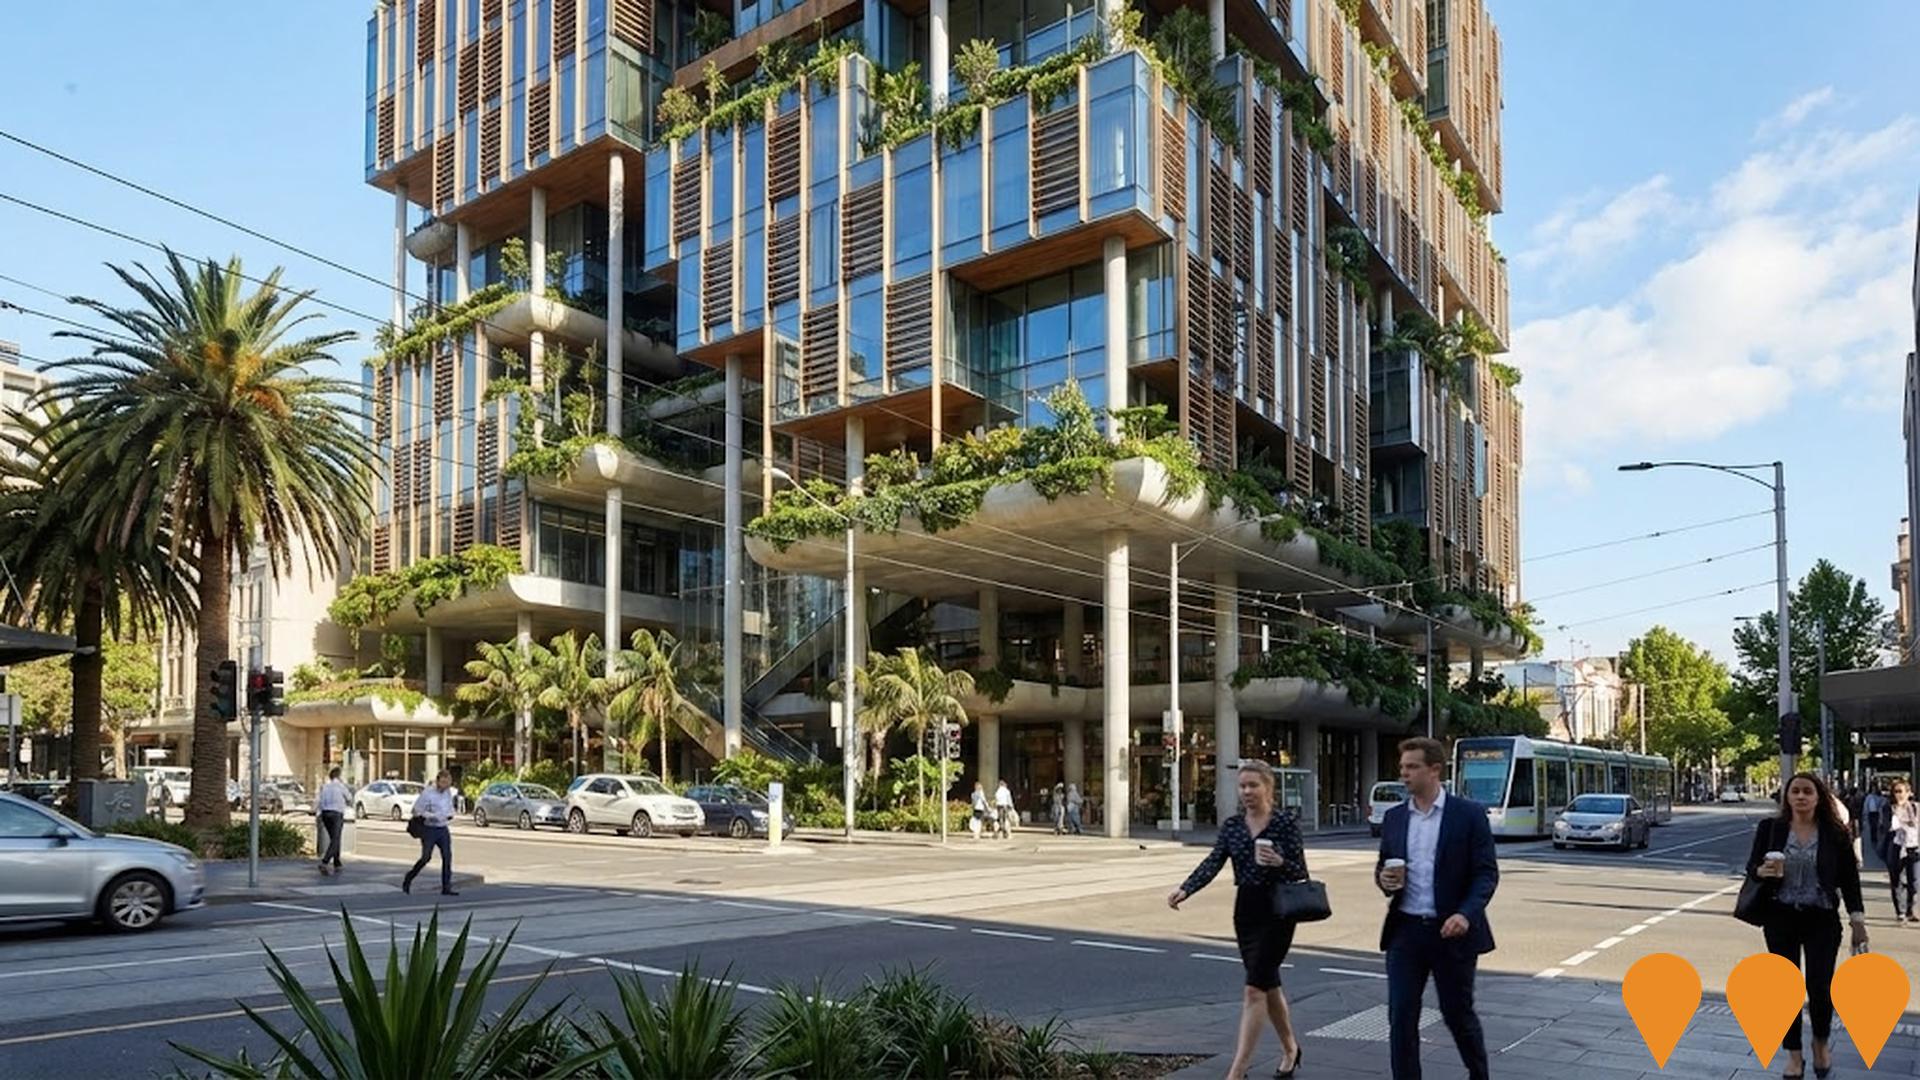
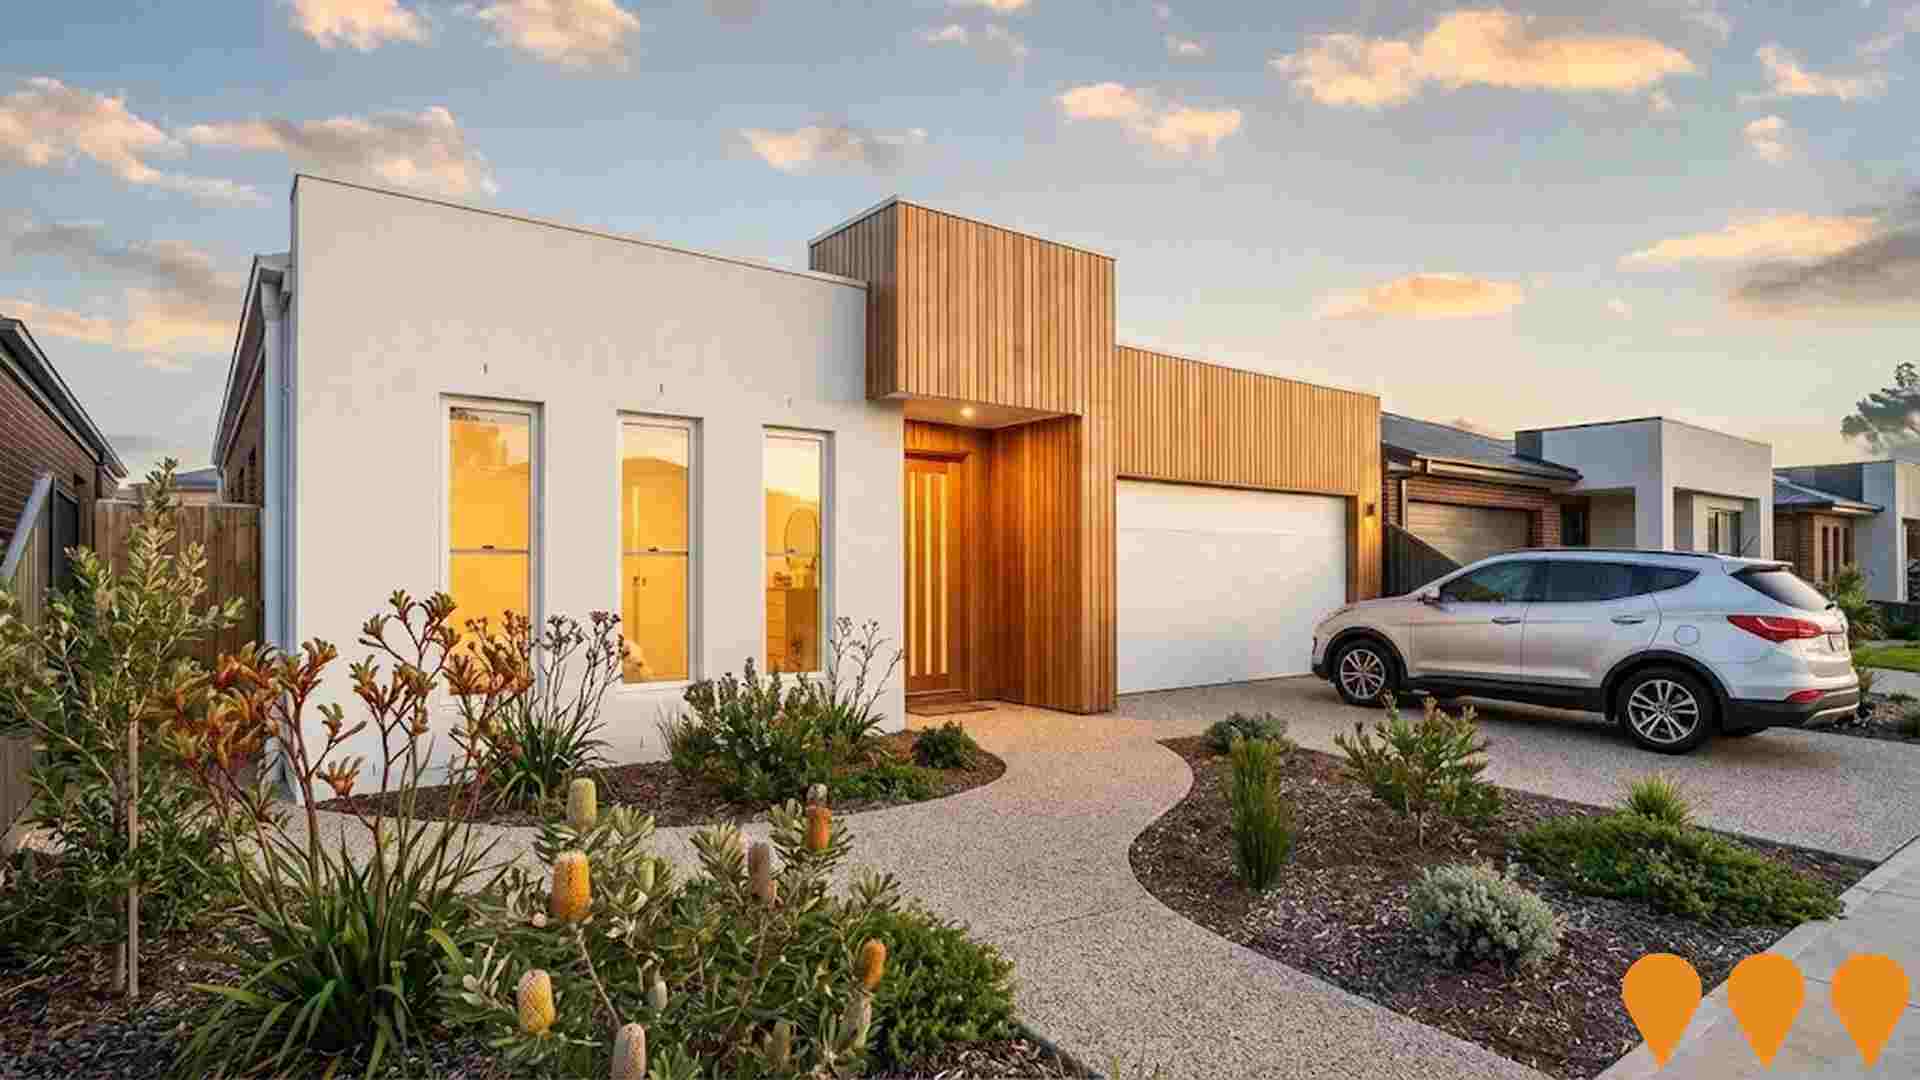
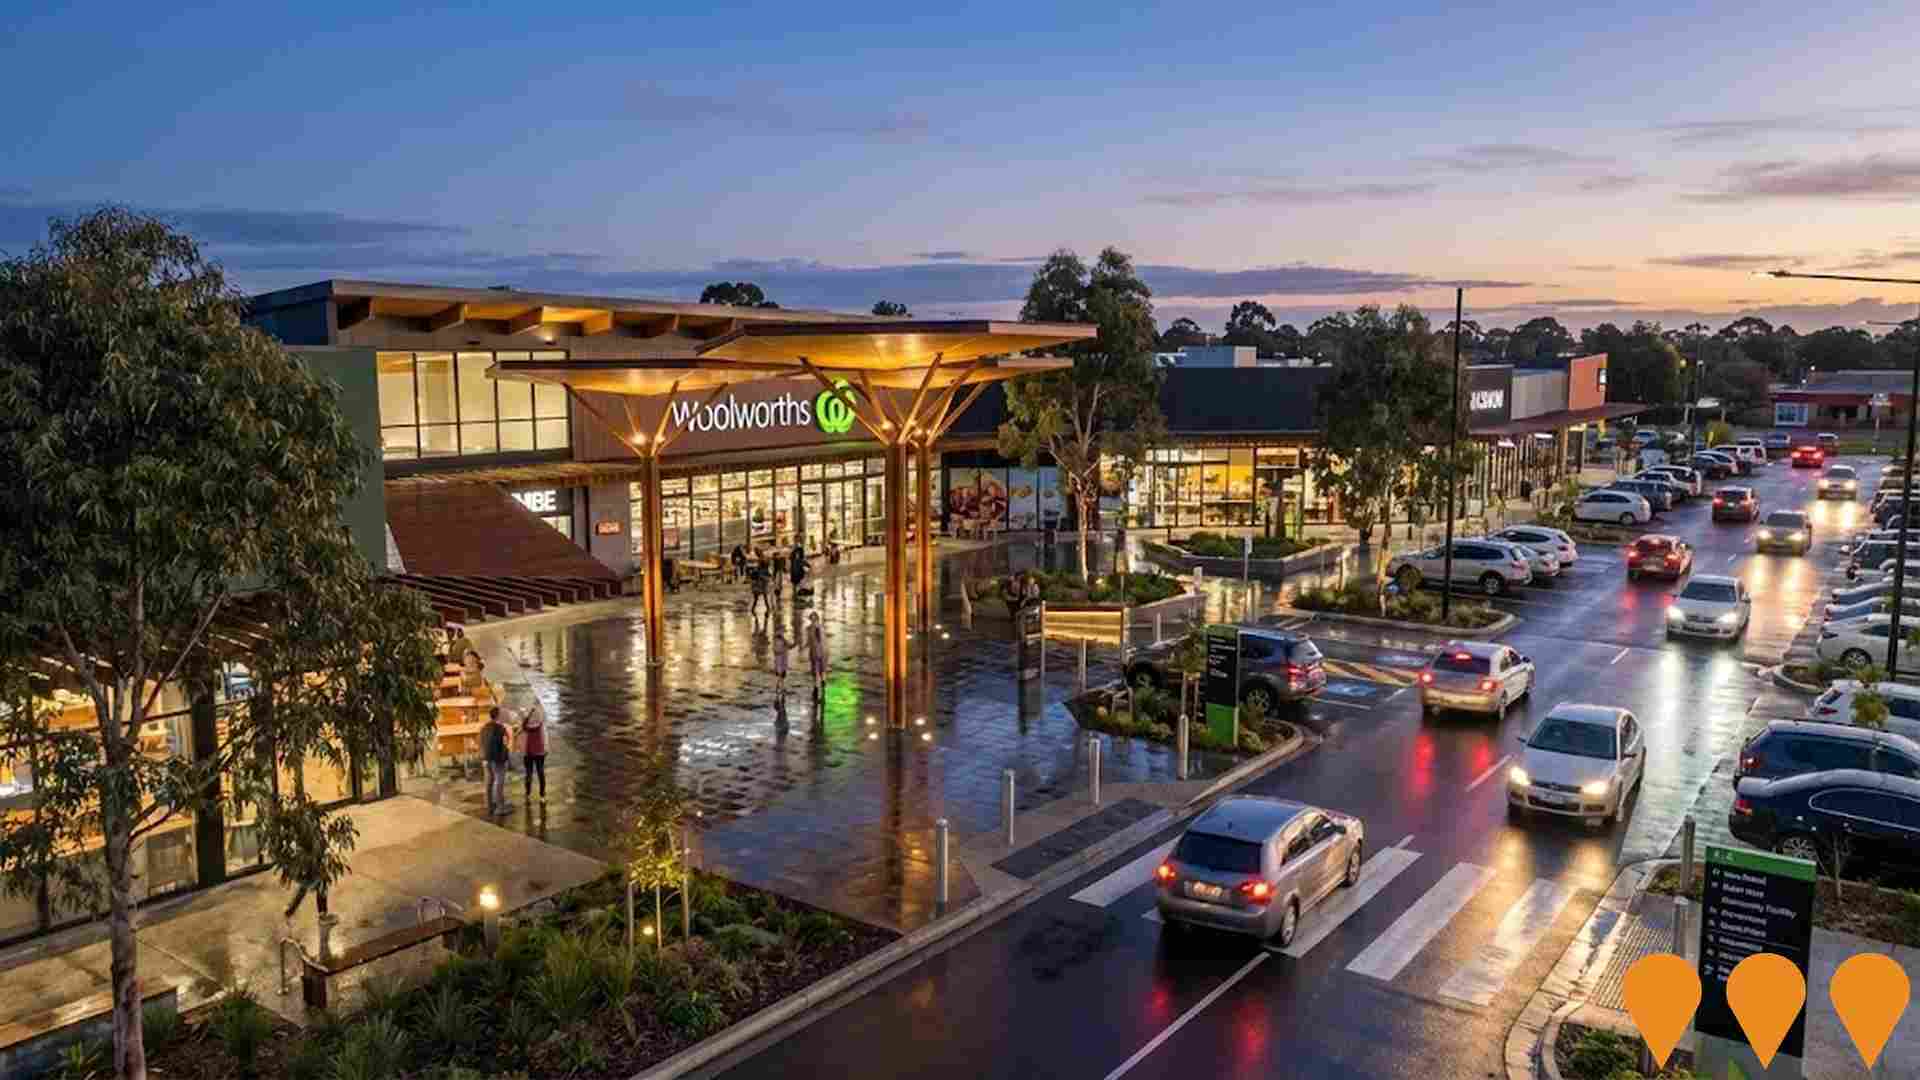
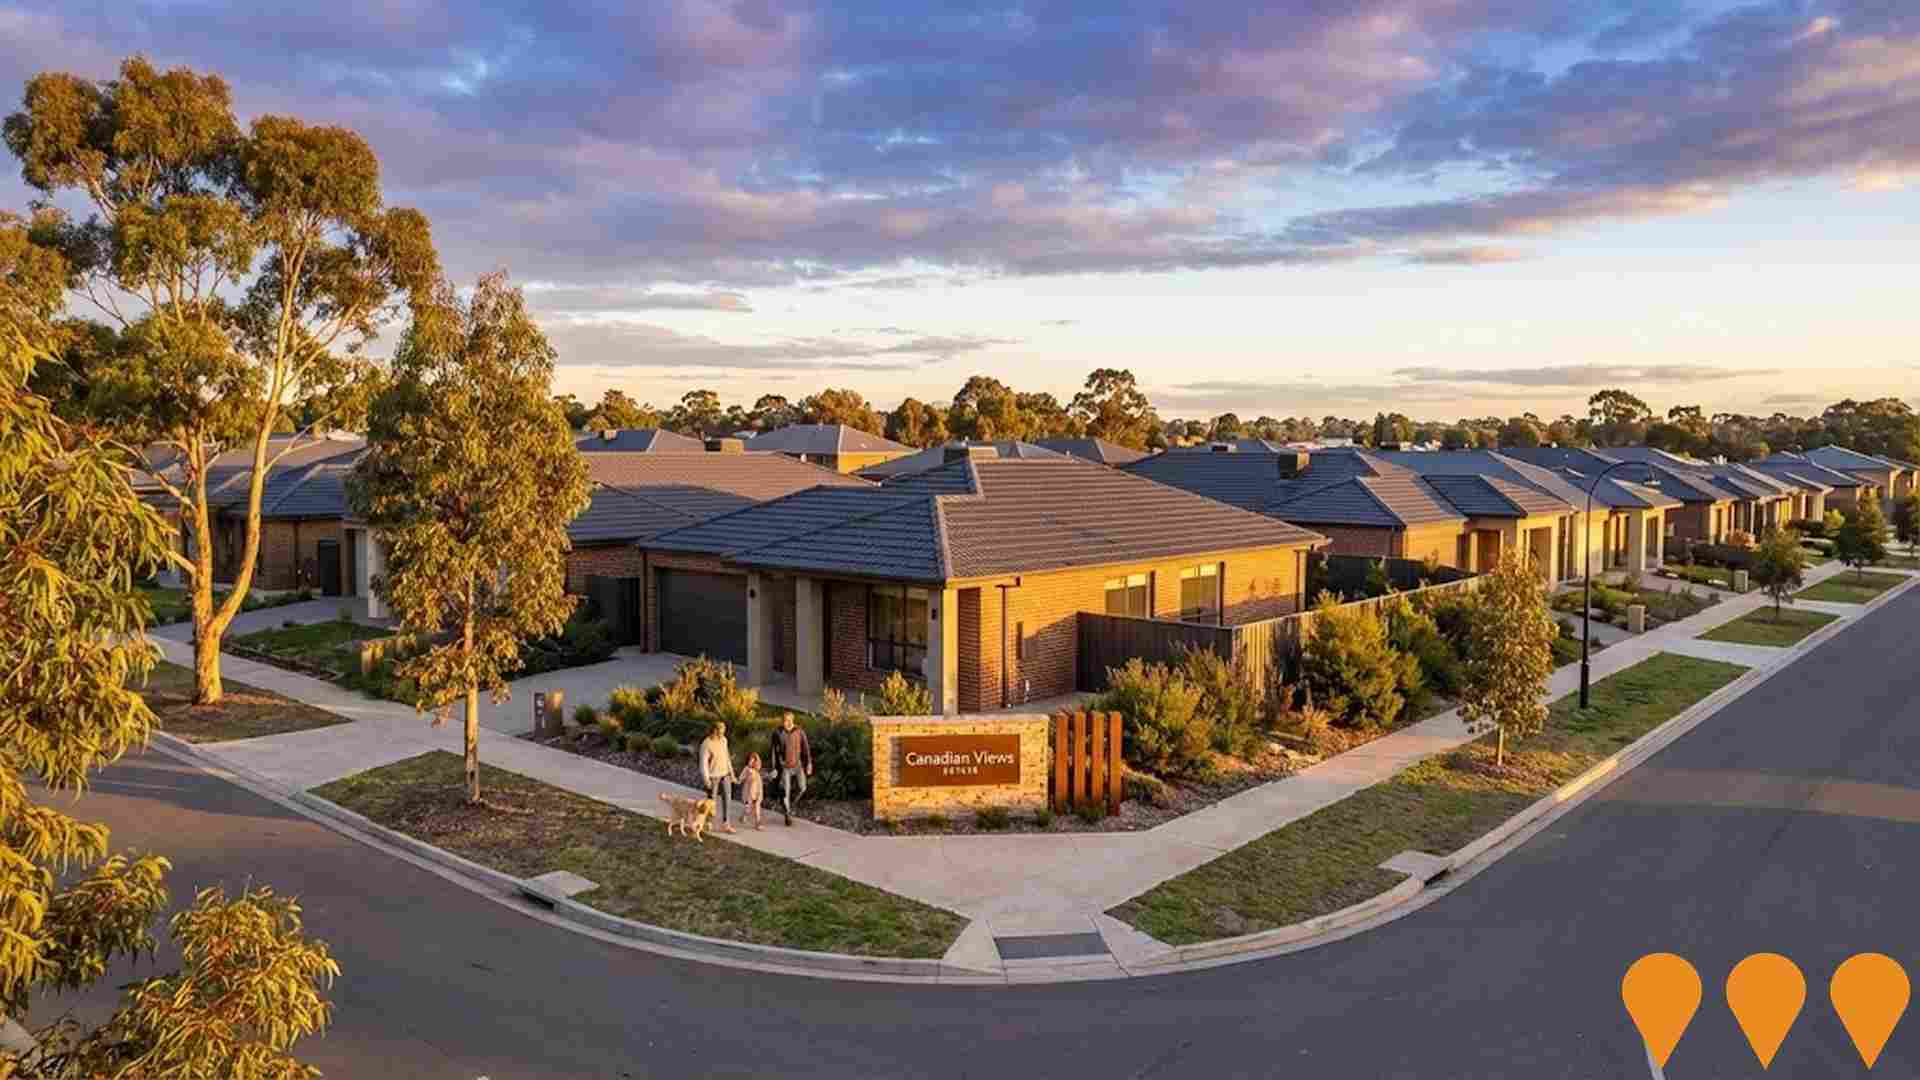
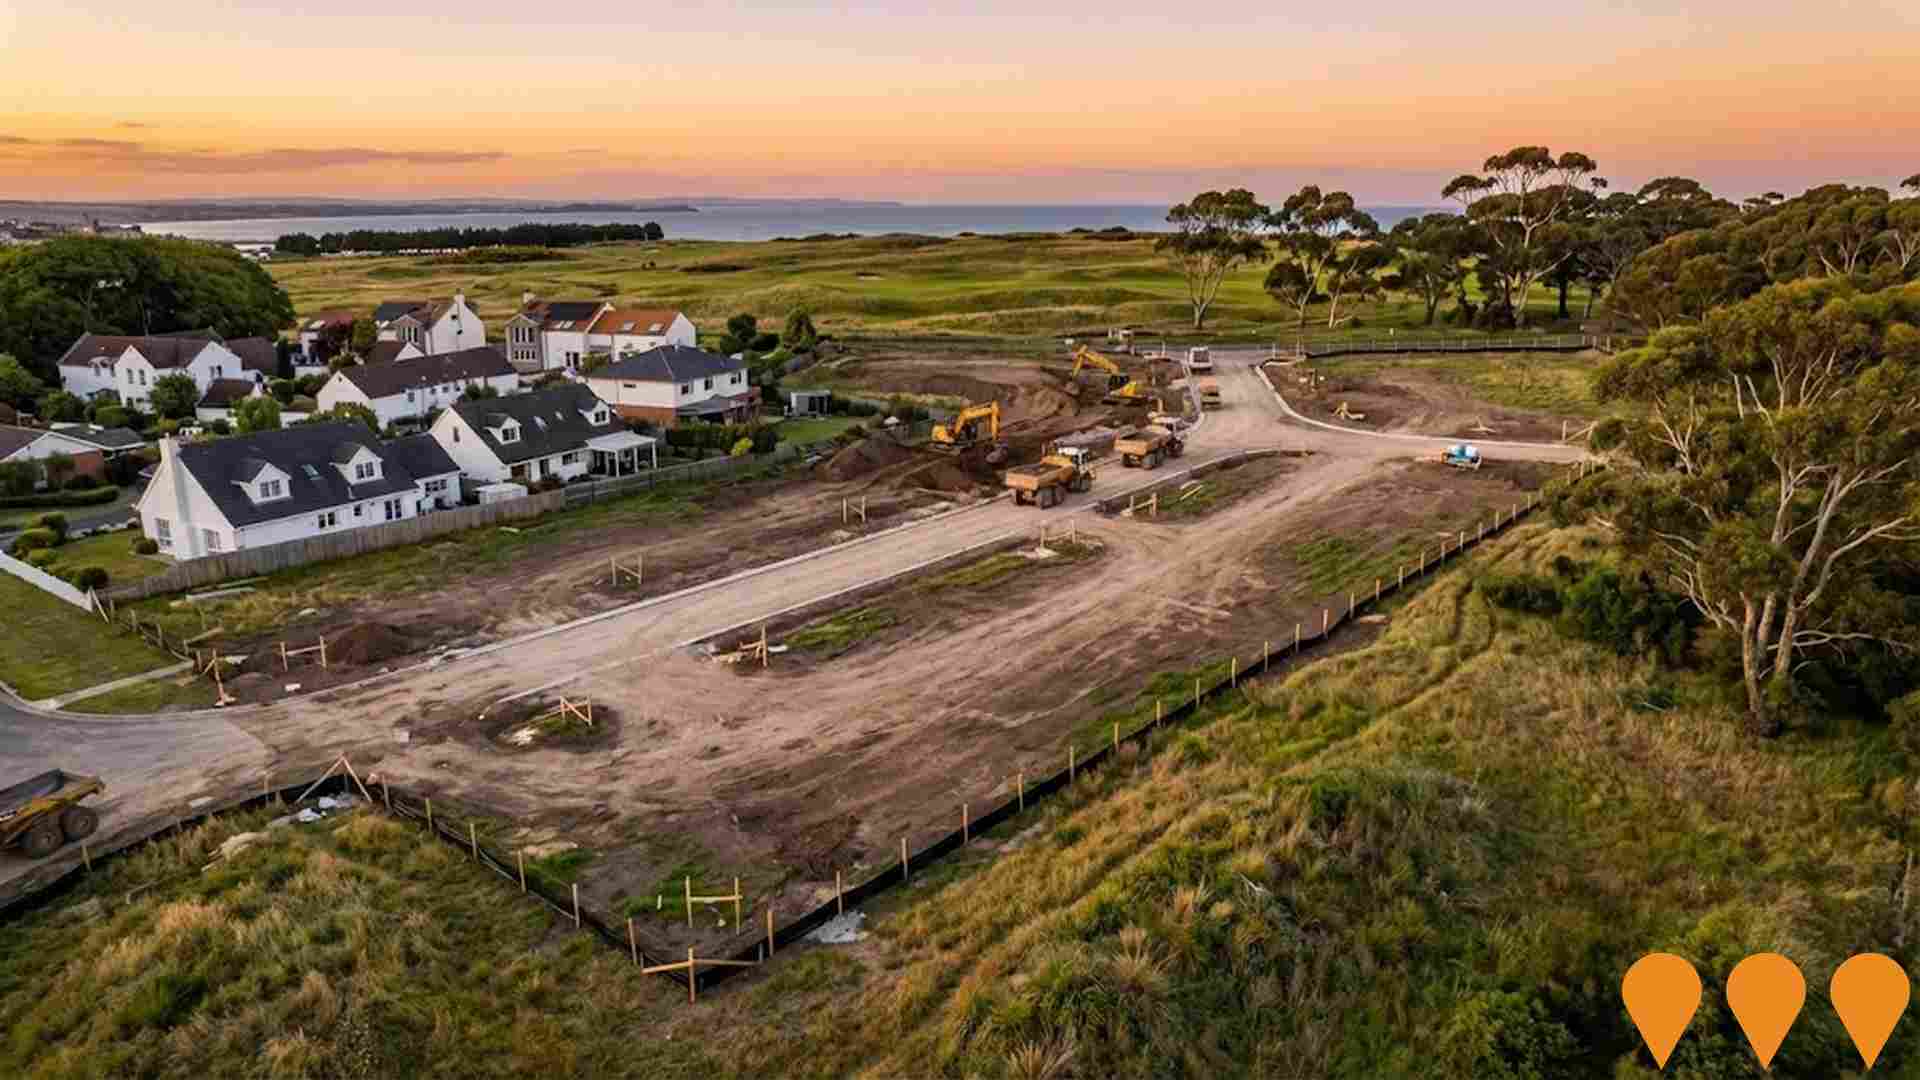
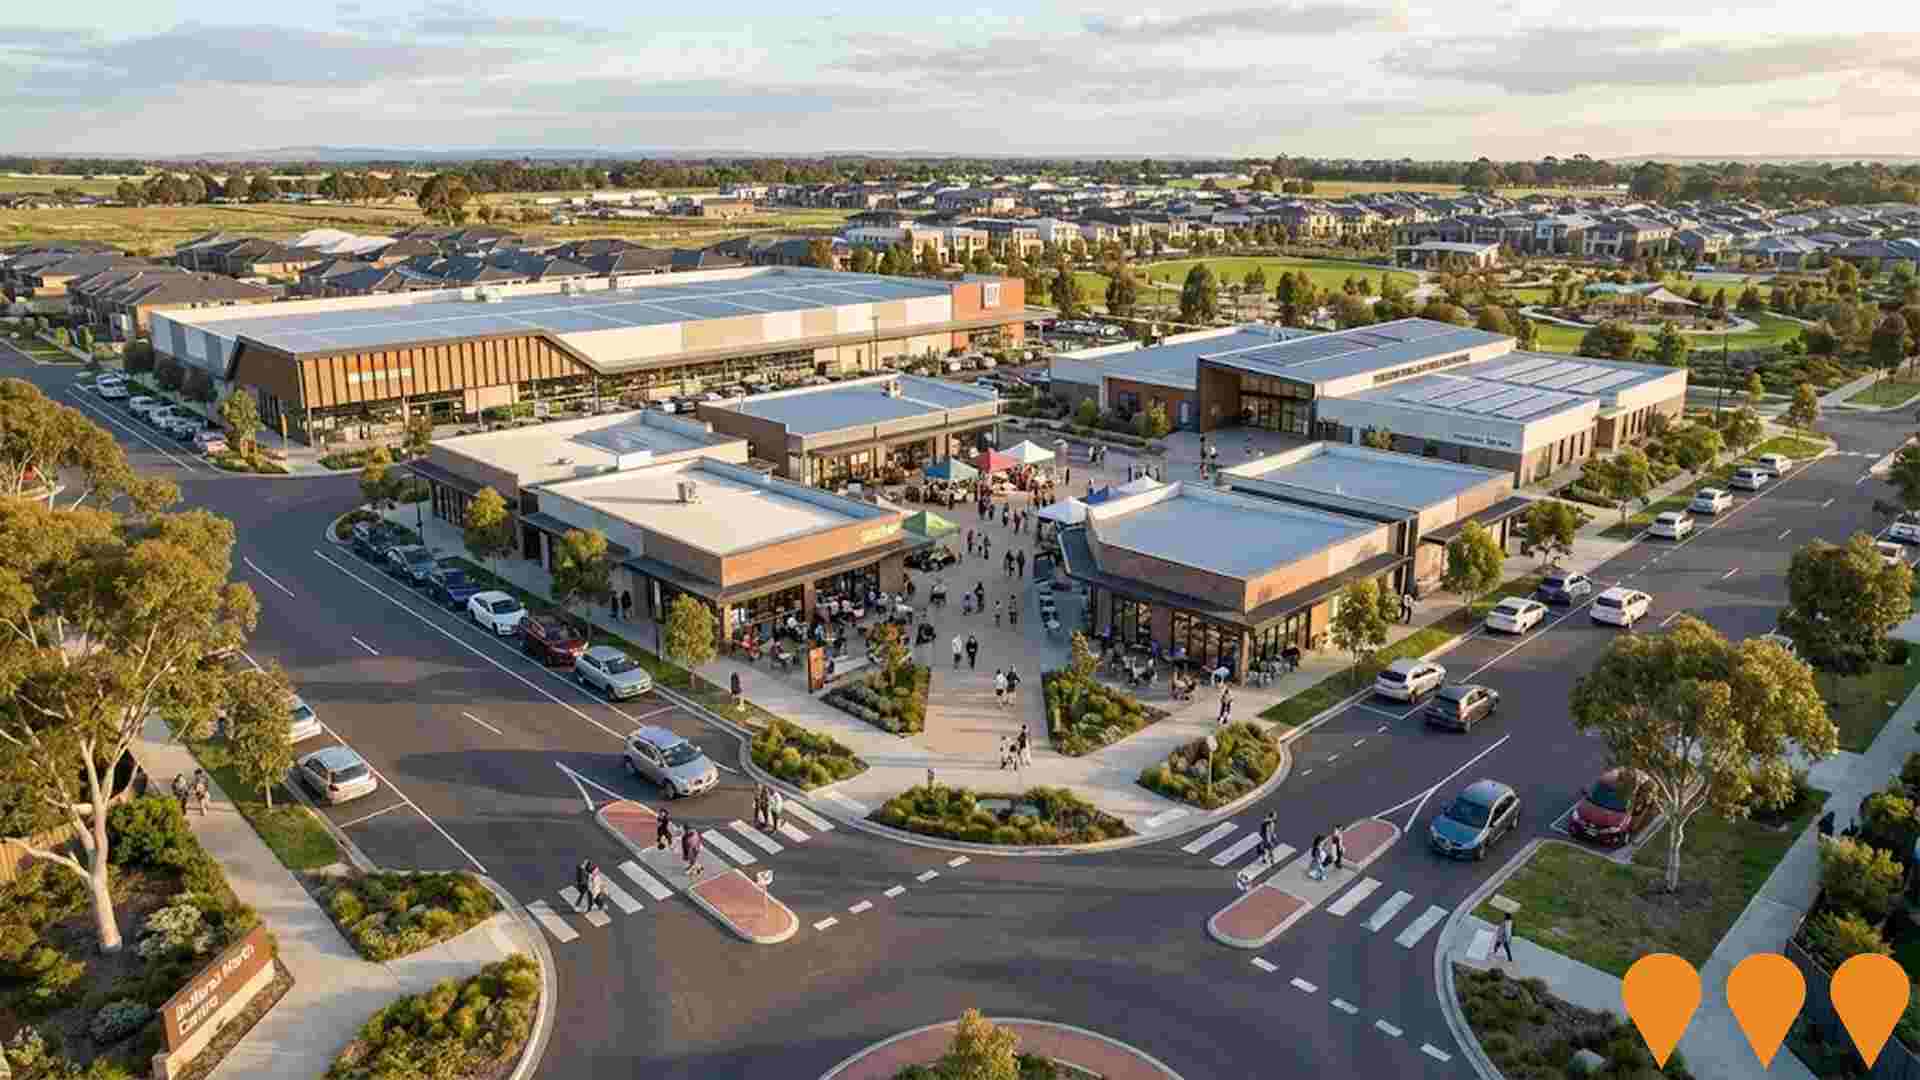
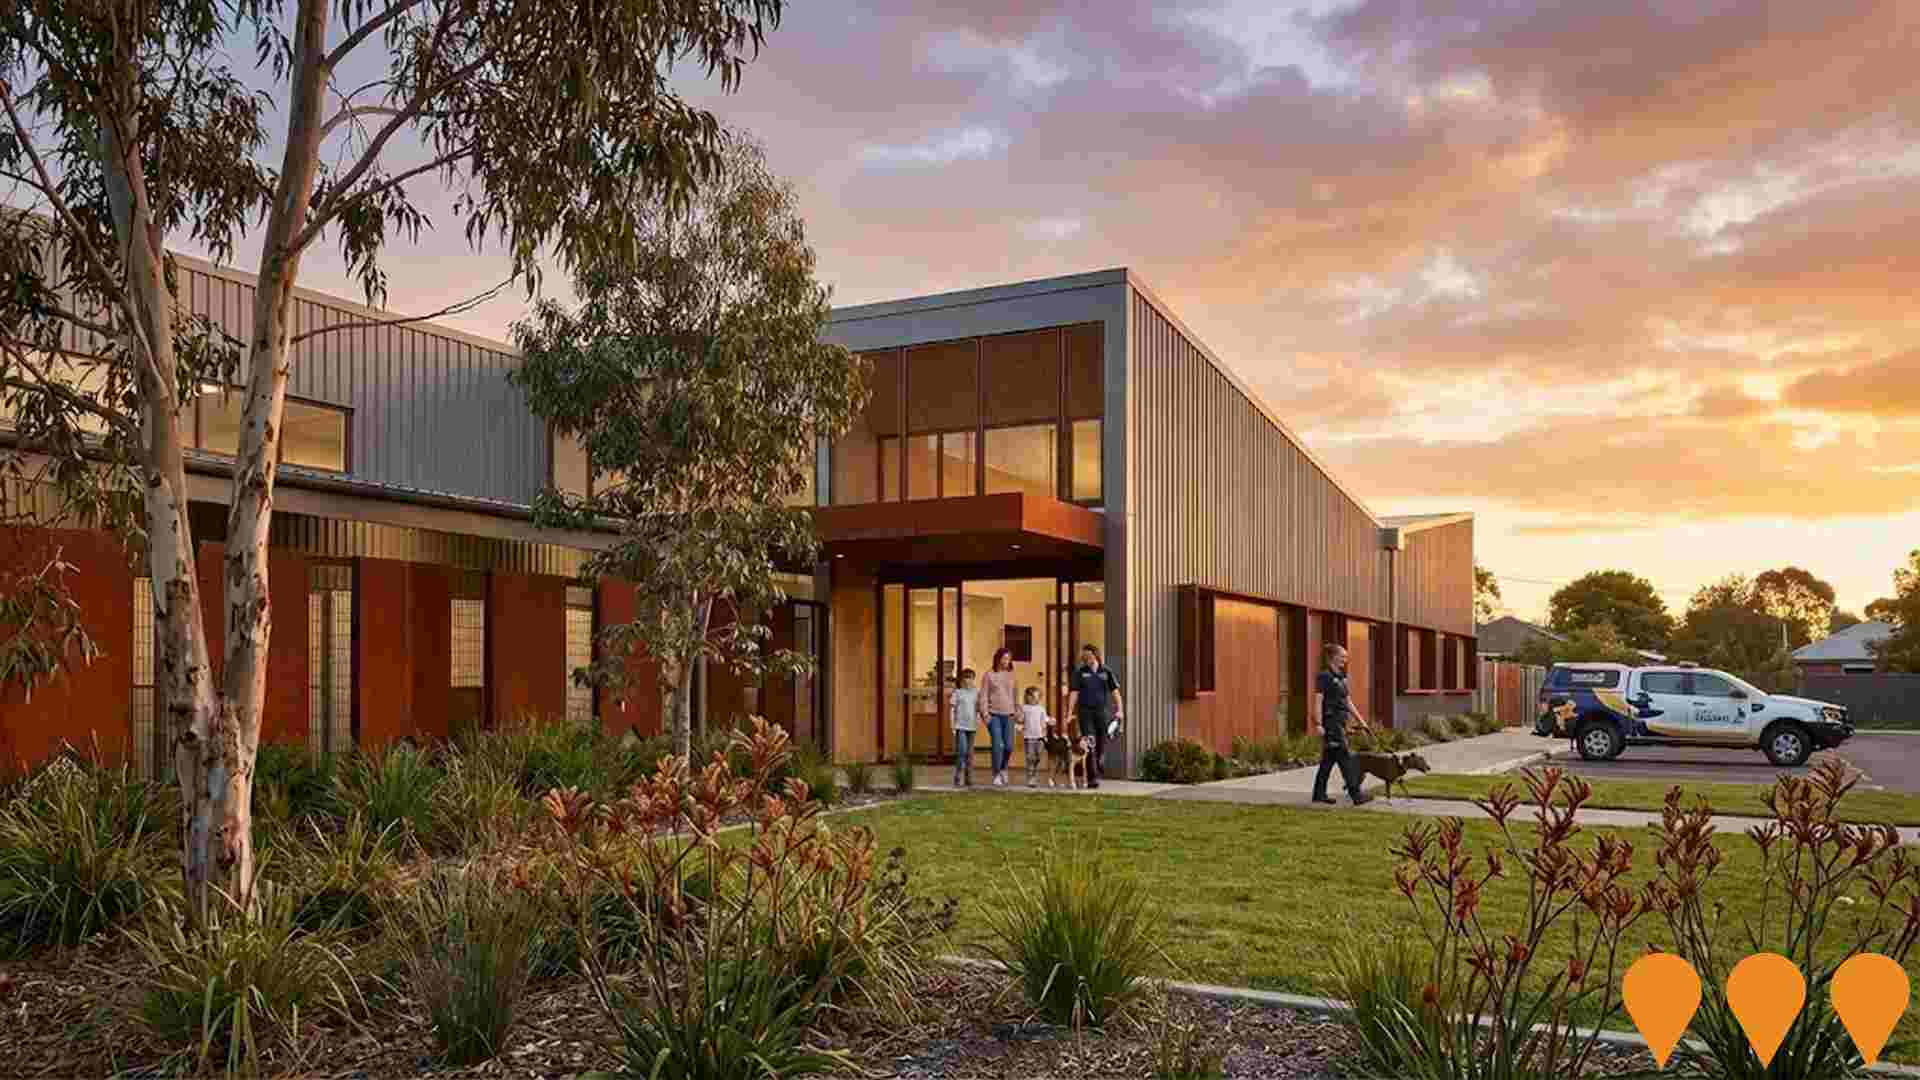
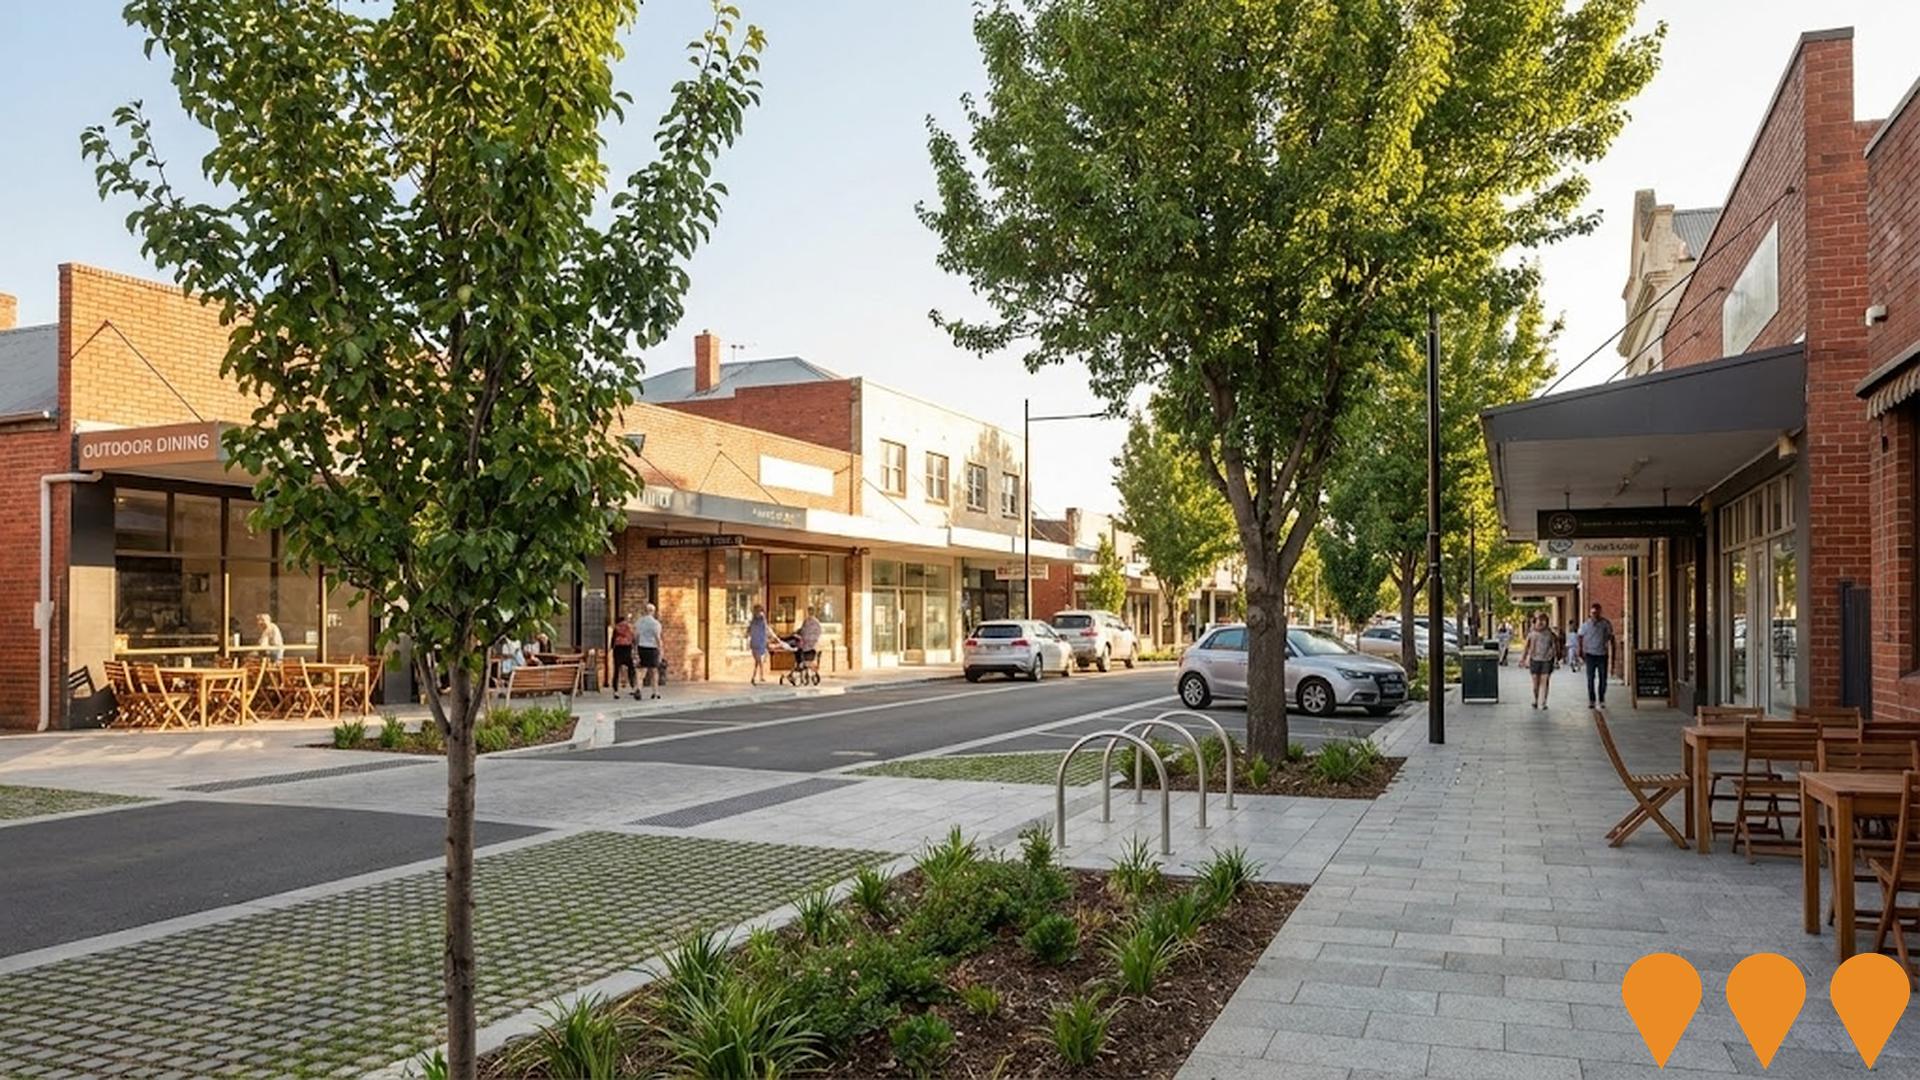
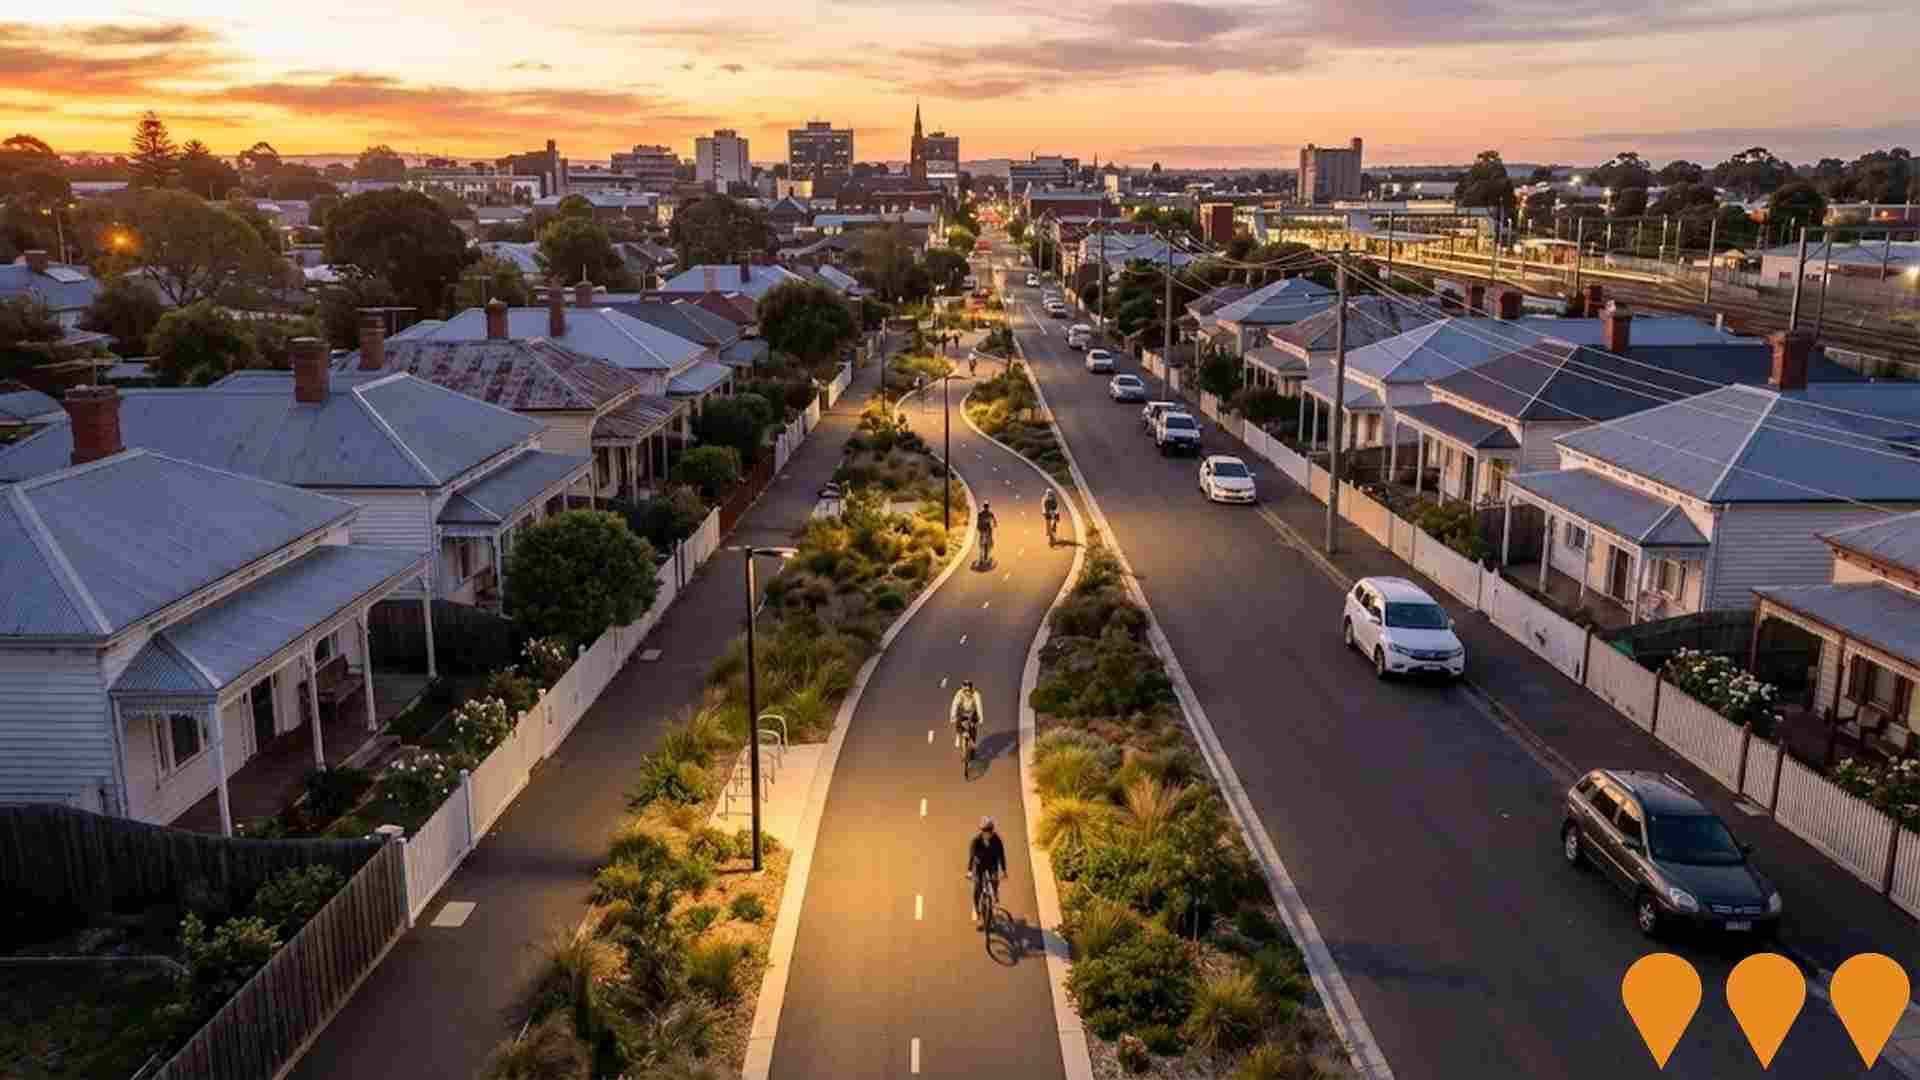
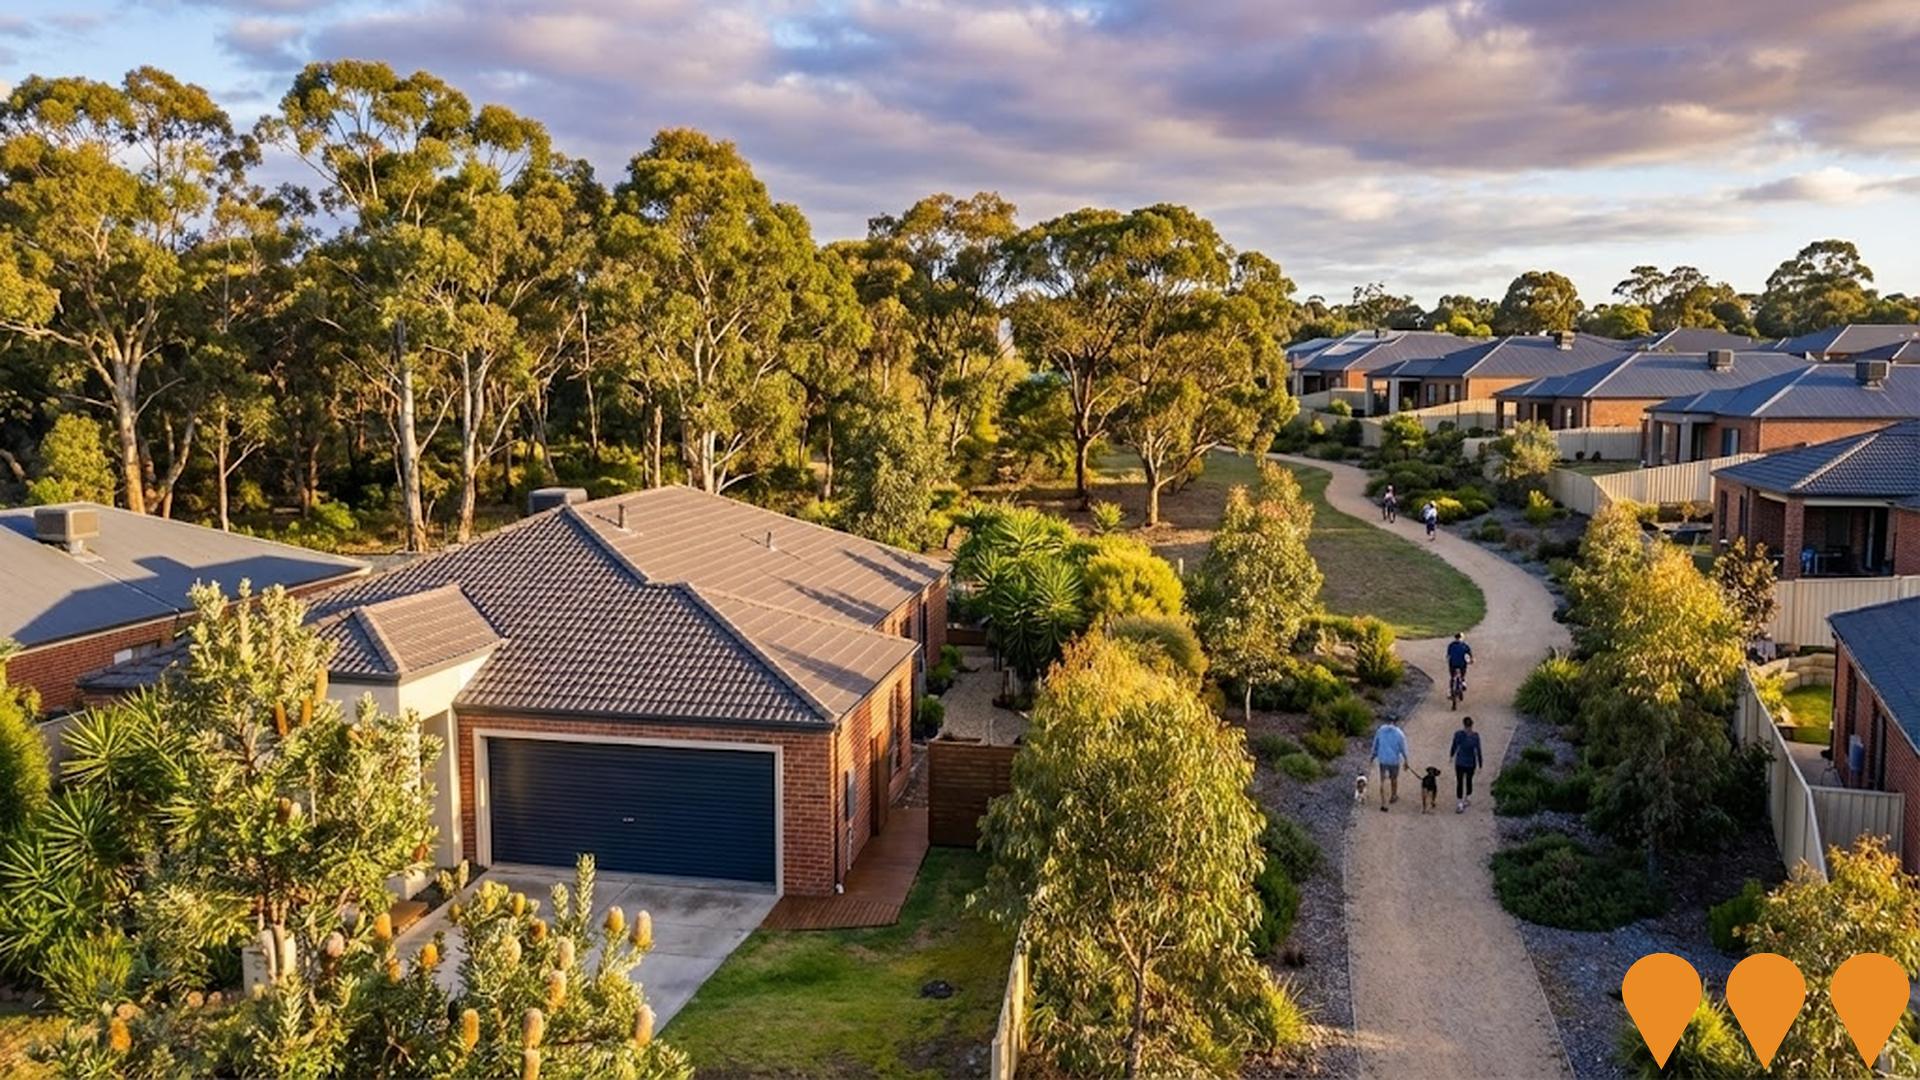
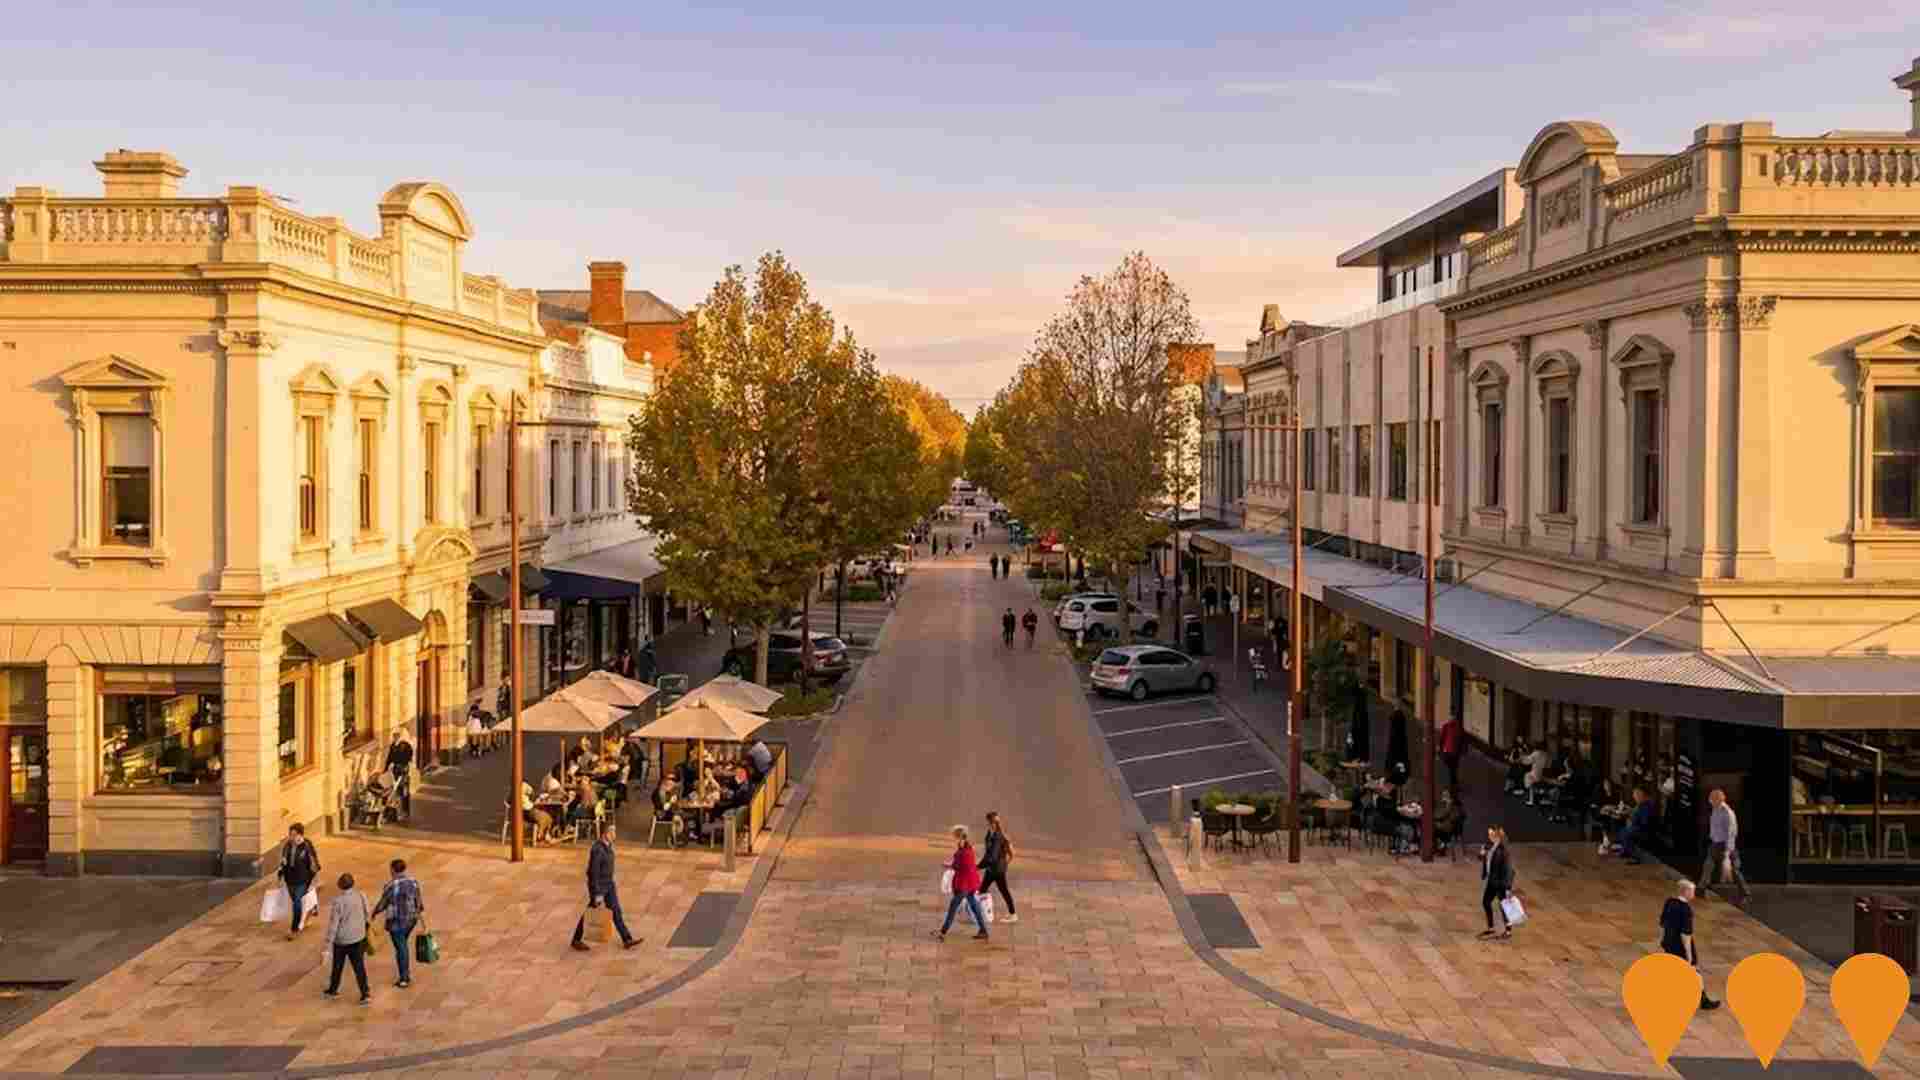
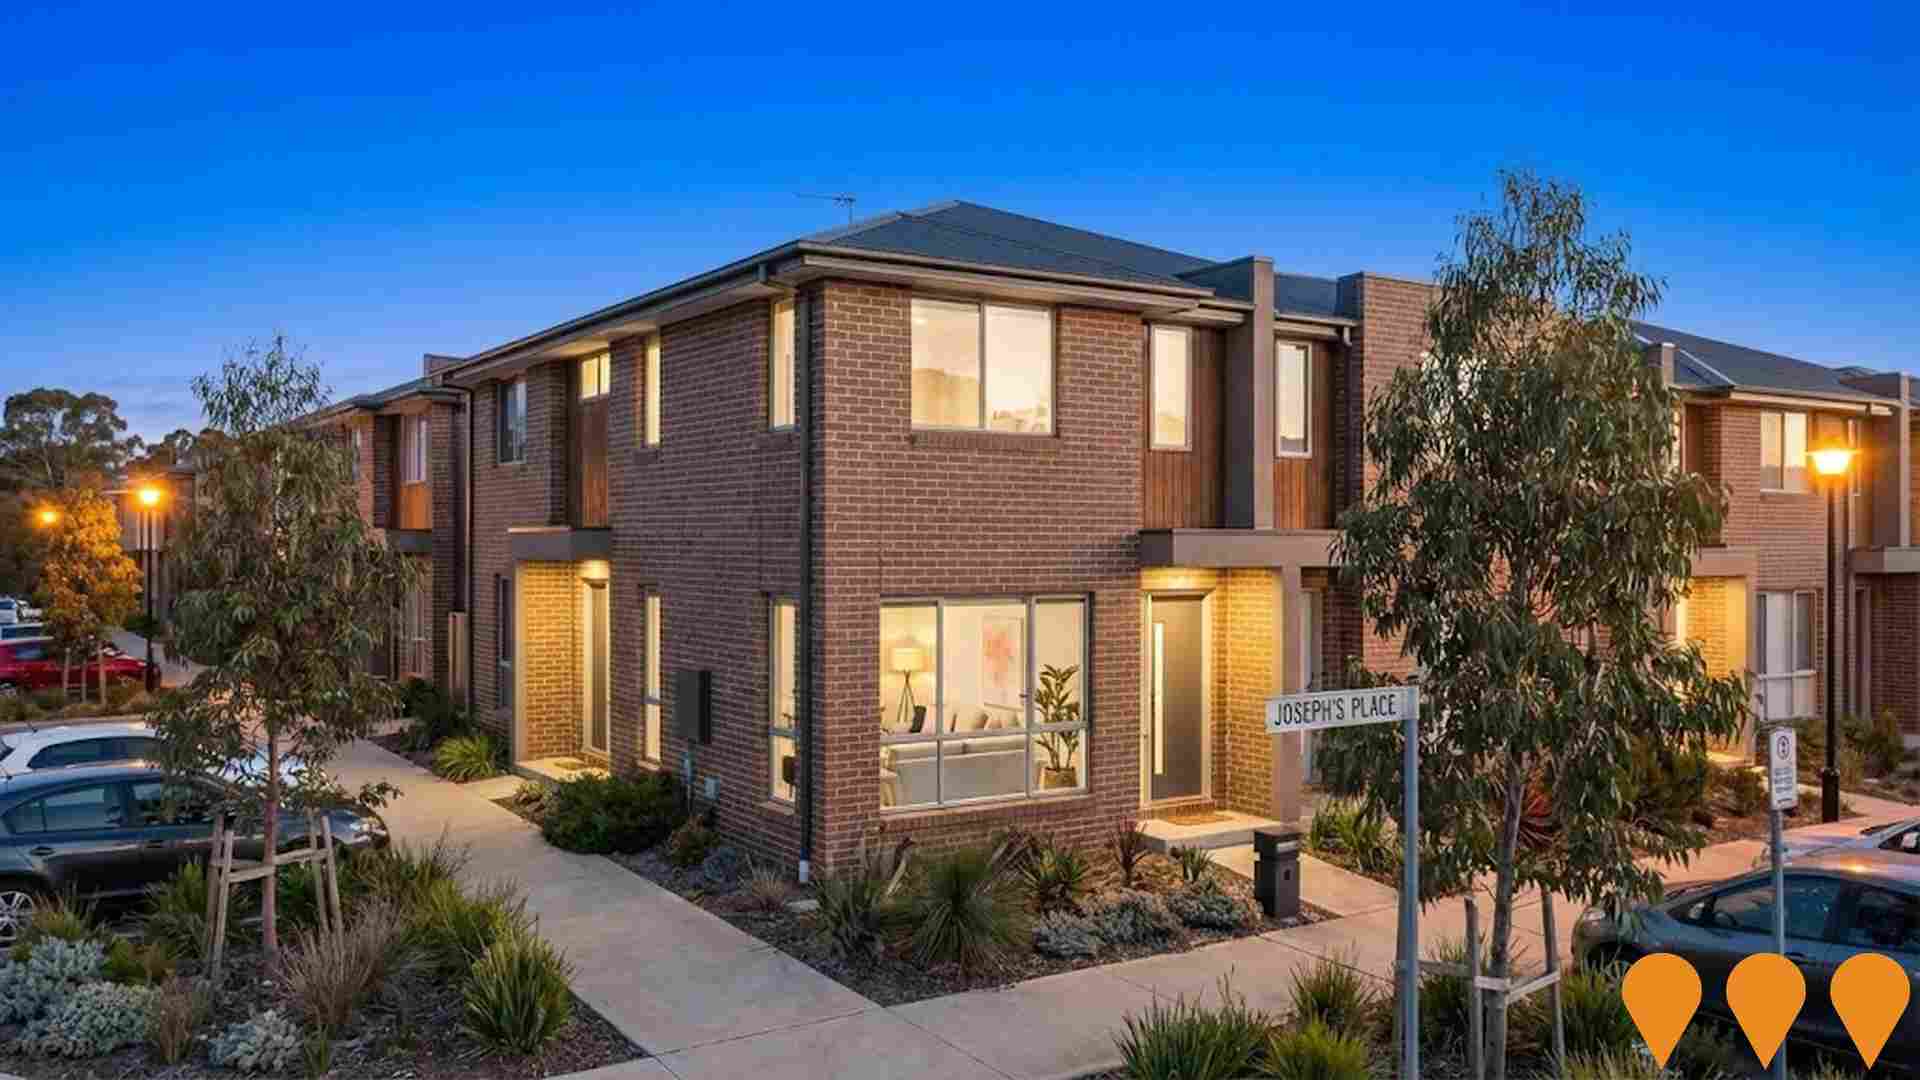
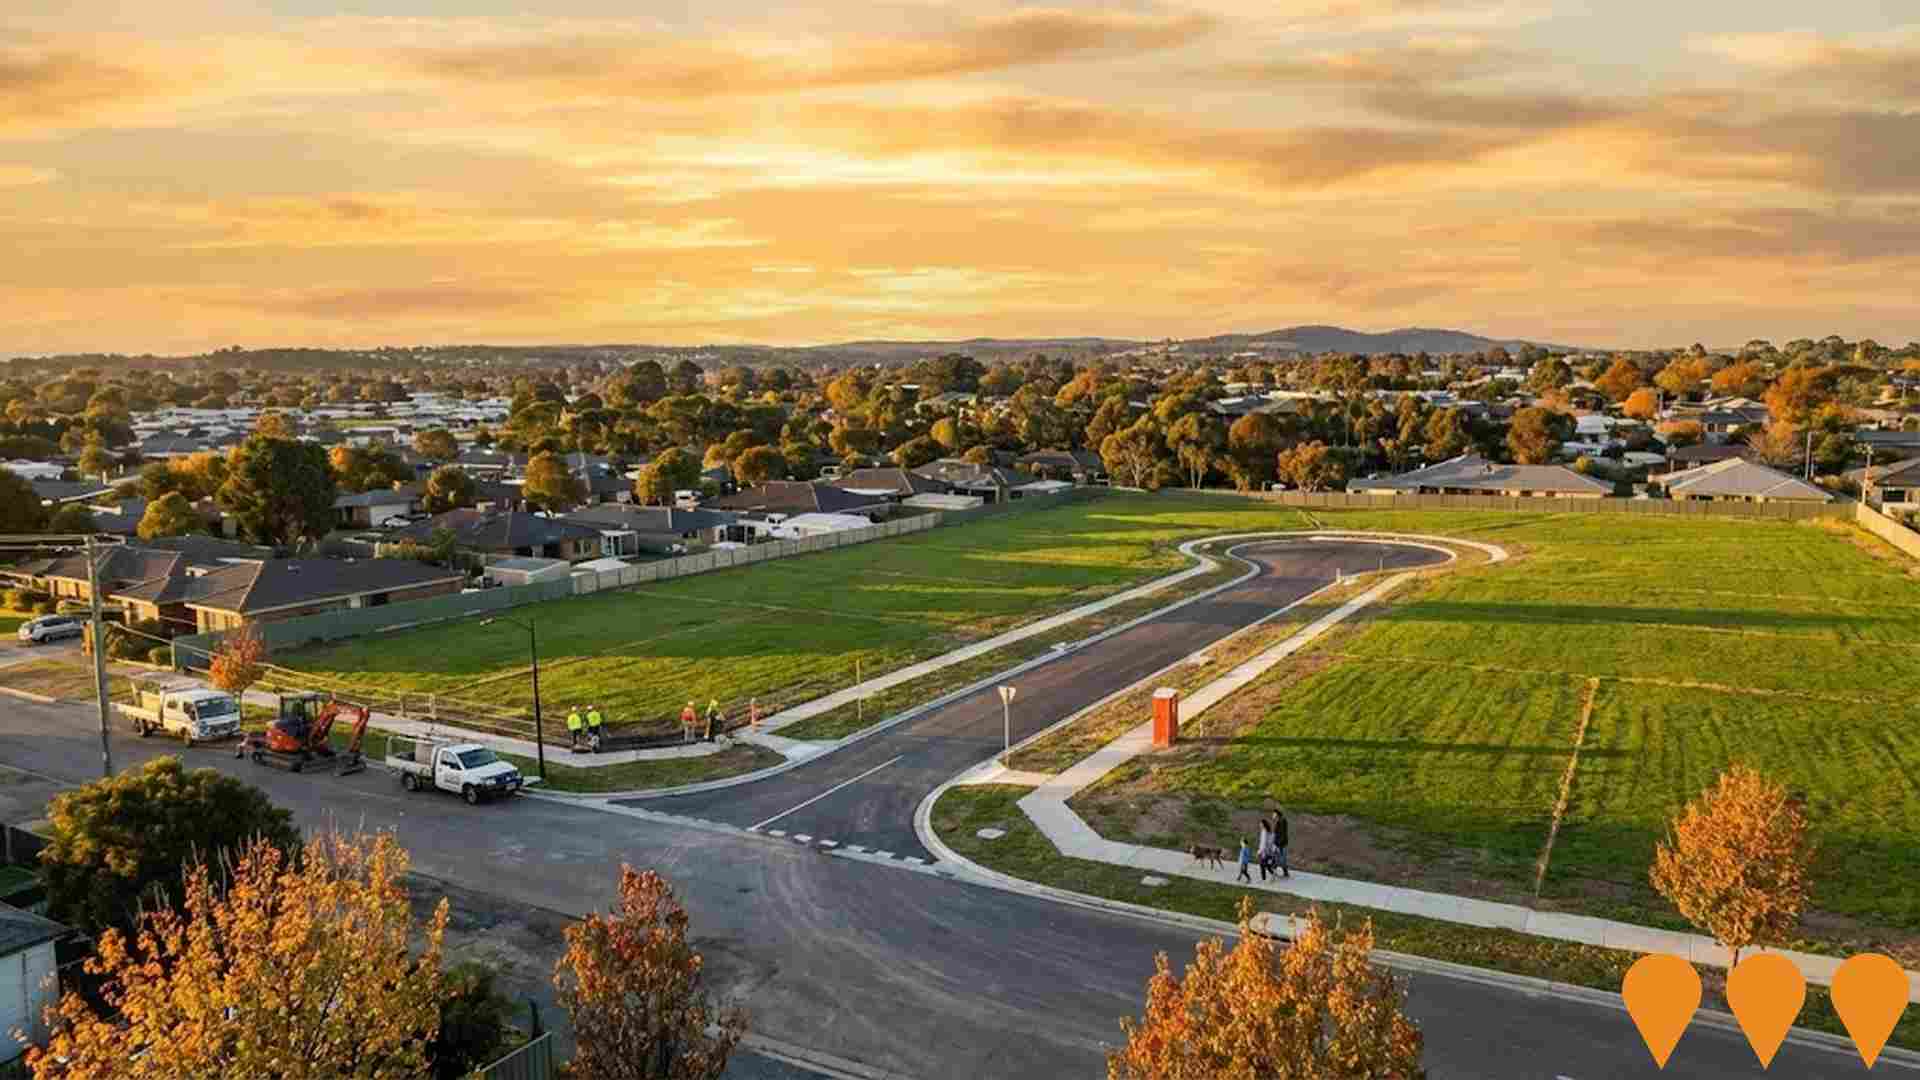
 Denotes AI-based impression for illustrative purposes only, not to be taken as definitive under any circumstances. Please follow links and conduct other investigations from the project's source for actual imagery. Developers and project owners wishing us to use original imagery please Contact Us and we will do so.
Frequently Asked Questions - Infrastructure
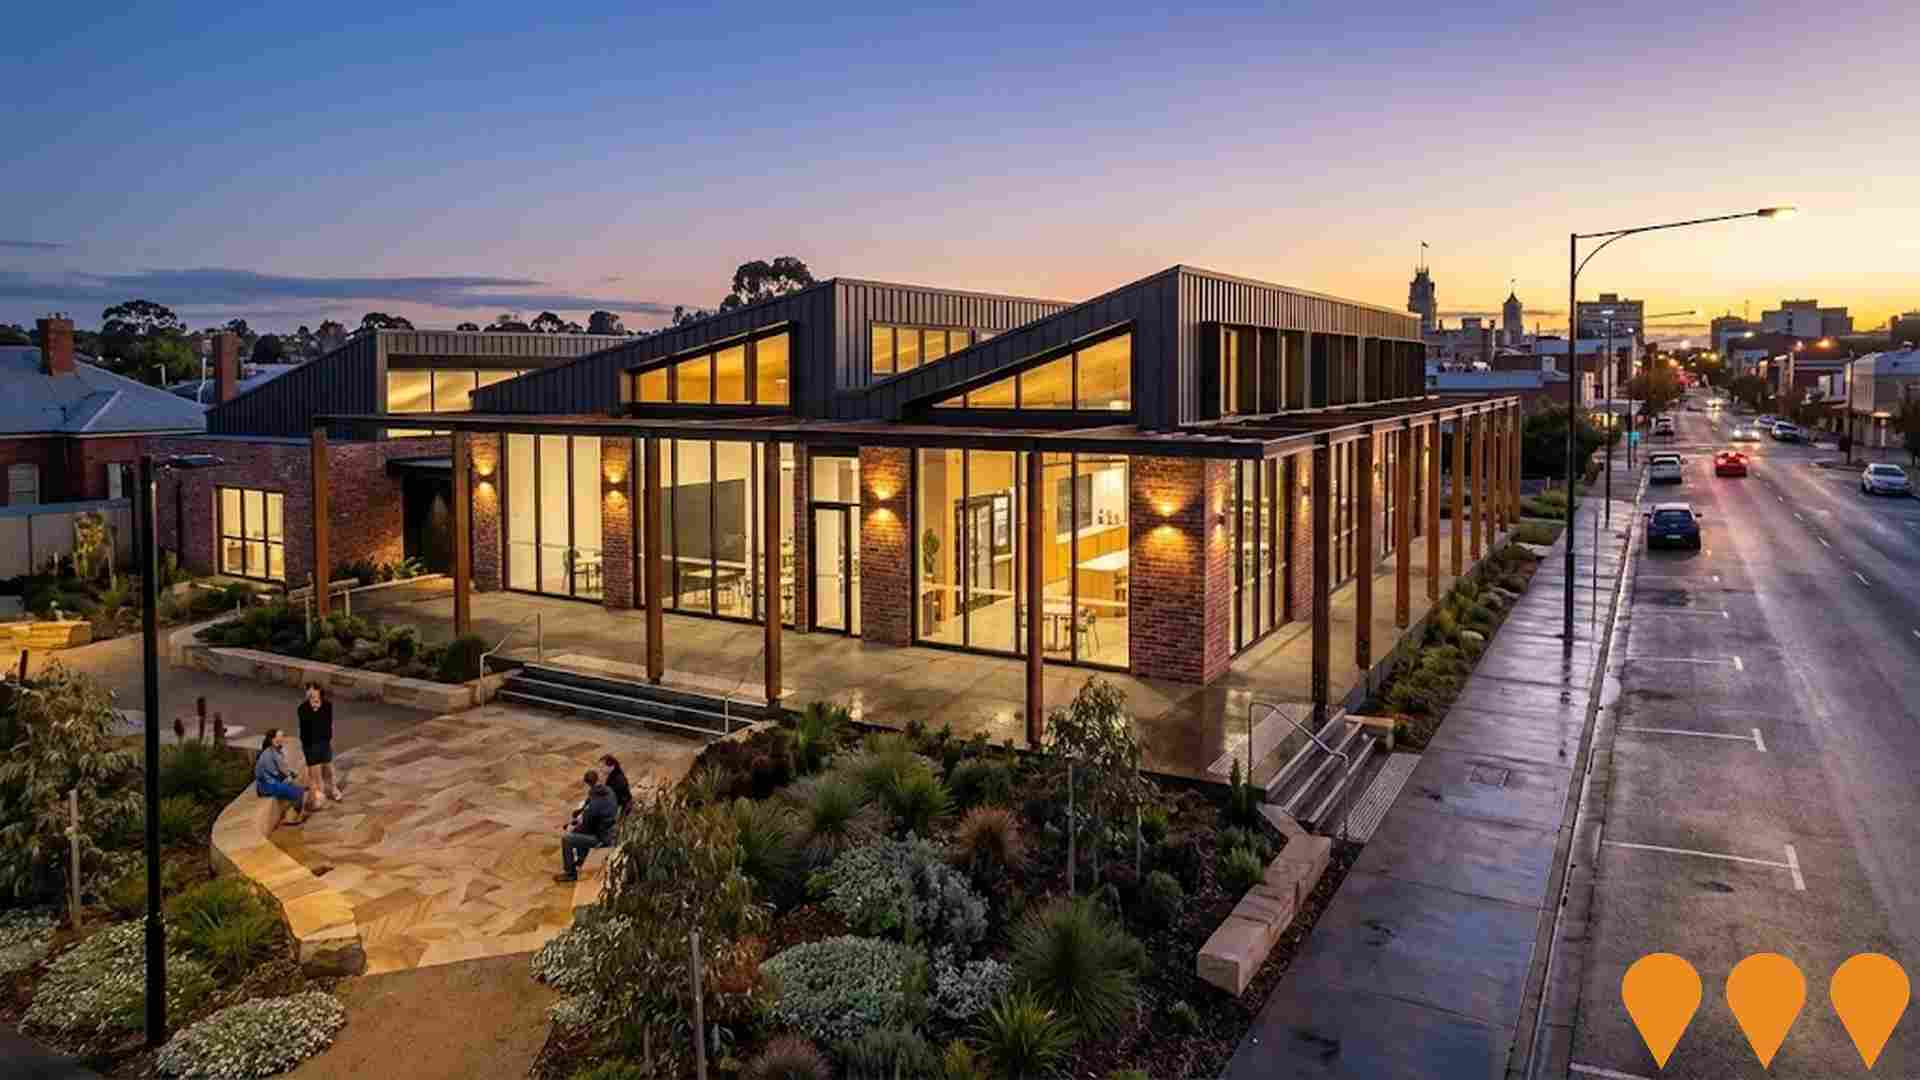
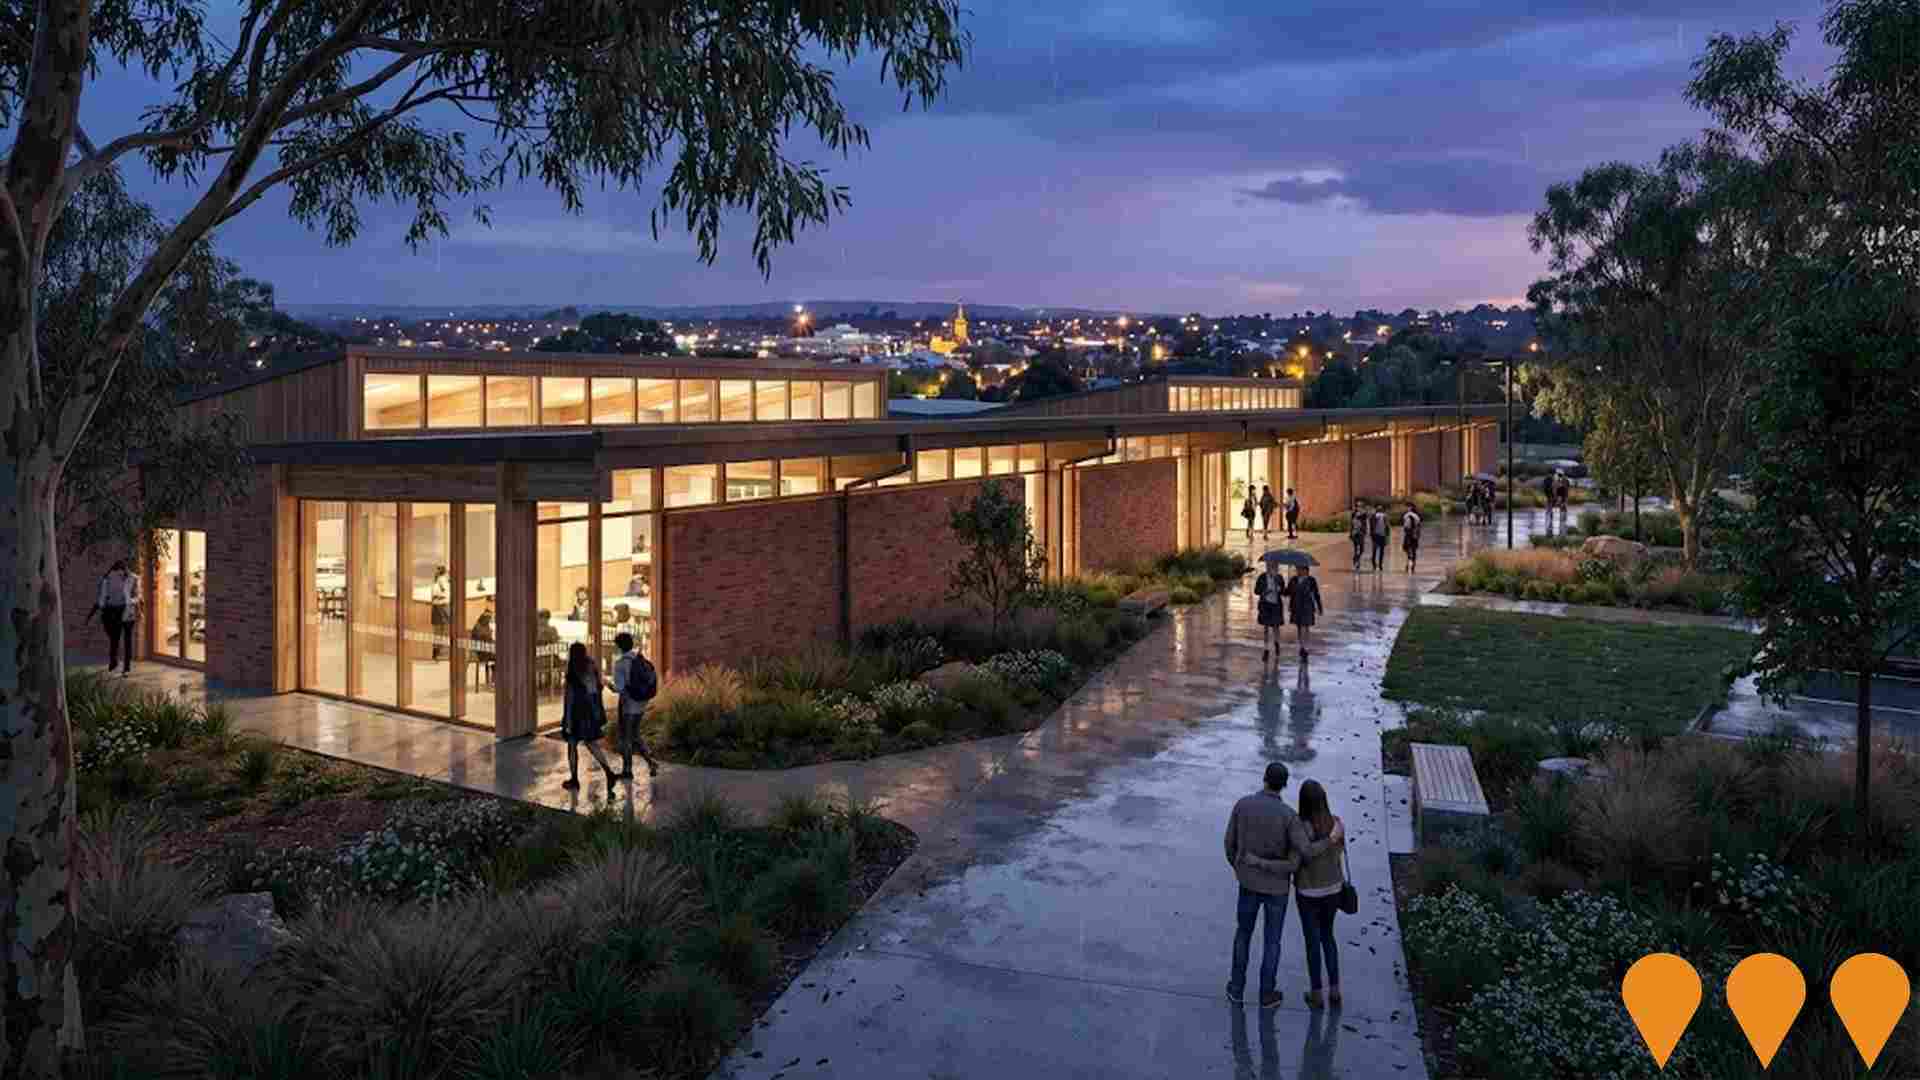
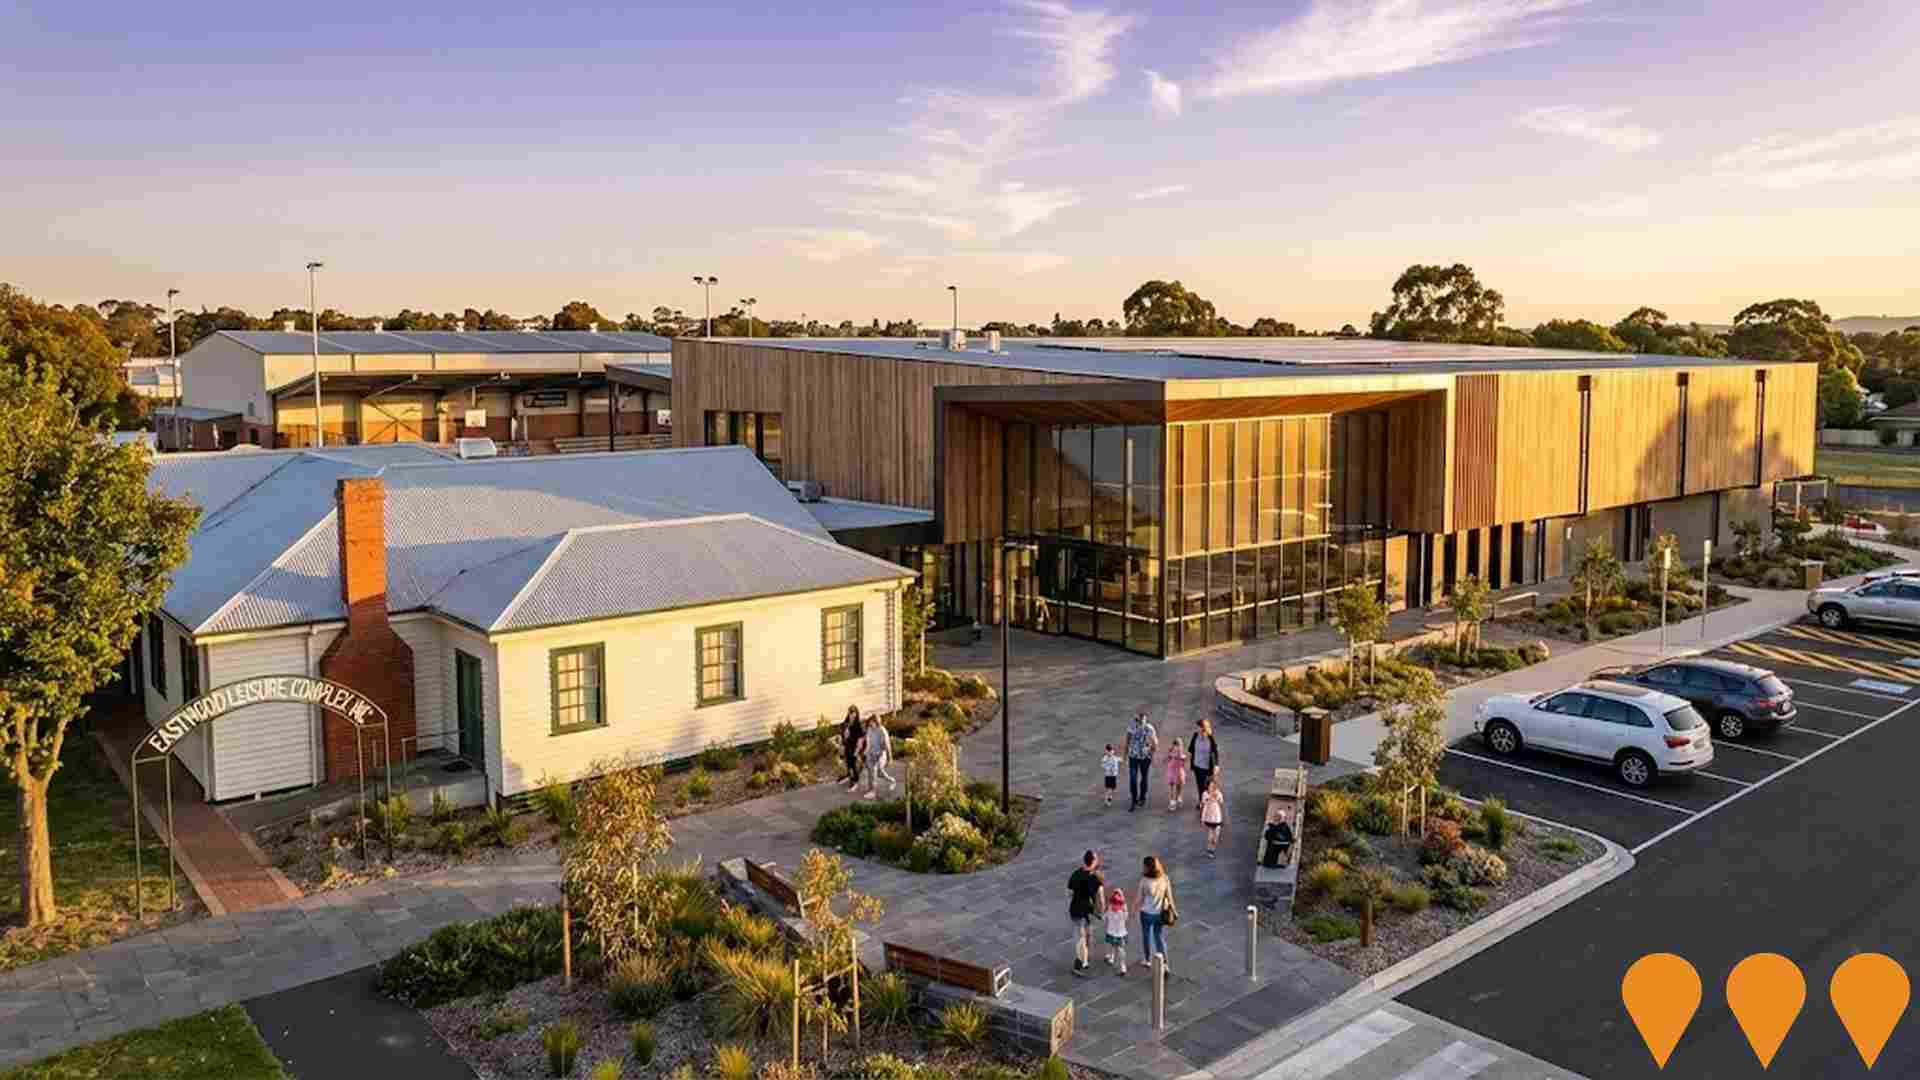
Eastwood Community Hub
A $17.54 million redevelopment of the Eastwood Leisure Complex in central Ballarat, replacing the 1940s-era facility with a contemporary, fully accessible multipurpose community hub. Jointly funded by the City of Ballarat and the Federal Government's Growing Regions Program, the project involves demolishing the outdated buildings, while retaining and recladding the existing basketball stadium. The new hub features a main hall for 275 people, training rooms, flexible meeting spaces, a conference and event space, and a 5-star Green Star target.
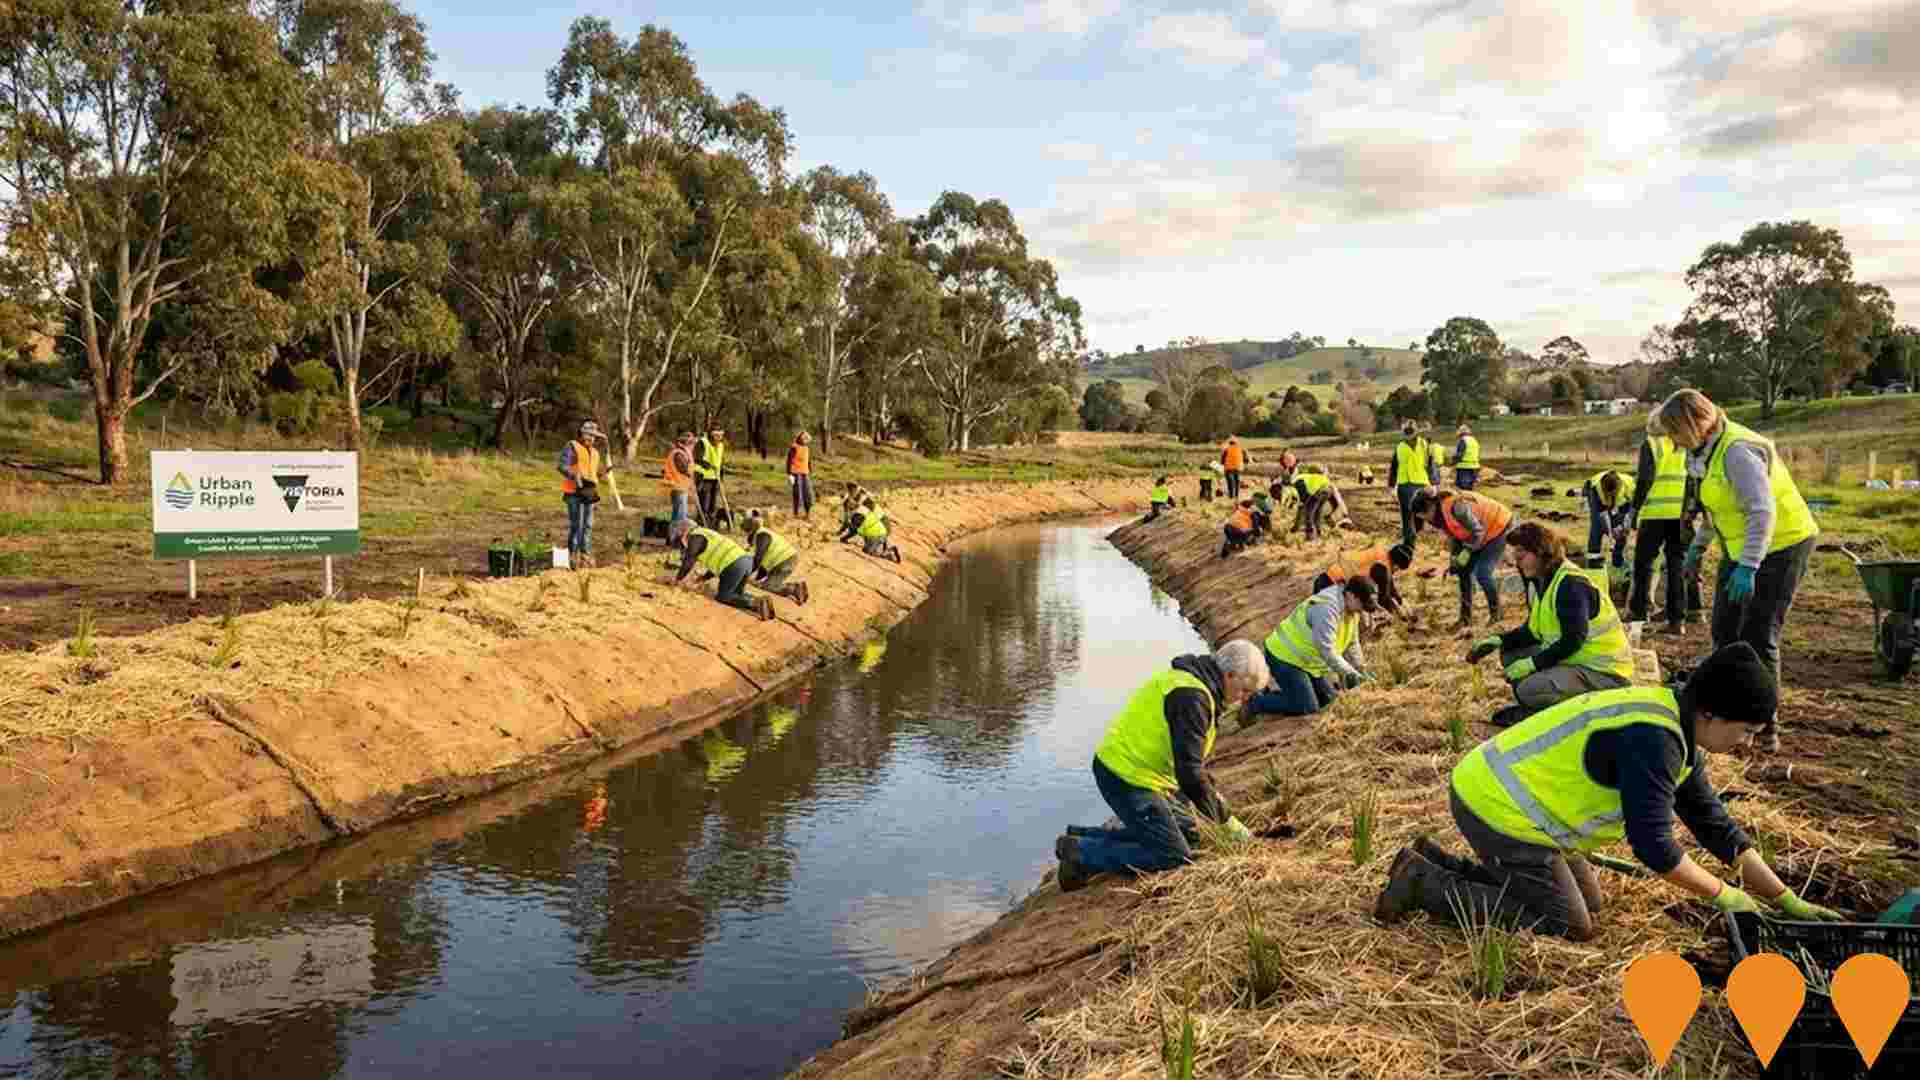
Urban Ripple: Restoring our Yarrowee River and its Little Creeks
A community-led waterways restoration project funded by a Victorian Government Green Links Program grant of $701,000. Led by the Bunanyung Landscape Alliance in partnership with the Yarrowee-Leigh Catchment Group, the project restores 13 sites along Ballarat waterways spanning 80.5 hectares and 9.8 kilometres of the Yarrowee River, Specimen Vale Creek, Canadian Creek and connecting tributaries. Works involve extensive weed control, replanting 39,500 indigenous plants, and creating habitat for threatened species including the Growling Grass Frog, brush-tailed phascogale and platypus.Delivery is led by five local Landcare and Friends groups, with 66 scheduled planting days in 2025 alone. The project also integrates community planting events, Traditional Owner cultural knowledge, and ecological plant selection guided by Ballarat ecologist Tim D'Ombrain's native plant community mapping system. Target completion is 2026.
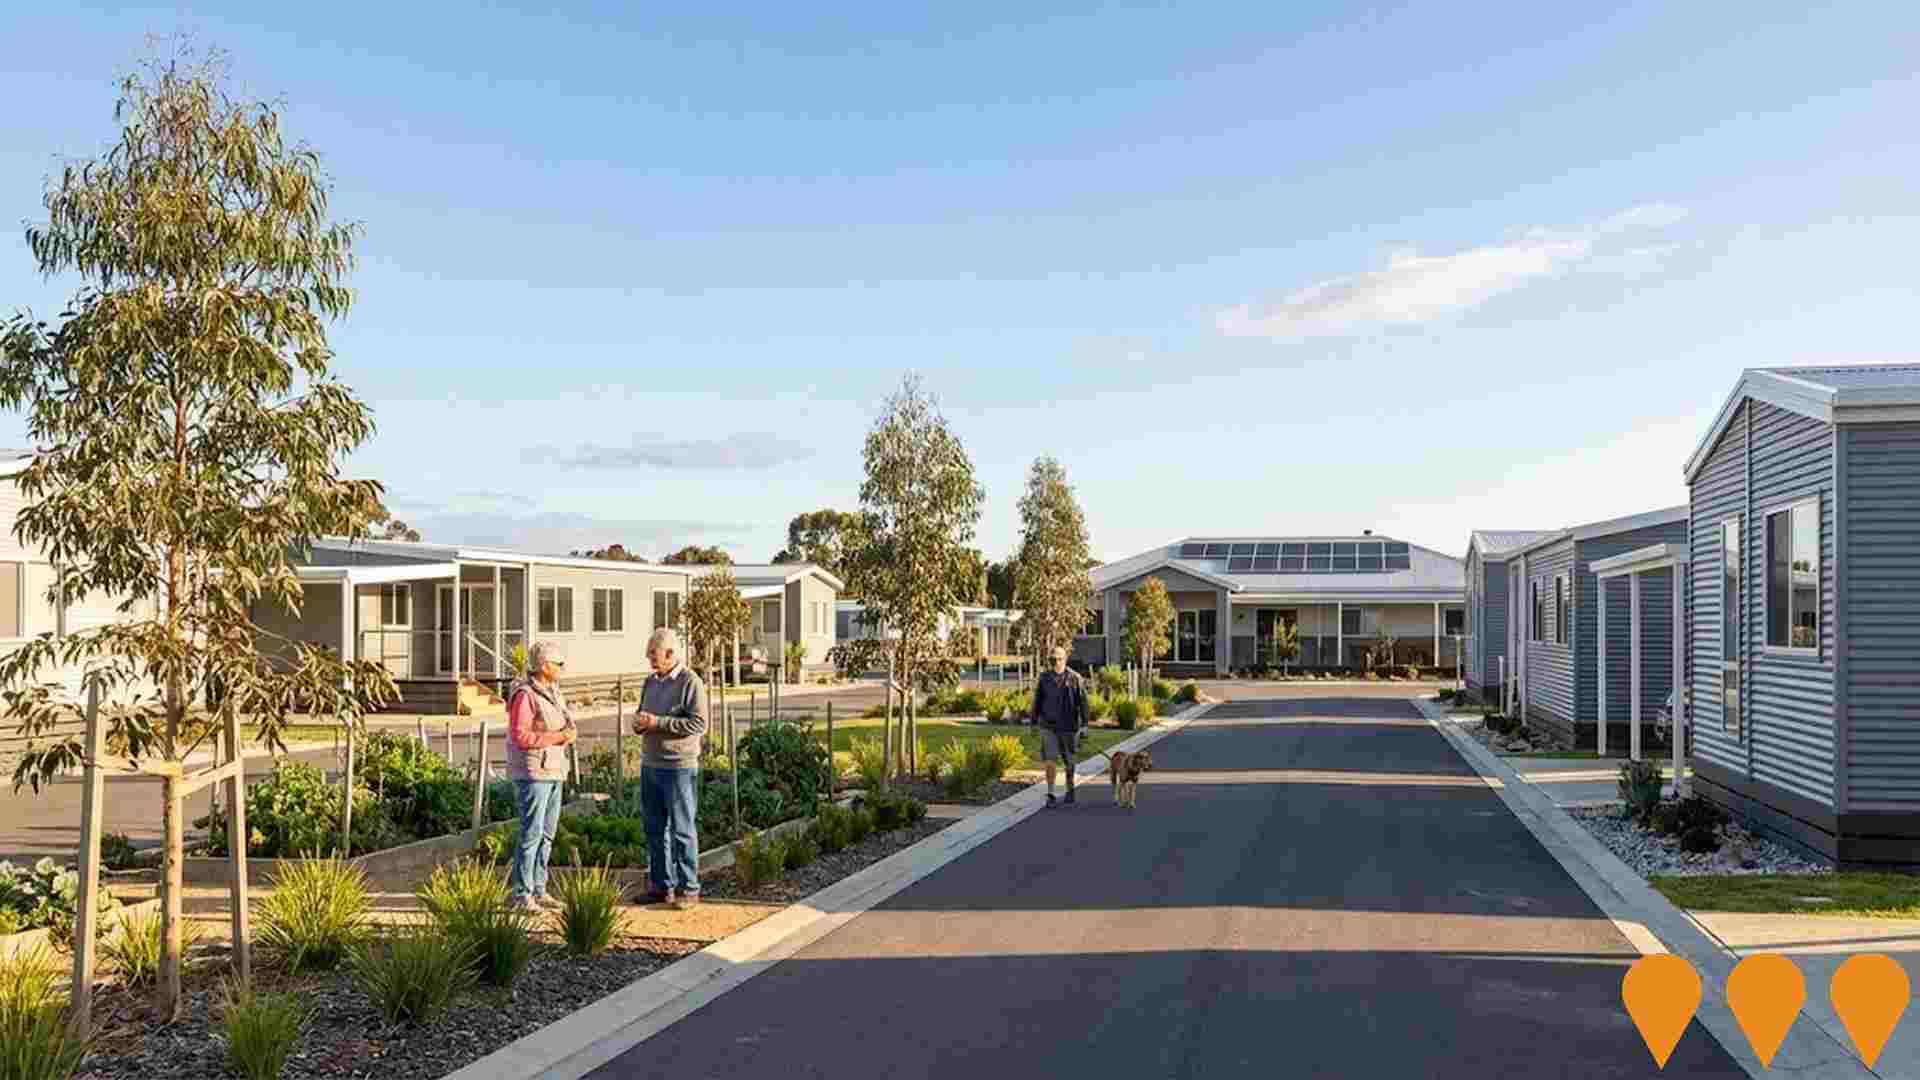
Equinox Ballarat Lifestyle Village Expansion
Over-55s land lease community in Brown Hill. Stage 2 (61 homes) is complete and occupied; Stage 3 new homes are being released and delivered. The expansion across Stages 2 and 3 totals about 97 sites, with village amenities including community room, pools and BBQ areas.
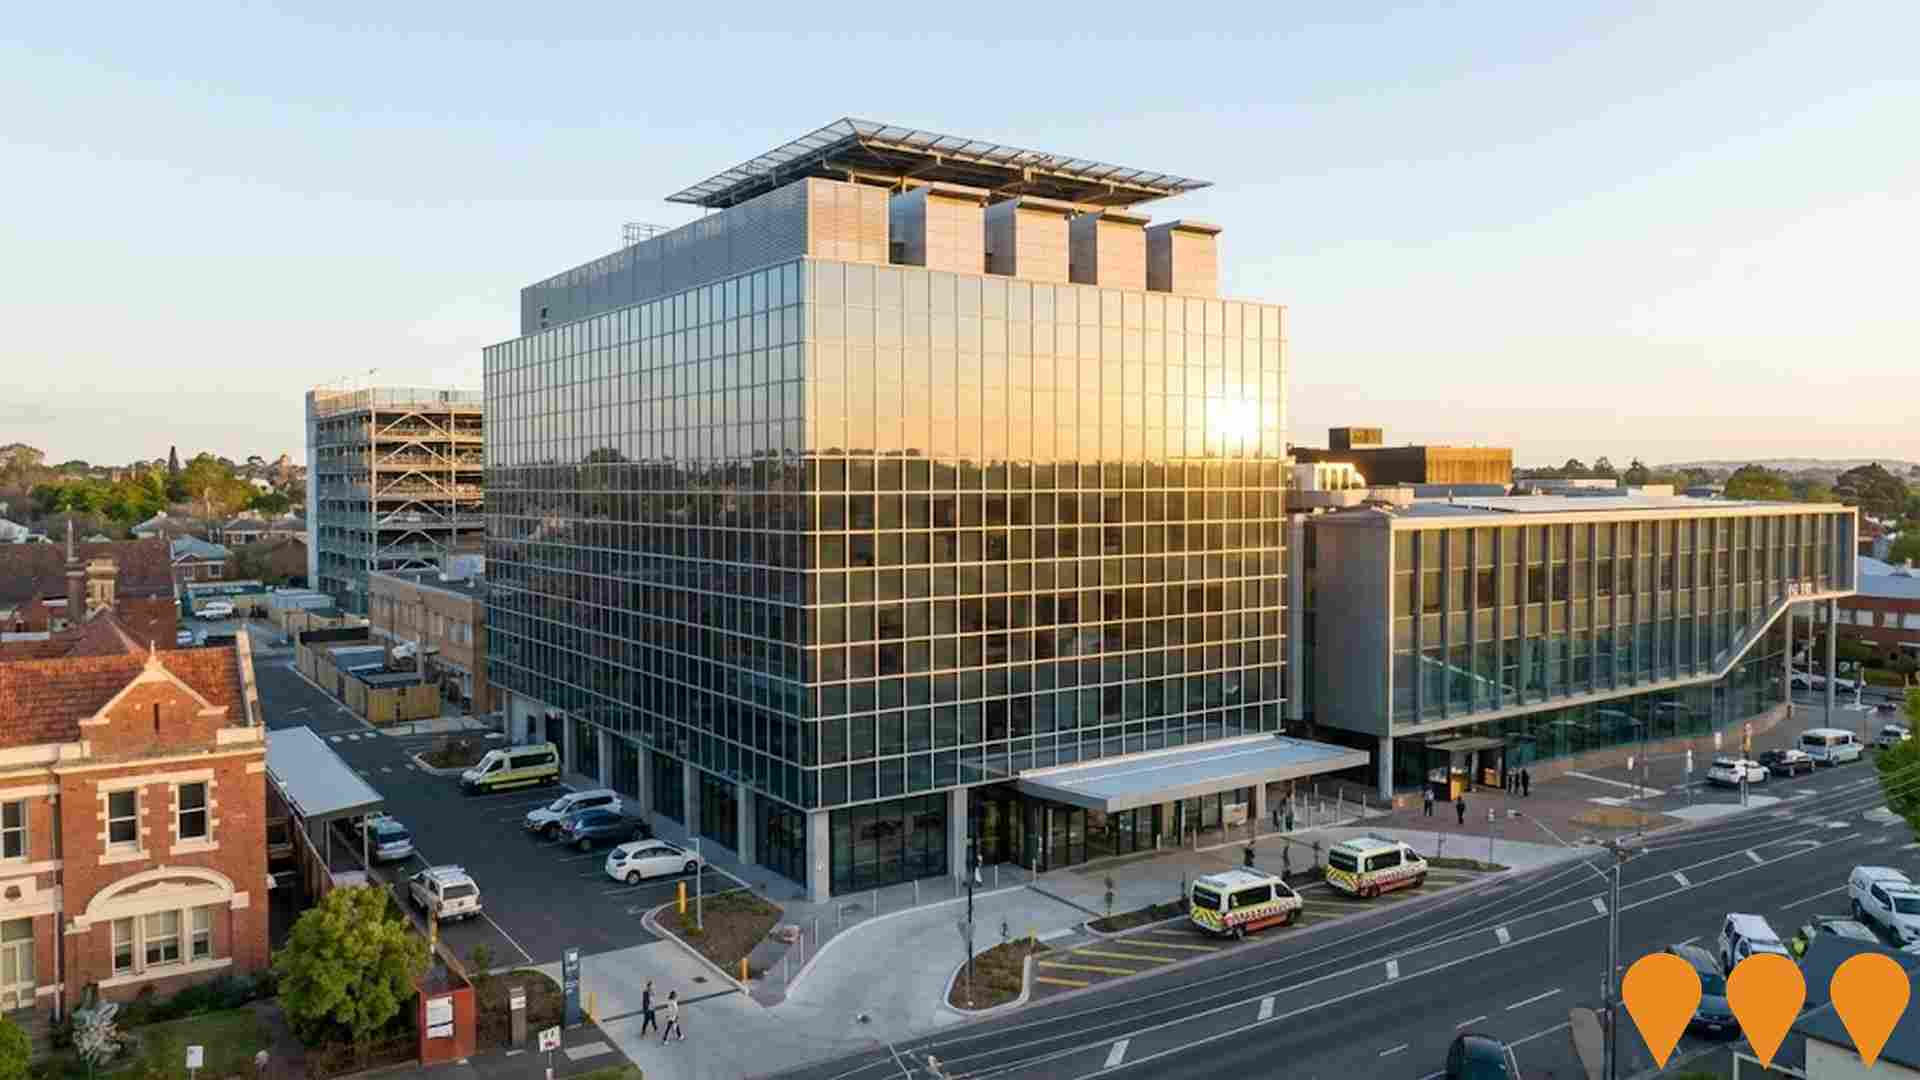
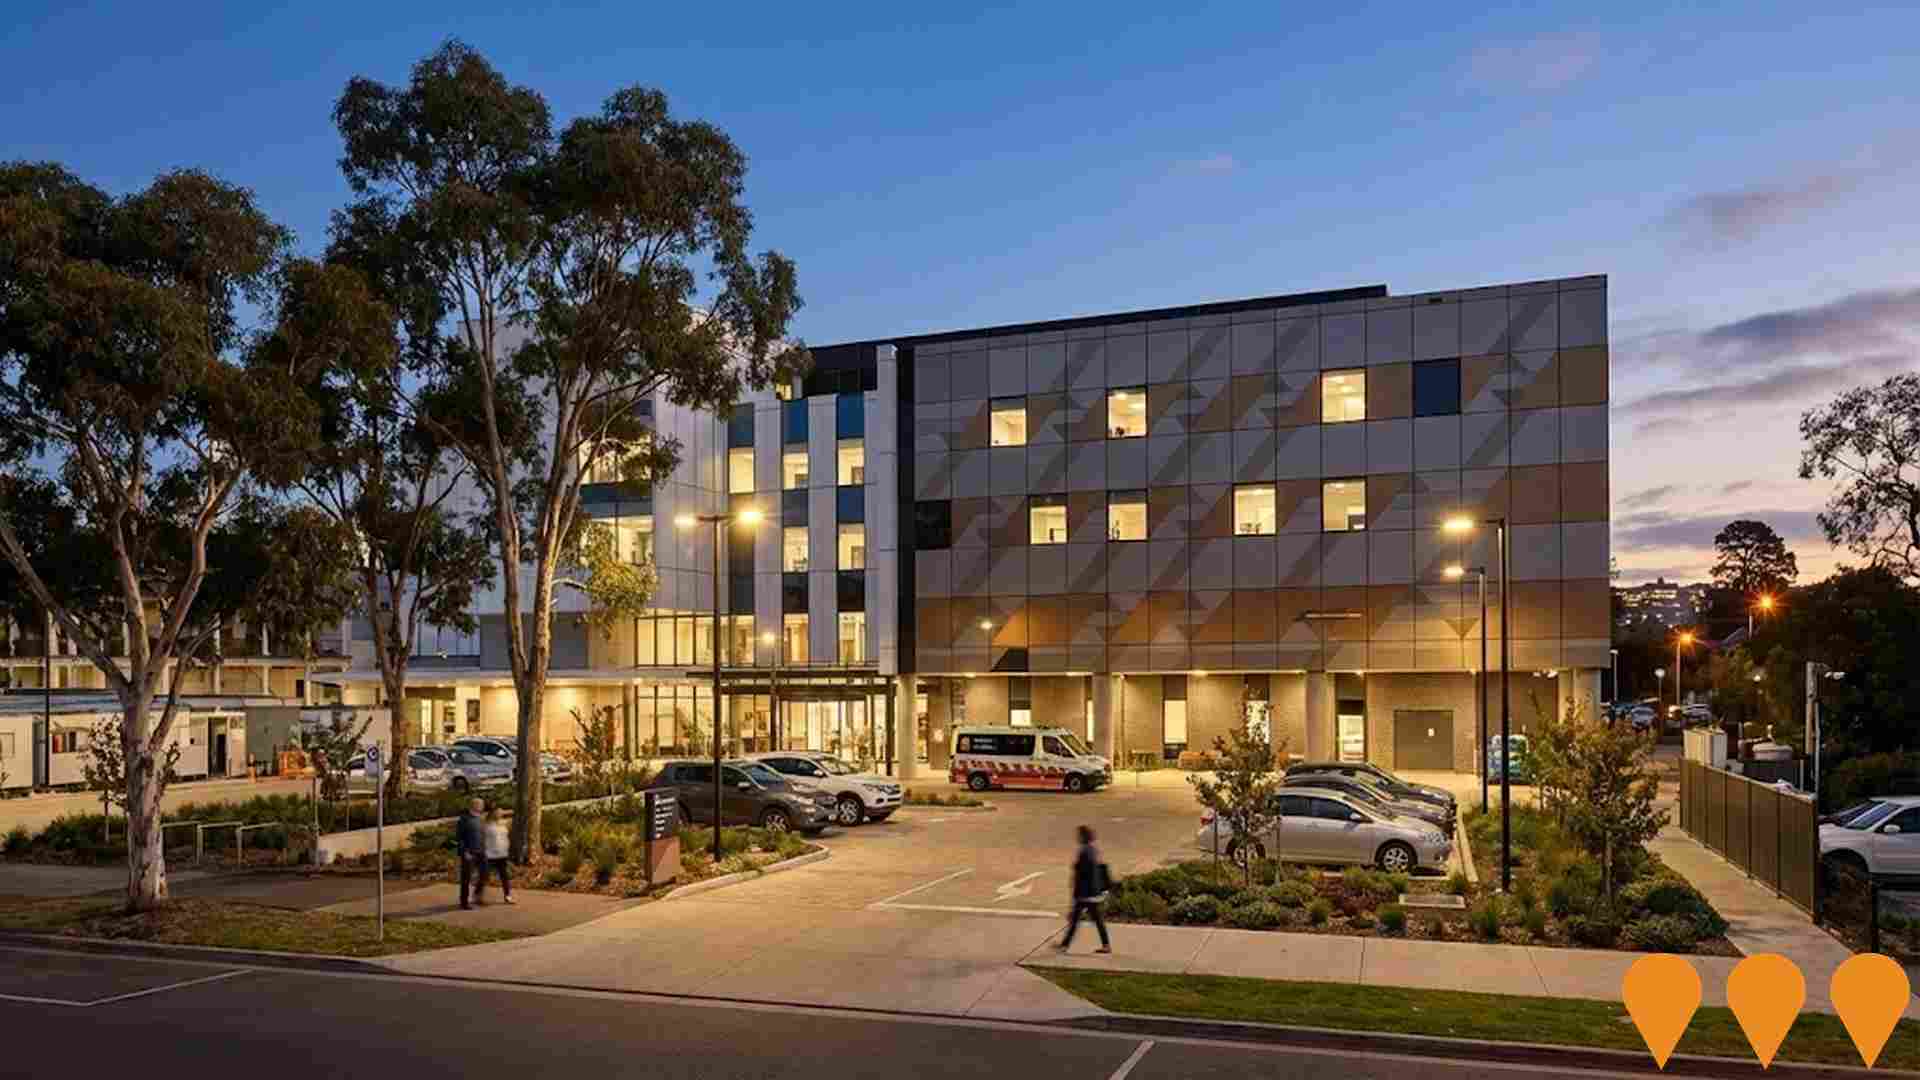
Ballarat Base Hospital Redevelopment
The $655 million Ballarat Base Hospital Redevelopment is in its third and final stage, building a new seven-level hospital tower delivered by Built in partnership with the Victorian Health Building Authority and Grampians Health. The tower will include a new main entrance off Sturt Street, a new emergency department with an integrated mental health, alcohol and other drugs hub, a women and children's hub, a state-of-the-art operating theatre suite, an expanded critical care floor, a new helipad, and around 100 extra inpatient and short stay beds.As of late 2025, structural works on the new tower are well advanced, with vertical concrete pours progressing and four tower cranes operating on site. Earlier stages have already delivered a six-storey central energy plant and support services building on Drummond Street, and an expanded multi-deck carpark adding 400 spaces. Once complete, the upgraded hospital will treat at least 18,000 more emergency patients and 14,500 additional inpatients per year, supporting around 4,000 extra surgeries annually. The project is on track for completion in 2027.
Sovereign Hill Master Plan: Gold Vault
The Gold Vault is a proposed 1,000 square metre immersive visitor experience and the hero project of Sovereign Hill's 20-year Master Plan. Designed to attract up to 100,000 additional visitors annually, the new pavilion will combine high-security displays of Victoria's most significant gold collection items with interactive digital installations, dramatic lighting and curated artefacts from Sovereign Hill, the Victorian State Collection and partner institutions. The project will also deliver a redesigned arrival and orientation zone with new Welcome to Country experiences, retail and amenities.Sovereign Hill received 500,000 dollars from the Victorian Enabling Tourism Fund in 2024 to develop the schematic design, and the 17.9 million dollar build is currently the headline ask in the Ballarat. Now and Into the Future: Enabling Growth 2026 advocacy campaign ahead of the 2026 Victorian state election. The project is forecast to create between 124 and 168 construction jobs and 21 to 37 ongoing jobs, and will incorporate solar panels and energy-efficient design as part of Sovereign Hill's transition to net zero energy, waste and water.
Albert Street Social Housing Development
A $15.5 million social and affordable housing development at 119 Albert Street, Ballarat. Delivered by Uniting Housing and designed by MGS Architects, the four-storey building provides 24 new one- and two-bedroom apartments to support vulnerable people on the Victorian Housing Register.
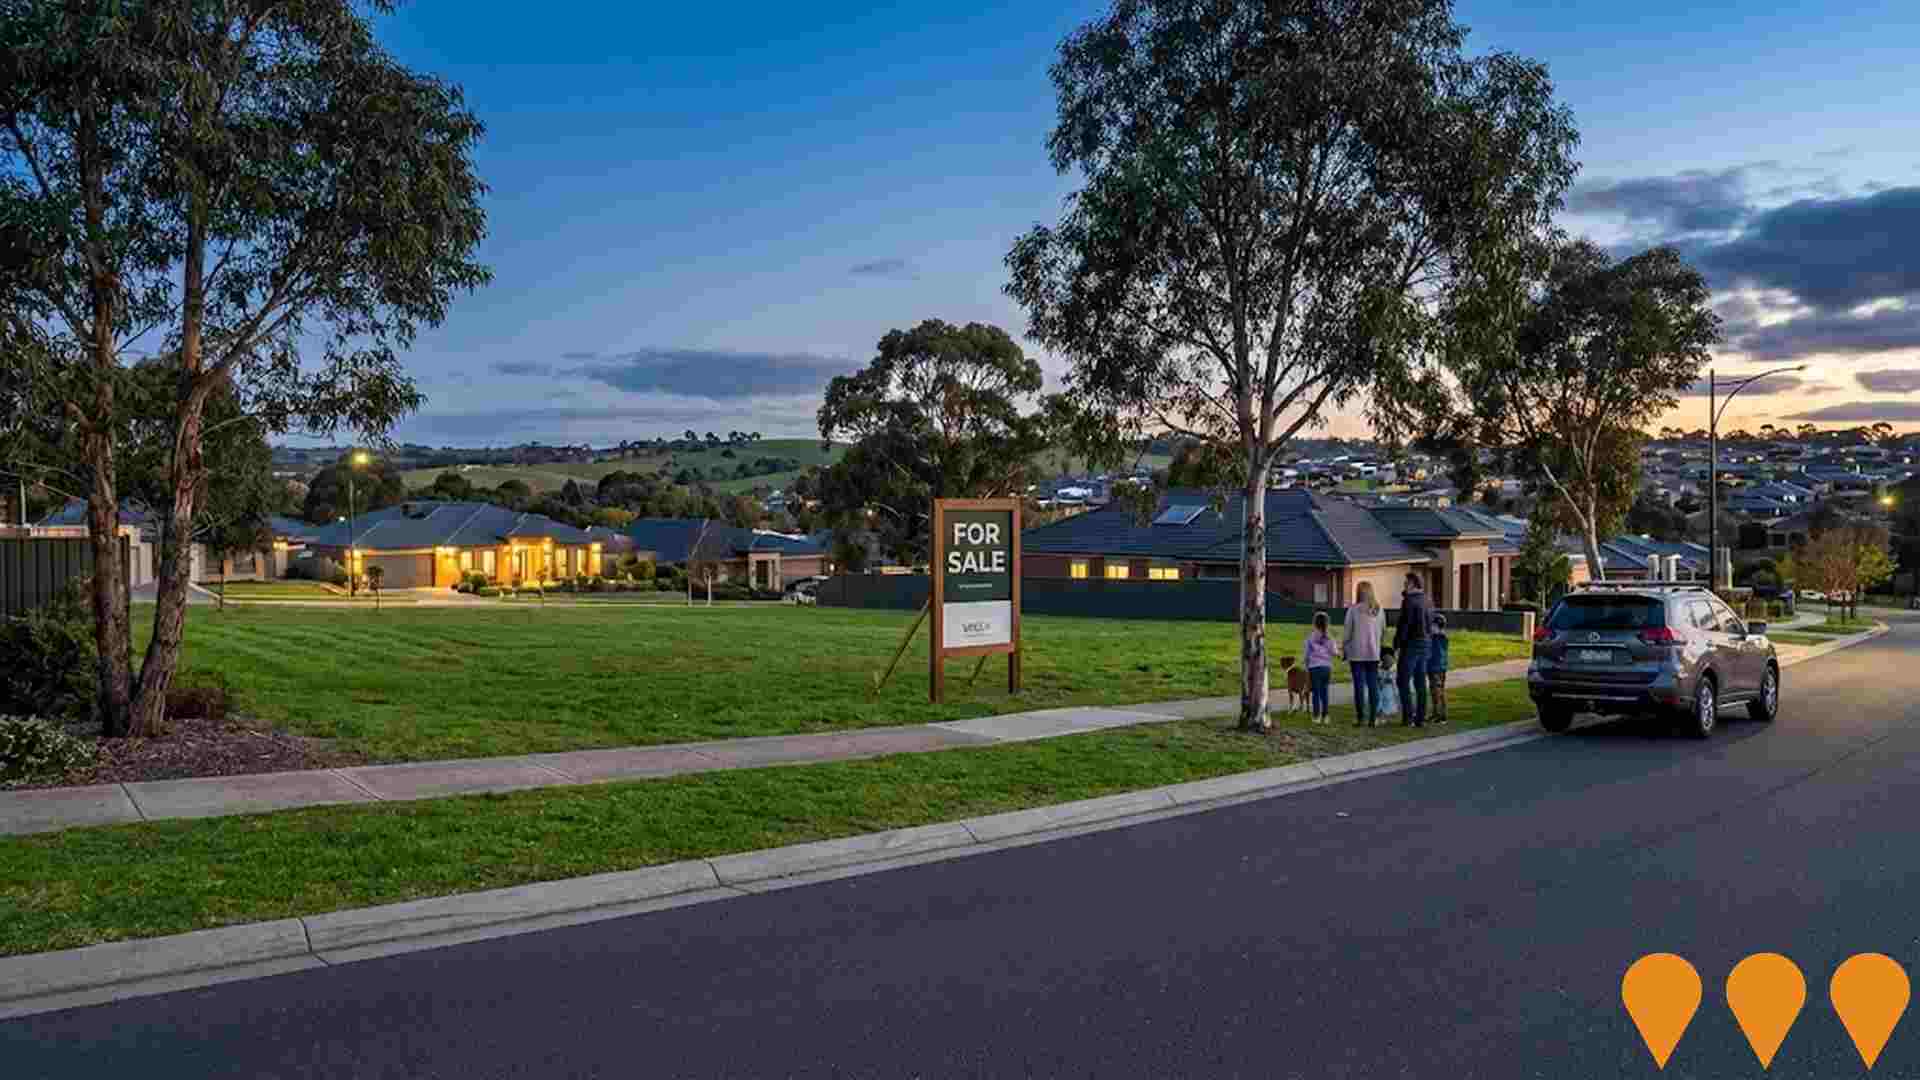
Aurora Estate
A boutique residential development in Ballarat East comprising 12 architecturally designed homes built by Hudson Ridge Builders. Located a short drive from Ballarat CBD along Victoria Street, nestled behind a local IGA supermarket, childcare centre, and reserve. The project features modern townhouses with high-quality finishes.
Delacombe Town Centre Stage 3
Stage 3 of Delacombe Town Centre is under construction and will expand the retail precinct with a new Coles, ALDI, approximately 13 to 14 specialty retail stores, additional parking and supporting infrastructure, strengthening the centre as the primary shopping destination for Ballarat's growing western and southern suburbs.
2,723 residents of Ballarat East are employed, from a labour force of 2,910. Unemployment sits at 6.4%, with participation at 56.8%. Weighted for its industry mix, the area's sectors are forecast to grow about 6.6% nationally over five years. That reflects industry composition only and makes no allowance for local population growth. The working-day population is estimated at 4,895, about 82% of the resident population, so more people leave the area for work than travel in. Unemployment and labour force come from ABS Small Area Labour Markets, updated quarterly; the industry and occupation profile is from the 2021 Census.
Detail
Ballarat East maintains a capable workforce with strong representation in community and essential services sectors, alongside an unemployment rate of 6.4% according to AreaSearch's aggregated statistical area metrics. As of March 2026, employed residents count 2,723, whereas local joblessness exceeds Regional Vic.'s 3.7% benchmark by 2.7%, and labour participation remains below regional standards at 56.8% versus 61.1%. Furthermore, Census returns indicated that 21.3% of workers performed their duties from home, though pandemic-related lockdown measures may have influenced these responses. Employment among local residents is centered predominantly in health care & social assistance, education & training, and retail trade.
Conversely, the agriculture, forestry & fishing industry is substantially underrepresented, employing only 1.2% of the local workforce compared to 7.5% across Regional Vic.. A comparison between Census working-population figures and resident totals highlights that this largely residential community provides limited commercial employment within its borders. Data from SALM and the ABS assessed across broader statistical areas indicates that over the 12-month period, the local labour force expanded by 0.2% while employment contracted by 1.5%, driving an increase in the unemployment rate of 1.6 percentage points. Over the same timeframe, Regional Vic. experienced an employment decline of 0.1%, a workforce reduction of 0.3%, and an unemployment contraction of 0.2 percentage points. Future workplace demand can be evaluated via national industry forecasts released by Jobs and Skills Australia in Mar-26. Projected nationwide workforce increases of 6.6% over five years and 13.7% over ten years vary considerably by industry sector. When mapped against Ballarat East's specific industry composition, these figures suggest local employment expansion of 6.6% across five years and 13.9% over ten years (calculated as a weighted extrapolation for illustrative context, without factoring in localized population growth).
Frequently Asked Questions - Employment
Median household income in Ballarat East is $1,123 a week (about $58,000 a year), with median personal income at $636 a week. ATO records put median taxable income at $48,975 a year against an average of $62,887. Household income is from the 2021 Census; taxable income is from ATO Taxation Statistics for the latest financial year available, indexed forward using the ABS Wage Price Index.
Detail
ATO postcode records compiled by AreaSearch for financial year 2023 place earnings in the suburb of Ballarat East below countrywide benchmarks, reporting a median of $48,975 and an average of $62,887, whereas Regional Vic. recorded a median of $50,954 and an average of $62,728. Factoring in Wage Price Index expansion of 9.62% from financial year 2023 yields updated estimates of approximately $53,686 for median income and $68,937 for average income as of March 2026. Across personal, family, and household levels, Census statistics position local incomes between the 8th and 16th percentiles across Australia.
The most common bracket covers 29.6% of residents (1,767 people) earning $800 - 1,499, differing from the wider region where 30.3% sit in the $1,500 - 2,999 category. Income retention after housing expenses is constrained at 82.5%, ranking in the 9th percentile.
Frequently Asked Questions - Income
Ballarat East had 2,559 occupied dwellings at the 2021 Census, 89% detached houses and 1% apartments. 26% are owned with a mortgage, 41% rented and 33% owned outright. At that Census the median rent was $290 a week and the median mortgage repayment $1,300 a month. Rent absorbs 25.8% of household income here and mortgage repayments 26.7%. Dwelling stock, tenure and housing costs are 2021 Census measures — the only source that counts dwellings at this boundary size.
Detail
Census records indicate that Ballarat East's housing stock is composed of 89.4% standalone houses and 10.6% alternative dwelling types (encompassing townhouses, apartments, and other configurations), comparable to Regional Vic.'s distribution of 90.1% houses and 9.9% other residential properties. Outright homeownership was lower than the regional standard, recording 33.0%, while 26.1% of homes were under a mortgage and 40.9% were occupied by renters. Typical monthly mortgage costs stood at $1,300, below the Regional Vic. median of $1,430, while median weekly rent was $290 compared to $285 regionally. Relative to countrywide averages, Ballarat East's mortgage repayments sit well below the national figure of $1,863, and rents remain substantially lower than the $375 benchmark.
Frequently Asked Questions - Housing
Ballarat East counted 2,559 households at the 2021 Census, averaging 2.1 people each. 17% are couples with children, fewer than in 93% of areas nationally, against 25% couples without children. 39% of households are people living alone, and families average 1.7 children. Household and family composition is measured only by the Census, so these are 2021 figures.
Detail
Families constitute the majority of households at 55.3%, consisting of couples without children (25.0%), couples with children (16.7%), and single parent households (12.6%). Non-family living arrangements account for the remaining 44.7%, comprising single-person households at 39.2% and group residences at 5.7%. The local median household size is 2.1 people, tracking lower than the Regional Vic. benchmark of 2.4.
Frequently Asked Questions - Households
28.5% of adults in Ballarat East hold a university qualification, including 18.0% with a bachelor degree and 6.2% with postgraduate qualifications. A further 23.3% hold a vocational qualification. 4 schools serve the area, with 1,267 enrolment places and an average ICSEA of 1,036 against a national benchmark of 1,000. Qualifications come from the 2021 Census; school enrolments, ICSEA and results come from ACARA's current release.
Detail
Higher education qualifications are prominent locally, with 28.5% of residents aged 15+ holding university degrees, surpassing the 21.7% recorded across Rest of Vic.. Bachelor degrees represent the largest category at 18.0%, alongside 6.2% holding postgraduate degrees and 4.3% with graduate diplomas. Vocational and technical training is also widespread, with 33.7% of residents aged 15+ possessing vocational credentials, including 23.3% with certificates and 10.4% with advanced diplomas. Participation in study is robust, with 26.9% of the local population actively undertaking formal education. This includes 8.6% attending primary schools, 6.1% engaged in tertiary study, and 5.8% attending secondary institutions.
Frequently Asked Questions - Education
Schools Detail
Public transport in Ballarat East reaches 39 stops on 14 routes, timetabled for about 10,200 services a week. The typical home sits about 210 m from its nearest stop. Buses carry the largest share of public transport commuters. Households keep an average of 1.0 vehicles. Stop and service counts are built from operators' published GTFS timetables and refresh with each timetable release; vehicle ownership is from the 2021 Census.
Detail
Public transit coverage across Ballarat East comprises 39 active stops across 14 separate routes, delivering a collective 10,152 passenger trips on a weekly basis. Accessibility is strong, with typical walking distances to the closest boarding point measuring 213 meters. Reflecting the suburb's residential footprint, commuting is predominantly outbound, with private vehicles accounting for 89% of travel and walking comprising 5%. Households average 1.0 motor vehicles each, below regional levels. In addition, 21.3% of workers worked from home according to 2021 Census returns, which may have been influenced by COVID-19 settings.
Transit service schedules deliver an average of 1,450 daily trips across the broader network, representing roughly 260 weekly journeys per transit stop.
Frequently Asked Questions - Transport
Transport Stops Detail
54.3% of residents in Ballarat East report no long-term health condition, a less healthy profile than 92% of areas nationally. 12.4% need daily assistance with core activities, and 51.7% hold private health cover. The standardised death rate runs at 7.5 per 1,000 residents. Health conditions, assistance needs and insurance are 2021 Census measures; the death rate comes from current ABS releases.
Detail
Analysis of chronic conditions and mortality statistics by AreaSearch demonstrates considerable health vulnerabilities in Ballarat East across diverse age brackets, while private health insurance uptake remains subdued at roughly 52% of residents (~3,088 people). The most prevalent health issues recorded among residents are mental health conditions (13.3%) and arthritis (10.7%), with 54.3% reporting no diagnosed medical conditions compared to 63.4% across Regional Vic.. High rates of chronic illness affect the working-age cohort. Furthermore, residents aged 65 and over represent 25.7% of the community (1,534 people), exceeding the Regional Vic. proportion of 24.0%, with senior health indicators showing moderate vulnerabilities in line with broader domestic trends.
Frequently Asked Questions - Health
Ballarat East is largely Australian-born, at 88.3% of residents, with 6.3% speaking a language other than English at home. The largest reported ancestries are English (31.7%) and Australian (27.5%). Ancestry, language and country of birth are counted only by the Census, so these are 2021 figures.
Detail
Cultural diversity measures in Ballarat East sit below wider averages, with Australian-born residents accounting for 88.3% of the community, Australian citizens representing 89.6%, and 93.7% speaking solely English in their households. Christianity forms the largest religious affiliation at 41.6% of residents. In relative terms, Judaism exhibits the most notable overrepresentation, comprising 0.1% of the local population compared to 0.1% across Regional Vic.. Regarding ancestral backgrounds based on parents' birth countries, the primary heritages in Ballarat East are English (31.7%), Australian (27.5%), and Irish (12.3%). Minor variations also appear among other ancestries, with Dutch background representing 1.9% locally versus 1.7% across the region, Scottish ancestry at 9.3% versus 8.8%, and Croatian background at 0.4% compared to 0.4% regionally.
Frequently Asked Questions - Diversity
The median resident of Ballarat East is 43. 25.4% of residents are aged 15 to 34. Age cohorts are not raw Census counts: the Census split is re-based to the latest ABS population estimates and state projections.
Detail
Demographics in Ballarat East skew younger than Regional Vic. overall. Adults aged 25 - 44 comprise 28.6% of the population as at August 2026 compared to 23.1% regionally, while younger residents aged 0 - 24 represent 23.9% versus 28.5% across the wider region. The estimated median age of 43 matches the 2021 Census outcome and equals the Regional Vic. median of 43 from that Census, while the national figure was 38. The share of residents aged 25 - 44 has risen from 26.7% at the Census to an estimated 28.6%, and this demographic is projected to lead future growth by 2041 with an increase of 779 people (46%) to reach 2,487.
Frequently Asked Questions - Age
Data & MethodBoundaries, Sources & Method for Ballarat East
9 of 14 data sections on this page were updated within the last 12 months — the newest current to Oct 2026.
Everything is aggregated to the Suburb (SAL) boundary shown above, on a 2021 Census baseline. Only 3 sections — housing, households and cultural diversity — still wait on the 2026 Census.
The ledger — source, cycle and currency by section
| Section | Source & update cycle | Currency |
|---|---|---|
| Updated within the last 12 months 9 sections | ||
| Population | ABS, GNAF, Geoscience Australia Annual (ABS ERP) | Aug 2026 2 months ago headline measures · 2021 Census baseline |
| Re-based to the ABS Estimated Resident Population (June 2025 release) and updated with new dwellings from GNAF address data. Current to Aug 2026, with the 2021 Census supplying the small-area baseline. | ||
| Age profile | ABS, Geoscience Australia, State governments Annual | Aug 2026 2 months ago headline measures · 2021 Census baseline |
| Age cohorts are re-based to the latest ABS population estimates and state projections, current to Aug 2026. Each cohort is held as a Census baseline and a current estimate. | ||
| Development & approvals | ABS, GNAF Monthly (ABS approvals) | Aug 2026 2 months ago headline measures · Jul 2026 baseline |
| Property sales & rents | Valuer General, Rental Board, ABS Weekly sales, quarterly rents | Oct 2026 this month headline measures · Sep 2026 baseline |
| Sales from the state Valuer General register, refreshed weekly, and rents from quarterly rental bond lodgements. Both are read live each time this page loads, current to Oct 2026. | ||
| Infrastructure projects | Infrastructure Australia, State agencies, Local governments Daily | May 2026 5 months ago all 2 projects tracked here |
| Project pipeline maintained continuously from Infrastructure Australia, state agencies, local government and public announcements. Records are added and revised daily; this area was last updated May 2026. | ||
| Employment | ABS, DEWR, JSA Quarterly (ABS SALM) | Mar 2026 7 months ago headline measures · 2021 Census baseline |
| Unemployment and labour force from ABS Small Area Labour Markets, current to Mar 2026. The growth outlook applies Department of Employment (now Jobs and Skills Australia) forecasts for all 19 industry divisions to the local industry mix, so it measures sector composition rather than local expansion and makes no allowance for population growth. Job demand comes from the same agency via its Internet Vacancy Index; industry and occupation structure from the 2021 Census. | ||
| Education | ABS, ACARA Annual (ACARA) | Sep 2026 last month headline measures · 2021 Census baseline |
| Transport | ABS, State Transport Departments Each timetable release | Jul 2026 3 months ago headline measures · 2021 Census baseline |
| Services & amenities | Provider directories, ACECQA Continuous | Sep 2026 last month all 14 measures |
| Annual and financial-year sources 2 sections | ||
| Income | ABS, ATO Annual (ATO) | FY 2023 3 years ago headline measures · 2021 Census baseline |
| ATO taxable income statistics for FY 2023, indexed forward using the Wage Price Index. Census household income provides the distribution detail. | ||
| Health | ABS, ATO Annual | 2024 2 years ago headline measures · 2021 Census baseline |
| Census-measured — next update: 2026 Census 3 sections No more current small-area source exists for these, so they are labelled as Census-measured rather than implied to be current. | ||
| Housing | ABS 5-yearly (Census) | 2021 Census next update 2026 all 30 measures |
| Households | ABS 5-yearly (Census) | 2021 Census next update 2026 all 18 measures |
| Cultural diversity | ABS, Geoscience Australia 5-yearly (Census) | 2021 Census next update 2026 all 44 measures |
"Currency" is the most recent release feeding that section. Where the Census supplies the structural baseline underneath a current headline figure, the row says so.
How the numbers are built
Population
The Census provides the small-area baseline, aggregated from mesh blocks to this boundary. It is then re-based to the ABS Estimated Resident Population (June 2025 release), and new dwellings built since Census night are counted from address data — 169 validated new addresses here. The headline figure is therefore a current estimate for Aug 2026, not a 2021 count (5,937 at the 2021 Census → 5,972 now). Annual growth rates are compound (CAGR), not simple averages.
Age profile
Cohort shares are not raw Census counts. Every cohort is held as a pair — the Census baseline and a current estimate — and the split is re-based using ERP and state population projections, current to Aug 2026. Median age is the Census median plus modelled change since. Charts that show both are labelled "2021 Census vs Current Estimate".
Property sales
Sourced from the state valuation authority's sales register — current, not Census, and refreshed weekly. Medians are calculated from settled transactions in the period shown; periods with very low transaction counts are flagged or suppressed, because a handful of sales can move a median substantially.
Rents
Derived from state rental bond lodgement data, by dwelling type and bedroom count. Bonds are lodged at the start of a new tenancy, so this reflects new lettings, not the whole rented stock.
Development & infrastructure
Building approvals come from current ABS releases; development applications are collected from council and state planning portals; the infrastructure pipeline is compiled from Infrastructure Australia and local government sources. Applications are matched to this boundary by address or coordinates, so very recent lodgements may not yet appear.
Employment & income
Industry and occupation structure comes from the Census, but the headline labour-market indicators do not. Unemployment and labour force are derived from ABS Small Area Labour Markets (quarterly). The employment outlook applies Department of Employment forecasts for all 19 industry divisions to this area's own industry mix (the agency is now Jobs and Skills Australia), as does the Internet Vacancy Index used for job demand. Because it is weighted on industry composition alone, that outlook carries no allowance for local population growth — in fast-growing areas the real rise in local jobs will typically be higher. Income combines Census household income with ATO taxable-income statistics for FY 2023, indexed forward using the Wage Price Index.
Education, transport & amenities
School enrolments, ICSEA and performance come from ACARA's current release, not the Census. Public transport stops and service frequency are derived from GTFS timetable feeds published by state transport departments. Services and amenities are proximity and count scores built from provider directories, refreshed on their own cycle. The Census contributes only the travel-to-work and qualification measures.
Rankings and benchmarks. Where we rank this area, the comparison set is every area of the same boundary type — suburbs against suburbs, SA2s against SA2s. Benchmarks compare this area against its greater capital city region and the national figure for the same measure and period.
Limits worth knowing. Small areas carry larger error margins, and the ABS introduces small random adjustments to Census counts to protect confidentiality — so totals may not sum exactly. Estimates re-based from regional data describe the area's expected trajectory, not a direct count of it. Figures are indicative for research and are not financial, planning or valuation advice.
Cross-check us. The Census baseline for this boundary is at ABS 2021 Census QuickStats (SAL20112). QuickStats reports 2021 only — the figures on this page are more current wherever the ledger shows a later date.