Chart Color Schemes
This analysis uses ABS Statistical Areas Level 2 (SA2) boundaries, which can materially differ from Suburbs and Localities (SAL) even when sharing similar names.
SA2 boundaries are defined by the Australian Bureau of Statistics and are designed to represent communities for statistical reporting (e.g., census and ERP).
Suburbs and Localities (SAL) represent commonly-used suburb/locality names (postal-style areas) and may use different geographic boundaries. For comprehensive analysis, consider reviewing both boundary types if available.
est. as @ -- *
ABS ERP | -- people | --
2021 Census | -- people
Sales Activity
Curious about local property values? Filter the chart to assess the volume and appreciation (including resales) trends and regional comparisons, or scroll to the map below view this information at an individual property level.
Find a Recent Sale
Sales Detail
Population
Population growth drivers in Norwood are slightly above average based on AreaSearch's ranking of recent, and medium term trends
Norwood's population, as of November 2025, is approximately 12,111 people. This figure represents a growth of 1,262 individuals since the 2021 Census, which recorded a population of 10,849. The increase is inferred from an estimated resident population of 11,961 in June 2024 and an additional 199 validated new addresses post-Census. This results in a population density of 3,113 persons per square kilometer, placing Norwood in the upper quartile nationally according to AreaSearch's assessments. Norwood's growth rate of 11.6% since the 2021 Census exceeds both the state average (7.1%) and metropolitan area growth rates, positioning it as a notable growth leader regionally. Overseas migration contributed approximately 94.3% of Norwood's overall population gains during recent periods.
AreaSearch uses ABS/Geoscience Australia projections for each SA2 area, released in 2024 with a base year of 2022. For areas not covered by this data and years post-2032, the SA State Government's Regional/LGA projections by age category are adopted, based on 2021 data and adjustments made employing weighted aggregation methods from LGA to SA2 levels. Demographic trends indicate an above median population growth for Norwood, with projections expecting the area to expand by 1,735 persons by 2041. This reflects a total gain of 13.1% over the 17-year period, based on the latest annual ERP population numbers.
Frequently Asked Questions - Population
Development
AreaSearch assessment of residential development activity positions Norwood among the top 25% of areas assessed nationwide
Norwood has seen approximately 83 new homes approved annually. Over the past five financial years, from FY21 to FY25, around 417 homes were approved, with a further 5 approved in FY26 so far. On average, about 2.8 people have moved to the area per new home constructed over these five years, indicating solid demand that supports property values.
New homes are being built at an average expected construction cost of $686,000, suggesting a focus on the premium segment with upmarket properties. This financial year has seen around $132.6 million in commercial approvals, showing strong commercial development momentum. Compared to Greater Adelaide, Norwood has slightly more development, approximately 13.0% above the regional average per person over the five-year period, offering good buyer choice while supporting existing property values. New development consists of about 20.0% detached houses and 80.0% attached dwellings, providing accessible entry options for downsizers, investors, and entry-level buyers.
The location currently has around 326 people per dwelling approval, indicating potential room for growth. Future projections estimate Norwood adding approximately 1,585 residents by 2041, based on the latest AreaSearch quarterly estimate. At current development rates, new housing supply should comfortably meet demand, providing good conditions for buyers and potentially supporting population growth beyond current projections.
Frequently Asked Questions - Development
Infrastructure
Norwood has emerging levels of nearby infrastructure activity, ranking in the 29thth percentile nationally
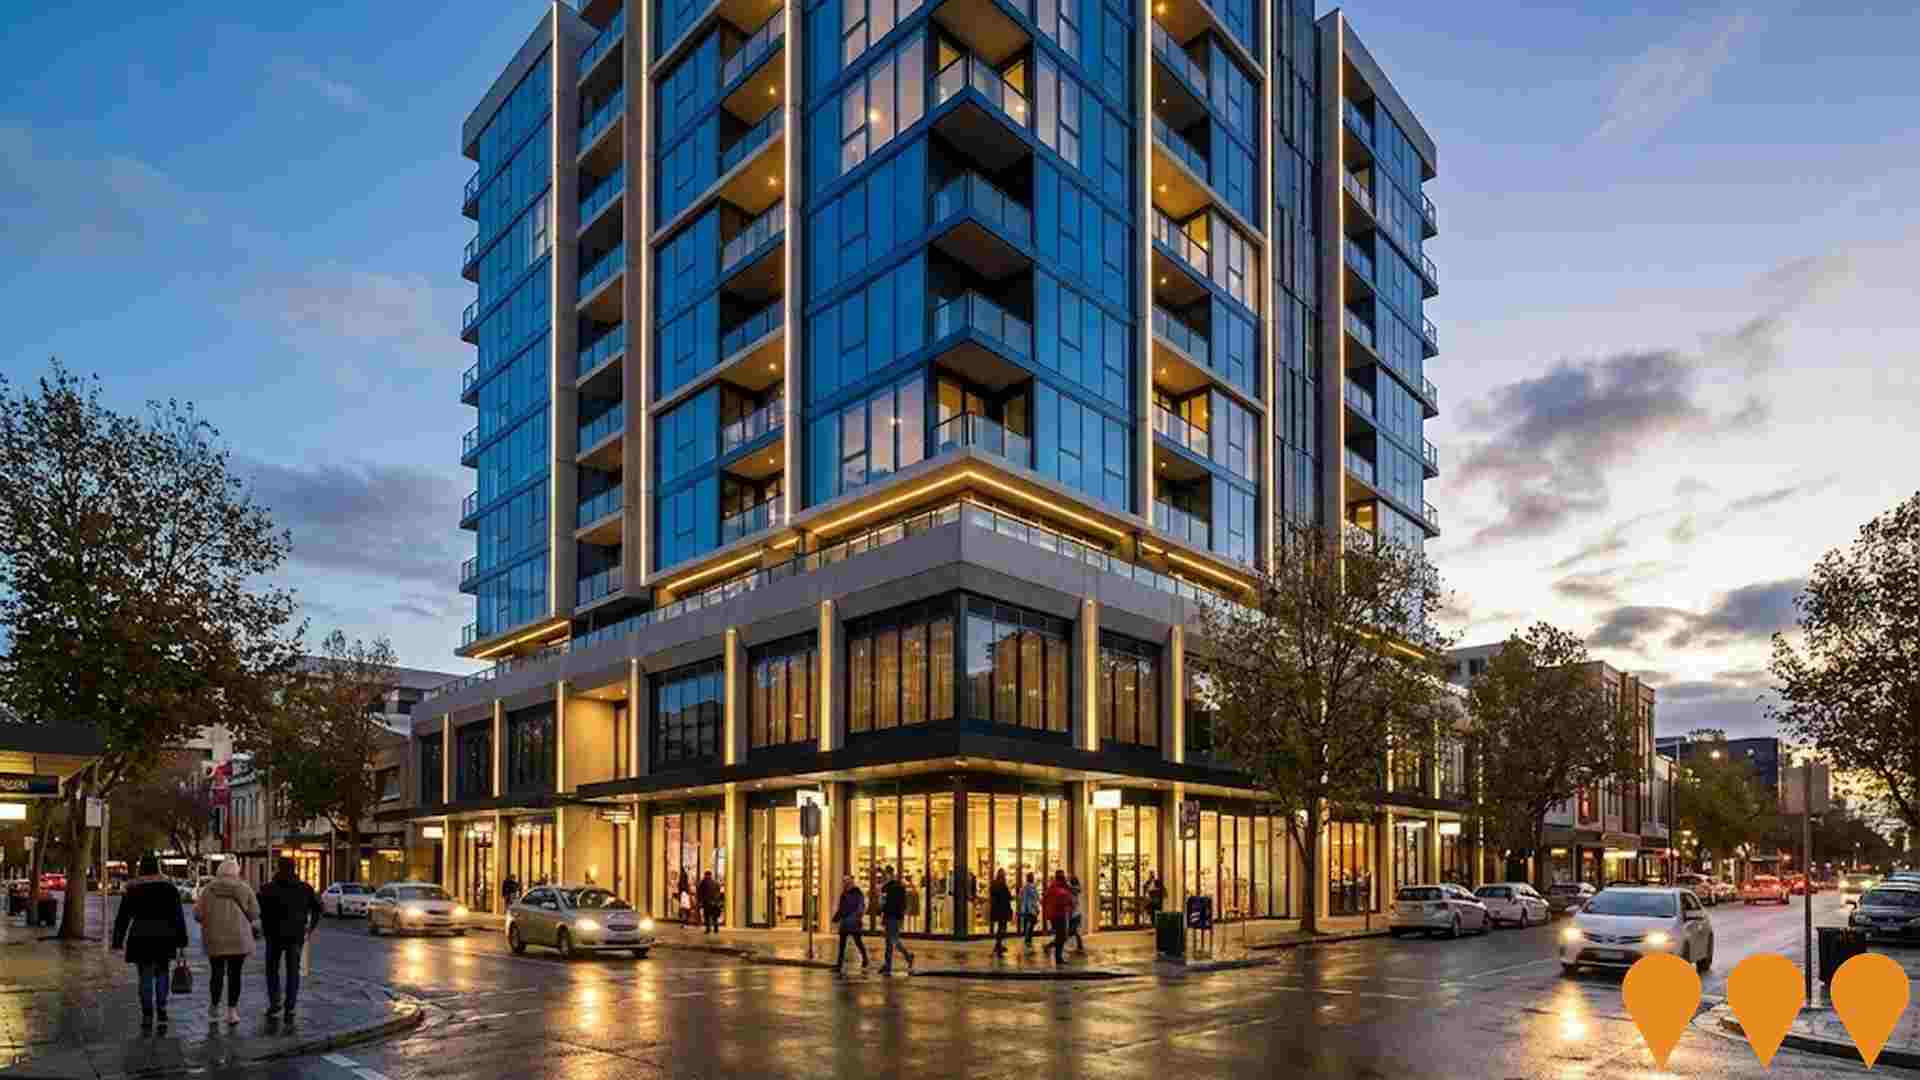
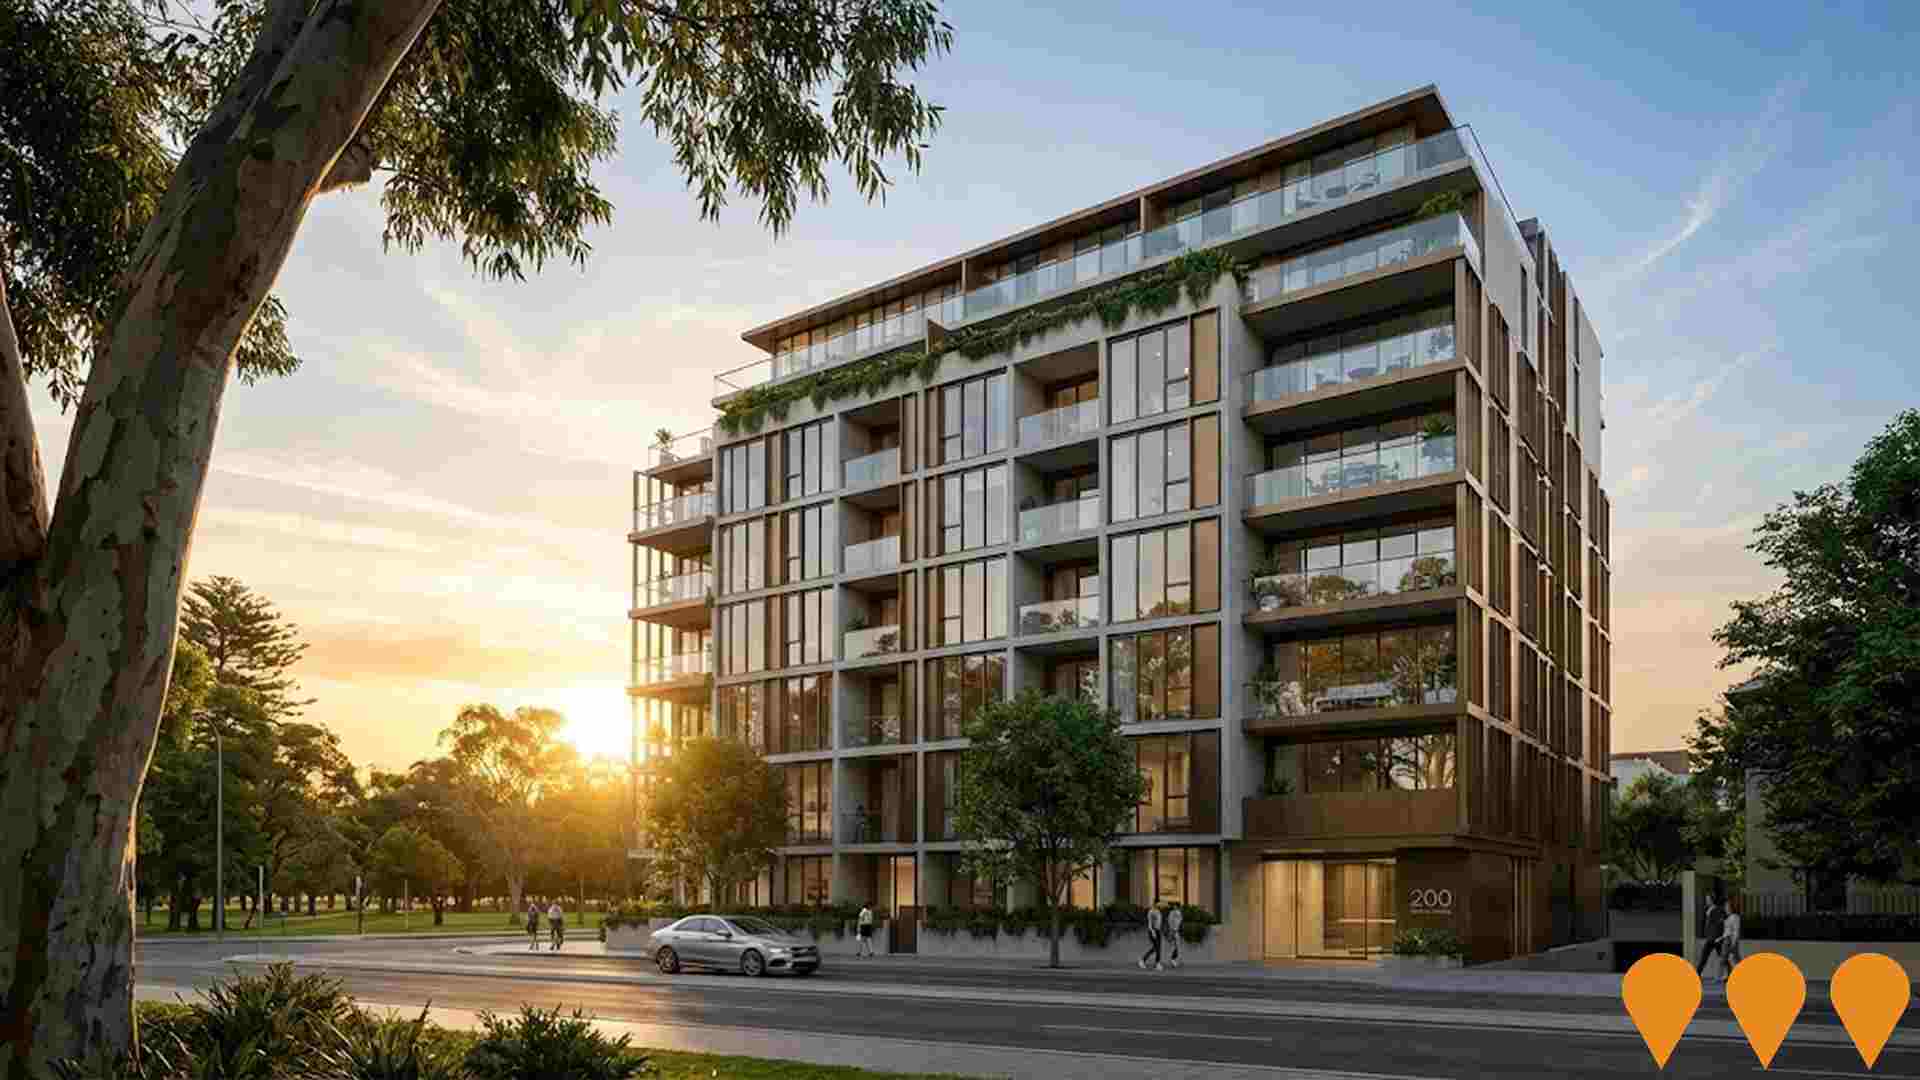
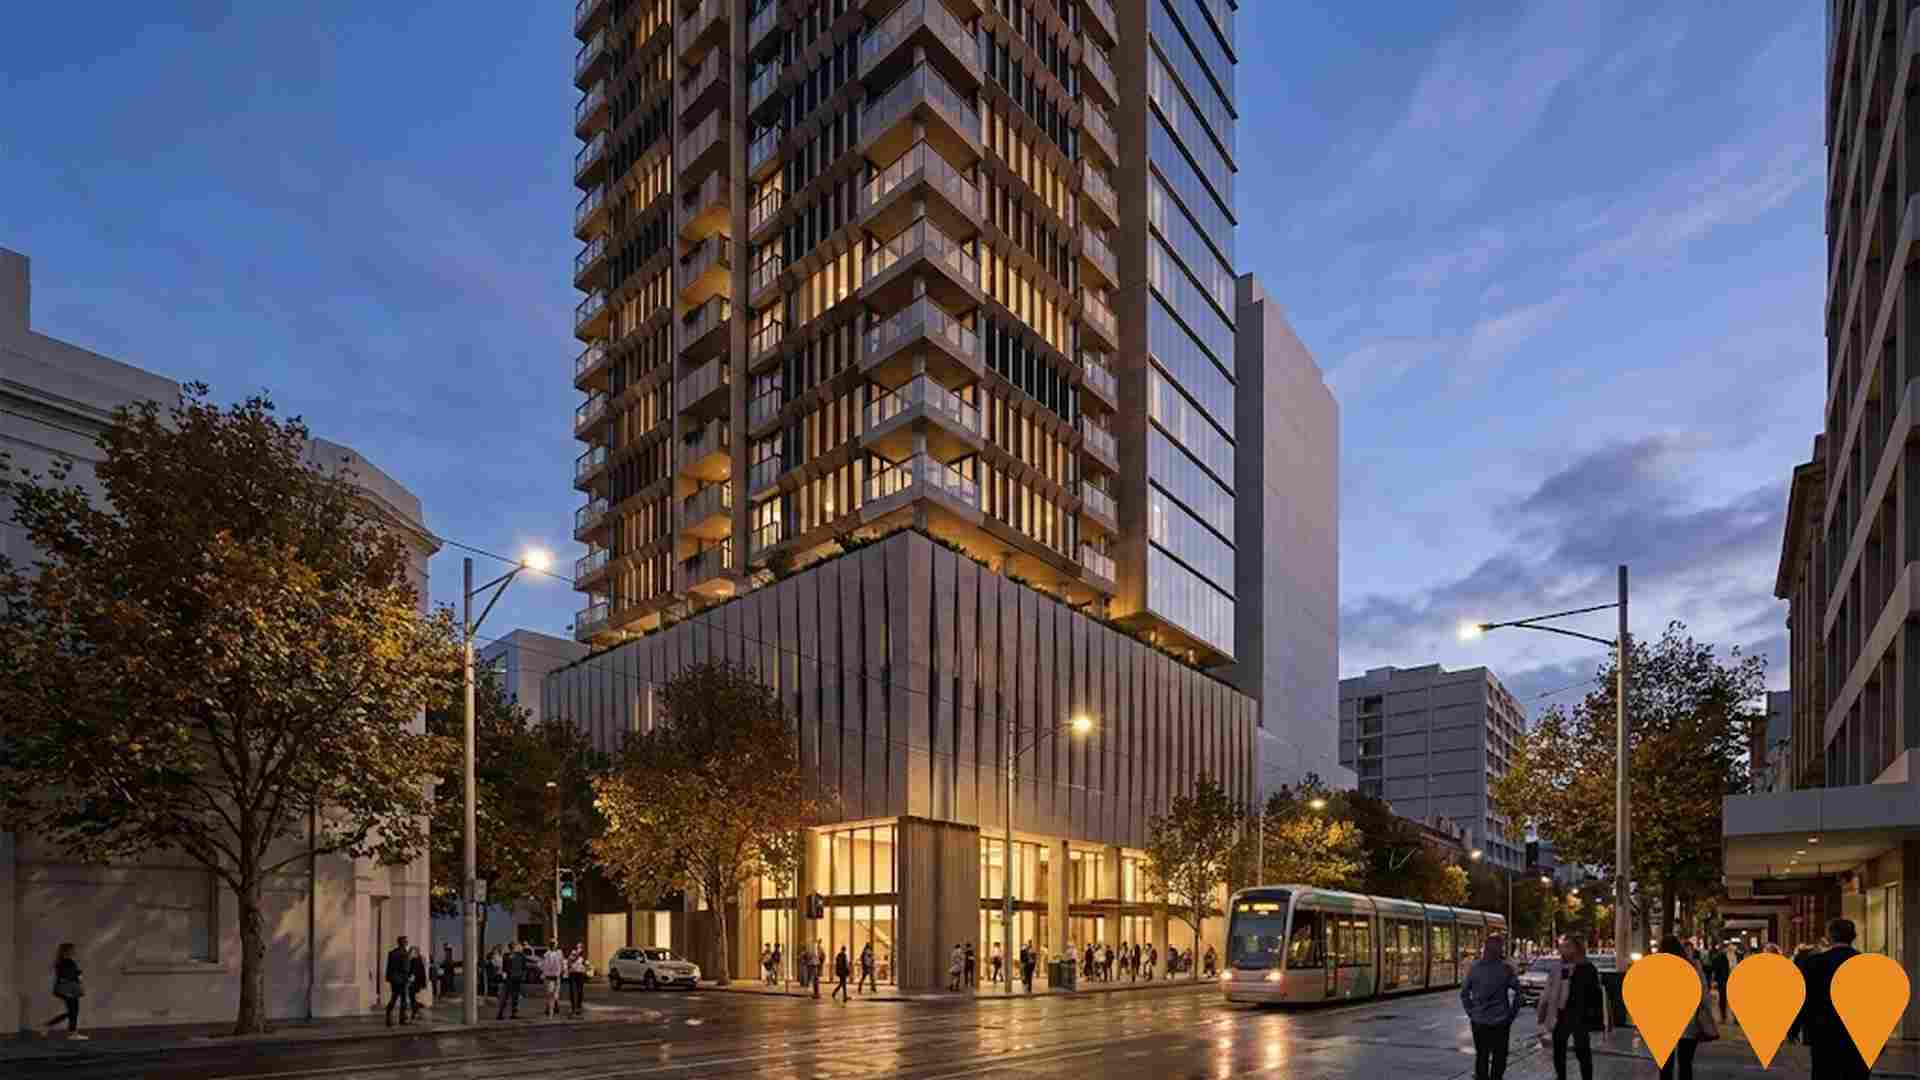
Changes to local infrastructure significantly influence an area's performance. AreaSearch has identified 13 projects likely impacting the area. Key projects include Osmond Terrace Mixed-Use Development, Glenside Development, The Parade Quarter, and Norwood Oval Redevelopment. Below is a list detailing those most relevant.
Professional plan users can use the search below to filter and access additional projects.
INFRASTRUCTURE SEARCH
 Denotes AI-based impression for illustrative purposes only, not to be taken as definitive under any circumstances. Please follow links and conduct other investigations from the project's source for actual imagery. Developers and project owners wishing us to use original imagery please Contact Us and we will do so.
Frequently Asked Questions - Infrastructure
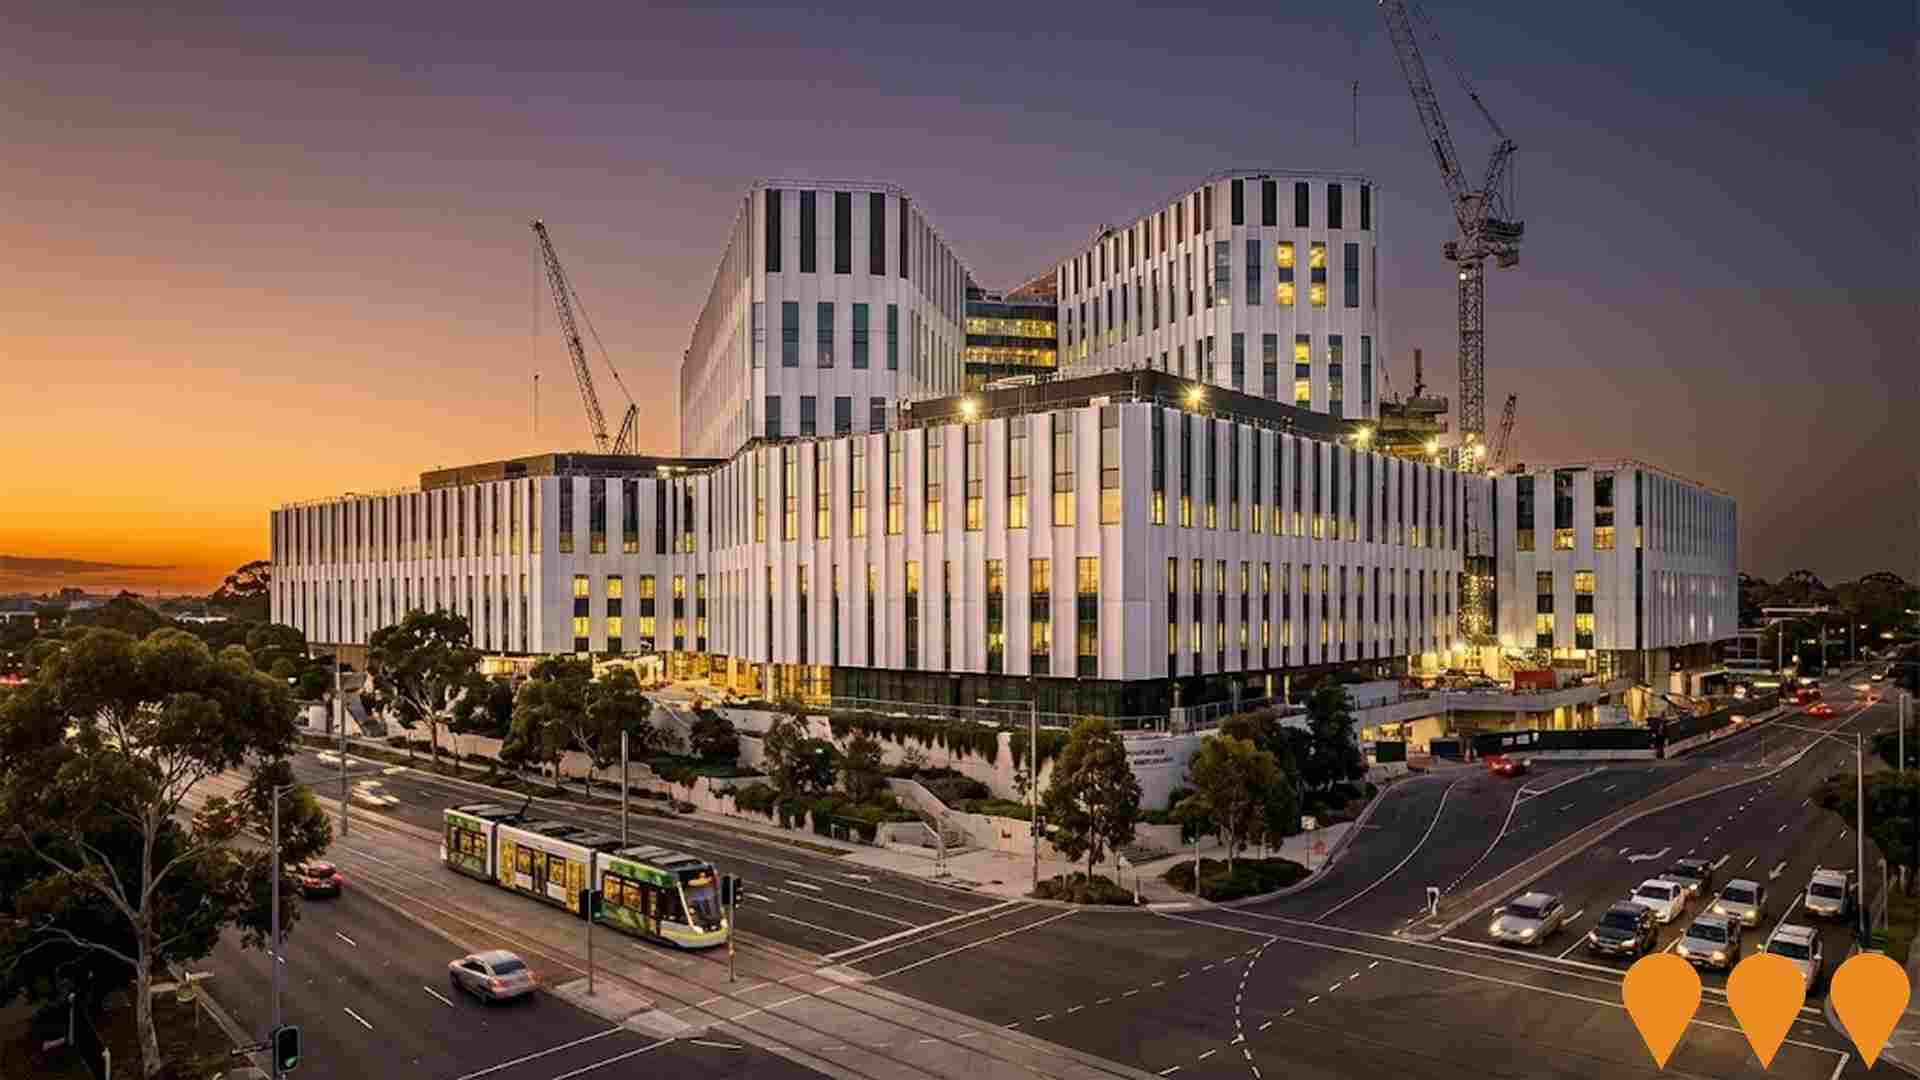
New Women's and Children's Hospital
A new $3.2 billion state-of-the-art hospital at the former SAPOL Barracks site with 414 overnight beds (56 more than current hospital) plus capacity for an additional 20 beds in future. Features include larger emergency department with 43 treatment spaces, Australia's first all-electric public hospital, integrated 4-bed ICU for women co-located with Paediatric ICU, on-site helipad with direct access to critical clinical areas, and all critical care services (birthing, theatres, PICU, NICU) co-located on one floor. Located in Adelaide BioMed City precinct near Royal Adelaide Hospital. Construction commenced April 2024 with $306 million Stage 1 works package (1,300-space car park and central energy facility) and $427 million Stage 2 foundational works package confirmed November 2024. New design team appointed June 2025. Expected completion 2030-31.
Glenside Development
A $400 million master-planned community transforming the former Glenside Hospital site into approximately 1,200 homes, including apartments and townhouses, with a focus on modern design, heritage preservation, and significant public open space (over 30% of the 16.5-hectare site). Key components like Bloom Stage 1 and Banksia Apartments are complete, with Bloom Stage 2 under construction. The state government has recently adopted a Code Amendment to allow building heights up to 20 storeys in a specific north-west corner of the development, which could increase the total dwelling yield from 1,043 to approximately 1,200.

Norwood Oval Redevelopment
Major upgrade of the historic Norwood Oval including new grandstand, lighting, changerooms and community facilities, completed 2022-2024.

274-275 North Terrace Development Site
Premium 2,800sqm triple-street frontage development site opposite Lot Fourteen. Potential for Adelaide's tallest tower with mixed-use development including residential apartments, build-to-rent, hotel, student accommodation, retail and commercial space.

O-Bahn City Access Project
$160 million guided bus tunnel project extending O-Bahn system from Gilberton to cross-city priority bus lanes on Grenfell Street. Features 670-metre tunnel, centrally aligned priority bus lanes on Hackney Road, and improved access for 79,000 daily road users. Benefits Modbury through improved O-Bahn connectivity.

Norwood Green
A $120 million master-planned community at 100 Magill Road featuring 111 apartments, 33 townhouses, retail spaces including ALDI, and community green spaces. Built on former Caroma factory site by Buildtec Group and Catcorp.

The Parade Quarter
A landmark mixed-use development on The Parade featuring 120 luxury apartments above premium retail and dining tenancies, completed in 2023.

Osmond Terrace Mixed-Use Development
Contemporary mixed-use precinct delivering 85 apartments, ground-floor retail and commercial spaces directly opposite Norwood Oval.

Employment
AreaSearch analysis places Norwood well above average for employment performance across multiple indicators
Norwood's workforce is highly educated with strong professional services representation. The unemployment rate was 3.1% in the past year, showing an estimated employment growth of 3.3%.
As of September 2025, 7,068 residents were employed, with an unemployment rate of 0.8% below Greater Adelaide's rate of 3.9%. Workforce participation was similar to Greater Adelaide's 61.7%. Key industries included health care & social assistance, professional & technical, and education & training. Professional & technical employment had a share 2.0 times the regional level.
Construction employed only 5.5% of local workers compared to Greater Adelaide's 8.7%. There were 1.2 workers per resident as at the Census, indicating Norwood functions as an employment hub attracting workers from surrounding areas. Between September 2024 and September 2025, employment levels increased by 3.3% and labour force grew by 3.4%, with unemployment remaining essentially unchanged. In contrast, Greater Adelaide saw employment rise by 3.0%, labour force grow by 2.9%, and a slight fall in unemployment of 0.1 percentage points. State-level data to 25-Nov-25 showed SA employment grew by 1.19% year-on-year, adding 10,710 jobs, with the state unemployment rate at 4.0%. National employment forecasts from May-25 suggest national employment will expand by 6.6% over five years and 13.7% over ten years. Applying these projections to Norwood's employment mix suggests local employment should increase by 7.2% over five years and 14.7% over ten years.
Frequently Asked Questions - Employment
Income
Income analysis reveals strong economic positioning, with the area outperforming 60% of locations assessed nationally by AreaSearch
AreaSearch's latest postcode level ATO data for financial year 2022 shows that Norwood SA2 has a high national median income of $58,654 and an average income of $88,660. In comparison, Greater Adelaide has a median income of $52,592 and an average income of $64,886. Based on Wage Price Index growth of 12.83% since financial year 2022, estimated incomes as of September 2025 would be approximately $66,179 (median) and $100,035 (average). Census 2021 data indicates personal income ranks at the 71st percentile ($933 weekly), with household income at the 44th percentile. The earnings profile shows that 29.1% of residents earn between $1,500 and $2,999 weekly (3,524 residents), similar to the metropolitan region where this cohort represents 31.8%. Housing affordability pressures are severe, with only 83.4% of income remaining, ranking at the 45th percentile. The area's SEIFA income ranking places it in the 7th decile.
Frequently Asked Questions - Income
Housing
Norwood displays a diverse mix of dwelling types, with a higher proportion of rental properties than the broader region
In Norwood, as per the latest Census evaluation, 32.0% of dwellings were houses while 68.0% were other types such as semi-detached homes, apartments, and 'other' dwellings. This is in contrast to Adelaide metro's figures which stood at 51.7% for houses and 48.4% for other dwellings. Home ownership in Norwood was recorded at 30.3%, with mortgaged dwellings accounting for 22.0% and rented ones for 47.8%. The median monthly mortgage repayment in the area was $2,000, aligning with Adelaide metro's average. Meanwhile, the median weekly rent figure in Norwood was $360, slightly higher than Adelaide metro's $340. Nationally, Norwood's median monthly mortgage repayments were higher at $2,000 compared to Australia's average of $1,863, while median weekly rents were lower at $360 against the national figure of $375.
Frequently Asked Questions - Housing
Household Composition
Norwood features high concentrations of lone person households and group households, with a lower-than-average median household size
Family households comprise 53.7% of all households, including 18.6% couples with children, 25.9% couples without children, and 8.0% single parent families. Non-family households constitute the remaining 46.3%, with lone person households at 40.1% and group households comprising 6.0%. The median household size is 2.0 people, which is smaller than the Greater Adelaide average of 2.2.
Frequently Asked Questions - Households
Local Schools & Education
Norwood shows strong educational performance, ranking in the upper quartile nationally when assessed across multiple qualification and achievement indicators
In Norwood, a substantial 51.6% of residents aged 15 and above have university qualifications, significantly surpassing the state (SA) average of 25.7% and the Greater Adelaide average of 28.9%. This high educational attainment positions the area favourably for knowledge-based opportunities. Bachelor degrees are the most common at 32.0%, followed by postgraduate qualifications at 15.1% and graduate diplomas at 4.5%. Vocational pathways account for 21.3% of qualifications, with advanced diplomas at 9.6% and certificates at 11.7%.
Educational participation is notably high, with 29.7% of residents currently enrolled in formal education, including 10.5% in tertiary education, 7.5% in primary education, and 6.8% pursuing secondary education.
Frequently Asked Questions - Education
Schools Detail
Nearby Services & Amenities
Transport
Transport servicing is high compared to other areas nationally based on assessment of service frequency, route connectivity and accessibility
The analysis of public transport in Norwood shows that there are currently 54 active transport stops operating within the area. These stops serve a mix of bus routes, with each route having its own schedule. The total number of weekly passenger trips facilitated by these stops is 3,672.
Residents of Norwood have excellent accessibility to public transport, as they are typically located only 178 meters away from their nearest transport stop. On average, there are 524 trips per day across all routes combined, which equates to approximately 68 weekly trips per individual stop.
Frequently Asked Questions - Transport
Transport Stops Detail
Health
The level of general health in Norwood is notably higher than the national average with both young and old age cohorts seeing low prevalence of common health conditions
Norwood shows superior health outcomes with both younger and older age groups having low prevalence rates for common health issues. Private health cover is exceptionally high at approximately 64% of the total population (7,751 people), compared to Greater Adelaide's 61.4%, and the national average of 55.3%. Mental health issues affect 8.6% of residents, while arthritis impacts 7.5%.
A significant 70.6% declare themselves completely clear of medical ailments, similar to Greater Adelaide's 70.4%. The area has 21.6% of residents aged 65 and over (2,619 people). Health outcomes among seniors are notably strong, outperforming the general population in health metrics.
Frequently Asked Questions - Health
Cultural Diversity
Norwood was found to be more culturally diverse than the vast majority of local markets in Australia, upon assessment of a range of language and cultural background related metrics
Norwood's population was found to be more linguistically diverse than most local markets, with 24.4% speaking a language other than English at home as of the latest data from 2016. Additionally, 33.5% of Norwood residents were born overseas by this date. Christianity was identified as the predominant religion in Norwood, comprising 40.2% of its population.
However, Judaism's representation stood out significantly, making up 0.2% of Norwood's population compared to a regional average of 0.2%. In terms of ancestry, the top three represented groups were English at 26.0%, Australian at 17.9%, and Other at 9.7%. Some ethnic groups showed notable differences in representation: Italians were overrepresented at 6.2% compared to a regional average of 11.1%, Hungarians were slightly overrepresented at 0.4% versus 0.3%, and Germans were nearly equally represented at 4.9% compared to the region's 5.0%.
Frequently Asked Questions - Diversity
Age
Norwood's population is slightly older than the national pattern
The median age in Norwood, at 40 years, is similar to Greater Adelaide's average of 39 years but somewhat older than Australia's median age of 38 years. The 25-34 age group makes up 17.8% of Norwood's population compared to Greater Adelaide's figure, while the 5-14 cohort constitutes 7.9%. Post-2021 Census data reveals that the 75-84 age group has increased from 6.9% to 8.2%, and the 15-24 cohort has risen from 12.6% to 13.9%. Conversely, the 55-64 age group has decreased from 12.0% to 10.9%. Population forecasts for 2041 indicate significant demographic shifts in Norwood. Notably, the 85+ age group is projected to grow by 124%, reaching 688 people from 307. The combined 65+ age groups are expected to account for 53% of total population growth, reflecting Norwood's aging demographic profile. In contrast, the 5-14 cohort is projected to decrease by 16 people.


