Chart Color Schemes
This analysis uses ABS Statistical Areas Level 2 (SA2) boundaries, which can materially differ from Suburbs and Localities (SAL) even when sharing similar names.
SA2 boundaries are defined by the Australian Bureau of Statistics and are designed to represent communities for statistical reporting (e.g., census and ERP).
Suburbs and Localities (SAL) represent commonly-used suburb/locality names (postal-style areas) and may use different geographic boundaries. For comprehensive analysis, consider reviewing both boundary types if available.
est. as @ -- *
ABS ERP | -- people | --
2021 Census | -- people
Sales Activity
Curious about local property values? Filter the chart to assess the volume and appreciation (including resales) trends and regional comparisons, or scroll to the map below view this information at an individual property level.
Find a Recent Sale
Sales Detail
Population
Population growth drivers in Sherwood are strong compared to national averages based on AreaSearch's ranking of recent, and medium to long-term trends
Sherwood's population was around 7,080 as of November 2025. This figure reflects an increase of 628 people since the 2021 Census, which recorded a population of 6,452 people. The change is inferred from the estimated resident population of 6,985 in June 2024 and an additional 80 validated new addresses since the Census date. This results in a density ratio of 3,105 persons per square kilometer, placing Sherwood in the upper quartile relative to national locations assessed by AreaSearch. Sherwood's population growth rate of 9.7% since the 2021 census exceeded both the SA4 region (8.3%) and the national average. Overseas migration contributed approximately 63.3% of overall population gains during recent periods, with all drivers including natural growth and interstate migration being positive factors.
AreaSearch adopts ABS/Geoscience Australia projections for each SA2 area, released in 2024 with a base year of 2022. For areas not covered by this data and years post-2032, Queensland State Government's SA2 area projections are used, released in 2023 based on 2021 data. These state projections do not provide age category splits; hence proportional growth weightings are applied in line with the ABS Greater Capital Region projections for each age cohort, released in 2023 based on 2022 data. Future population dynamics anticipate a population increase just below the median of statistical areas analysed by AreaSearch, with an expected increase to 764 persons by 2041 based on the latest annual ERP population numbers, reflecting a gain of 9.4% in total over the 17 years.
Frequently Asked Questions - Population
Development
Recent residential development output has been above average within Sherwood when compared nationally
Sherwood has received approximately 25 dwelling approvals annually over the past five financial years, totalling 127 homes. As of FY-26, eight approvals have been recorded. On average, 5.5 people per year have moved to Sherwood for each dwelling built between FY-21 and FY-25. The demand significantly exceeds new supply, leading to price growth and increased buyer competition.
New dwellings are developed at an average cost of $415,000, which is higher than regional norms due to quality-focused development. This financial year has seen approximately $2.2 million in commercial approvals, reflecting Sherwood's residential nature. Compared to Greater Brisbane, Sherwood has 17.0% less building activity per person and ranks among the 51st percentile of areas assessed nationally. New development consists of equal parts detached houses and townhouses or apartments, promoting higher-density living which creates more affordable entry points for downsizers, investors, and first-home buyers.
With around 450 people moving to Sherwood for each dwelling approval, it indicates a developed market. According to the latest AreaSearch quarterly estimate, Sherwood is projected to add 669 residents by 2041. Current construction rates appear balanced with future demand, fostering steady market conditions without excessive price pressure.
Frequently Asked Questions - Development
Infrastructure
Sherwood has very high levels of nearby infrastructure activity, ranking in the top 20% nationally
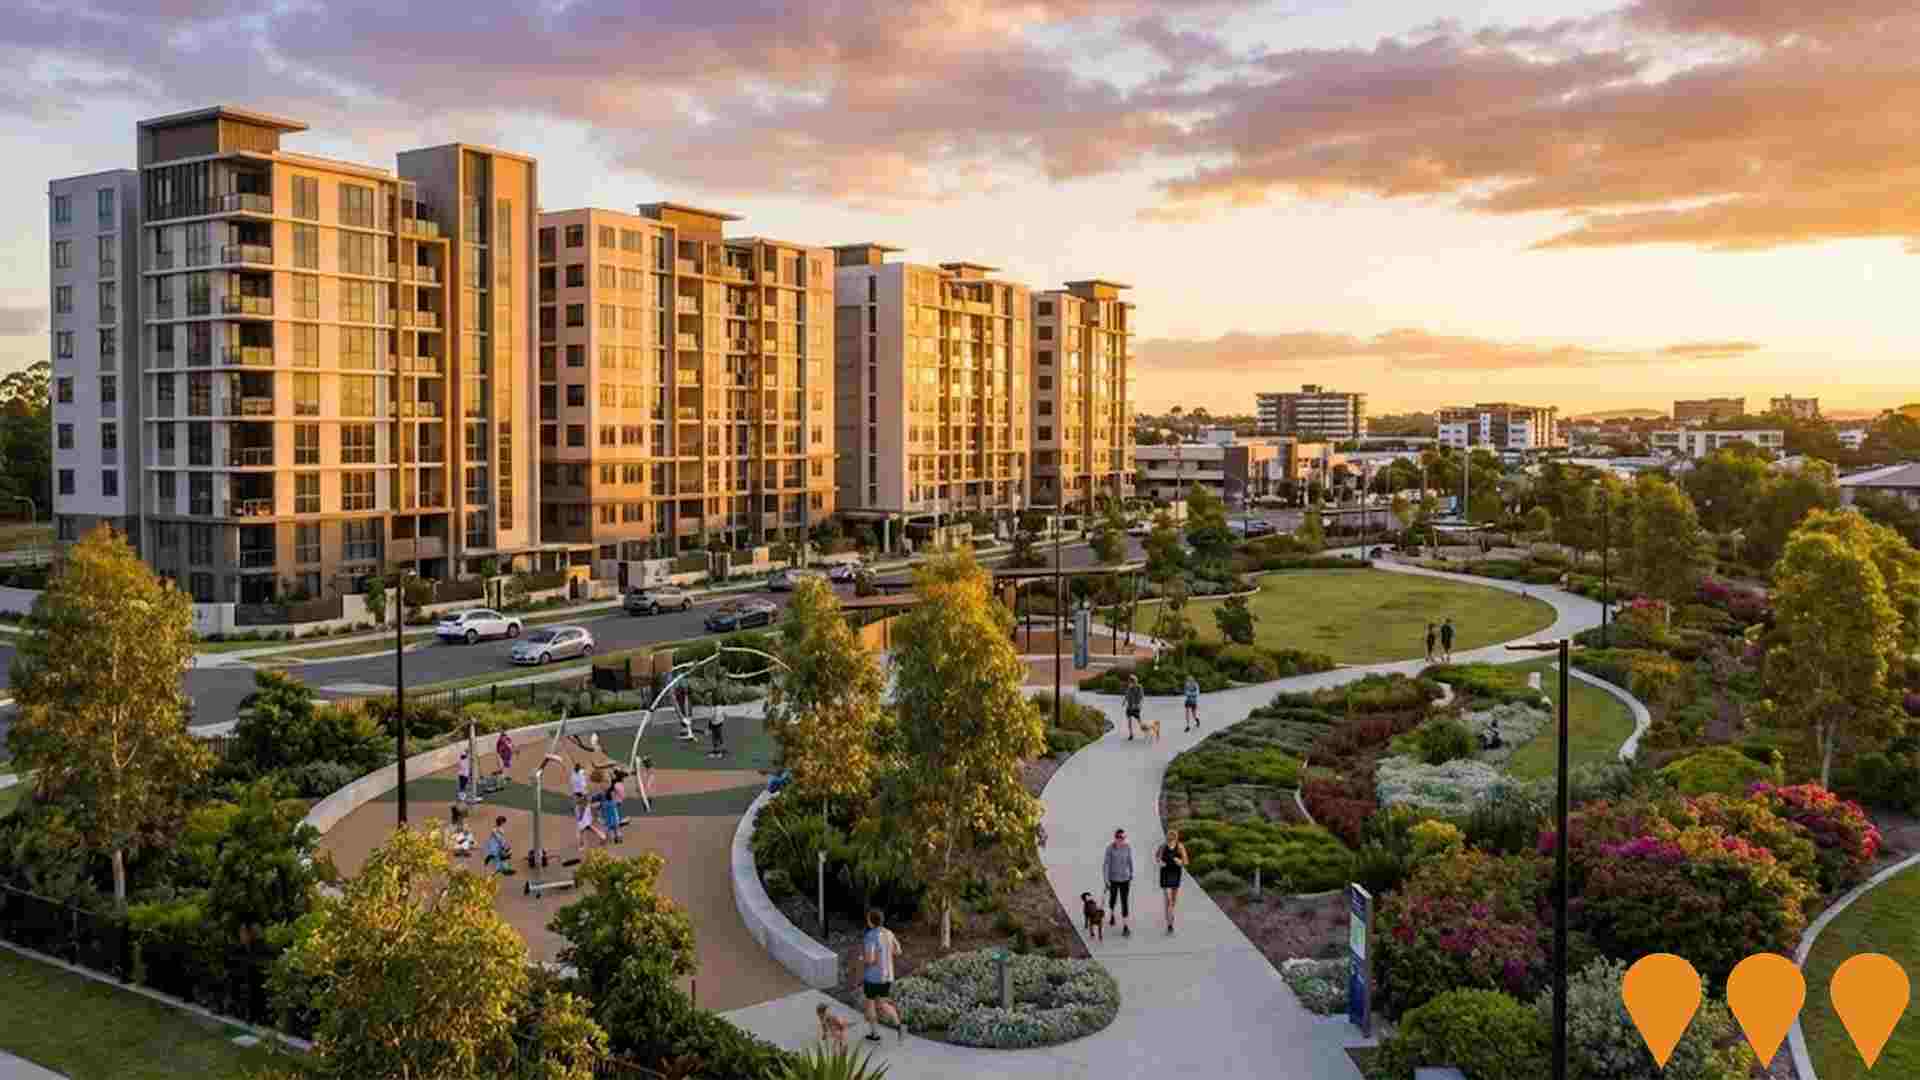
Changes in local infrastructure significantly impact an area's performance. AreaSearch has identified four projects likely to affect this region. Notable projects include Oxley Creek Transformation, Parklands At Sherwood, Cross River Rail - Graceville Station, and Centenary Motorway Bypass. The following list details those most relevant.
Professional plan users can use the search below to filter and access additional projects.
INFRASTRUCTURE SEARCH
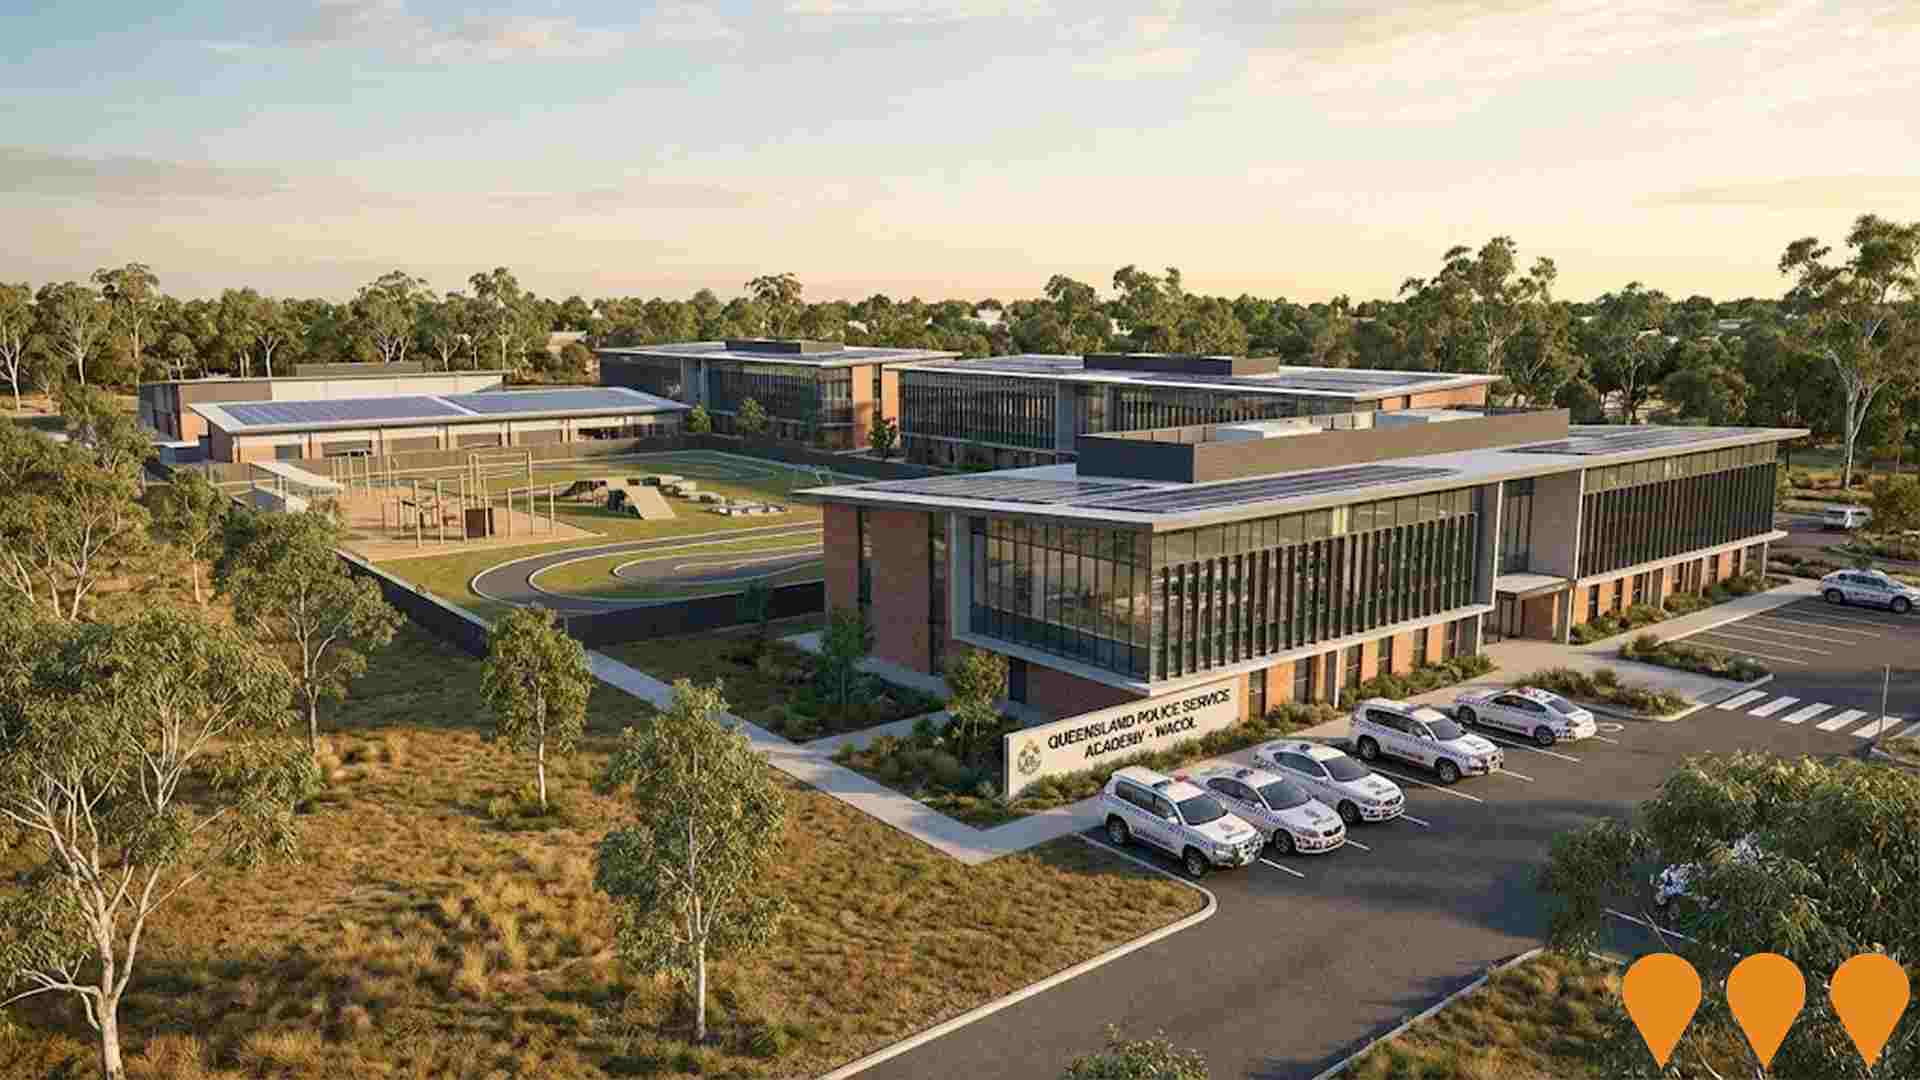
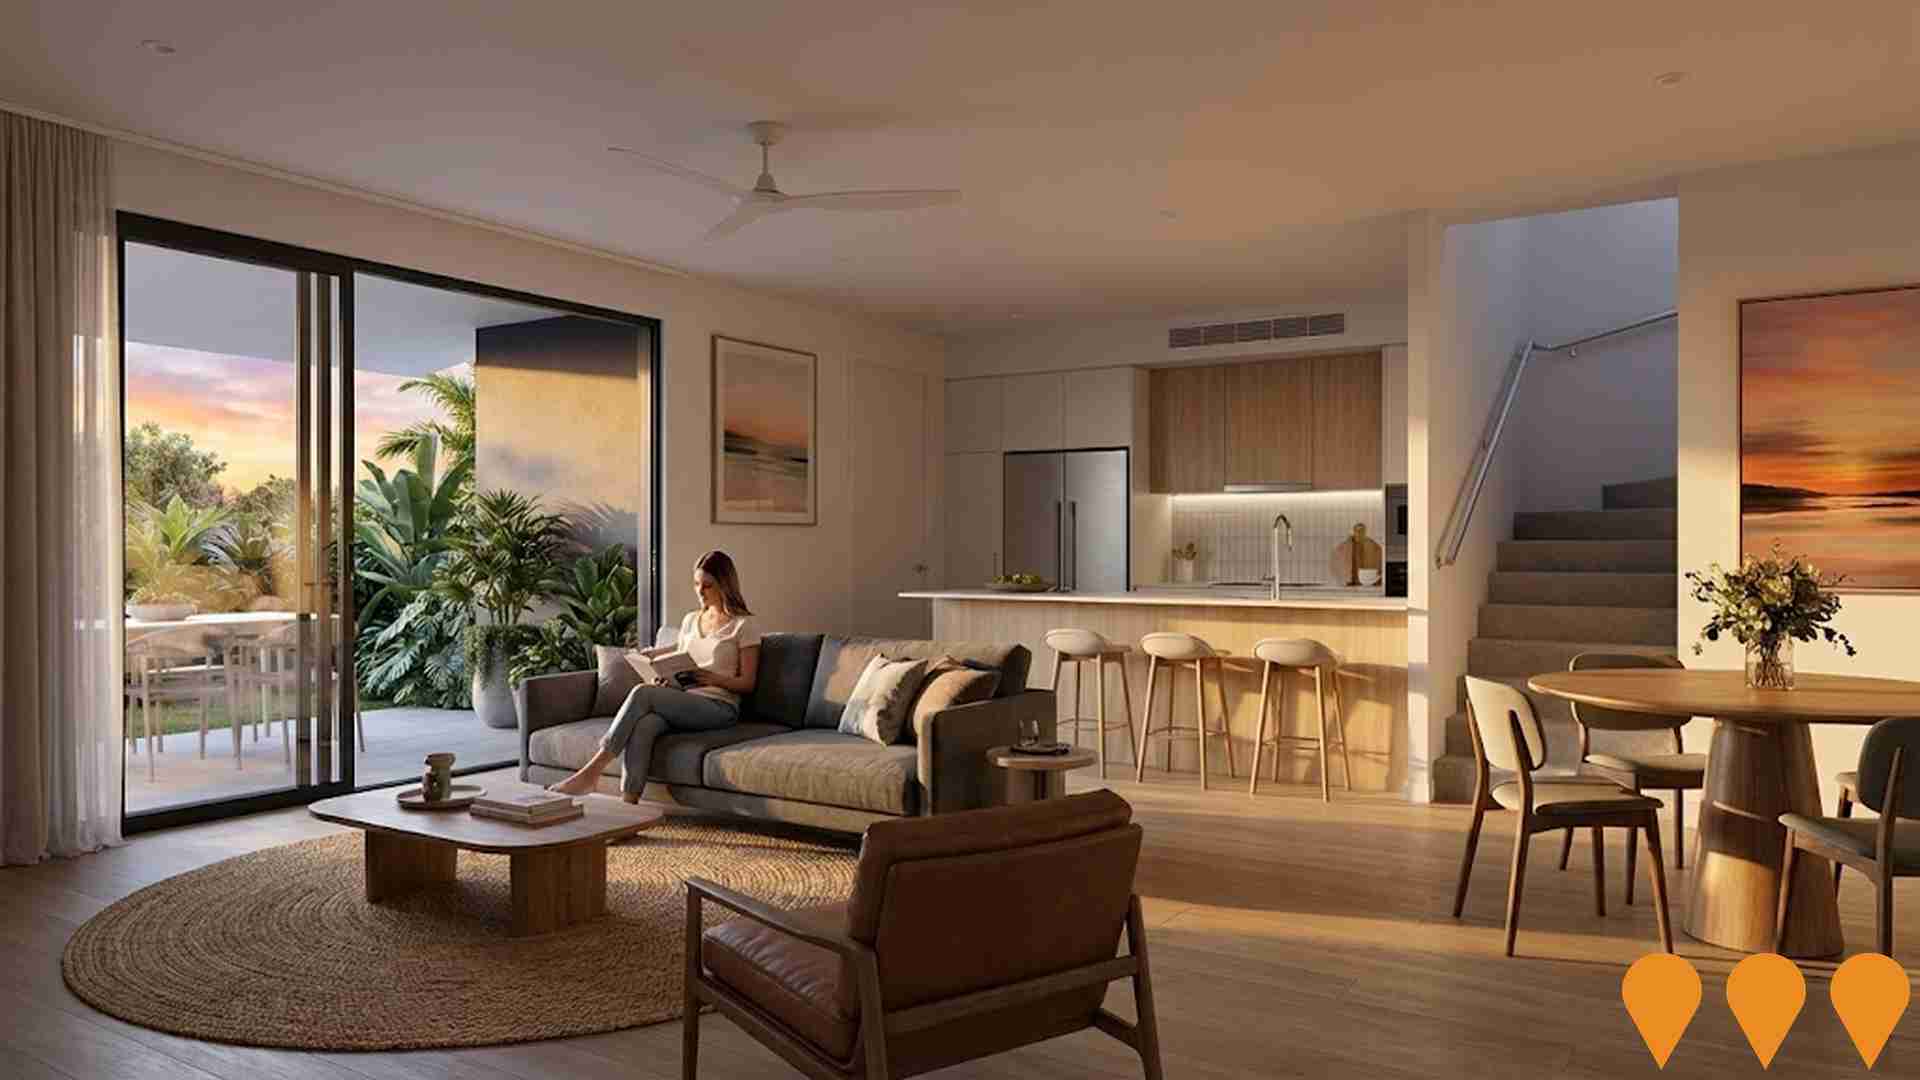
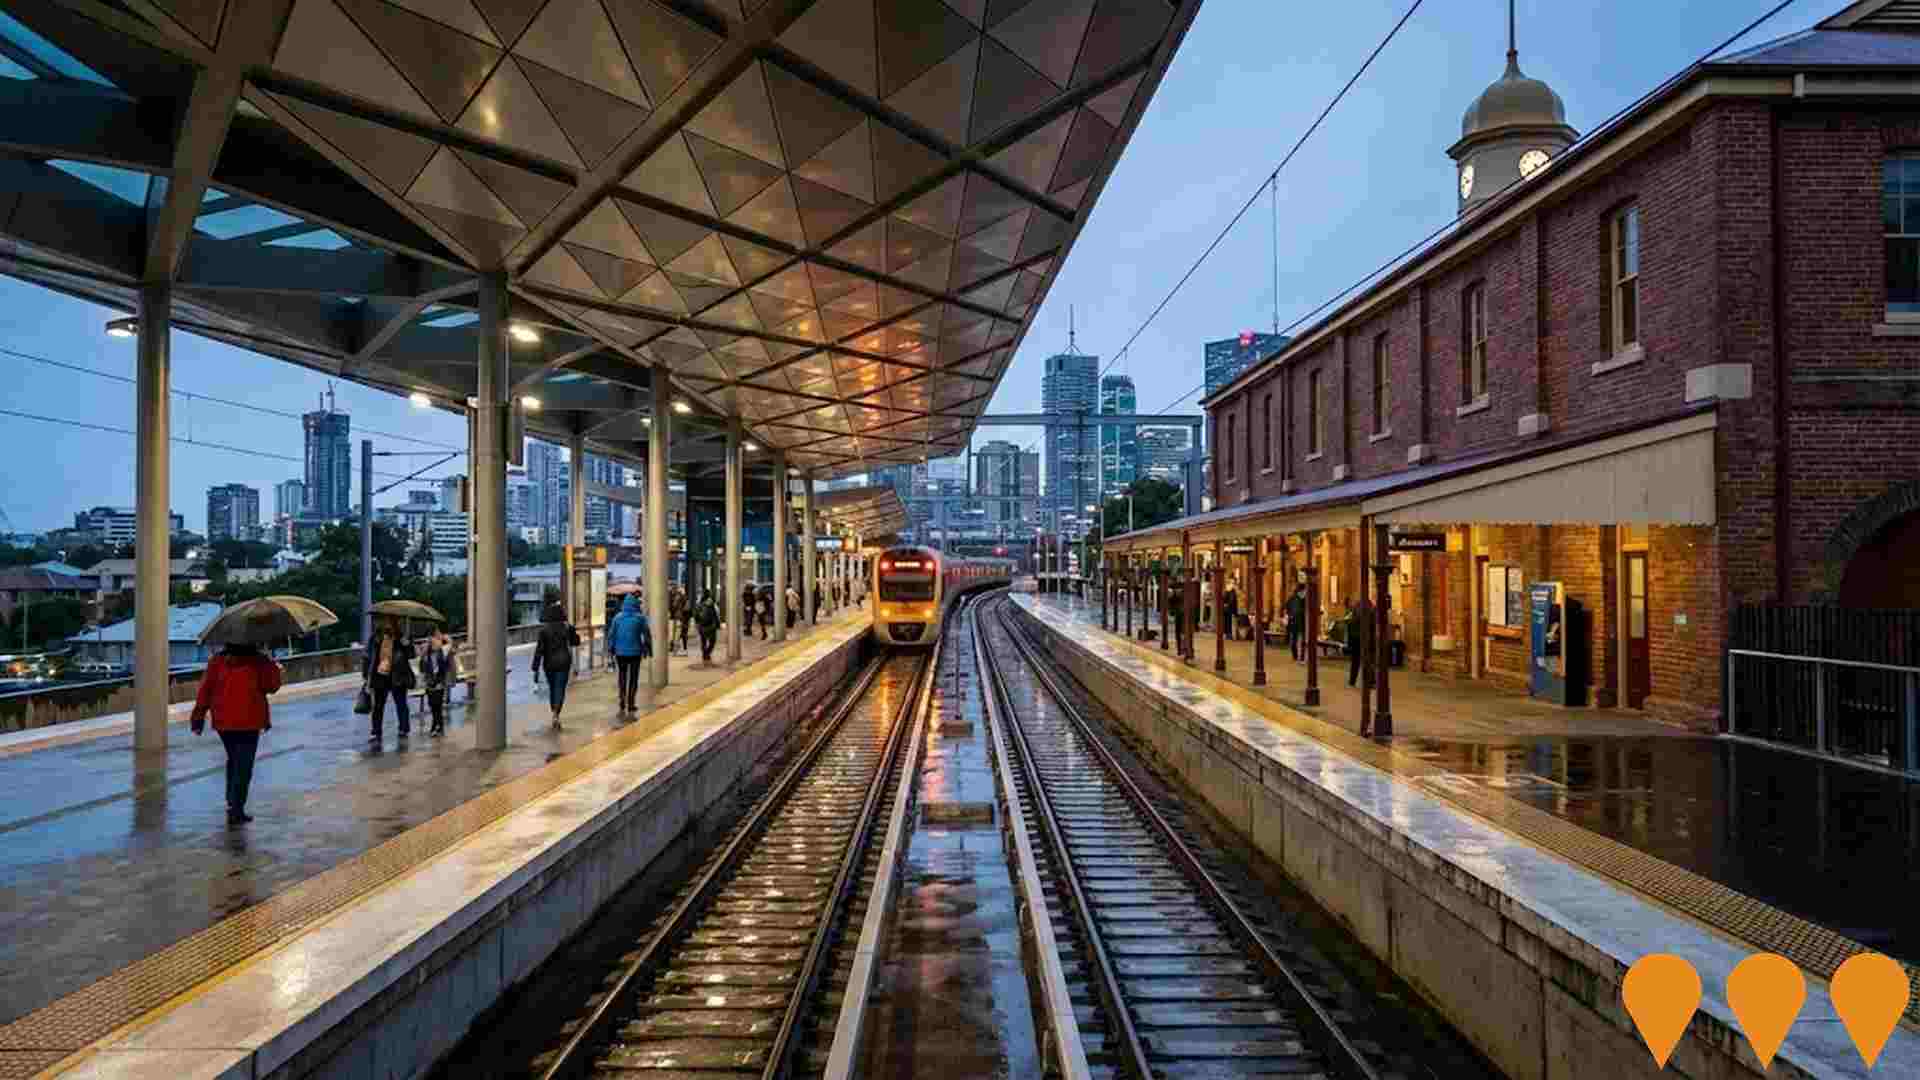
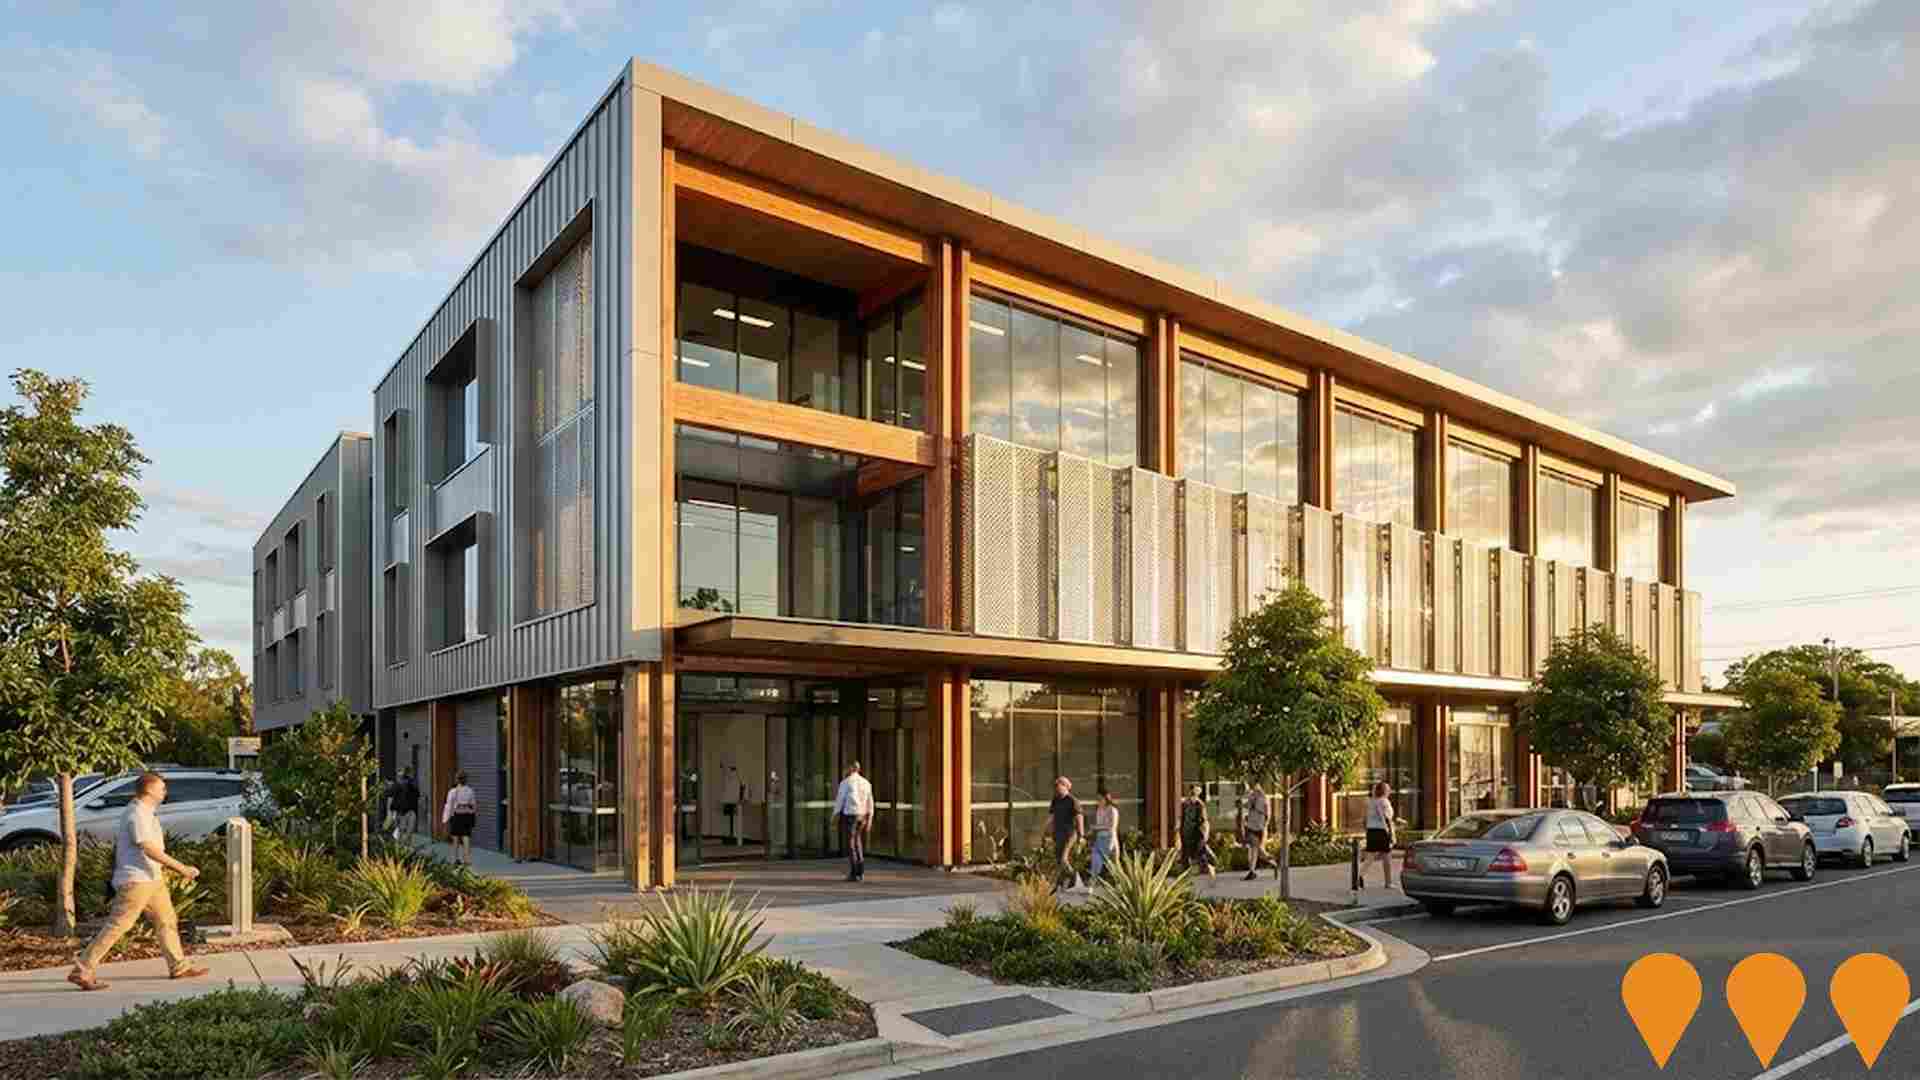
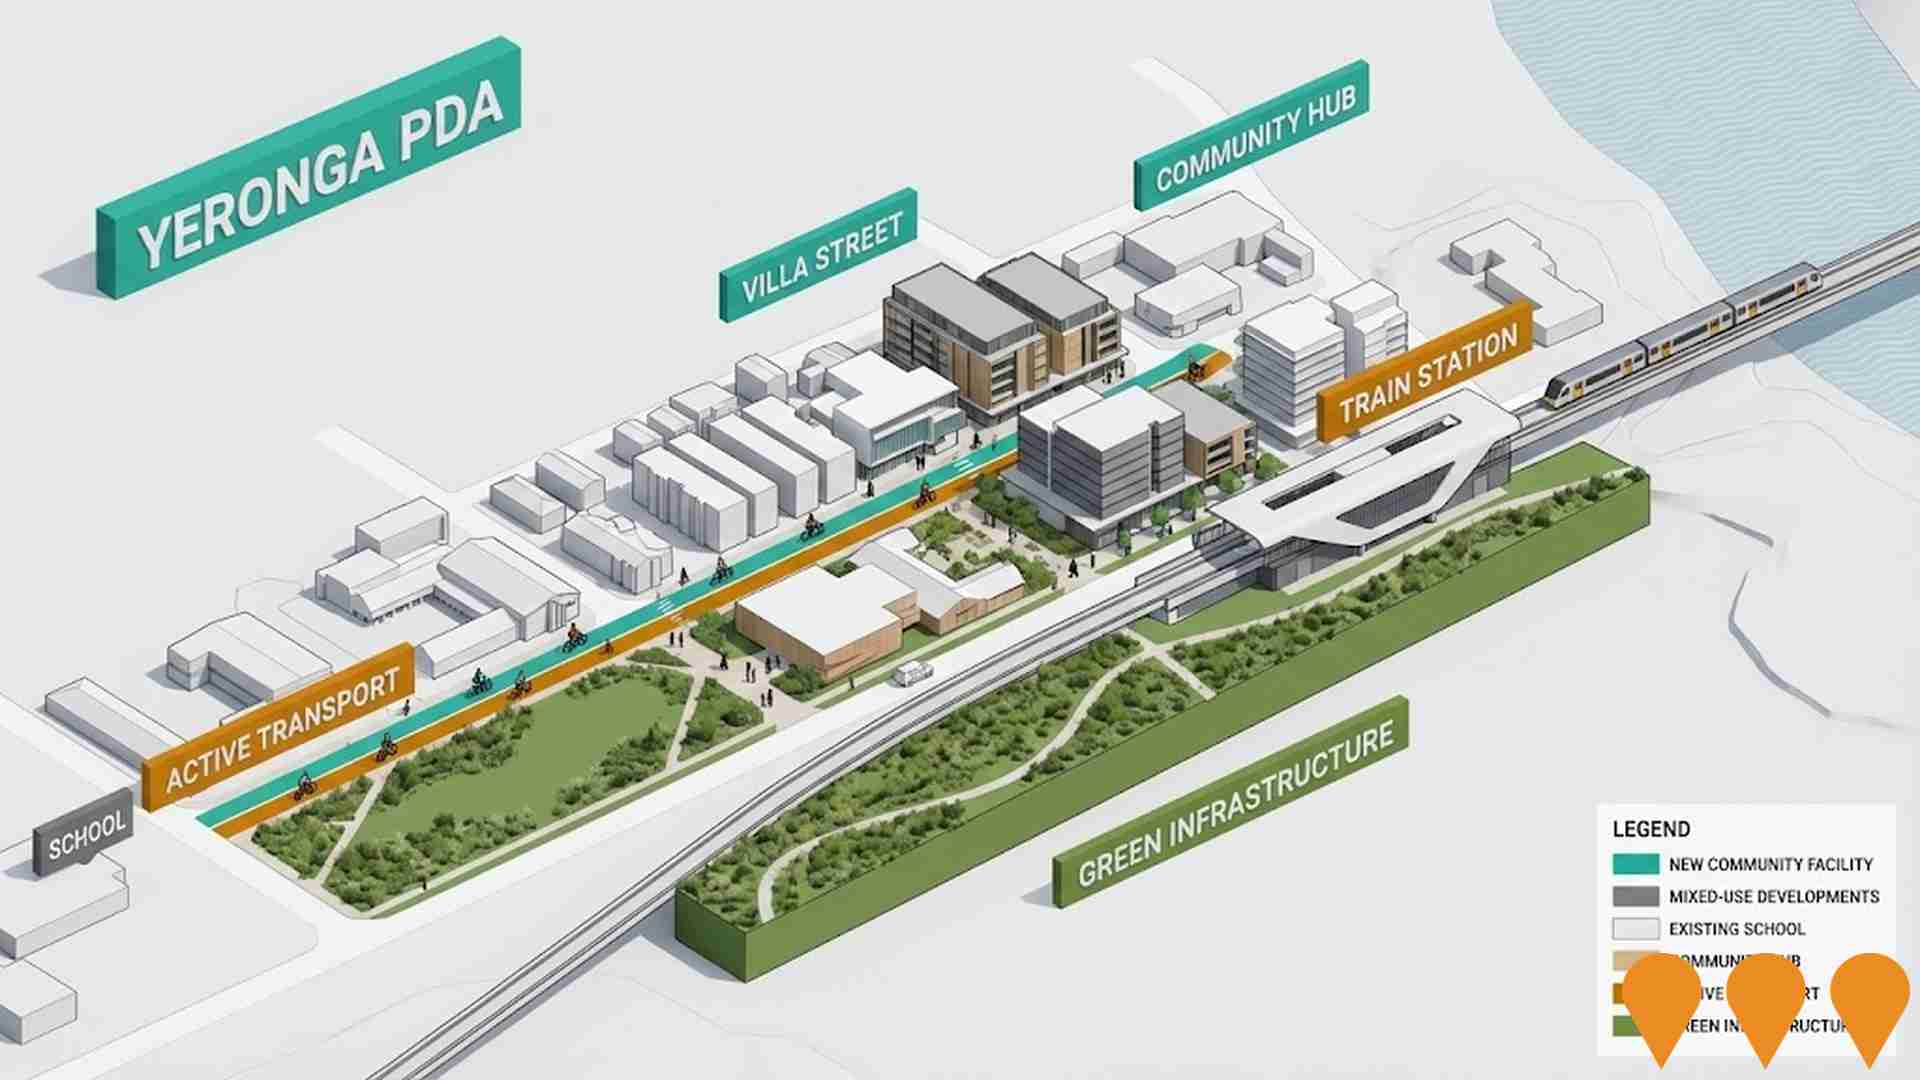
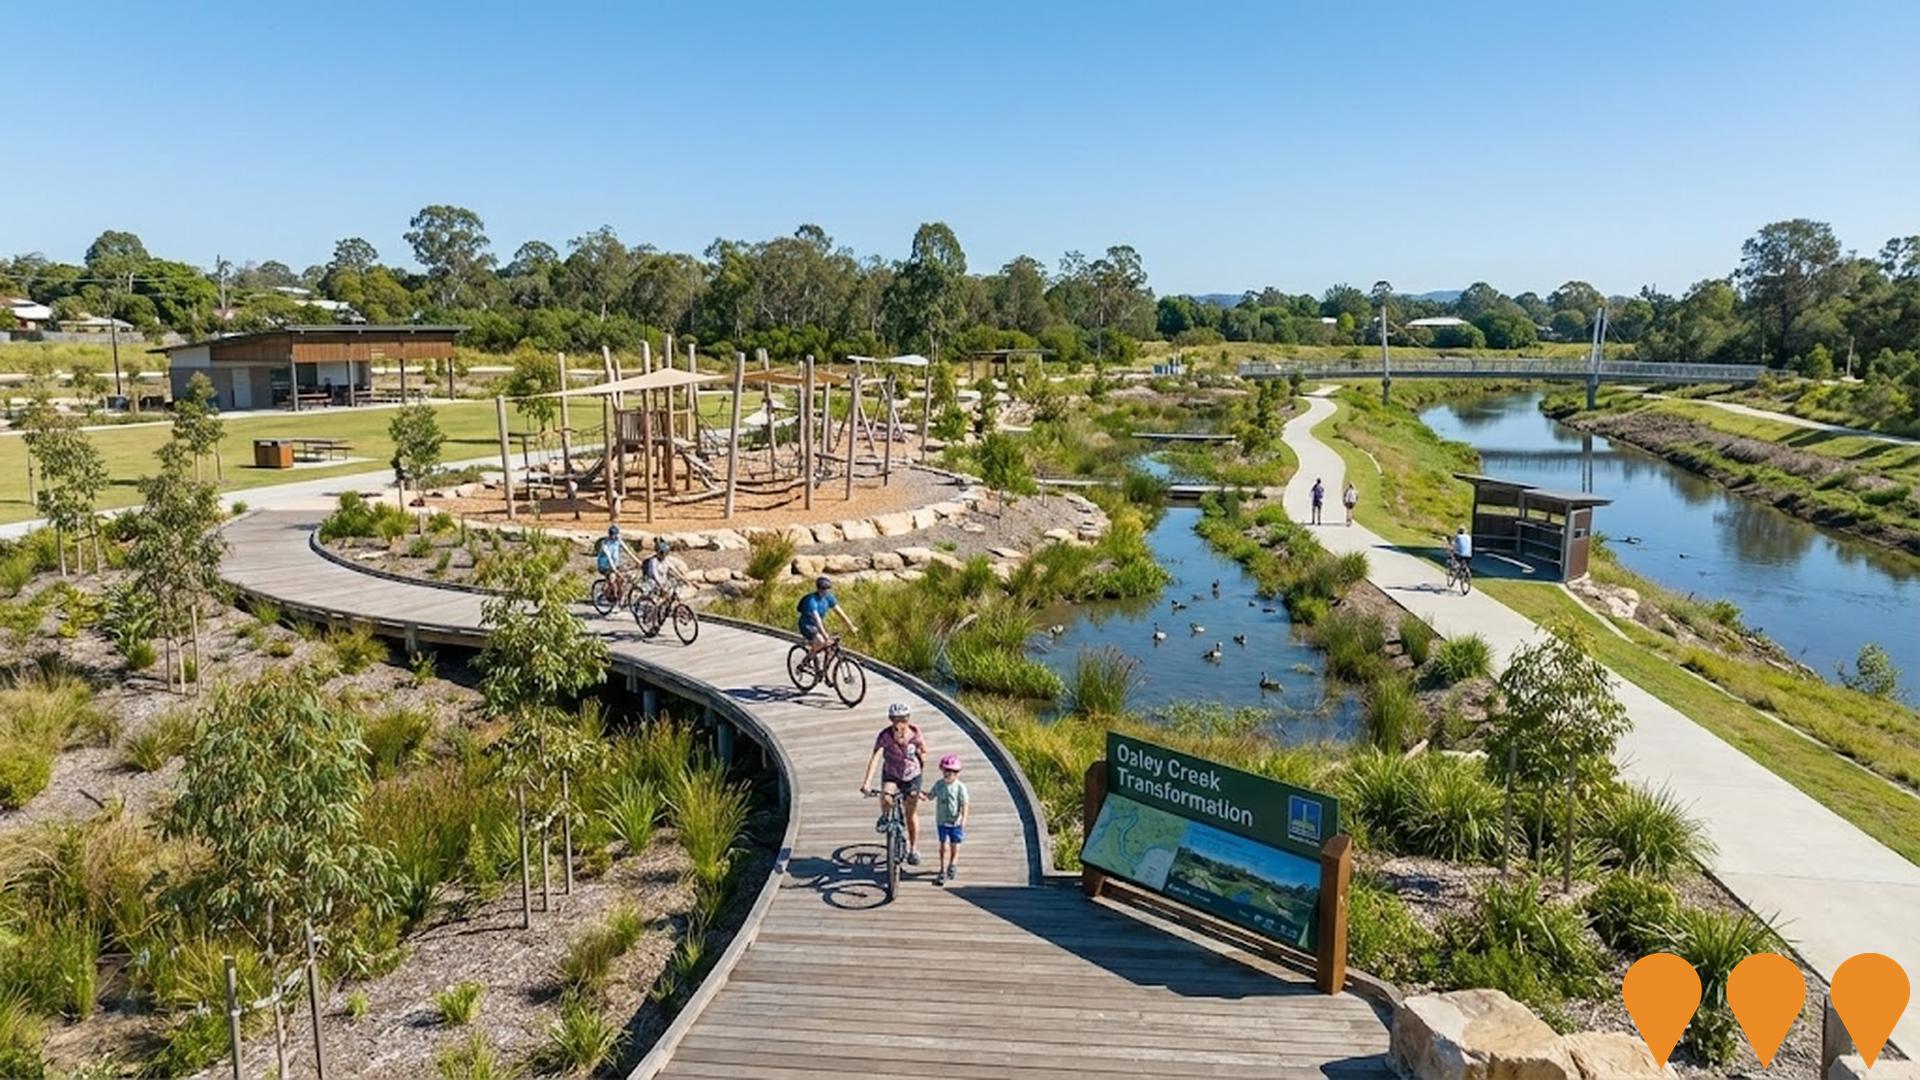
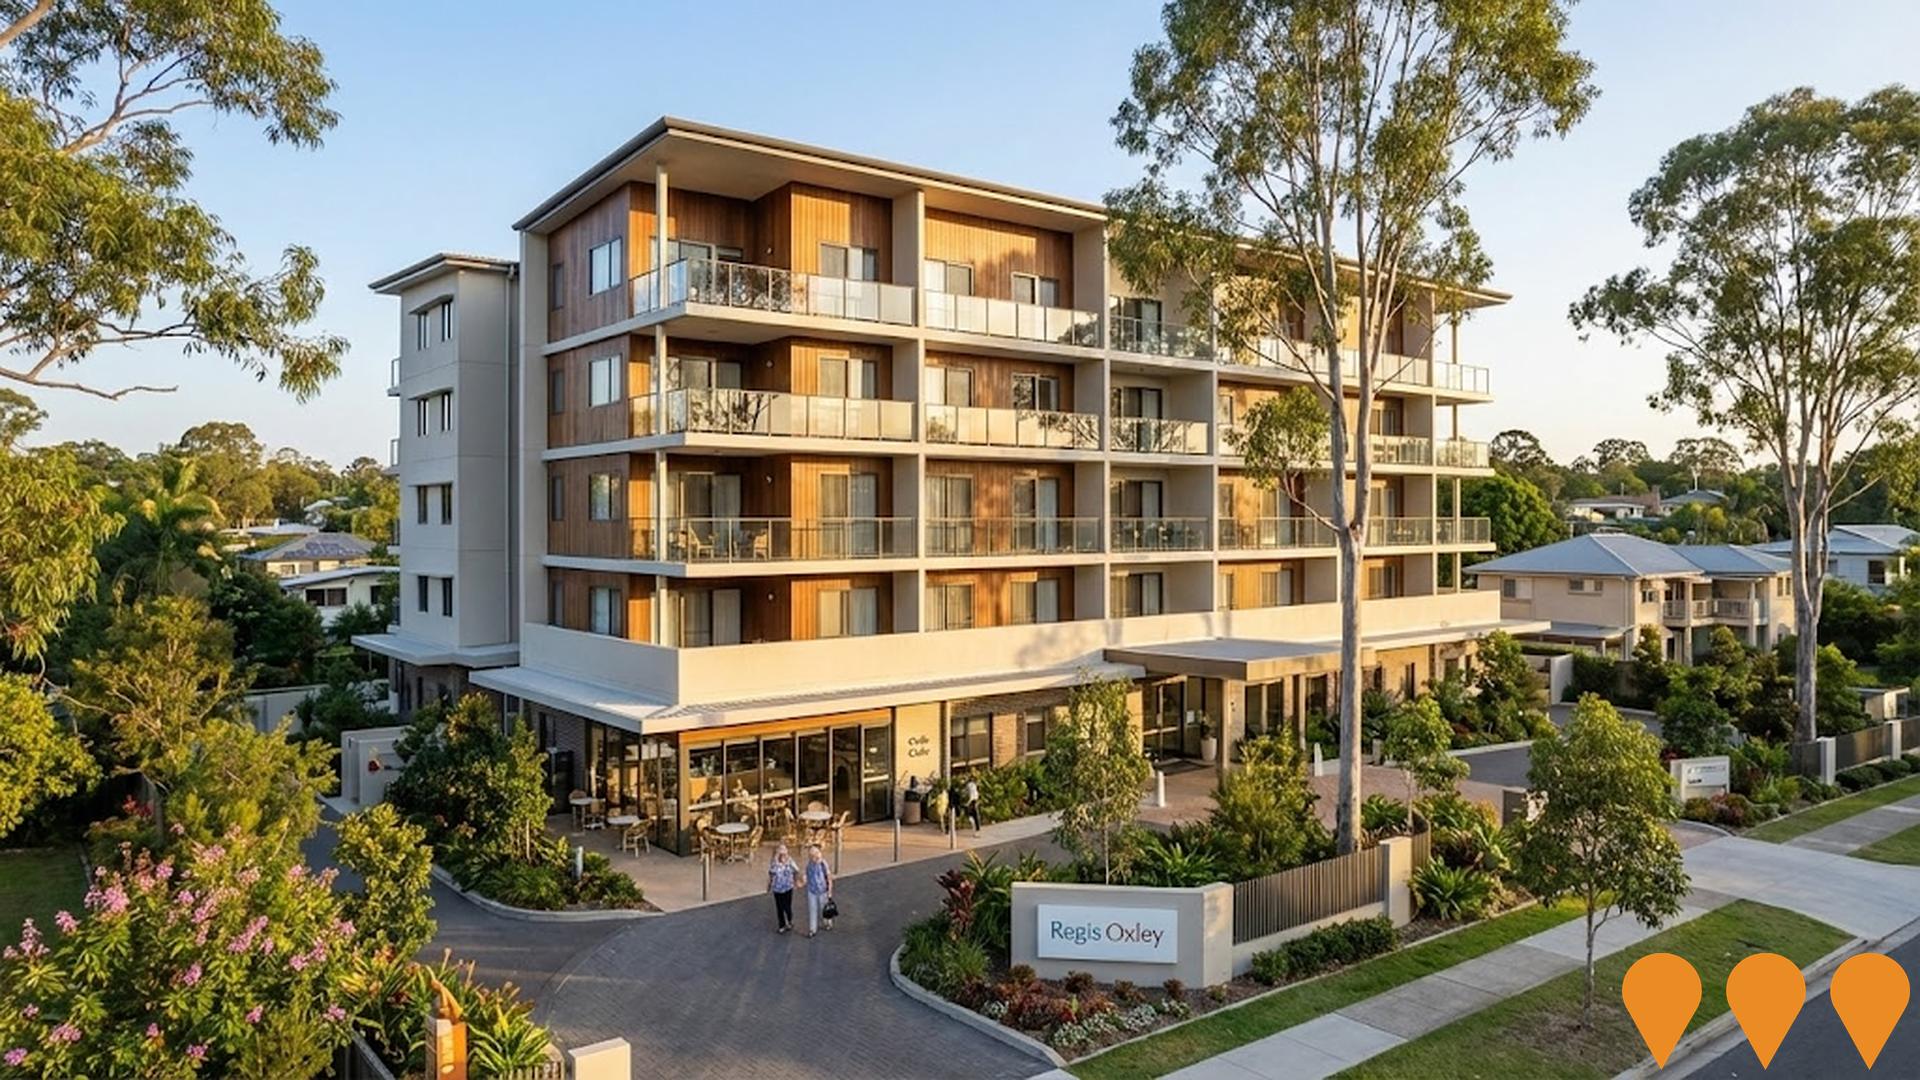
 Denotes AI-based impression for illustrative purposes only, not to be taken as definitive under any circumstances. Please follow links and conduct other investigations from the project's source for actual imagery. Developers and project owners wishing us to use original imagery please Contact Us and we will do so.
Frequently Asked Questions - Infrastructure
Oxley Creek Transformation
A 20-year (2017-2037) $100 million+ Brisbane City Council project to transform the ~20km Oxley Creek corridor from the Brisbane River at Tennyson to Larapinta into a world-class green lifestyle and leisure destination. Includes large-scale environmental restoration, habitat and waterway improvements, flood resilience enhancements, multi-use parklands (e.g. Warril Parkland, Archerfield Wetlands District Park - opened stages with adventure play, discovery trails, birdwatching), The Greenway recreation trail, Oxley Creek Common birdwatching enhancements, and ongoing Corridor Restoration Project. Delivered in stages with multiple precincts now open or under active construction/planning as of 2025.
Cross River Rail
Queensland's largest public transport infrastructure project: a new 10.2 km rail line with 5.9 km twin tunnels under the Brisbane CBD and Brisbane River, four new underground stations (Boggo Road, Woolloongabba, Albert Street, Roma Street), upgrade of Exhibition station, rebuild of Dutton Park station, and extensive integration works connecting the new tunnels to the existing Queensland Rail network including ETCS Level 2 signalling rollout and southside surface station handovers.

Regis Oxley (formerly Rockpool Songbird Oxley Aged Care)
A six-storey, 150-bed (also cited as 152-bed) residential aged care facility, which opened in March/April 2025. The facility offers residential, respite, memory support, and palliative care, featuring an on-site wellness and vitality centre, hair salon, function room, and caf‚/alfresco area. It was developed by Rockpool Residential Aged Care as part of the Songbird Oxley integrated community but was acquired by Regis Aged Care in September 2025 and is now operating as Regis Oxley. The facility achieved a 5-Star Green Star Rating equivalency, with features like small household resident communities per floor.
Nathan, Salisbury, Moorooka Neighbourhood Plan
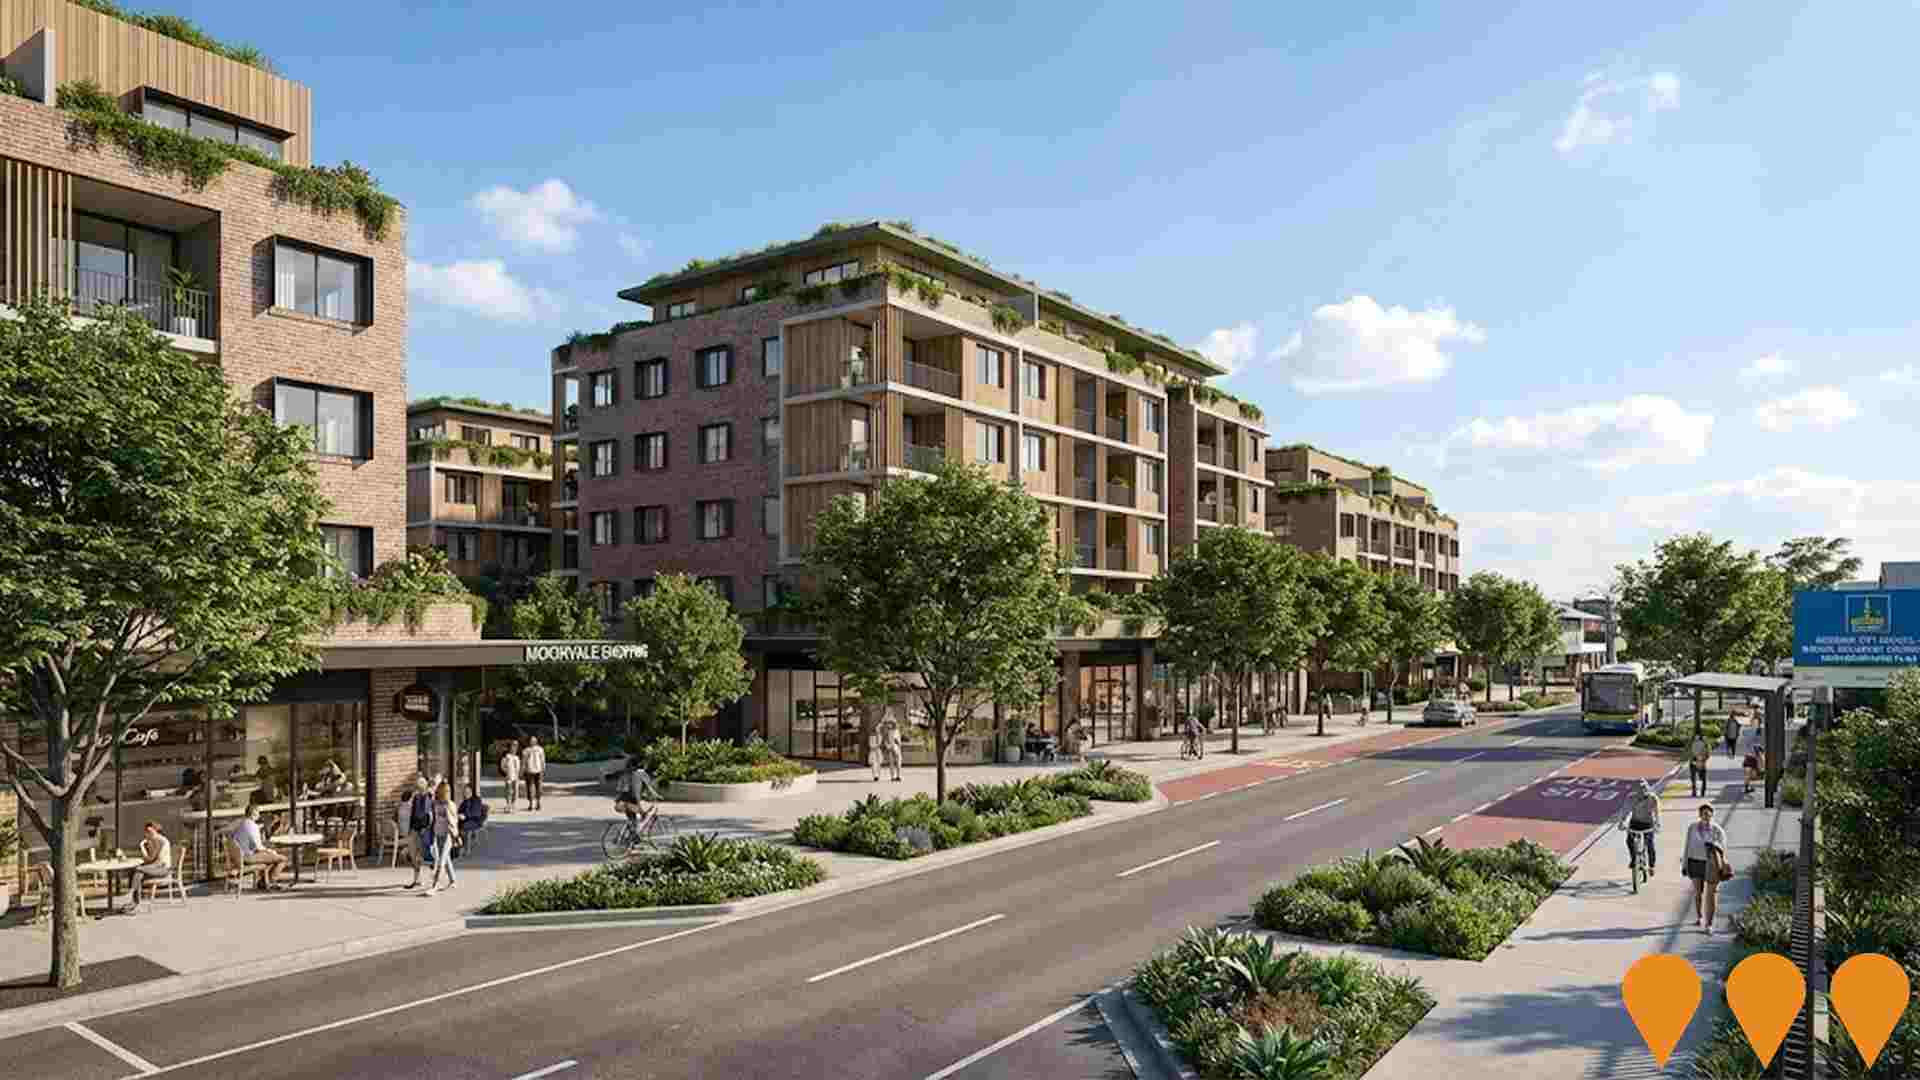
Comprehensive neighbourhood plan adopted by Brisbane City Council in May 2025 and effective from 27 June 2025. Guides future development over 10+ years in Nathan, Salisbury, and Moorooka suburbs. Enables approximately 2,500 new homes and 12,500 new jobs. Key features include transforming the 'Magic Mile' precinct into a major employment and lifestyle hub, upgrading Ipswich Road to six lanes with new western bikeway, enhancing walkability and transport links (including Cross River Rail benefits), protecting character residential areas and heritage, preserving Toohey Forest and creek corridors biodiversity. Includes specific precincts: Magic Mile lifestyle, Moorvale shopping, heritage renewal, and residential renewal encouraging mixed-density housing.
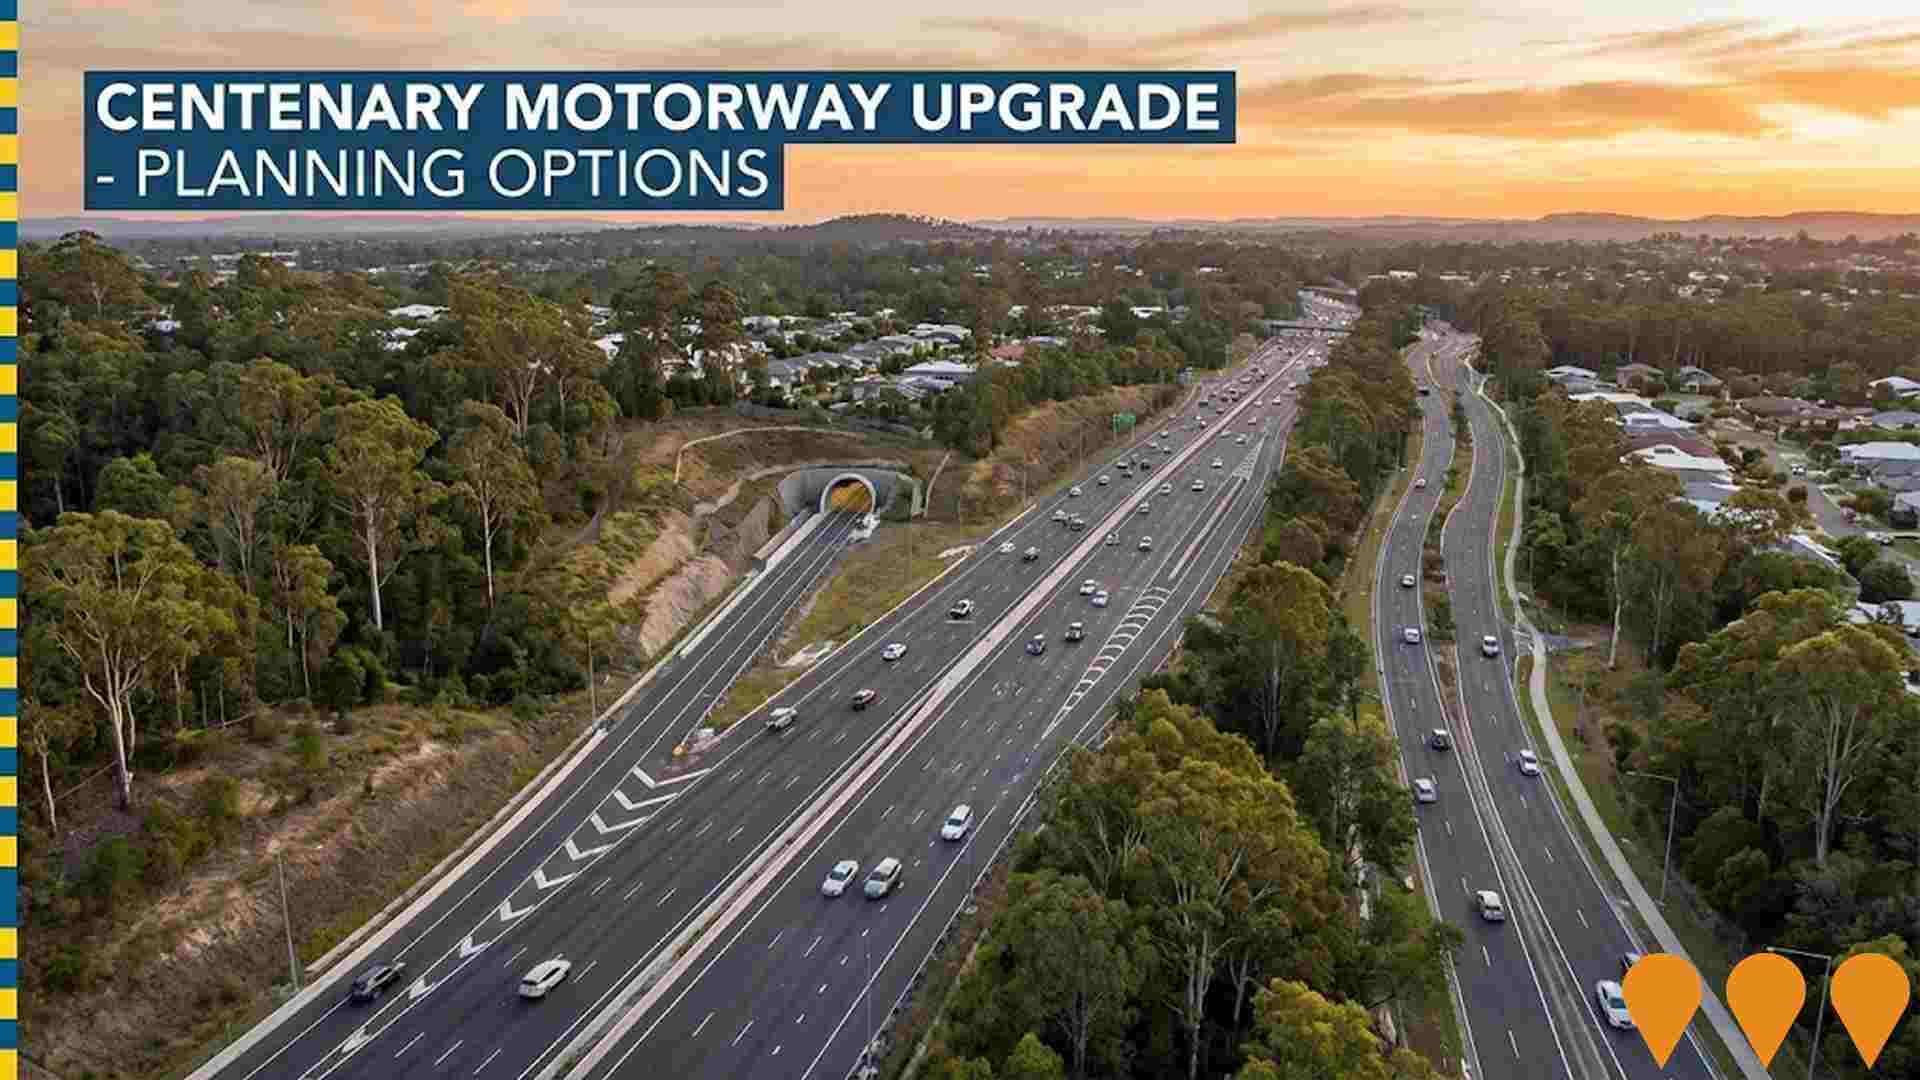
Centenary Motorway Upgrade Planning
The Queensland Department of Transport and Main Roads is developing a long-term corridor masterplan for the upgrade of the Centenary Motorway between Darra and Toowong. Two shortlisted options: Option 1 - a tunnel with targeted surface upgrades; Option 2 - widening of the existing motorway plus a new arterial road. The motorway serves high daily traffic volumes with significant forecasted growth. Masterplan finalisation expected in 2025, with community consultation on options in early-mid 2025. Upgrades to be delivered in stages subject to future funding. Separate to the ongoing Centenary Bridge Upgrade at Jindalee. Planning funded by $10 million from the Australian Government.
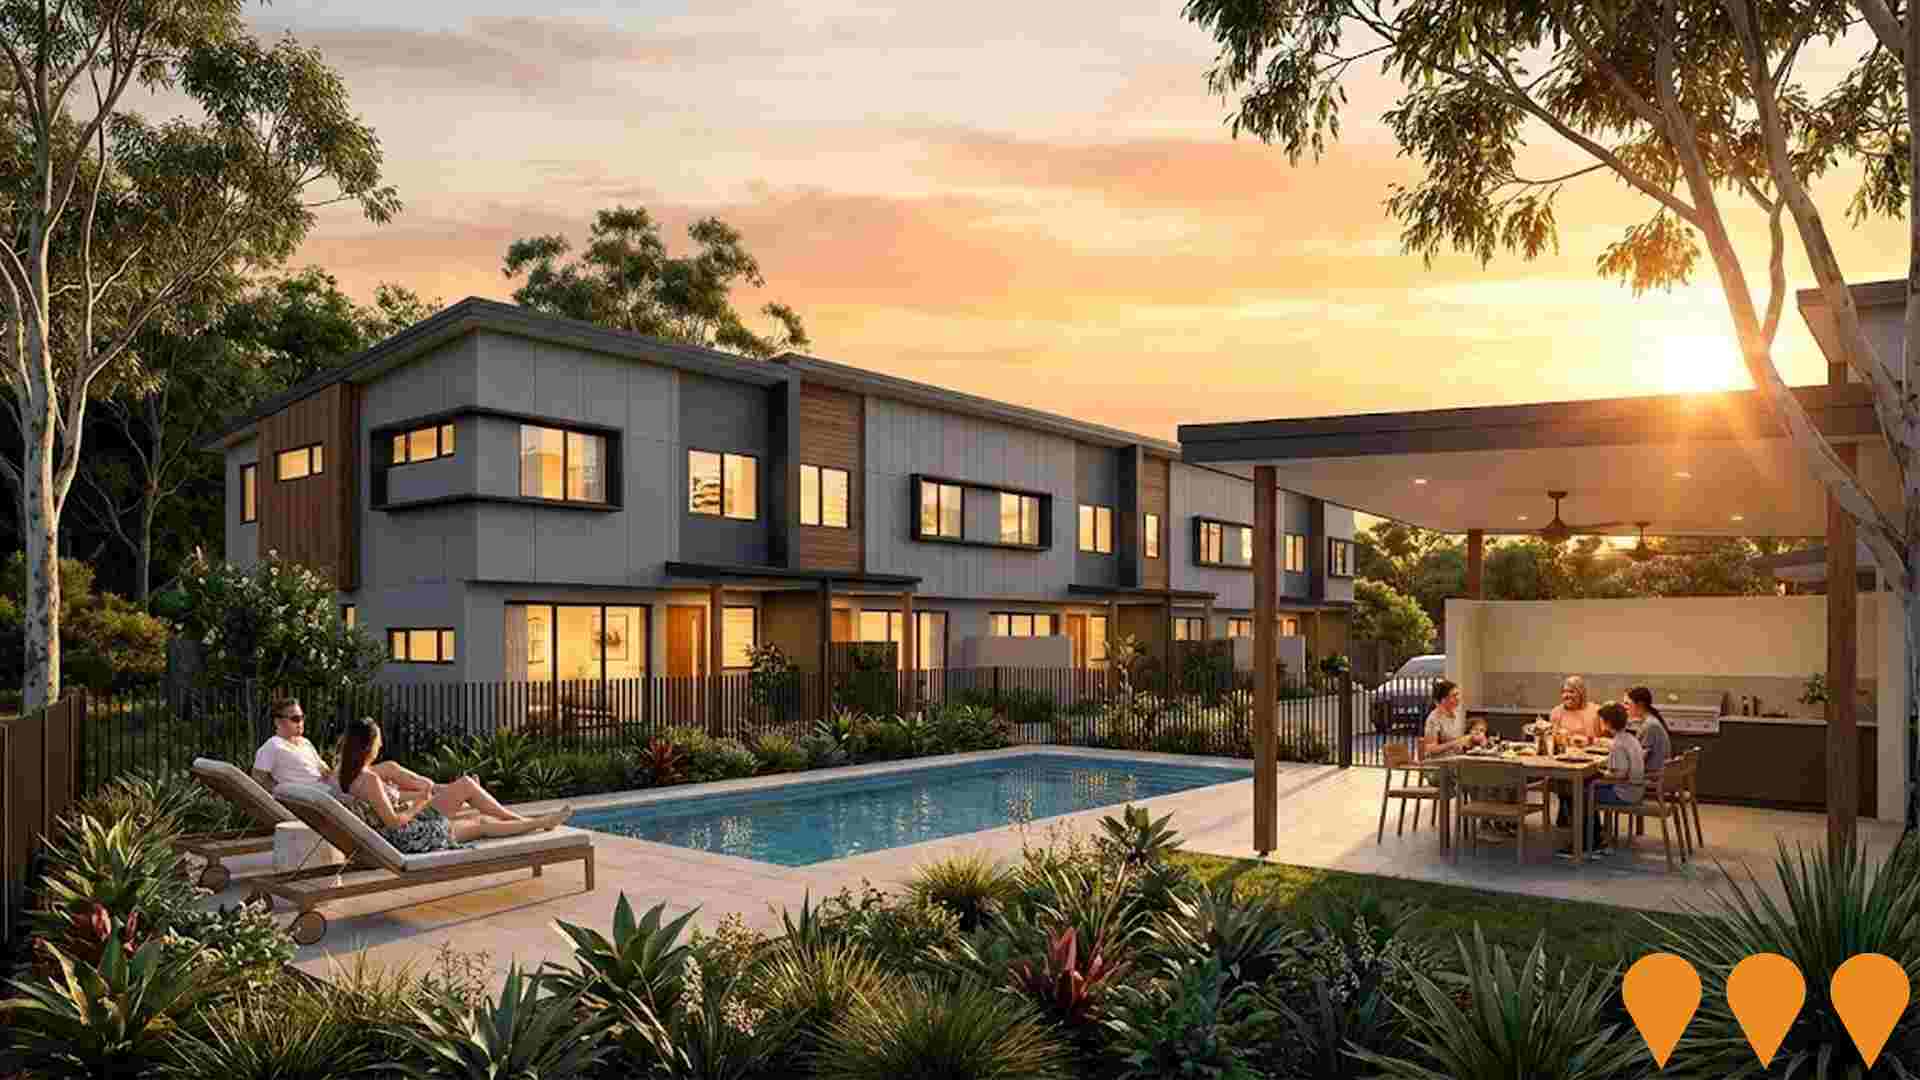
Arabella Townhomes
A master-planned development of 170 three and four-bedroom double-storey townhomes adjacent to protected bushland in Oxley, Brisbane. The residences feature a simple yet elegant design, with resort-style amenities for residents, including a swimming pool and residents lounge. The total project value is estimated at $52 million.
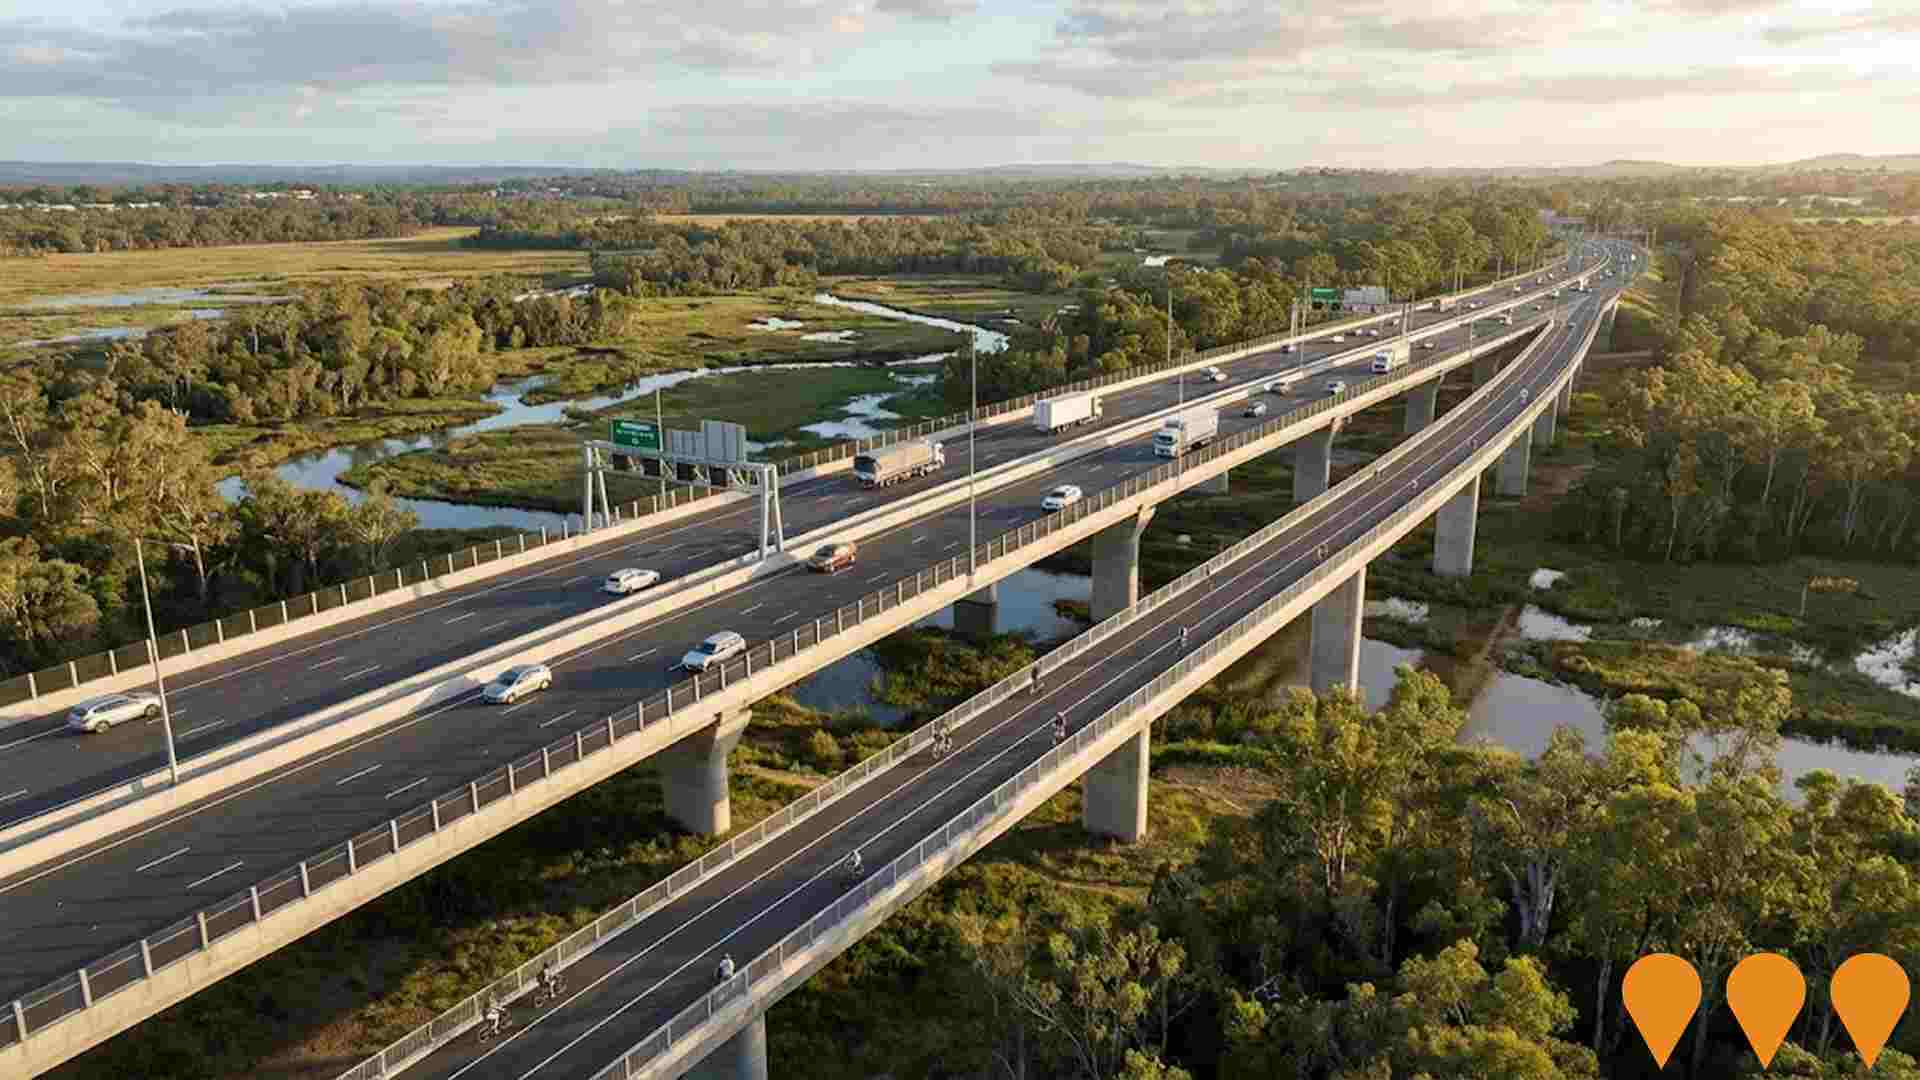
Ipswich Motorway Upgrade: Rocklea to Darra (Remaining Sections)
Planning for the remaining sections of the Ipswich Motorway upgrade between Rocklea and Darra (Stages 2 and 3). Stage 1 (Granard Road, Rocklea to east of Oxley Road Interchange; 3km widening to 6 lanes, higher bridges over Oxley Creek floodplain, upgraded intersections and shared paths) was completed in April 2021. Stage 2 upgrades the Oxley Road Interchange. Stage 3 covers the remaining motorway section from Oxley Road Interchange to the Centenary Motorway at Darra. The upgrades aim to improve safety, capacity, journey reliability, flood immunity and active transport connections. As of mid-2024, planning (including updated masterplan and business cases) is complete; no construction funding is committed as of November 2025.
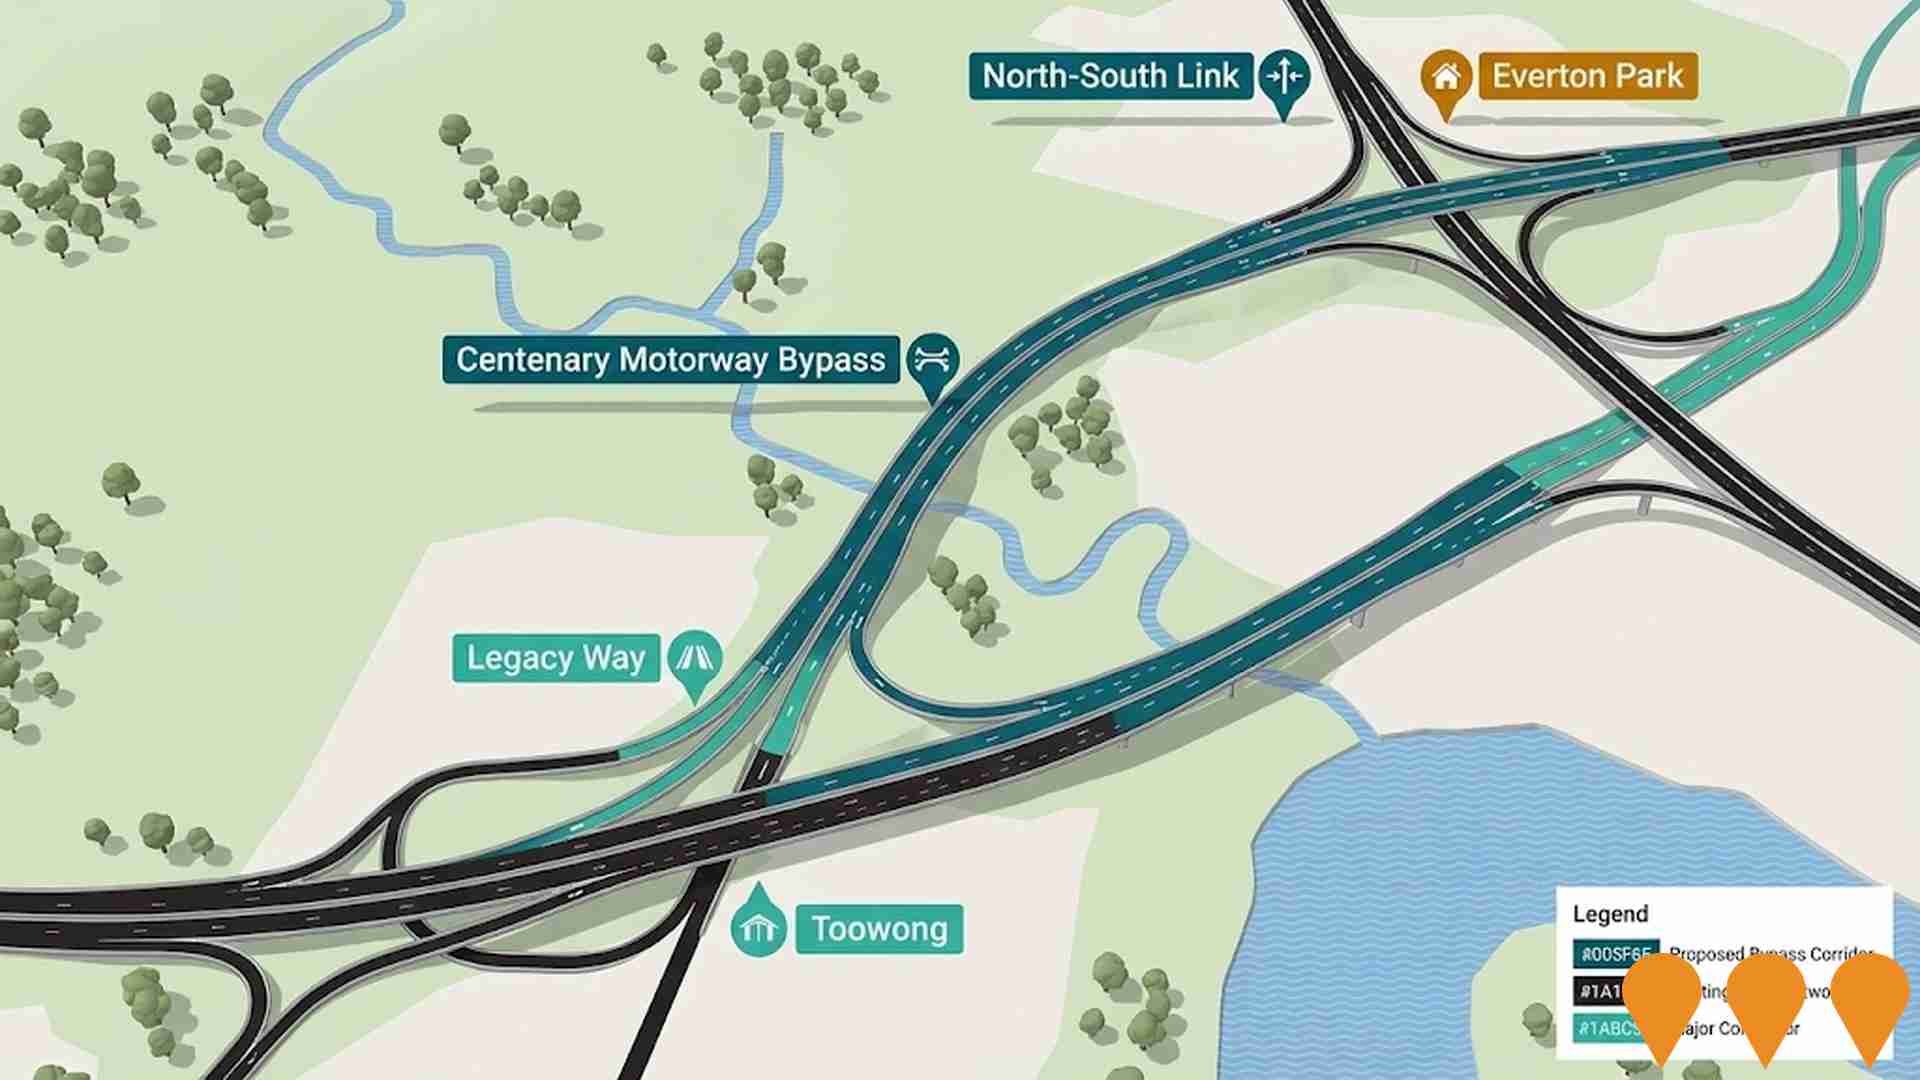
Centenary Motorway Bypass
Proposed major transport corridor linking Centenary Motorway to Legacy Way at Toowong and connecting to North-South Link at Everton Park. Part of Strategic Transport Road Map for SEQ.
Employment
Employment performance in Sherwood has been broadly consistent with national averages
Sherwood's workforce is highly educated with professional services well-represented. As of September 2025, its unemployment rate is 3.4%.
By this date, 3,914 residents are employed, with an unemployment rate 0.6% lower than Greater Brisbane's 4.0%. Workforce participation stands at 68.6%, slightly higher than Greater Brisbane's 64.5%. The dominant employment sectors include health care & social assistance, professional & technical services, and education & training. Sherwood specializes in professional & technical jobs, with an employment share 1.7 times the regional level.
Conversely, construction employs only 4.8% of local workers, below Greater Brisbane's 9.0%. The area offers limited local employment opportunities, as indicated by the Census working population count versus resident population. Between September 2024 and September 2025, Sherwood's labour force decreased by 3.6%, while employment declined by 2.8%, leading to a 0.8 percentage point drop in unemployment rate. In comparison, Greater Brisbane recorded employment growth of 3.8% and labour force growth of 3.3%, with unemployment falling by 0.5 percentage points. State-wide, Queensland's employment contracted by 0.01% (losing 1,210 jobs) as of 25-Nov-25, with an unemployment rate of 4.2%, closely aligned with the national rate of 4.3%. National employment forecasts from May-25 project a 6.6% increase over five years and 13.7% over ten years. Applying these projections to Sherwood's employment mix suggests local employment should grow by 7.1% over five years and 14.5% over ten years, though this is a simple extrapolation for illustrative purposes and does not account for localized population projections.
Frequently Asked Questions - Employment
Income
Income metrics indicate excellent economic conditions, with the area achieving higher performance than 75% of national locations assessed by AreaSearch
The Sherwood SA2 had a very high national income level according to AreaSearch's aggregation of the latest ATO data for the financial year ended June 30, 2022. The median income among taxpayers was $66,970, with an average income of $91,328. These figures were higher than those for Greater Brisbane, which had a median income of $55,645 and an average income of $70,520. Based on Wage Price Index growth from financial year 2022 to September 2025, estimated incomes would be approximately $76,339 (median) and $104,105 (average). Census data shows that household, family, and personal incomes in Sherwood all rank highly nationally, between the 70th and 83rd percentiles. Income brackets indicate that 28.8% of locals (2,039 people) fall into the $1,500 - 2,999 weekly category, similar to the metropolitan region where this cohort represents 33.3%. A substantial number of higher earners, 34.3%, exceed $3,000 weekly. High housing costs consume 15.3% of income, but strong earnings still place disposable income at the 72nd percentile nationally. The area's SEIFA income ranking places it in the 8th decile.
Frequently Asked Questions - Income
Housing
Sherwood displays a diverse mix of dwelling types, with above-average rates of outright home ownership
The dwelling structure in Sherwood, as assessed at the latest Census, consisted of 53.9% houses and 46.1% other dwellings (semi-detached, apartments, 'other' dwellings). In comparison, Brisbane metro had 48.9% houses and 51.1% other dwellings. Home ownership in Sherwood was at 29.8%, similar to Brisbane metro's level. The remaining dwellings were either mortgaged (33.8%) or rented (36.4%). The median monthly mortgage repayment in the area was $2,210, higher than Brisbane metro's average of $2,167. The median weekly rent figure in Sherwood was $395, compared to Brisbane metro's $410. Nationally, Sherwood's mortgage repayments were significantly higher than the Australian average of $1,863, while rents exceeded the national figure of $375.
Frequently Asked Questions - Housing
Household Composition
Sherwood features high concentrations of group households and lone person households, with a lower-than-average median household size
Family households constitute 65.6% of all households, including 30.6% couples with children, 25.1% couples without children, and 8.2% single parent families. Non-family households comprise the remaining 34.4%, with lone person households at 30.6% and group households making up 4.1%. The median household size is 2.4 people, which is smaller than the Greater Brisbane average of 2.5.
Frequently Asked Questions - Households
Local Schools & Education
Educational achievement in Sherwood places it within the top 10% nationally, reflecting strong academic performance and high qualification levels across the community
In Sherwood, educational attainment is notably high, with 50.8% of residents aged 15 years and above holding university qualifications. This figure exceeds the Queensland state average of 25.7% and the Australian national average of 30.4%. The area's strong educational advantage is reflected in its Bachelor degree holders, who comprise 32.3% of the population aged 15 years and above. Postgraduate qualifications are held by 13.9%, while graduate diplomas account for 4.6%.
Vocational pathways make up 21.5% of qualifications among residents aged 15 years and above, with advanced diplomas at 9.6% and certificates at 11.9%. Educational participation is particularly high in Sherwood, with 31.8% of residents currently enrolled in formal education. This includes 9.0% in primary education, 9.0% in tertiary education, and 8.9% pursuing secondary education.
Frequently Asked Questions - Education
Schools Detail
Nearby Services & Amenities
Transport
Transport servicing is high compared to other areas nationally based on assessment of service frequency, route connectivity and accessibility
Transport analysis indicates 22 active transport stops operating within Sherwood. These comprise a mix of train and bus services. There are 76 individual routes servicing these stops, collectively offering 3,329 weekly passenger trips.
Transport accessibility is rated as good, with residents typically located 213 meters from the nearest stop. Service frequency averages 475 trips per day across all routes, equating to approximately 151 weekly trips per individual stop.
Frequently Asked Questions - Transport
Transport Stops Detail
Health
Sherwood's residents are extremely healthy with both young and old age cohorts seeing low prevalence of common health conditions
Analysis of health metrics shows strong performance throughout Sherwood. Both young and old age cohorts have low prevalence of common health conditions.
The rate of private health cover is exceptionally high at approximately 67% of the total population (4,750 people), compared to the national average of 55.3%. The most common medical conditions in the area are mental health issues and asthma, impacting 8.3 and 7.4% of residents respectively. Seventy-two point nine percent of residents declare themselves completely clear of medical ailments, compared to 74.7% across Greater Brisbane. Eighteen point zero percent of residents are aged 65 and over (1,276 people), which is higher than the 14.4% in Greater Brisbane. Health outcomes among seniors are particularly strong, broadly in line with the general population's health profile.
Frequently Asked Questions - Health
Cultural Diversity
The level of cultural diversity witnessed in Sherwood was found to be slightly above average when compared nationally for a number of language and cultural background related metrics
Sherwood's cultural diversity was notable, with 14.9% speaking a language other than English at home and 26.5% born overseas. Christianity was the predominant religion at 47.5%. Judaism, however, was more prevalent in Sherwood at 0.3%, compared to Greater Brisbane's 0.3%.
For ancestry, the top groups were English (27.5%), Australian (22.1%), and Irish (11.1%). Some ethnic groups showed higher representation: Scottish (9.9% vs regional 8.7%), Russian (0.6% vs 0.5%), and Welsh (0.7% vs 0.6%).
Frequently Asked Questions - Diversity
Age
Sherwood's population is slightly younger than the national pattern
Sherwood's median age is 38, which is slightly higher than Greater Brisbane's figure of 36 but equal to Australia's median age of 38. The age group of 75-84 years shows strong representation in Sherwood at 7.6%, compared to Greater Brisbane, while the 25-34 cohort is less prevalent at 12.8%. Between 2021 and now, the 75-84 age group has grown from 5.2% to 7.6% of Sherwood's population. Conversely, the 25-34 cohort has declined from 13.8% to 12.8%. By 2041, demographic projections indicate significant shifts in Sherwood's age structure. The 75-84 group is expected to grow by 73%, adding 393 people and reaching a total of 932 from the previous figure of 538. This growth reflects an aging population trend, with those aged 65 and above comprising 72% of projected growth. Meanwhile, the 15-24 and 0-4 age cohorts are projected to experience population declines.
