Chart Color Schemes
This analysis uses ABS Statistical Areas Level 2 (SA2) boundaries, which can materially differ from Suburbs and Localities (SAL) even when sharing similar names.
SA2 boundaries are defined by the Australian Bureau of Statistics and are designed to represent communities for statistical reporting (e.g., census and ERP).
Suburbs and Localities (SAL) represent commonly-used suburb/locality names (postal-style areas) and may use different geographic boundaries. For comprehensive analysis, consider reviewing both boundary types if available.
est. as @ -- *
ABS ERP | -- people | --
2021 Census | -- people







Curious about local property values? Filter the chart to assess the volume and appreciation (including resales) trends and regional comparisons, or scroll to the map below view this information at an individual property level.


Find a Recent Sale

Sales Detail
Aurukun has an estimated 1,066 residents, down from 1,101 at the 2021 Census — a change of 35 people, or 3.2%. The population has thinned by an average 2.0% a year over five years, slower than 99% of areas nationally. Fewer than ten people live on each square kilometre, across a boundary that takes in surrounding rural land. Population is estimated from ABS Estimated Resident Population releases and GNAF address data, re-based from the 2021 Census and updated annually.
Detail
Based on AreaSearch's analysis, Aurukun's population is around 1,066 as of Nov 25. This reflects a decrease of 35 people (3.2%) since the 2021 Census, which reported a population of 1,101 people. The change is inferred from the estimated resident population of 1,163 from the ABS as of June 2024 and address validation since the Census date. This level of population equates to a density ratio of 0.10 persons per square kilometer, a level providing ample space per person. Population growth for the area was primarily driven by natural growth that contributed approximately 93.8% of overall population gains during recent periods.
AreaSearch is adopting ABS/Geoscience Australia projections for each SA2 area, as released in 2024 with 2022 as the base year. For any SA2 areas not covered by this data, and for years post-2032, Queensland State Government's SA2 area projections, released in 2023 and based on 2021 data, are adopted. It should be noted that these state projections do not provide age category splits; hence where utilised, AreaSearch is applying proportional growth weightings in line with the ABS Greater Capital Region projections (released in 2023, based on 2022 data) for each age cohort. Looking at population projections moving forward, a population increase just below the median of national non-metropolitan areas is expected, with the area expected to grow by 135 persons to 2041 based on the latest population numbers, reflecting an increase of 21.8% in total over the 17 years.
Frequently Asked Questions - Population
35 new dwellings have been approved in Aurukun over the past five years, an average of 7 a year. That is 5.8 approvals per 1,000 residents. Few approvals have been recorded in the most recent months, well below the longer-run average; the latest ABS periods are still being reported. Figures come from ABS building approvals aggregated to this SA2 boundary and are updated monthly as the ABS releases them.
Detail
Aurukun has seen around 7 new homes approved annually, totalling 35 homes over the past 5 financial years. So far in FY-26, 0 approvals have been recorded. Given population has fallen over the past period, development activity has been adequate in relative terms, a positive for buyers, while new properties are constructed at an average value of $255,000—below the regional average—suggesting more affordable housing options for buyers. Relative to Rest of Qld, Aurukun has 86.0% more new home approvals (per person). creating greater choice for buyers. Recent construction comprises 75.0% standalone homes and 25.0% medium and high-density housing, preserving the area's low density nature with an emphasis on detached housing attracting space-seeking buyers.
This represents a notable shift from the area's existing housing (currently 94.0% houses), indicating decreasing availability of developable sites and reflecting changing lifestyles and the need for more diverse, affordable housing options. Population forecasts indicate Aurukun will gain 232 residents through to 2041. With current construction levels, housing supply should adequately meet demand, creating favourable conditions for buyers while potentially enabling growth that exceeds current forecasts.
Frequently Asked Questions - Development
Development applications around Aurukun
Loading development applications…
| Lodged | Address | Description | Type | Distance | Status |
|---|
SOURCE: Planning portals and council registers, compiled by AreaSearch. Distance & bearing measured from the suburb midpoint.
AreaSearch tracks 42 current infrastructure and development projects close to Aurukun, worth an estimated $1.06 billion. 13 are already under construction and 11 are due for completion within three years. The pipeline spans residential development, tourism and transport & logistics. Records are compiled from Infrastructure Australia, state agencies, council planning portals and public announcements, reviewed and updated daily, then ranked by proximity, construction stage, completion horizon and project scale.
Detail
Nothing can influence an area's performance as much as changes to local infrastructure, major projects and planning initiatives. In total 0 projects have been identified by AreaSearch that are likely to have an impact on the area. Key projects include Queensland National Land Transport Network Maintenance, Queensland Energy and Jobs Plan SuperGrid, Queensland Energy and Jobs Plan, and Queensland Energy and Jobs Plan, with the below list detailing those likely to be of most relevance. Aurukun has emerging levels of nearby infrastructure activity, ranking in the 33rdth percentile nationally
Professional plan users can use the search below to filter and access additional projects.
INFRASTRUCTURE SEARCH
 Denotes AI-based impression for illustrative purposes only, not to be taken as definitive under any circumstances. Please follow links and conduct other investigations from the project's source for actual imagery. Developers and project owners wishing us to use original imagery please Contact Us and we will do so.
Frequently Asked Questions - Infrastructure
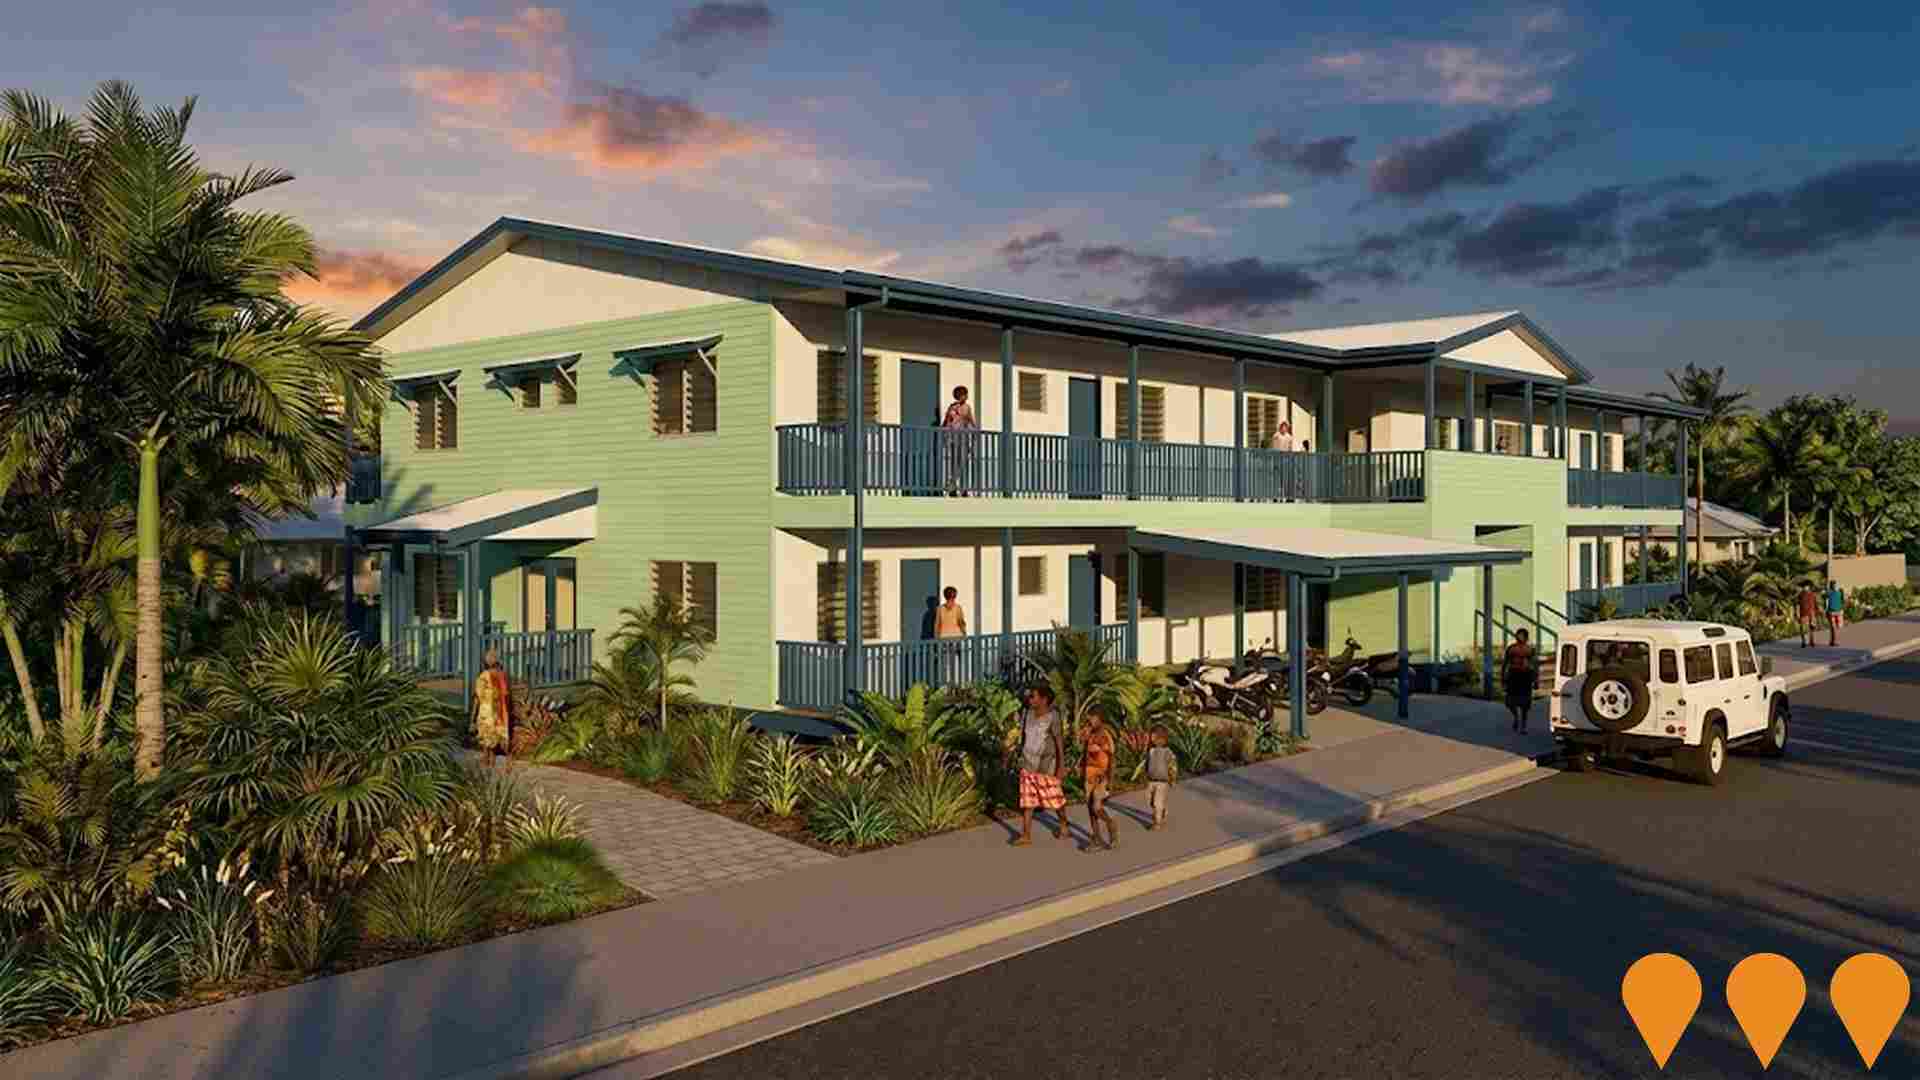
Victoria Parade Units
A three storey community housing complex on Thursday Island providing 16 two bedroom units on a single 2,783 m2 site for Queensland Government staff and community housing tenants. The project was delivered by Hutchinson Builders for the Queensland Department of Housing and Public Works, with a strong focus on Indigenous employment and local procurement, and was completed in 2016.
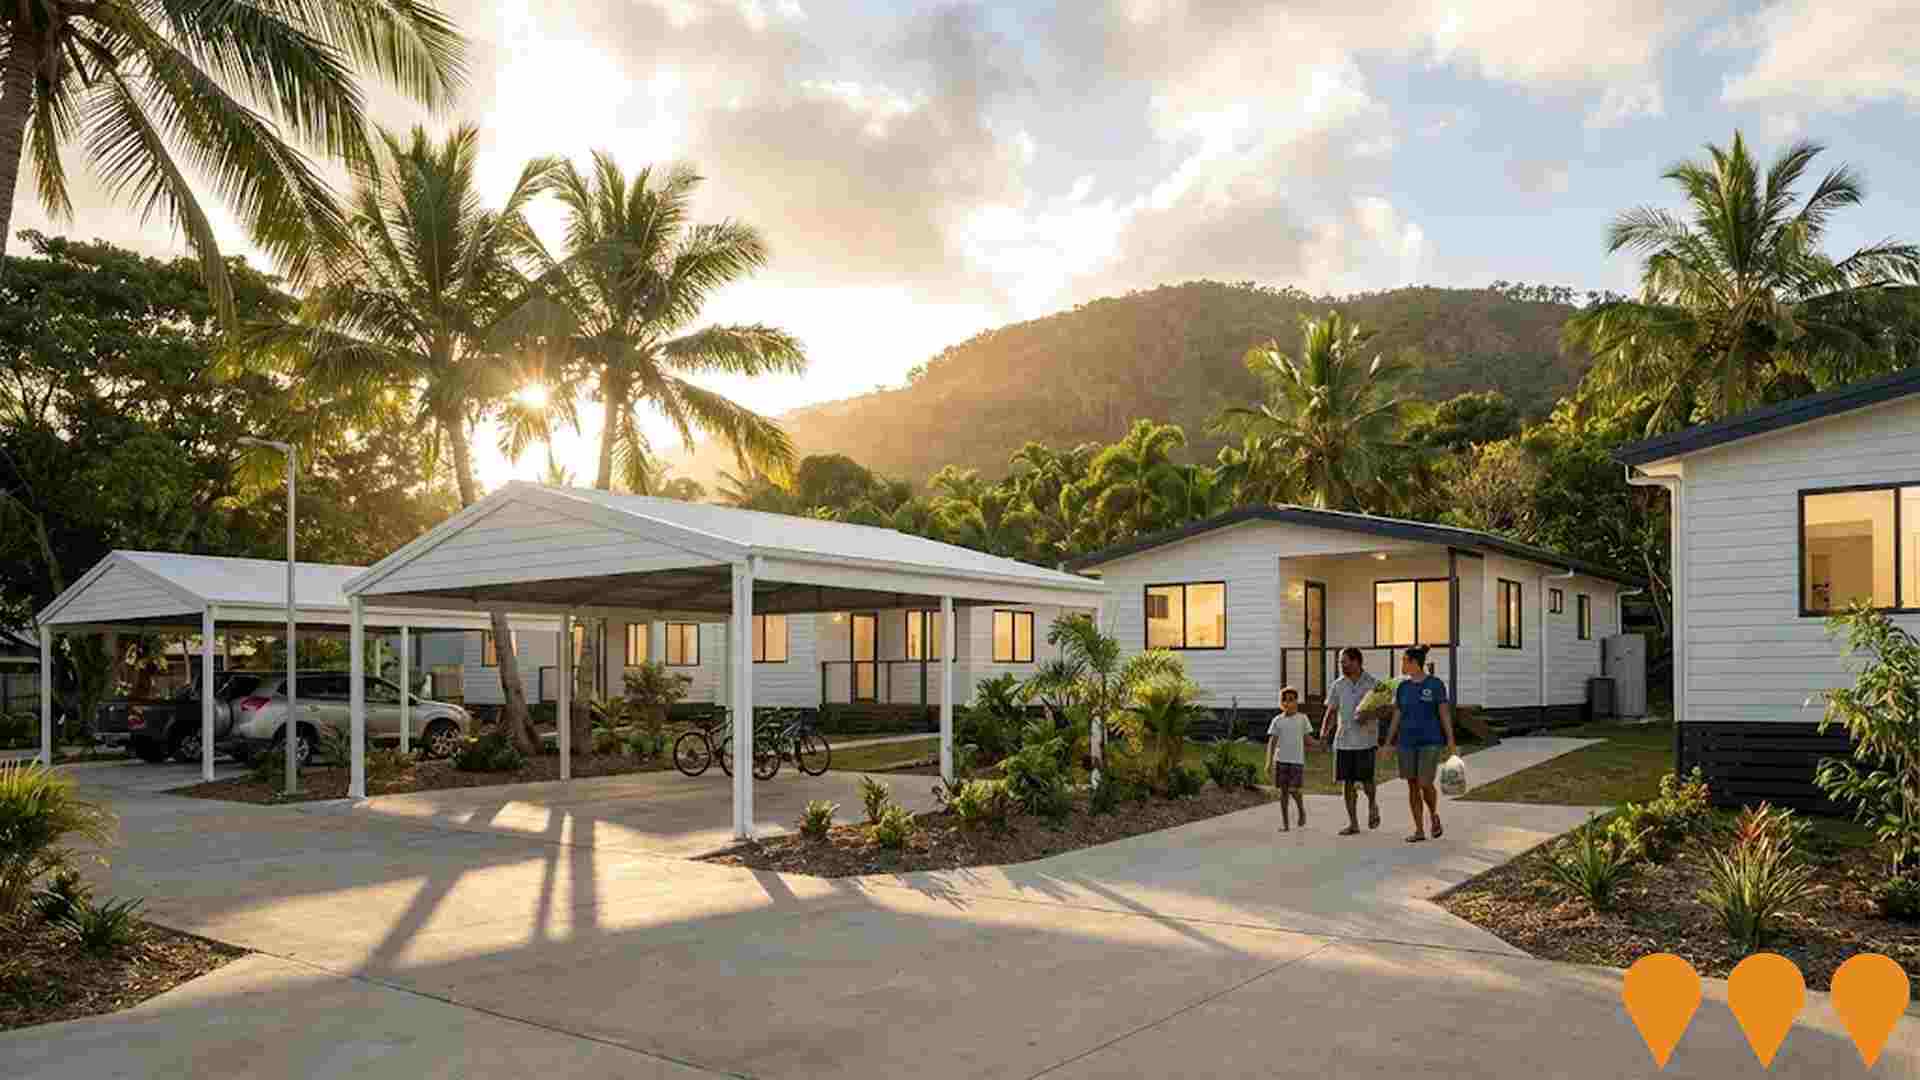
Thursday Island Affordable Modular Homes
A partnership between the Queensland Government Housing Investment Fund, the Uniting Church in Australia Property Trust and modular builder Oly Homes has delivered eight affordable modular homes on Thursday Island. The project, located on church land at 6 Chester Street and 142 Douglas Street, includes a mix of one and two bedroom homes, studio units and accessible units designed for the local climate and cultural needs. The homes were factory built on the mainland, transported to Thursday Island and installed in around eight months, with tenants moving in from early 2025.
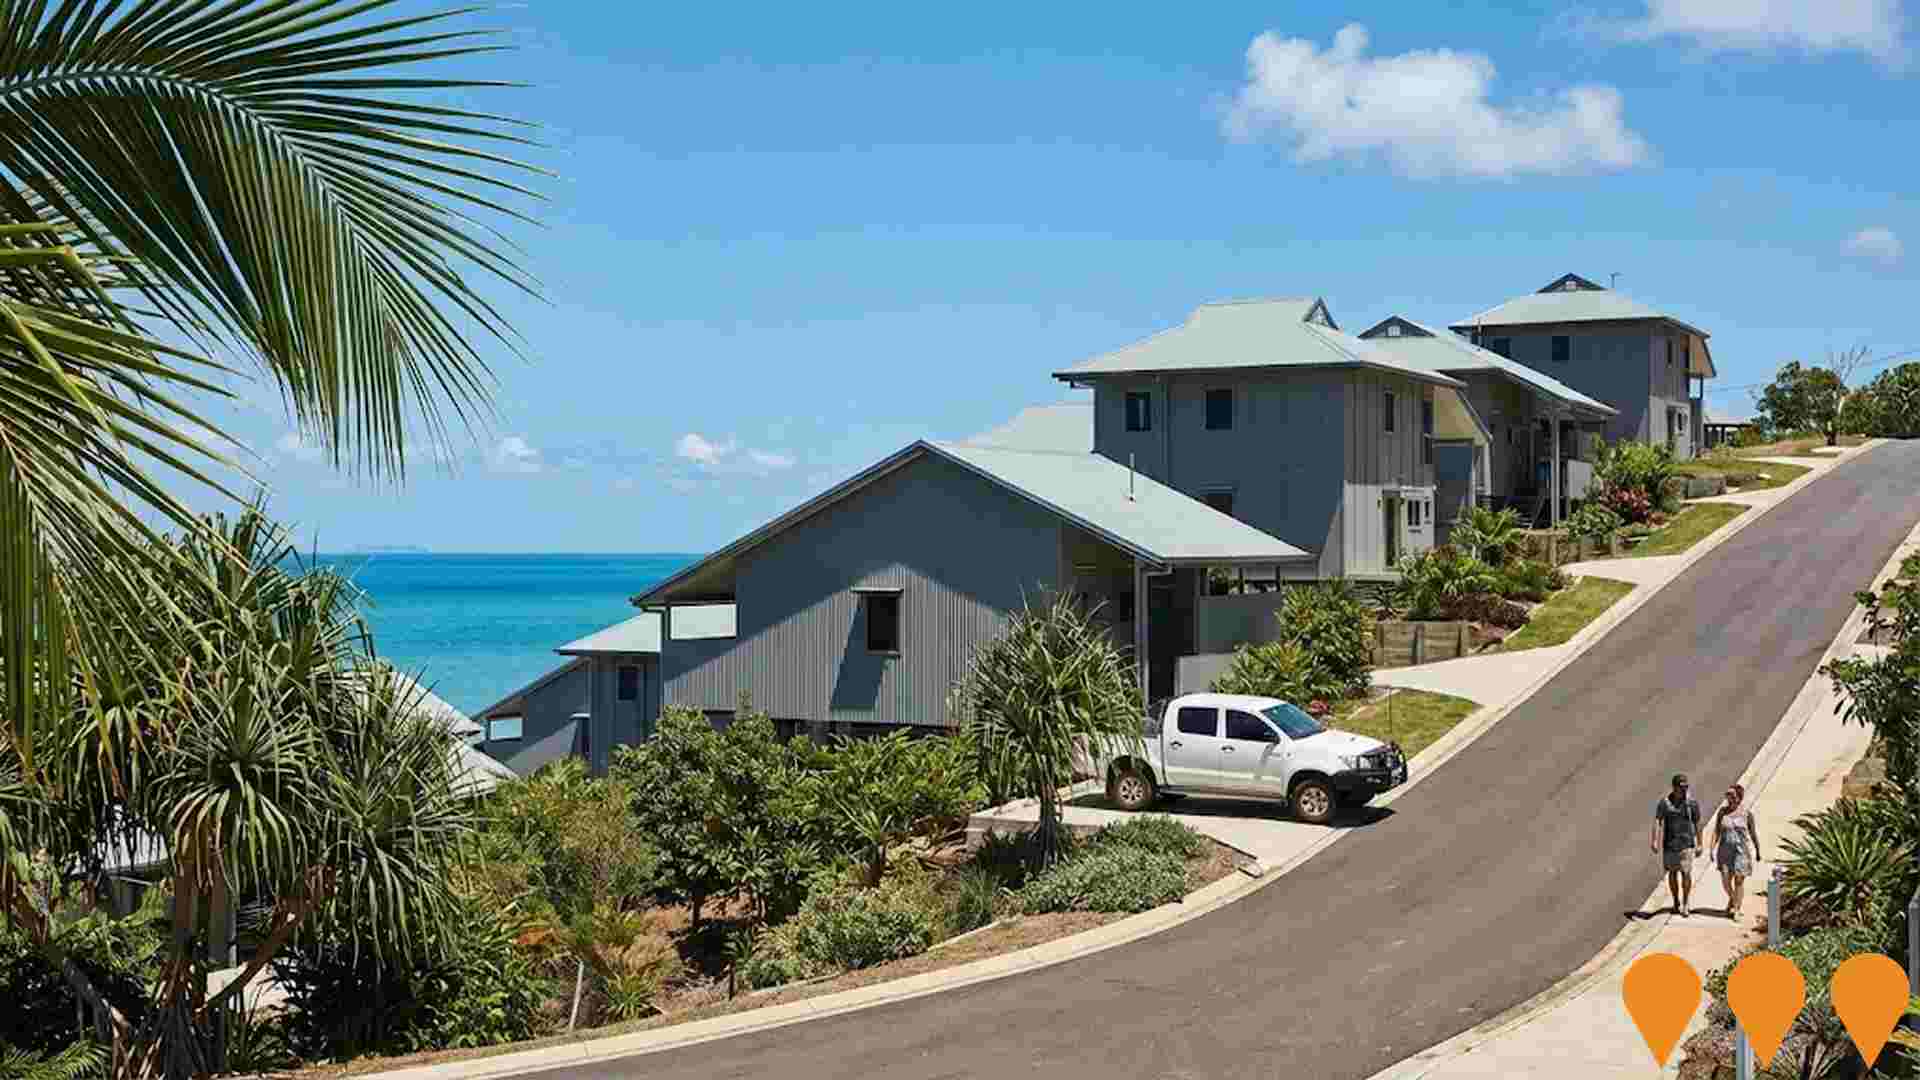
Saila Terrace Townhouses
Masterplanned 20 townhouse development on Waiben (Thursday Island) commissioned by the Torres Strait Regional Authority, with climate responsive house types that follow the steep topography, maximise ocean views, and use robust materials and roof forms suited to remote tropical construction and severe weather.
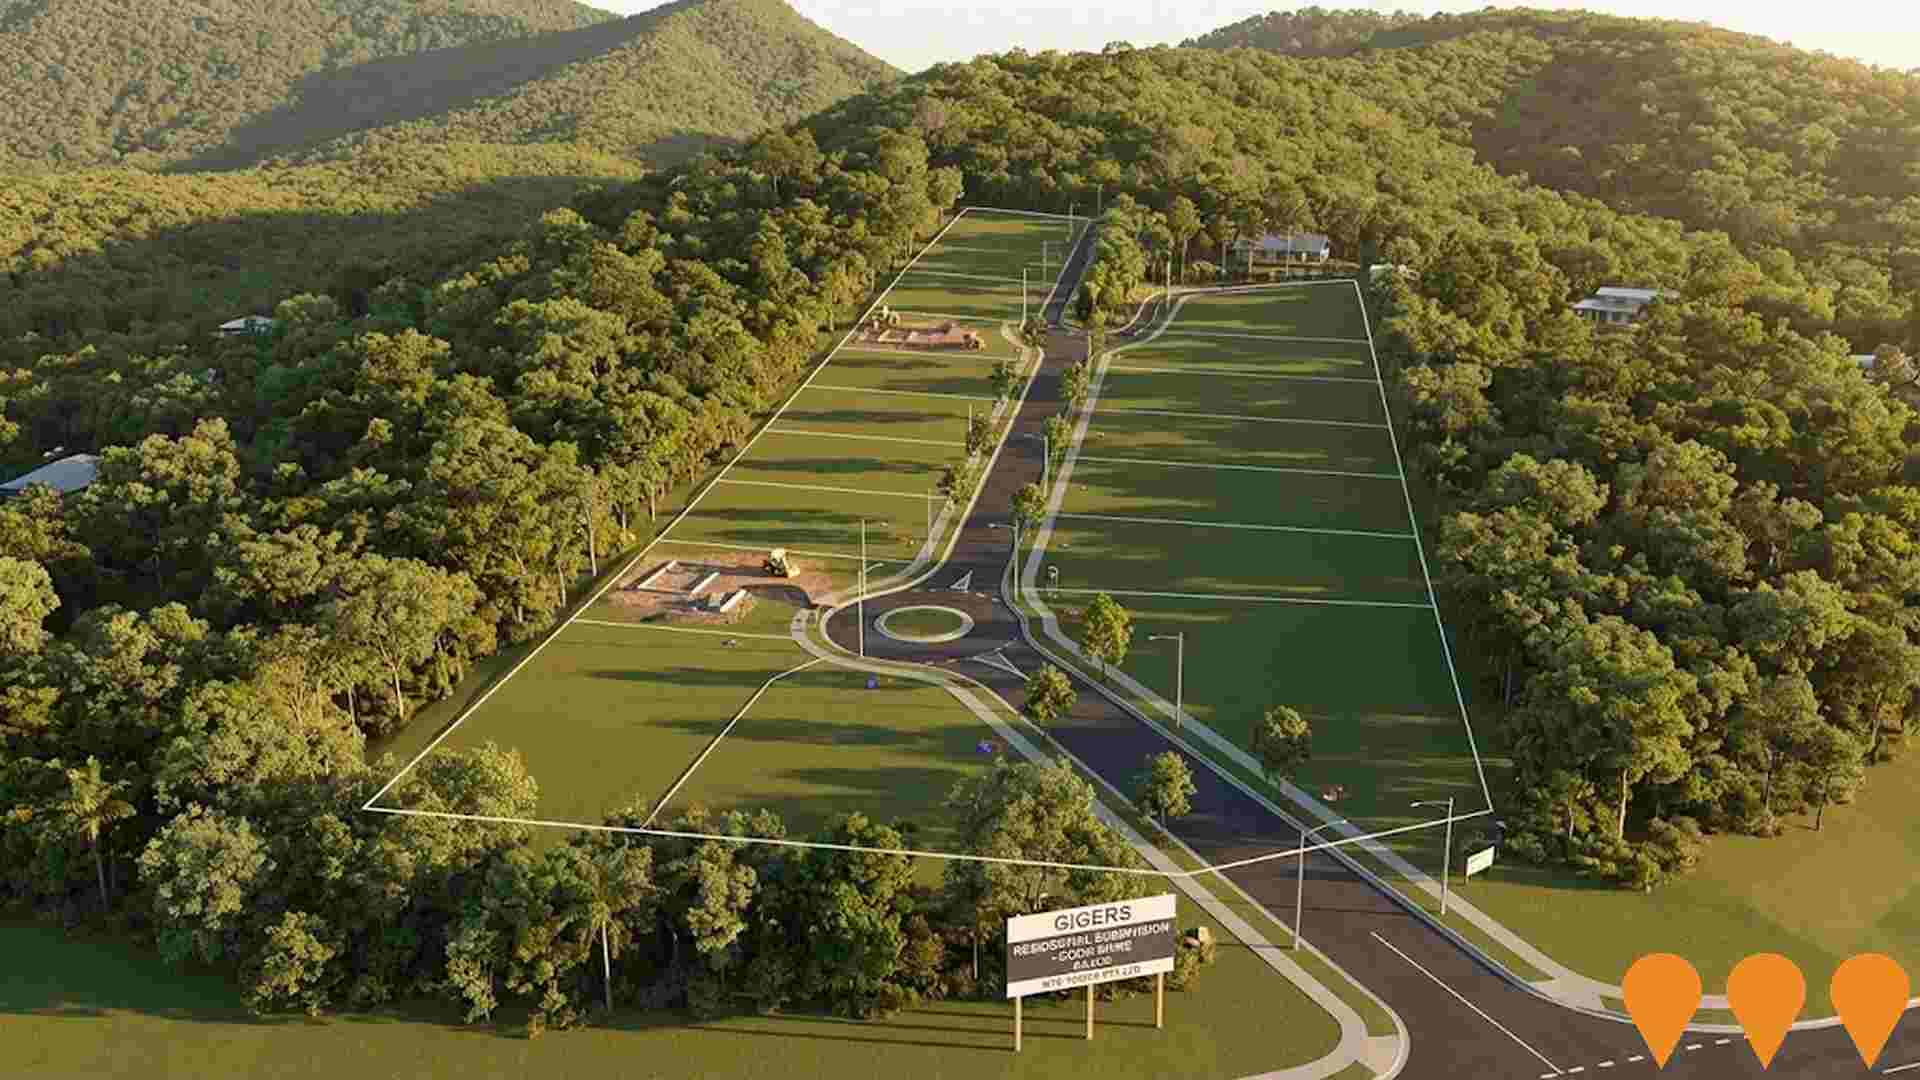
Gigers Residential Subdivision
Greenfield residential subdivision at 2 Hope Street, Cooktown, reconfiguring one lot into 12 residential lots under Cook Shire DA/4310 with operational works approval DA/4590. Currently under construction as an elevated cul-de-sac offering lots from 902sqm to 1,756sqm. Supported by the Queensland Government's $1.1 million Residential Activation Fund to deliver trunk infrastructure including water, sewer, underground power, and NBN.
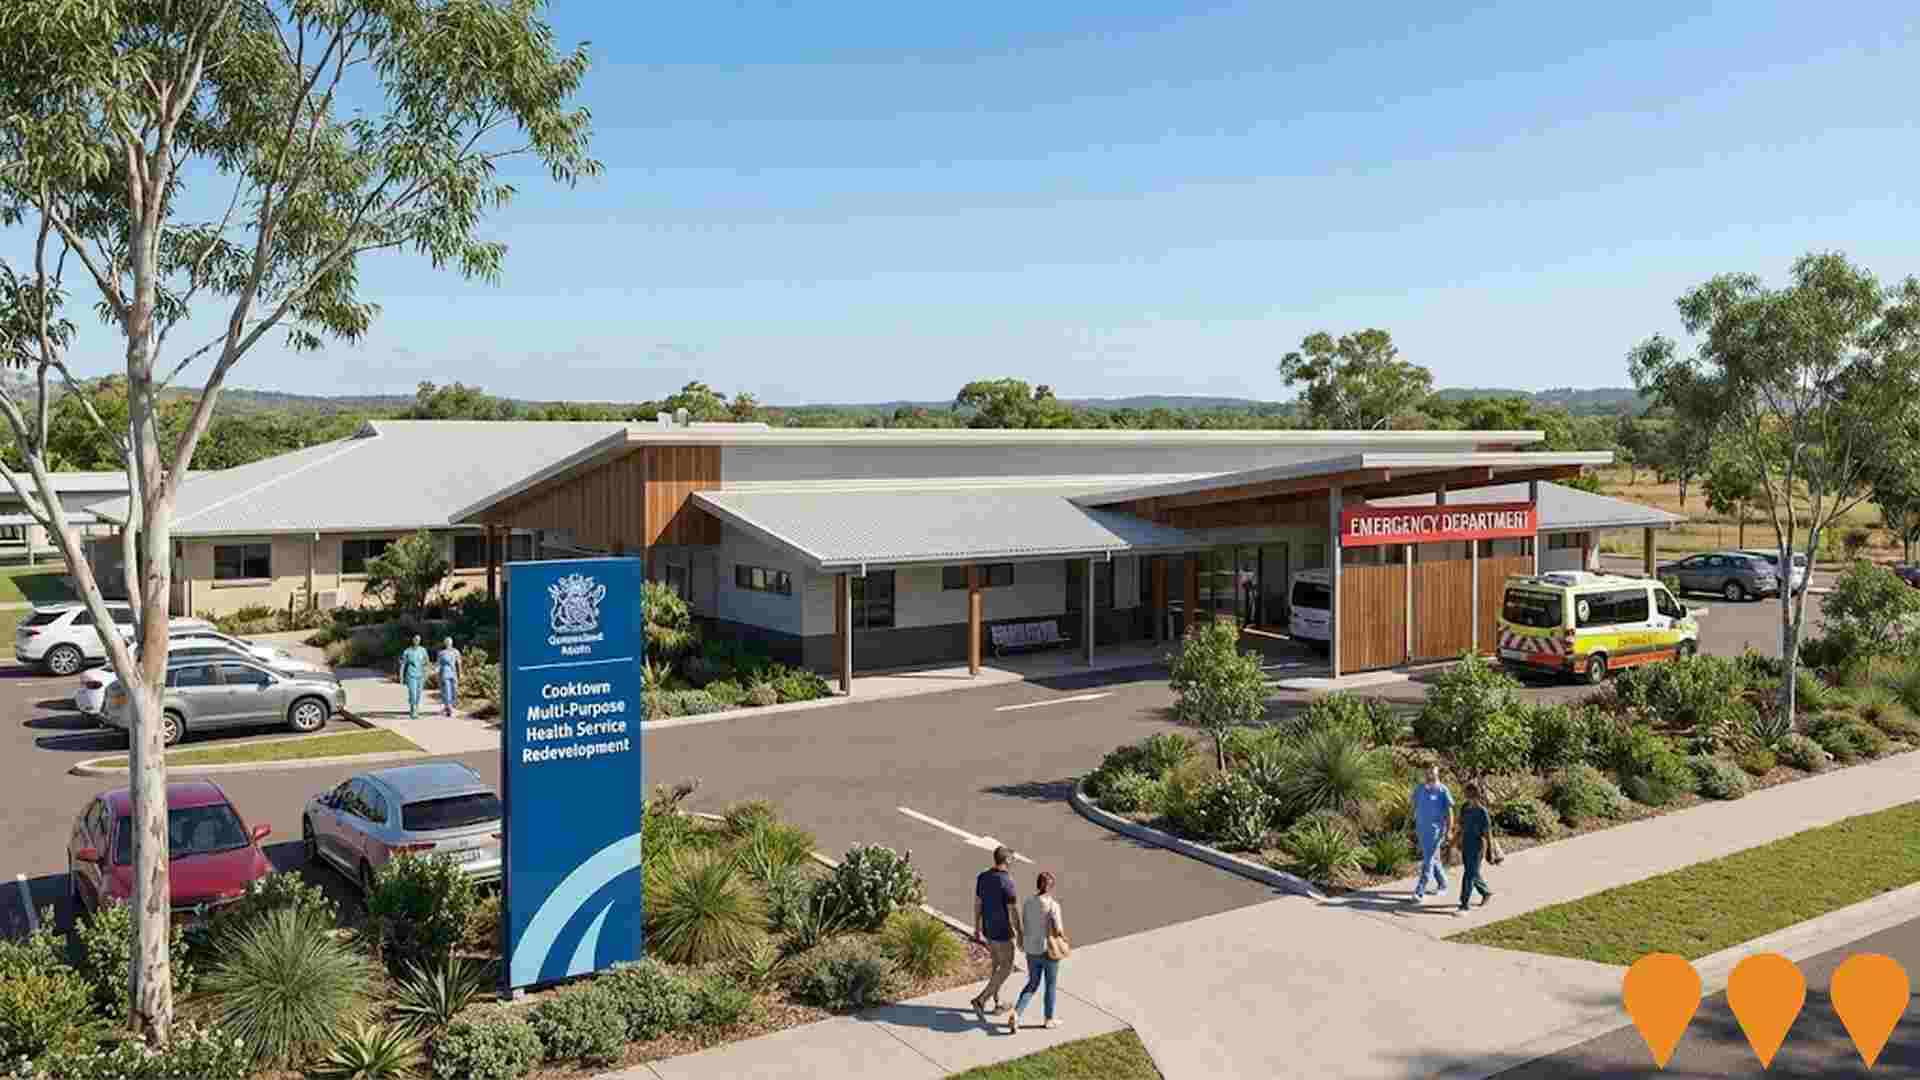
Cooktown Multi-Purpose Health Service Redevelopment
The Cooktown Multi-Purpose Health Service (MPHS) Redevelopment is a $200 million regional hospital transformation delivered by Health Infrastructure Queensland for Torres and Cape Hospital and Health Service. The project expands bed capacity from 16 to 24, adds a modern emergency department, birthing suite, operating theatre, and outpatient specialist facilities to replace aging infrastructure. Enabling works tenders and detailed architectural design are progressing ahead of major construction.
Daintree Ferry Landside Infrastructure and Ferry Replacement Projects
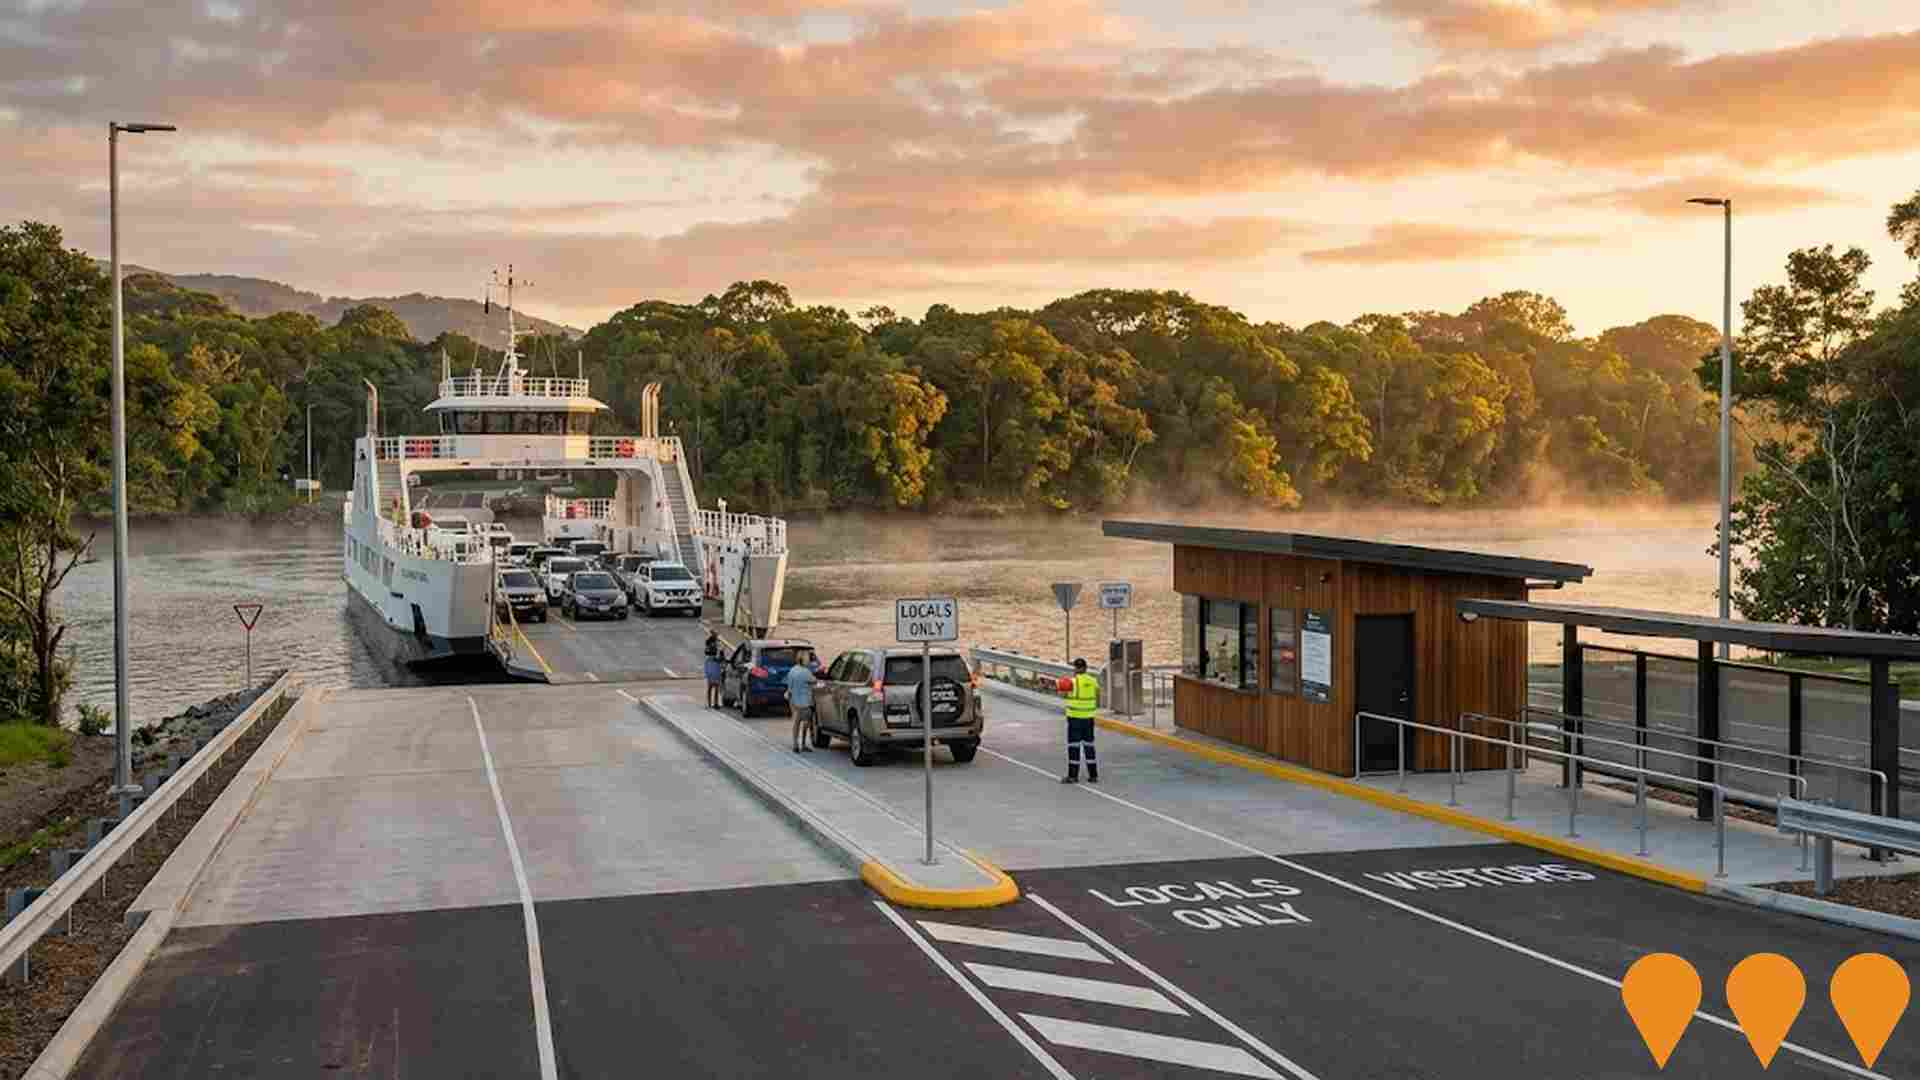
Douglas Shire Council is delivering landside road and ramp upgrades on both sides of the Daintree River together with a new four-lane Daintree River ferry. The landside works, delivered by Durack Civil, include upgraded approach roads, additional lanes, improved queuing areas, priority lanes for residents and cardholders, relocated ticketing, dual-loading ramps and traffic safety improvements. Birdon is designing, building, operating and maintaining the new ferry, which is planned to replace the current vessel and improve capacity, reliability and travel times for residents, tourism operators, businesses and essential services.Major roadworks commenced in May 2026, stage one is targeted for November 2026, marine civil works are planned from July 2027, and the new ferry is scheduled for delivery and commissioning in December 2027.
Cow Bay Primary Health Centre
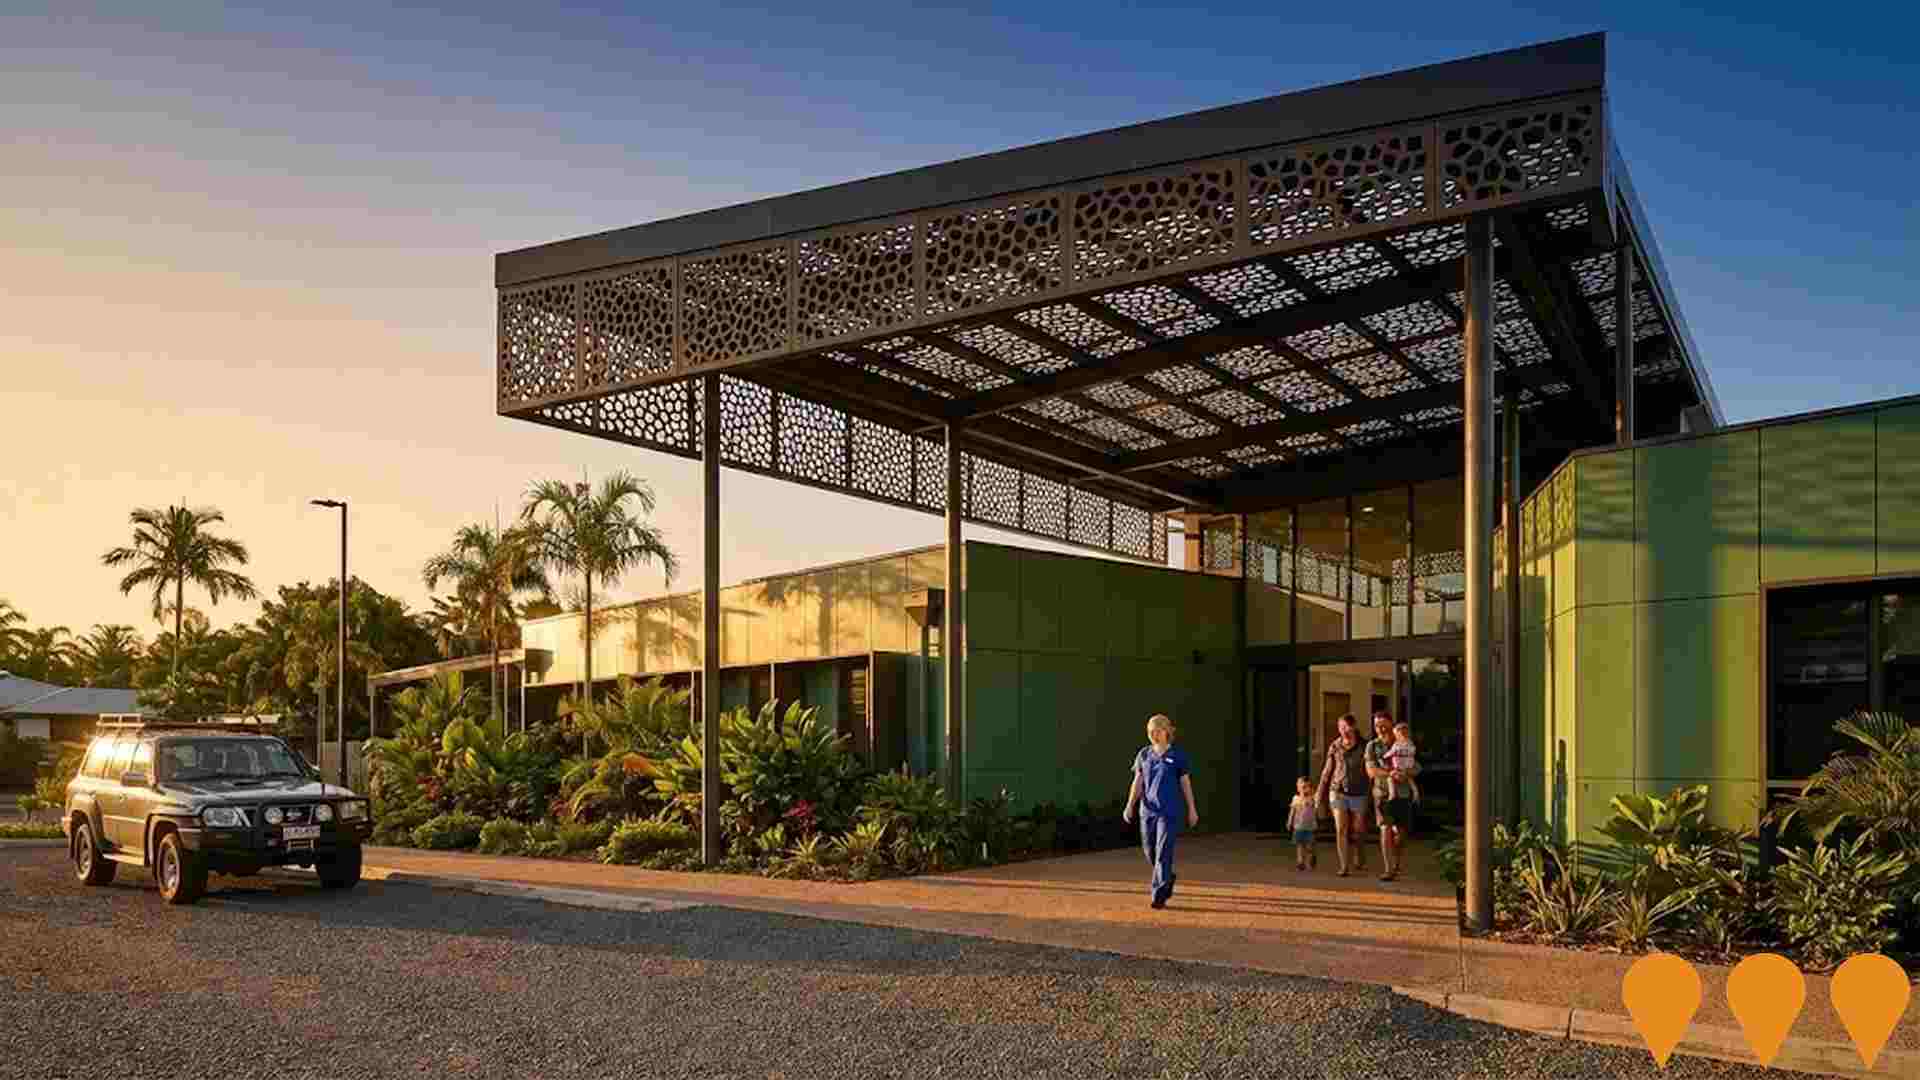
$14.8 million primary health centre serving remote Daintree communities with essential healthcare services and emergency capabilities.
Mossman River Intake (Alternate Water Intake Project)
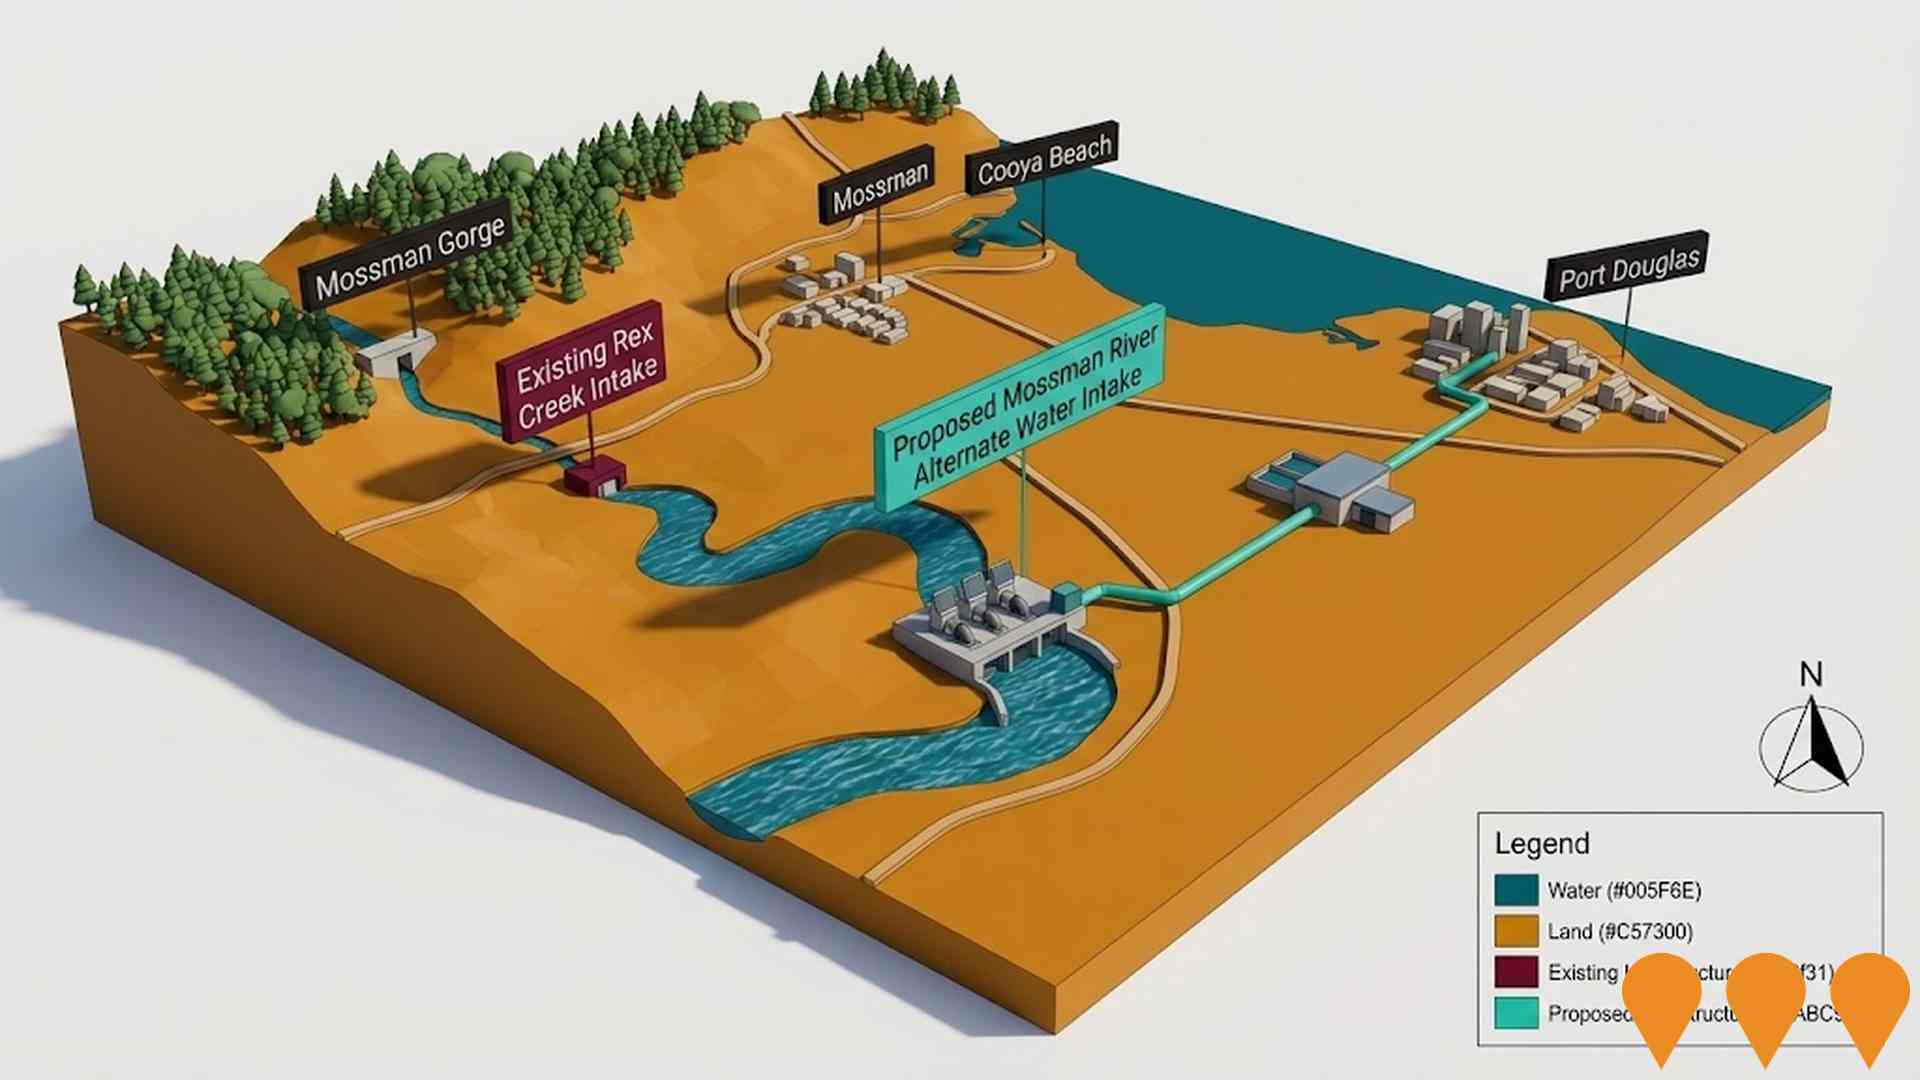
Development of a second water intake on the Mossman River, approximately 5 km downstream of the Mossman Gorge Visitors Centre, to improve water security and resilience for the Mossman-Port Douglas catchment. The intake will use a submerged gallery system to extract raw water and pump it to the existing Mossman Water Treatment Plant, supplementing the Rex Creek intake which currently serves around 7,000 people across Port Douglas, Craiglie and Mossman. The project is co-funded through the National Water Grid Fund's WISER initiative, with the Australian and Queensland governments contributing $10 million of the $16.4 million construction cost.Development approval was granted in October 2023, preliminary design and all approvals are complete, and a pre-RFT briefing was held in July 2025. Council intends to issue a Request for Tender in August 2025, award the design and construction contract in January 2026, and complete construction by June 2027.
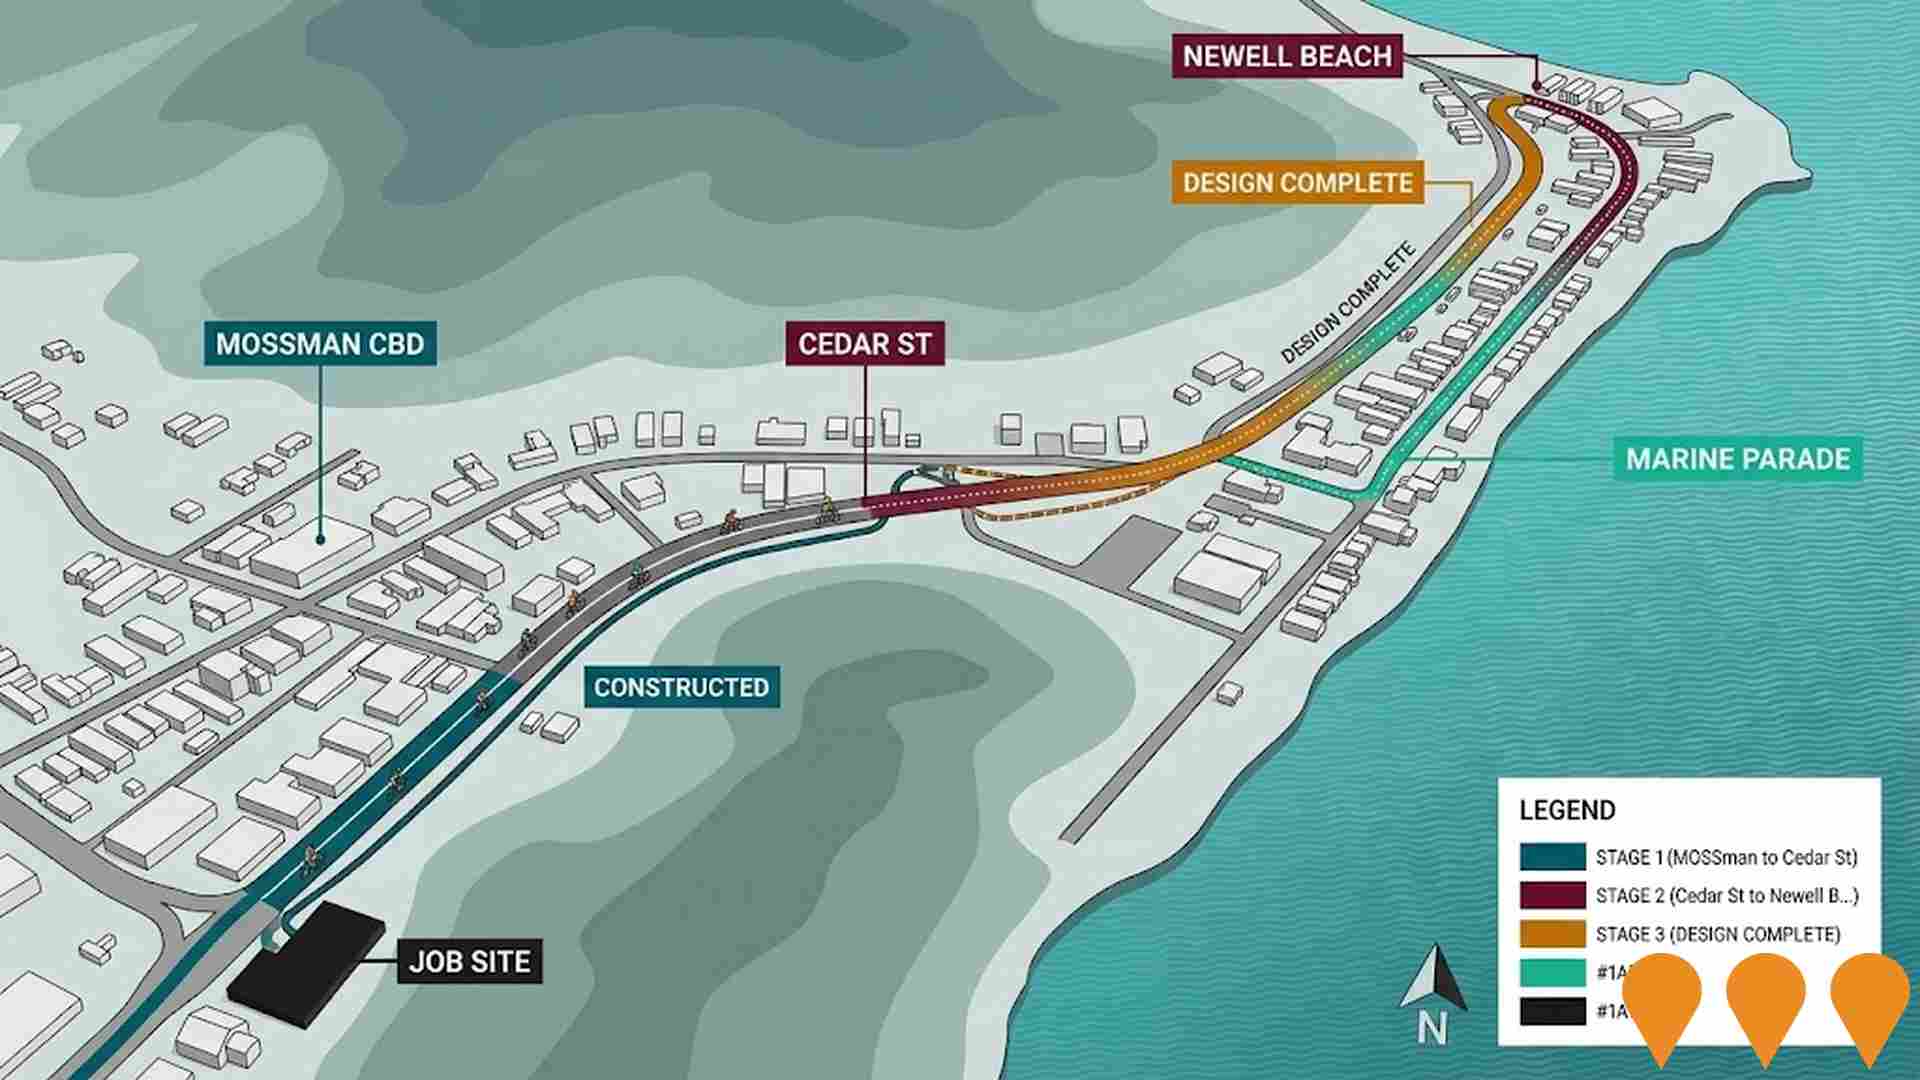

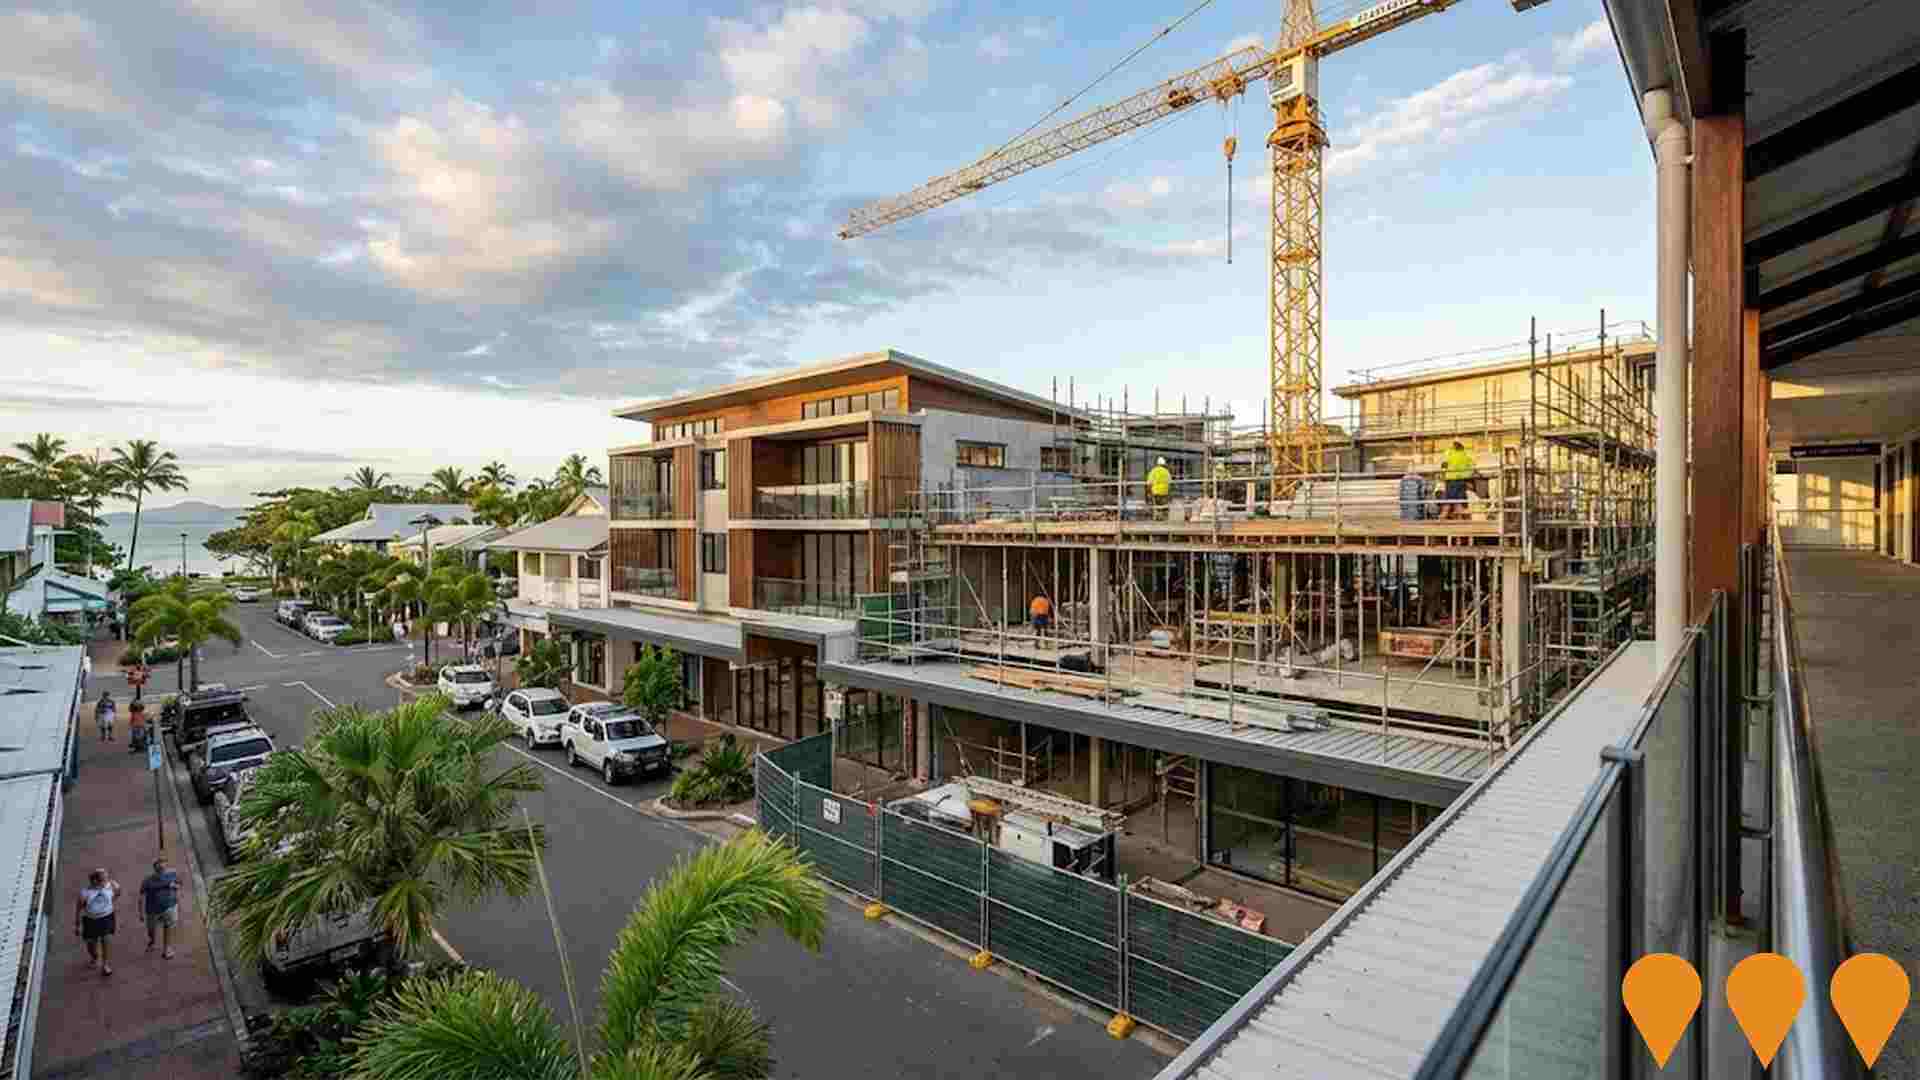
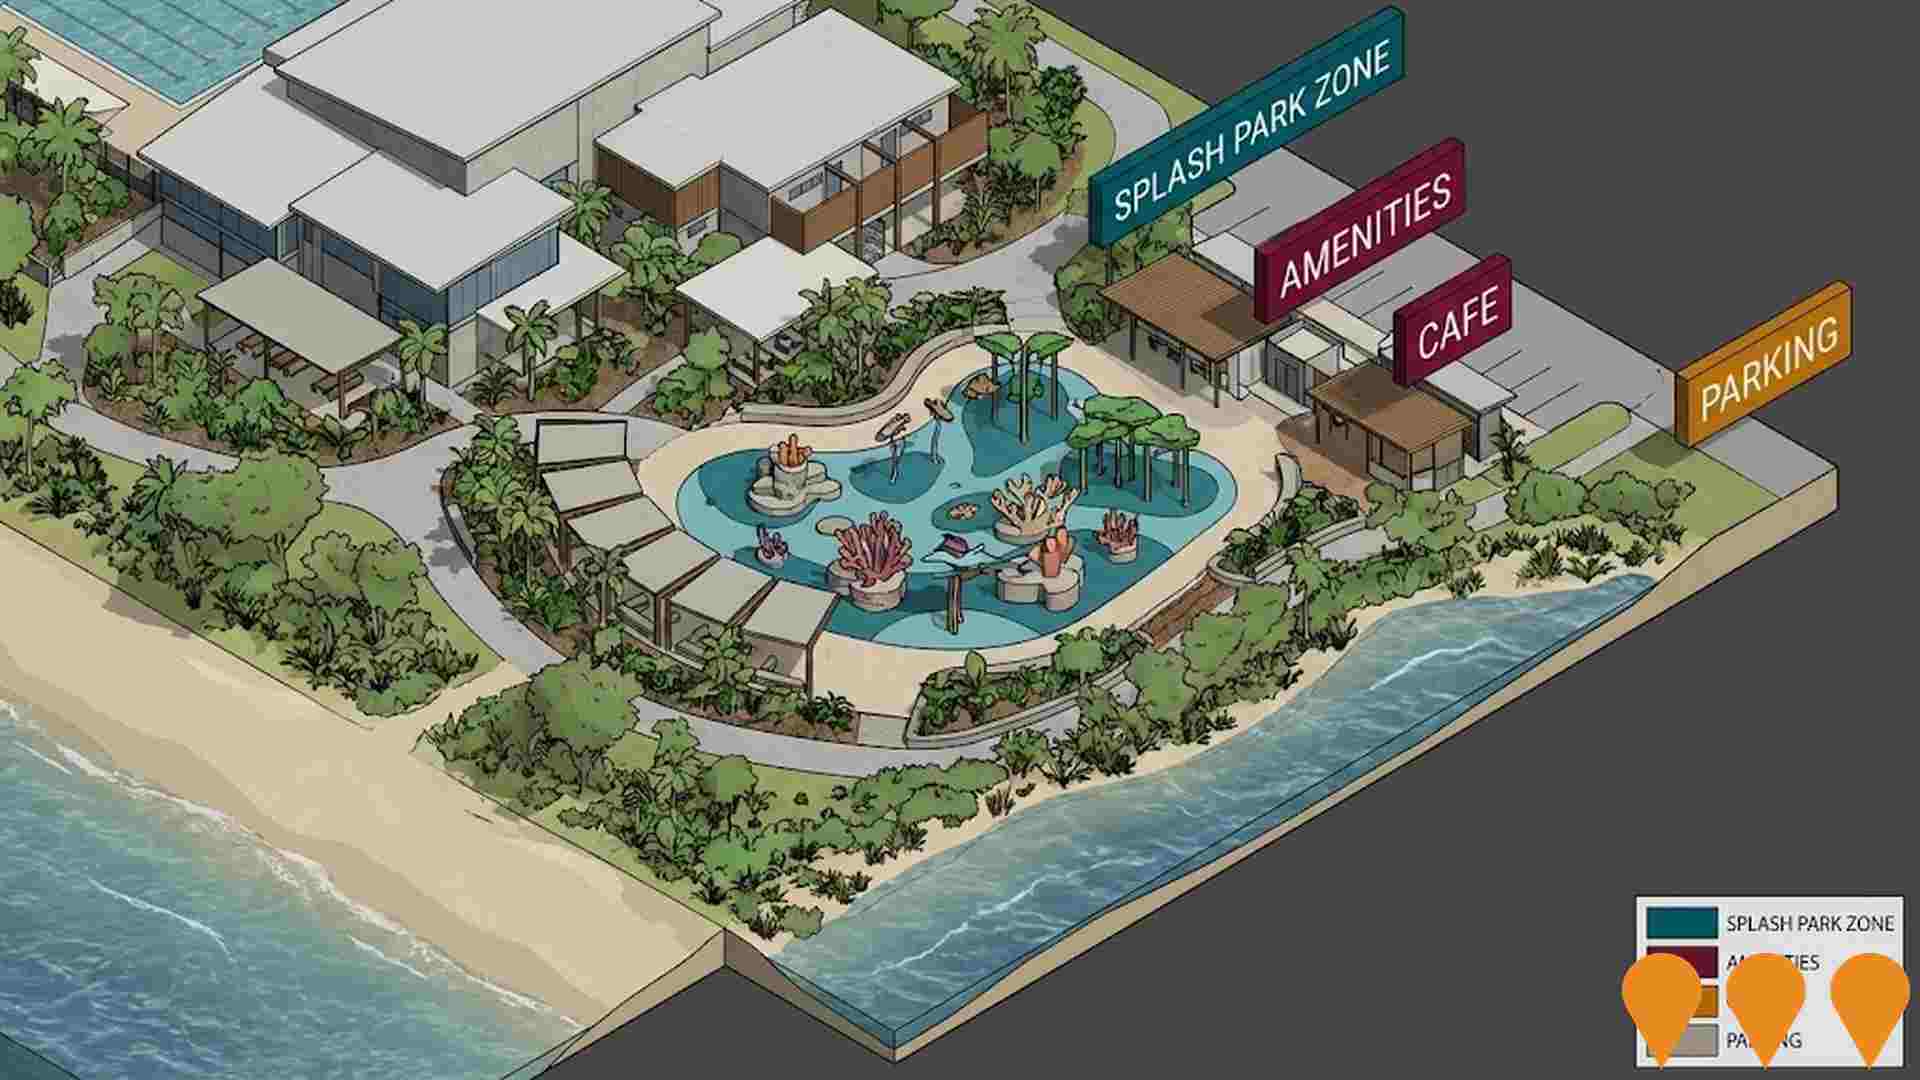
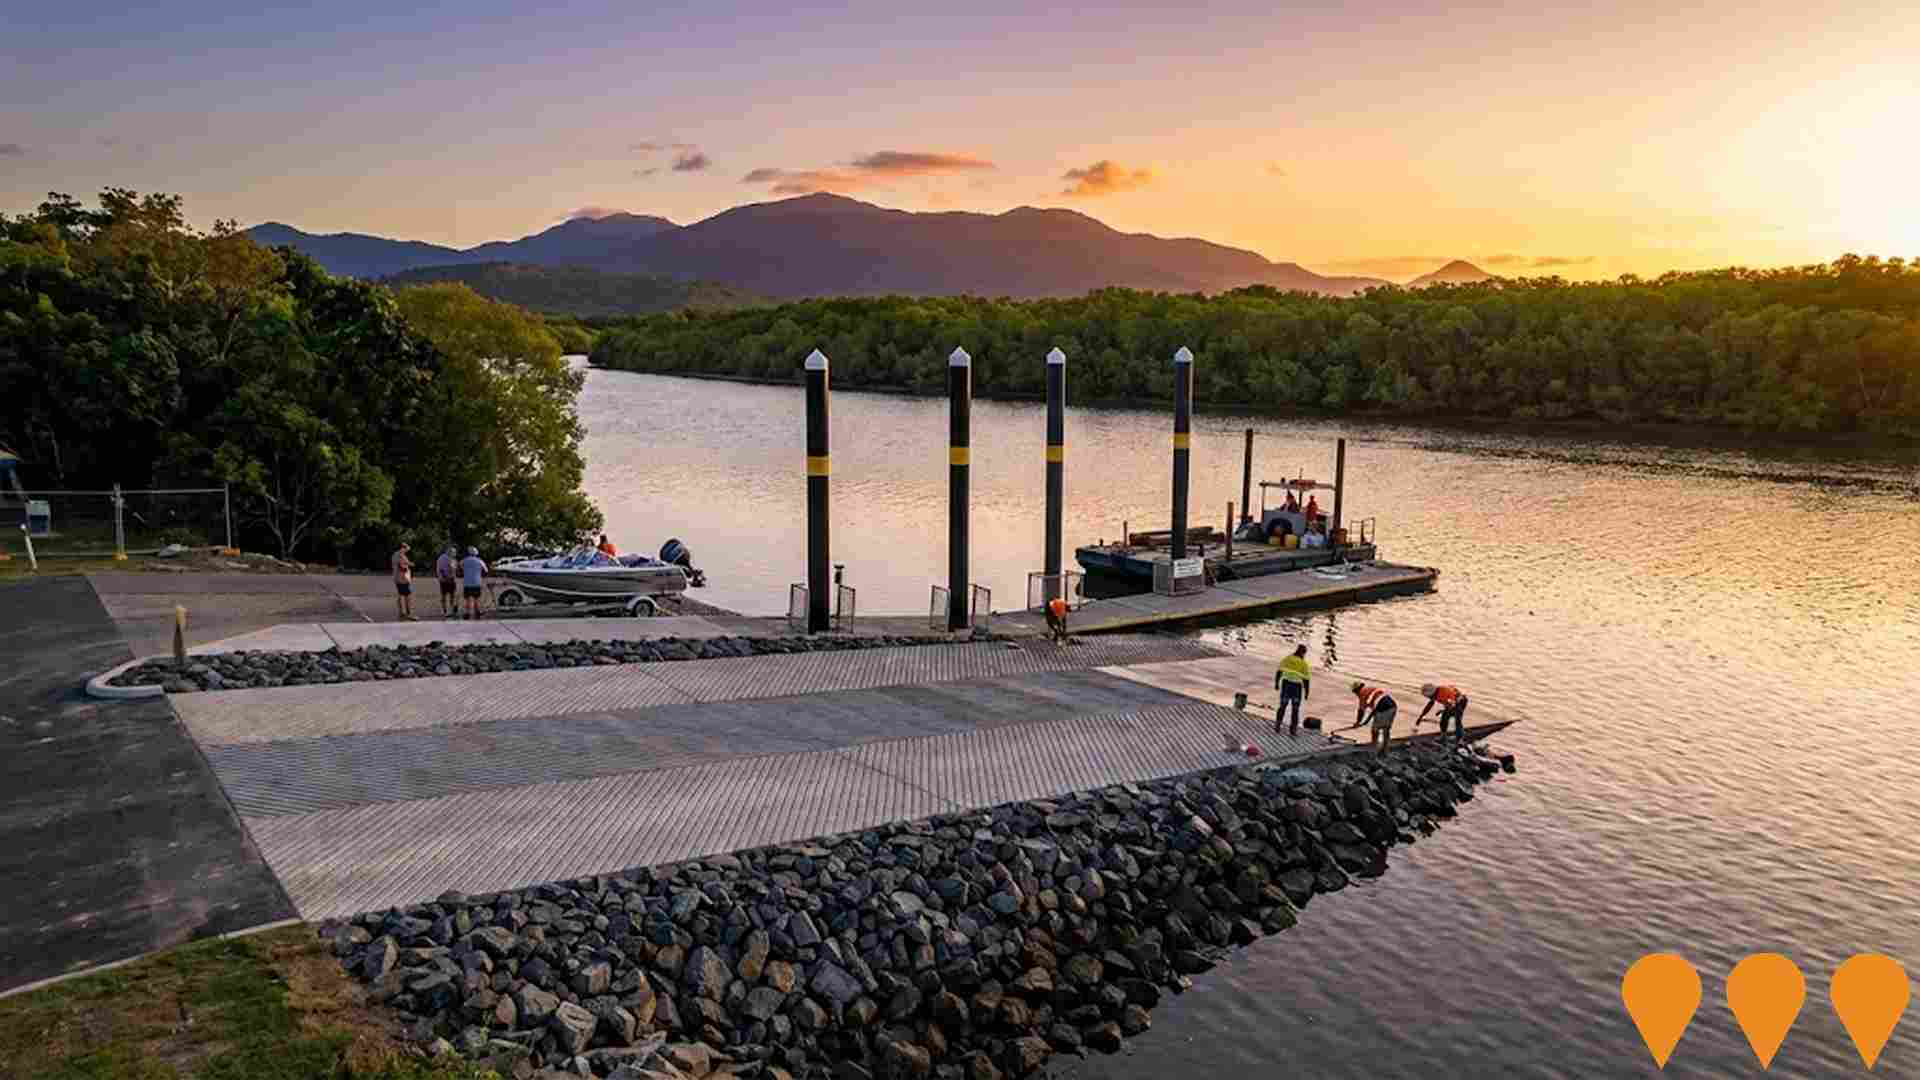
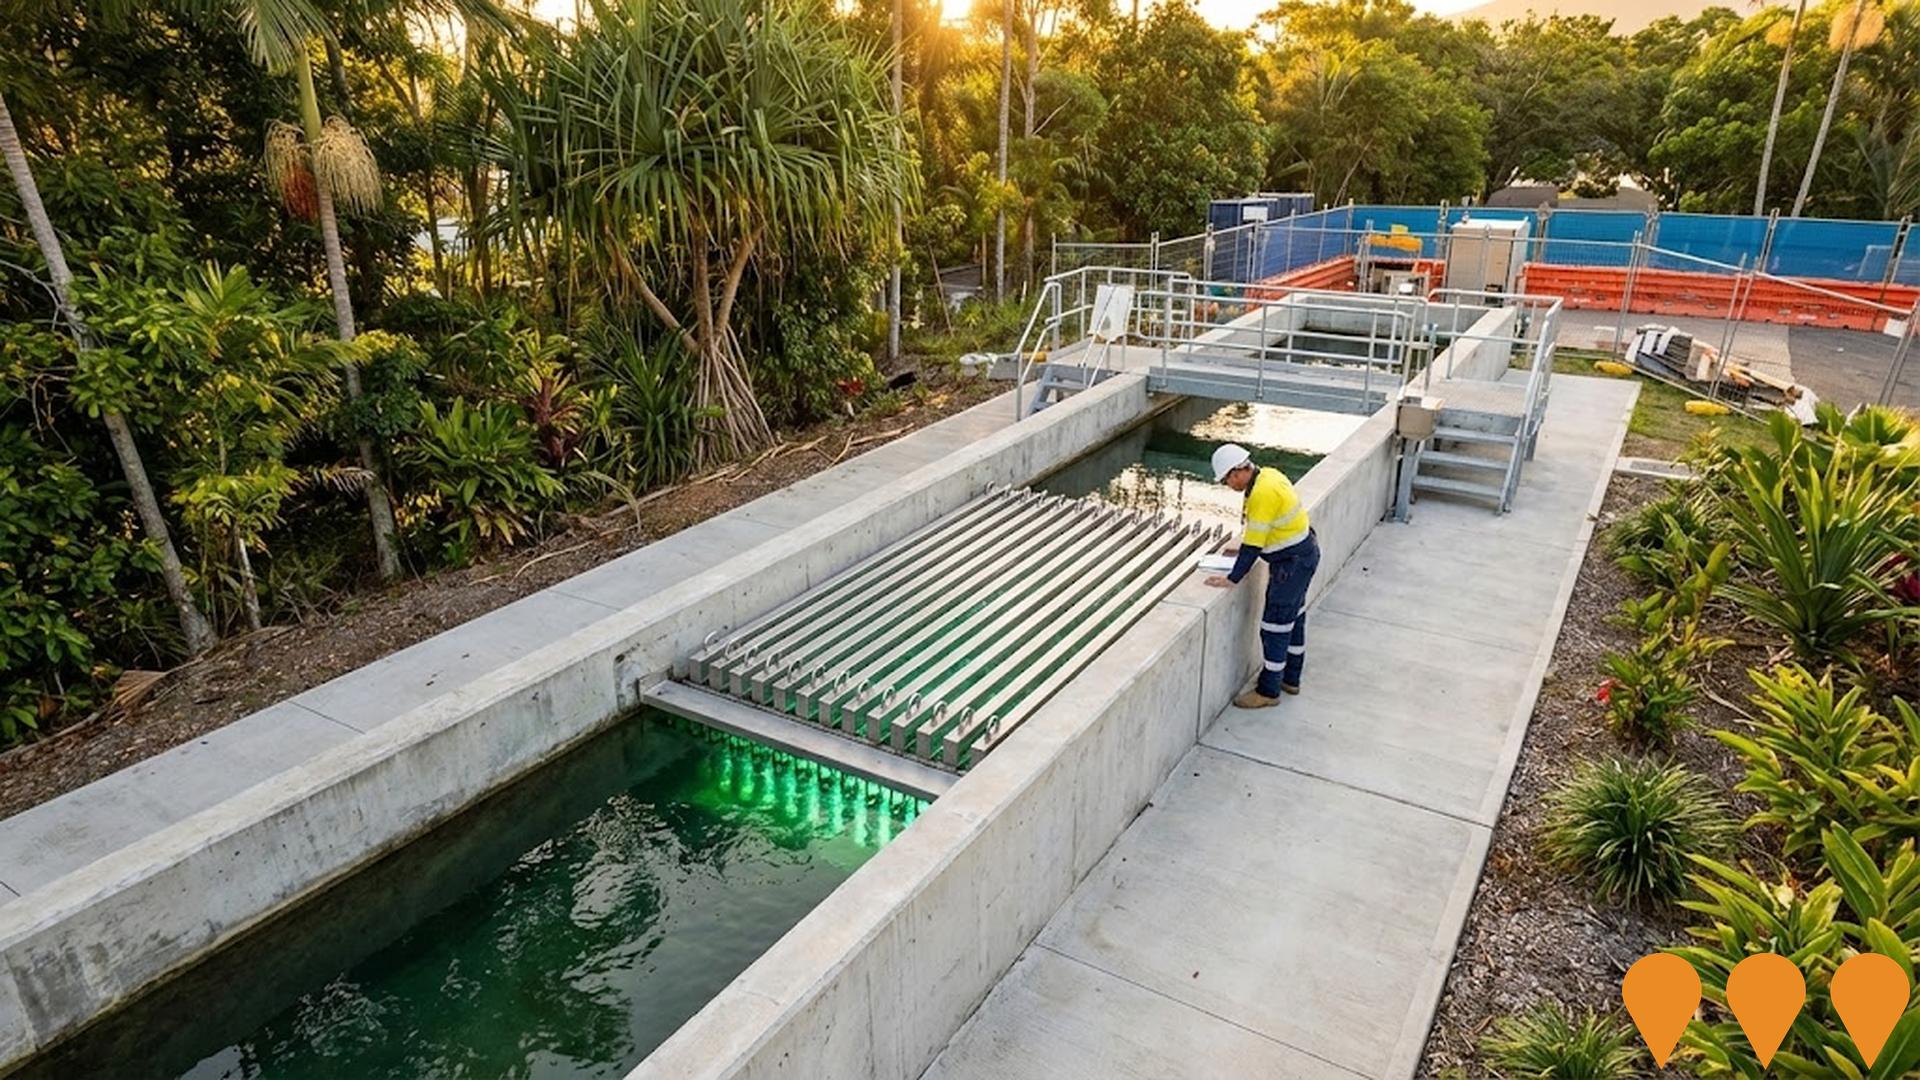
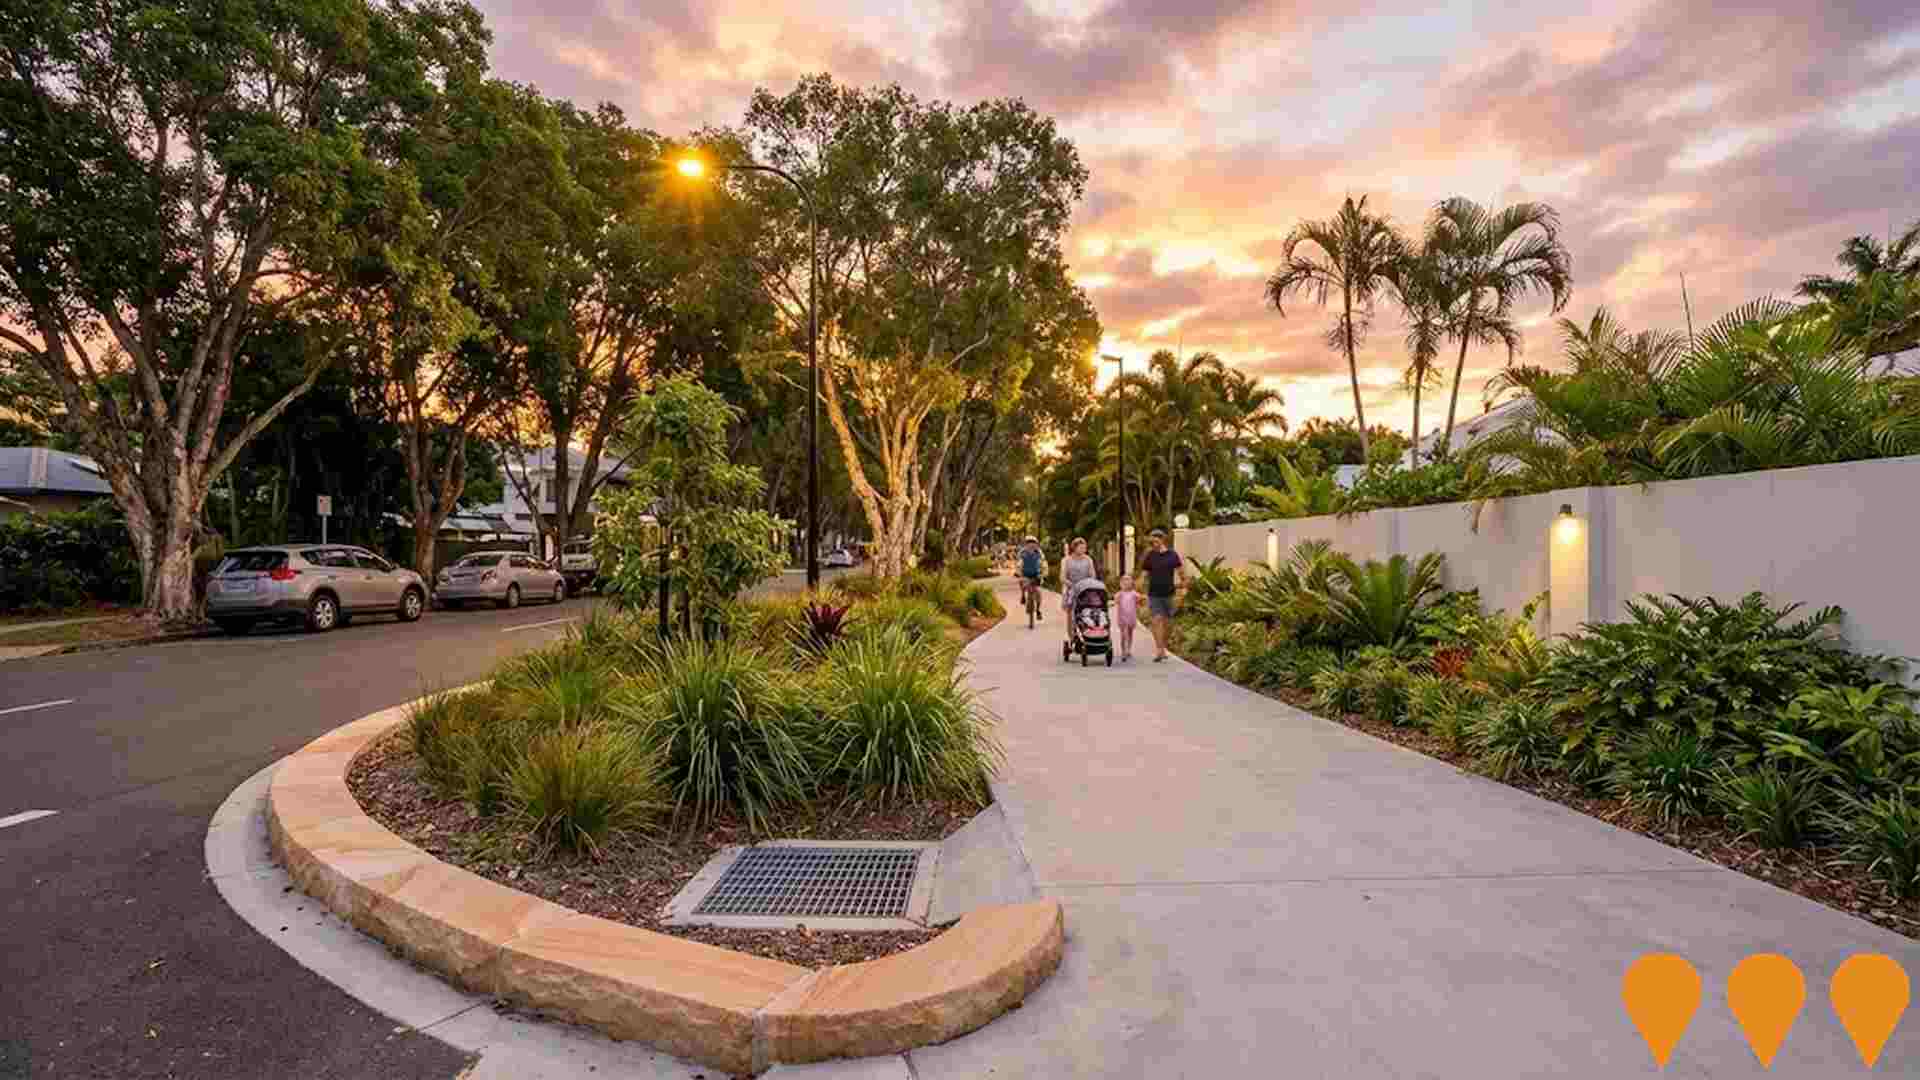
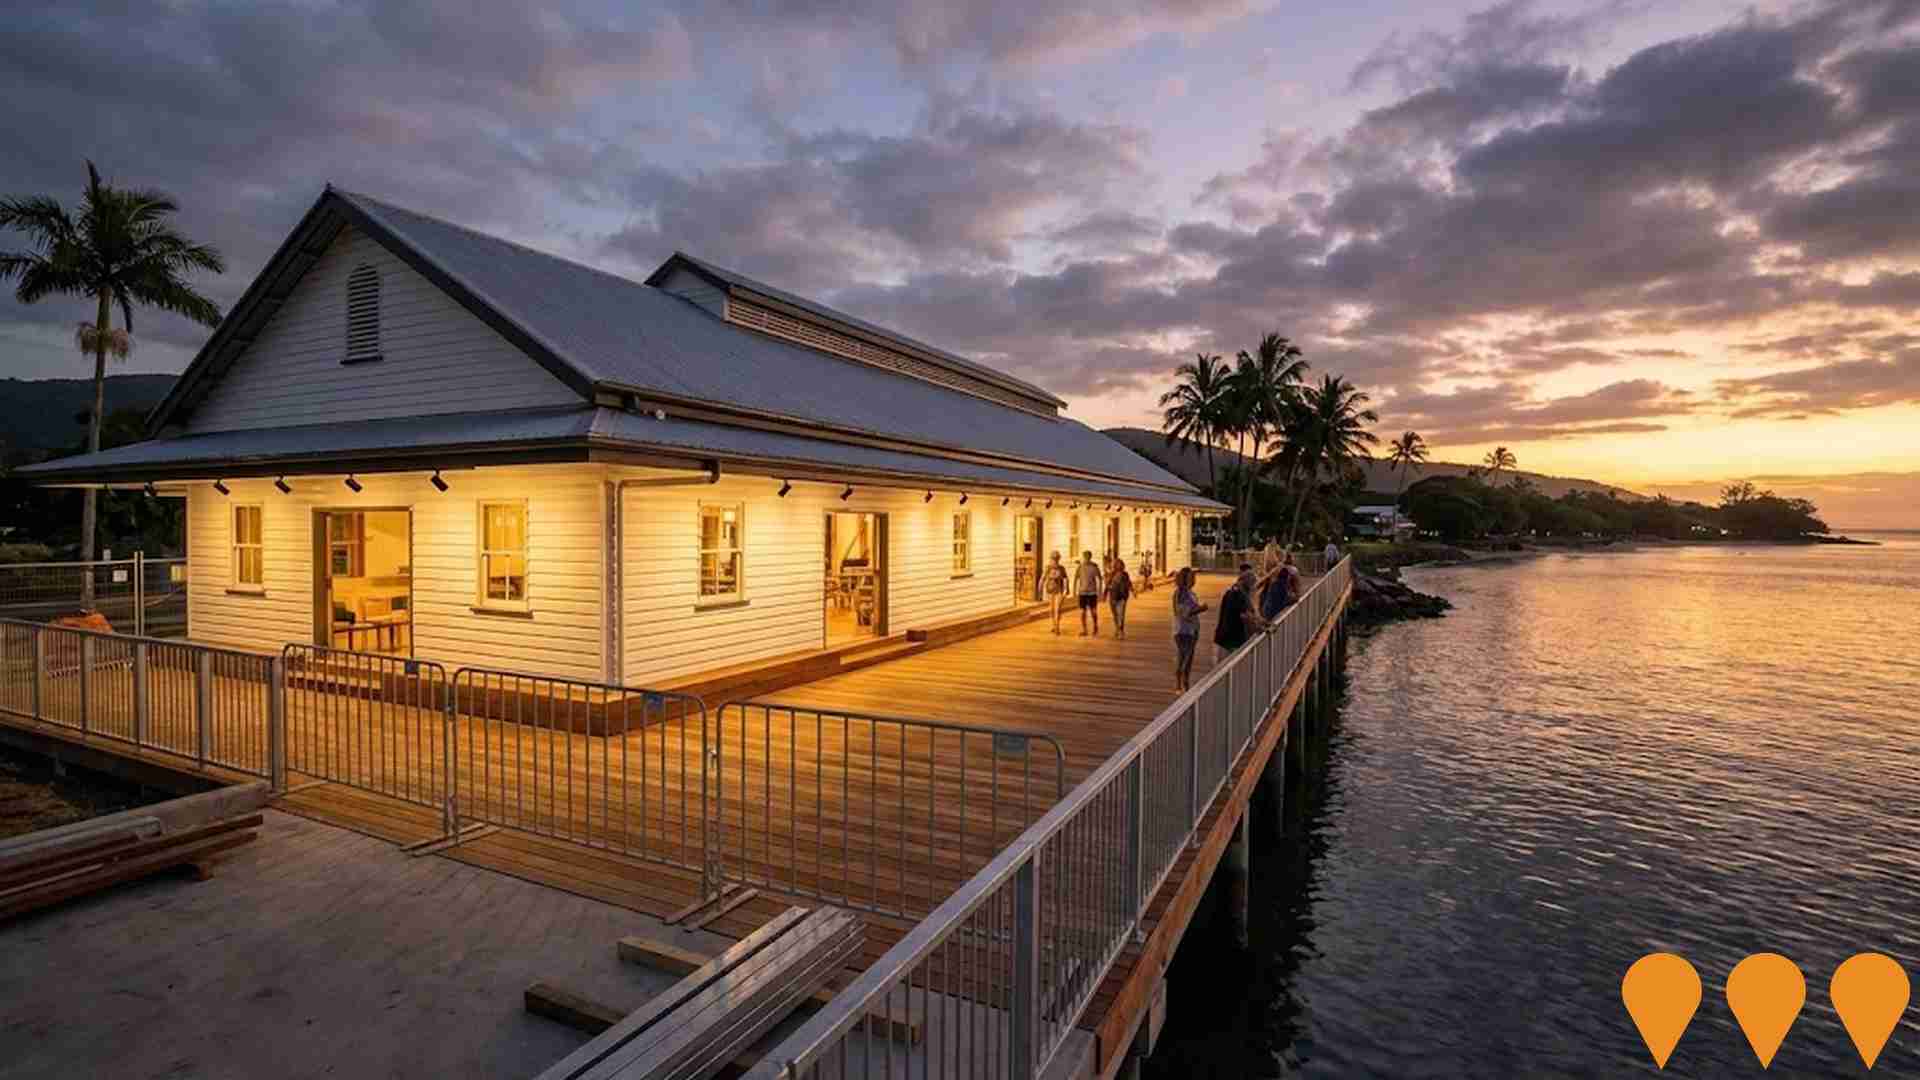
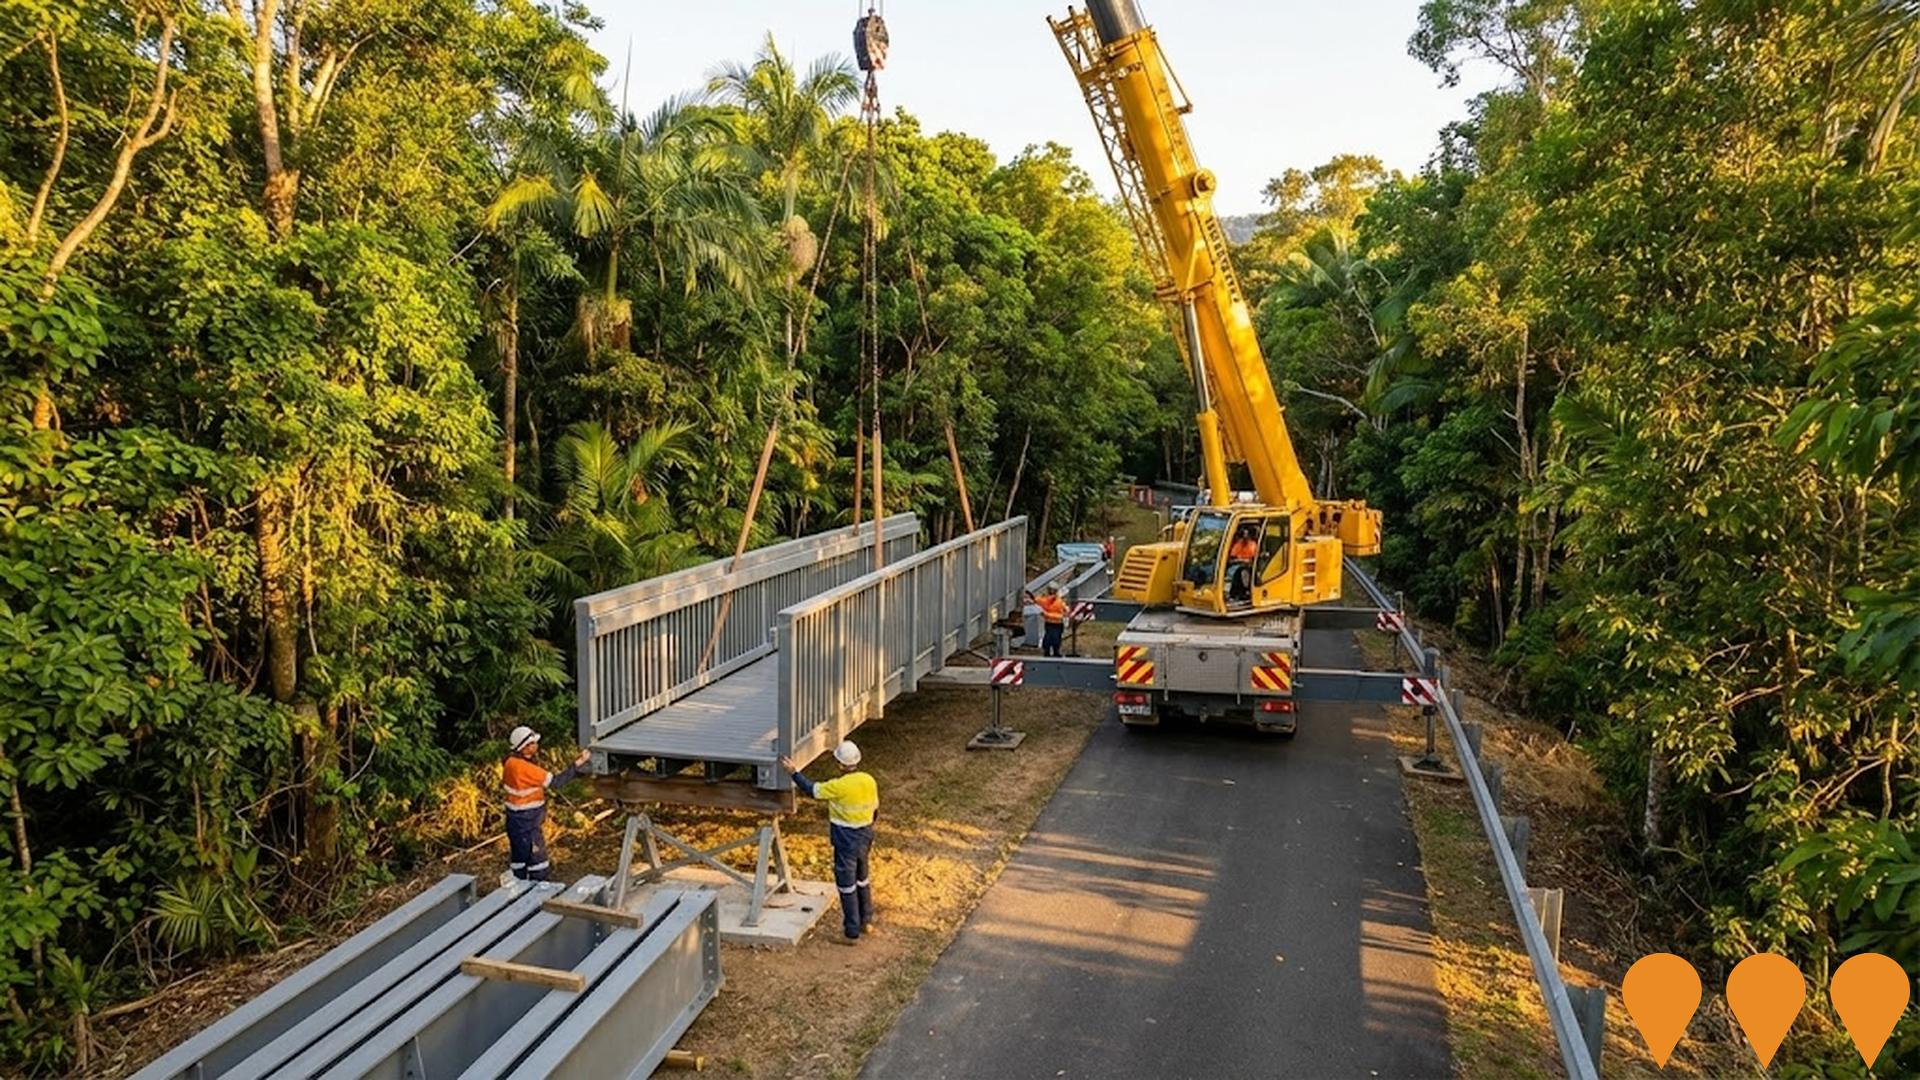
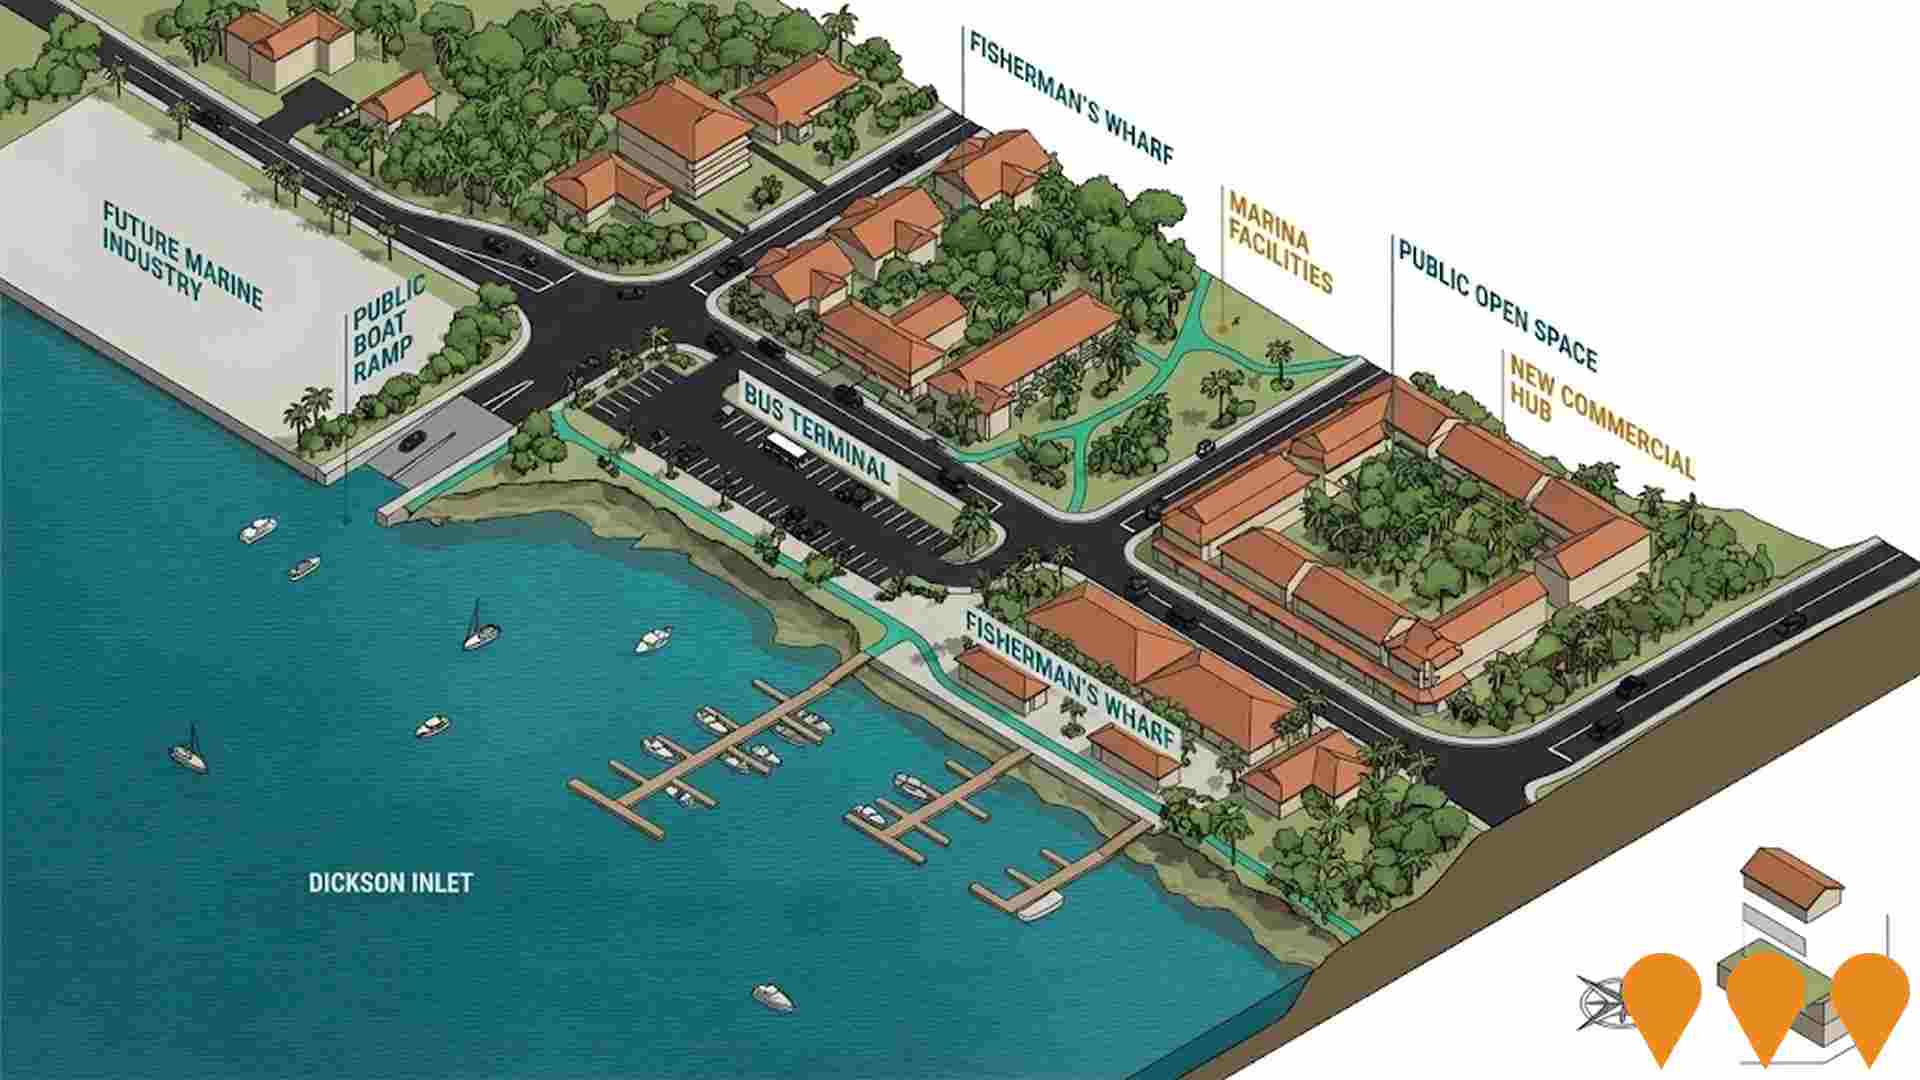
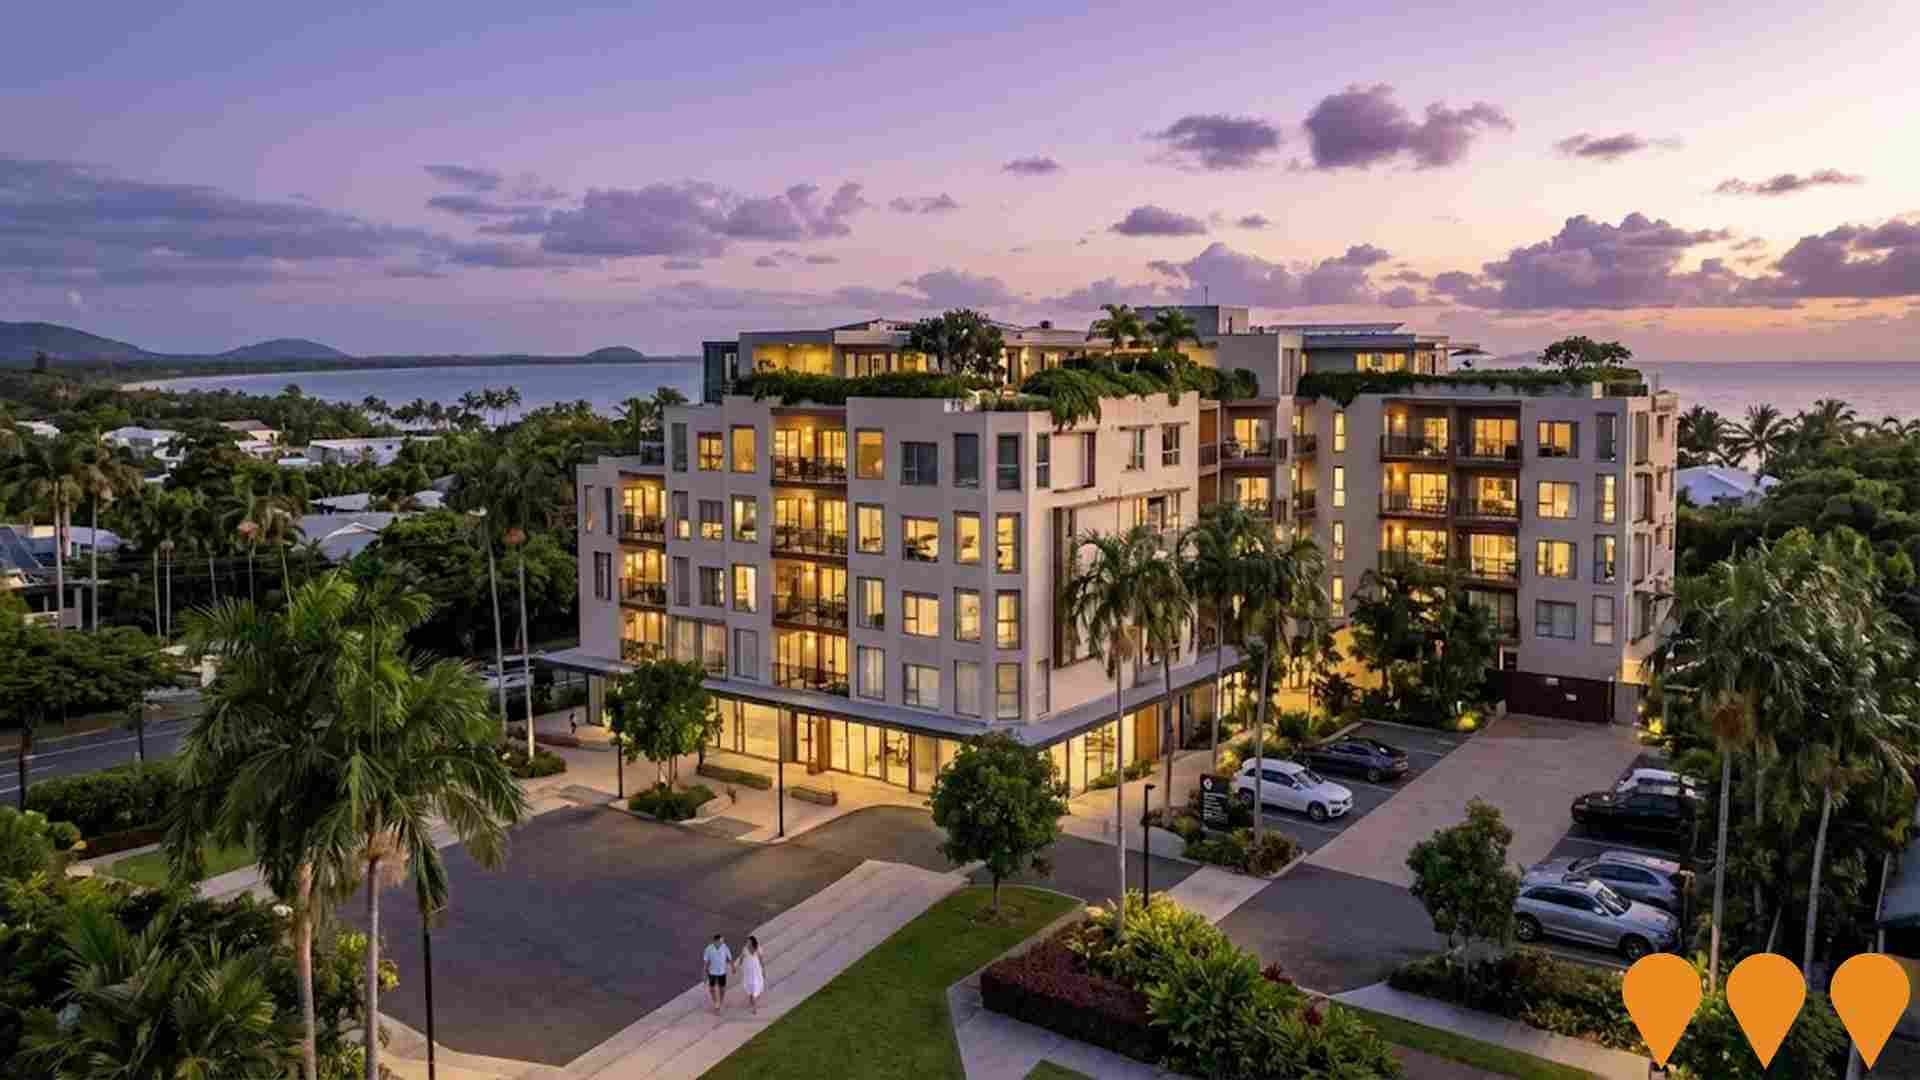
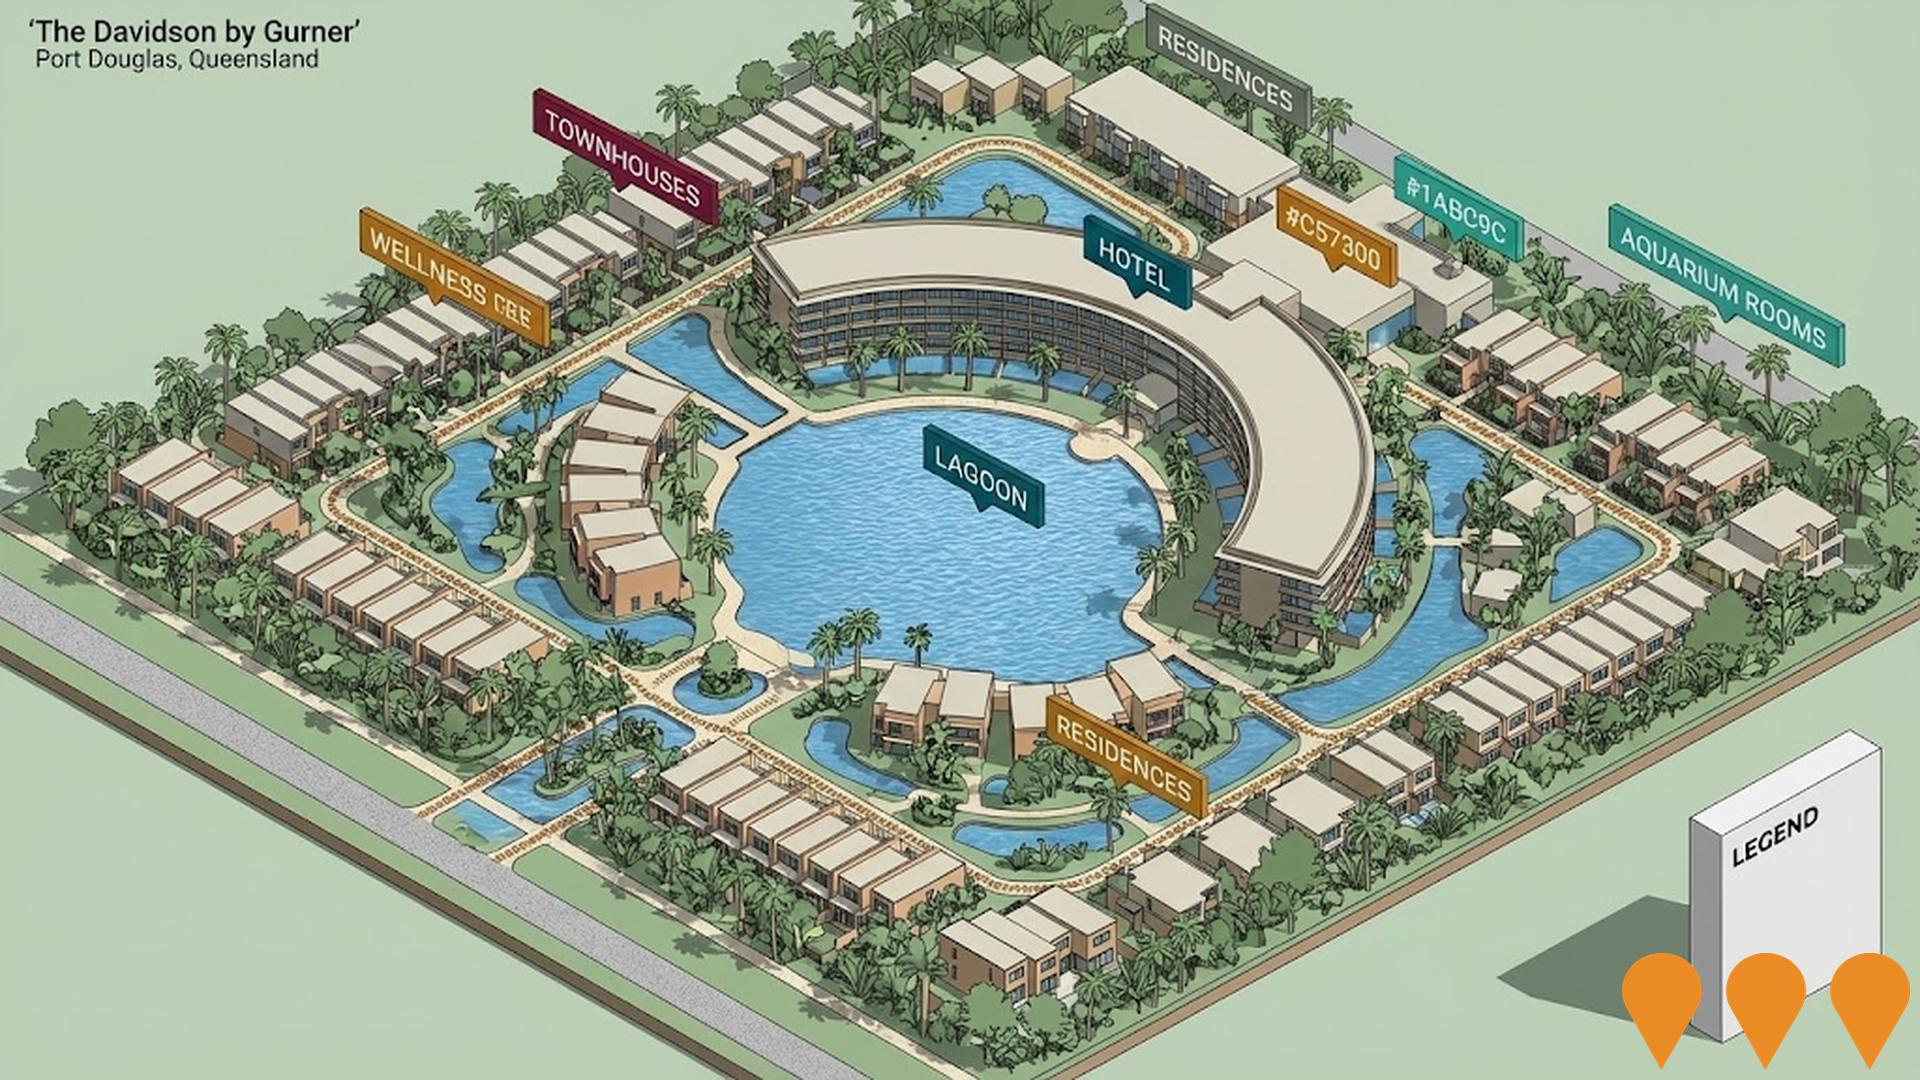
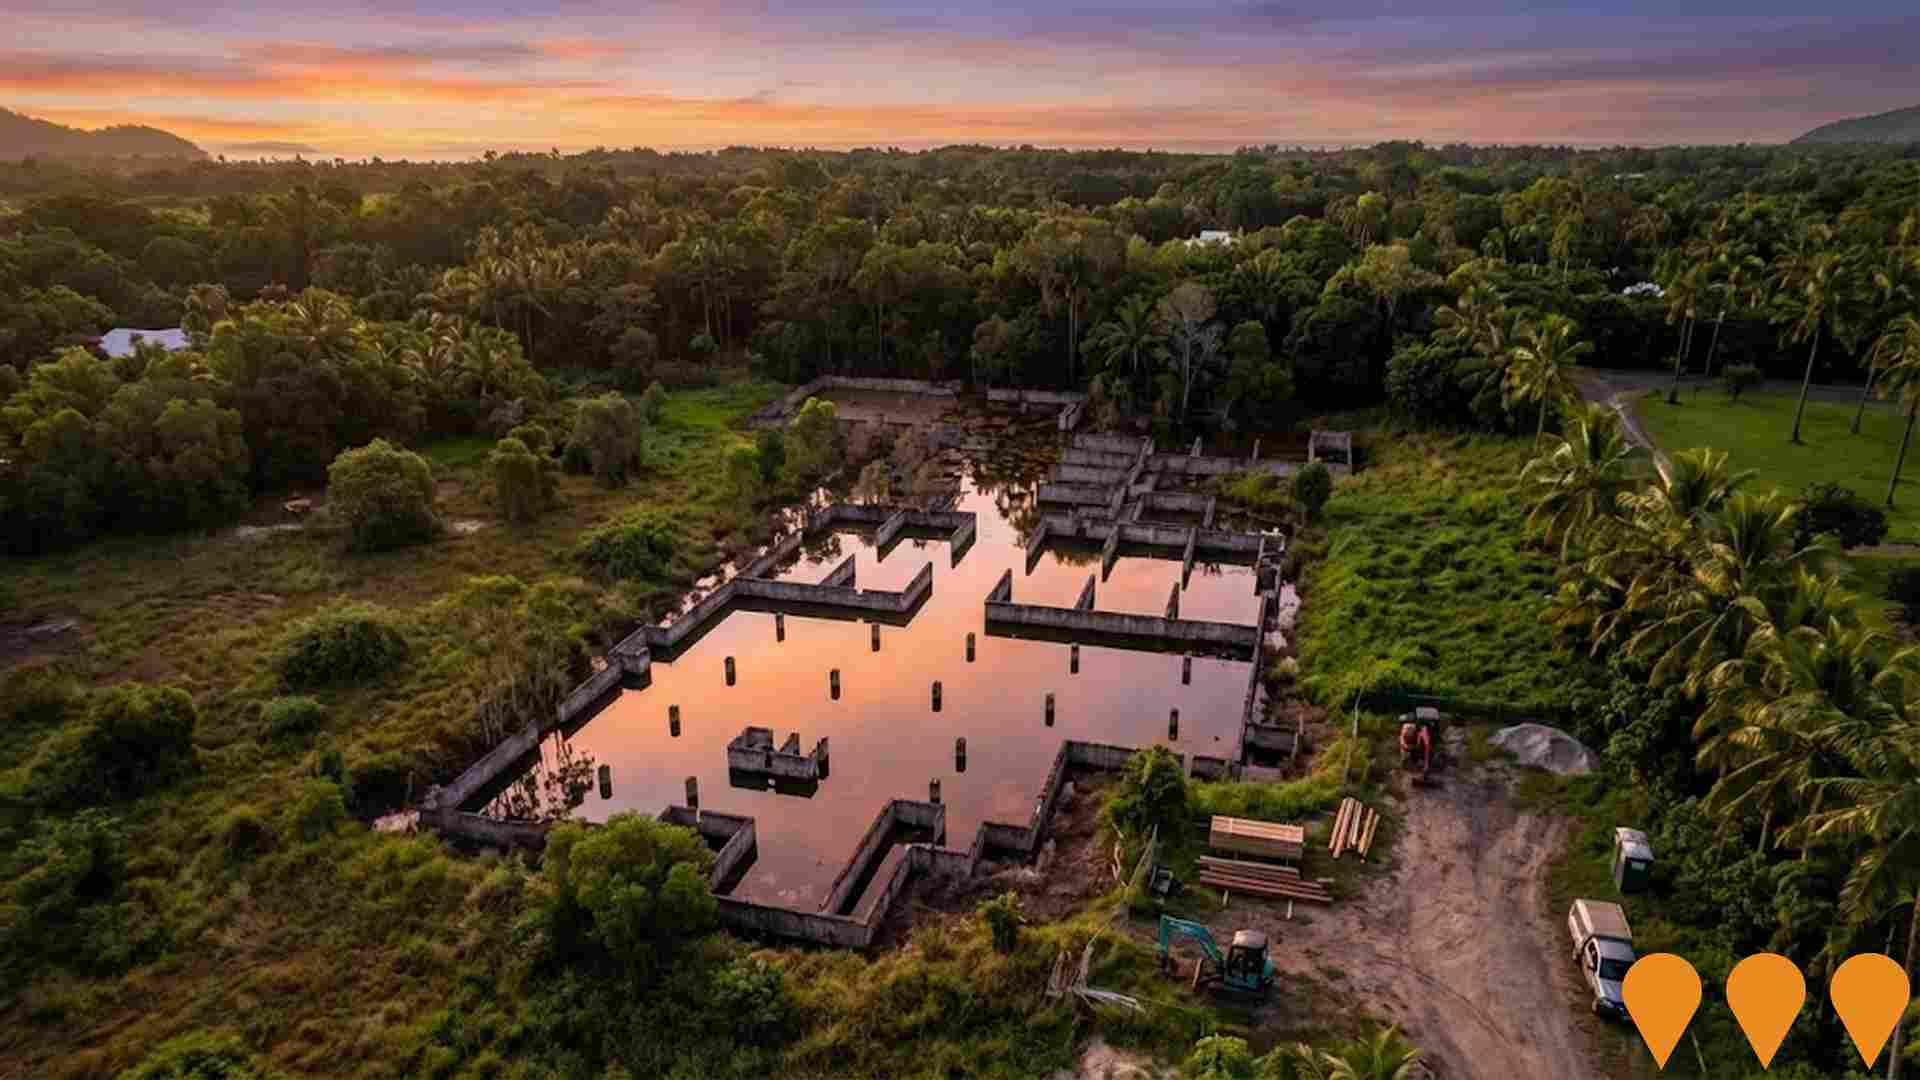
Detail
Aurukun features a balanced workforce spanning white and blue collar employment, with essential services sectors well represented, an unemployment rate of just 0.0%, and relative employment stability over the past year. As of June 2025, 0 residents are in work, and workforce participation lags significantly (21.7% compared to Rest of Qld's 59.1%). The key industries of employment among residents are public administration & safety, education & training, and retail trade. The area demonstrates particularly notable concentration in public administration & safety, with employment levels at 6.2 times the regional average.
Meanwhile, health care & social assistance has limited presence with 7.1% employment compared to 16.1% regionally. The area appears to offer limited employment opportunities locally, as indicated by the count of Census working population vs resident population. Employment trend data is currently being compiled for Aurukun. Jobs and Skills Australia's national employment forecasts from May 2025 can offer further insight into potential future demand within Aurukun. These projections, covering five and ten-year periods, have been mapped against the local employment profile to estimate growth patterns. While national employment is forecast to expand by 6.6% over five years and 13.7% over ten years, growth rates differ significantly between industry sectors. Applying these industry-specific projections to Aurukun's employment mix suggests local growth of approximately increase by 5.4%% over five years and 11.5% over ten years (please note this is a simple weighting extrapolation for illustrative purposes and does not take into account localised population projections).
Frequently Asked Questions - Employment
Median household income in Aurukun is $1,069 a week (about $56,000 a year), with median personal income at $331 a week. ATO records put median taxable income at $35,101 a year against an average of $45,799. Household income is from the 2021 Census; taxable income is from ATO Taxation Statistics for the latest financial year available, indexed forward using the ABS Wage Price Index.
Detail
Aurukun's income level is lower than average on a national basis according to the latest ATO data aggregated by AreaSearch for FY-22. Aurukun's median income among taxpayers is $35,101 and the average income stands at $45,799, which compares to figures for Rest of Qld's of $50,780 and $64,844 respectively. Based on Wage Price Index growth of 13.99% since FY-22, current estimates would be approximately $40,012 (median) and $52,206 (average) as of September 2025. Census 2021 income data shows household, family and personal incomes in Aurukun all fall between the 1st and 6th percentiles nationally.
The earnings profile shows the largest segment comprises 42.3% earning $800 - 1,499 weekly (450 residents), contrasting with the region where the $1,500 - 2,999 bracket leads at 31.7%. While housing costs are modest with 88.3% of income retained, the total disposable income ranks at just the 10th percentile nationally.
Frequently Asked Questions - Income
Aurukun had 236 occupied dwellings at the 2021 Census, 94% detached houses and 2% apartments. 0% are owned with a mortgage, 100% rented and 0% owned outright. At that Census the median rent was $125 a week. Dwelling stock, tenure and housing costs are 2021 Census measures — the only source that counts dwellings at this boundary size.
Detail
Dwelling structure within Aurukun, as evaluated at the latest Census, comprised 94.3% houses and 5.7% other dwellings (semi-detached, apartments, 'other' dwellings), in comparison to Non-Metro Qld's 82.5% houses and 17.6% other dwellings. Meanwhile, the level of home ownership within Aurukun was lagging that of Non-Metro Qld, at 0.0%, with the remainder of dwellings either mortgaged (0.0%) or rented (100.0%). The median monthly mortgage repayment in the area was well below the Non-Metro Qld average at $0, while the median weekly rent figure was recorded at $125, compared to Non-Metro Qld's $1,517 and $140.
Nationally, Aurukun's mortgage repayments are significantly lower than the Australian average of $1,863, while rents are substantially below the national figure of $375.
Frequently Asked Questions - Housing
Aurukun counted 236 households at the 2021 Census, averaging 3.9 people each. 35% are couples with children, against 14% couples without children. 17% of households are people living alone, and families average 1.9 children. Household and family composition is measured only by the Census, so these are 2021 figures.
Detail
Family households dominate at 79.2% of all households, comprising 35.2% couples with children, 14.0% couples without children, and 24.2% single parent families. Non-family households make up the remaining 20.8%, with lone person households at 16.5% and group households comprising 0.0% of the total. The median household size of 3.9 people is larger than the Rest of Qld average of 2.9.
Frequently Asked Questions - Households
6.4% of adults in Aurukun hold a university qualification, lower than 98% of areas nationally. A further 12.6% hold a vocational qualification. 1 school serves the area, with 235 enrolment places and an average ICSEA of 680 against a national benchmark of 1,000. Qualifications come from the 2021 Census; school enrolments, ICSEA and results come from ACARA's current release.
Detail
The area faces educational challenges, with university qualification rates (6.4%) substantially below the Australian average of 30.4%. This represents both a challenge and an opportunity for targeted educational initiatives. Bachelor degrees lead at 5.6%, followed by graduate diplomas (0.8%) and postgraduate qualifications (0.0%). Vocational pathways account for 17.2% of qualifications among those aged 15+ – advanced diplomas (4.6%) and certificates (12.6%). A substantial 23.5% of the population actively pursues formal education. This includes 15.7% in primary education, 4.3% in secondary education, and 0.0% pursuing tertiary education. Aurukun State School provides local educational services within Aurukun, with an enrollment of 235 students while the area demonstrates varied educational conditions across Aurukun.
All 1 schools offer integrated K-12 education, providing continuity throughout students' academic journey. School capacity exceeds typical residential needs (22.1 places per 100 residents vs 15.4 regionally), indicating the area serves as an educational center for the broader region.
Frequently Asked Questions - Education
Schools Detail
Detail
No transport stops were observed in the latest assessment of GTFS data for this area.
Frequently Asked Questions - Transport
Transport Stops Detail
91.1% of residents in Aurukun report no long-term health condition, a healthier profile than 99% of areas nationally. 4.8% need daily assistance with core activities, and 46.6% hold private health cover. Health conditions, assistance needs and insurance are 2021 Census measures; the death rate comes from current ABS releases.
Detail
Health outcomes data demonstrates outstanding results across Aurukun with very low prevalence of common health conditions across all age groups , and the rate of private health cover found to be very low at approximately 47% of the total population (~496 people). This compares to 49.9% across Rest of Qld. The national average is 55.3%. The most common medical conditions in the area were found to be diabetes and mental health issues, impacting 3.4 and 2.0% of residents, respectively, while 91.1% declared themselves as completely clear of medical ailments compared to 79.2% across Rest of Qld.
The area has 7.4% of residents aged 65 and over (78 people), which is lower than the 11.5% in Rest of Qld. Health outcomes among seniors are particularly strong, broadly in line with the general population's health profile. Overall 4.8% of the total population registered as requiring assistance with day to day activities, which is below average. In Rest of Qld, 3.4% require assistance.
Frequently Asked Questions - Health
Aurukun is largely Australian-born, at 98.4% of residents, with 90.0% speaking a language other than English at home. Australian Aboriginal is the largest reported ancestry, at 84.3% of residents. 84.3% of residents identify as Aboriginal and/or Torres Strait Islander. Ancestry, language and country of birth are counted only by the Census, so these are 2021 figures.
Detail
Aurukun was found to be above average in terms of cultural diversity, with 1.6% of its population born overseas and 90.0% speaking a language other than English at home. The main religion in Aurukun was found to be Christianity, which makes up 66.6% of people in Aurukun. This compares to 64.7% across Rest of Qld. In terms of ancestry (country of birth of parents), the top three represented groups in Aurukun are Australian Aboriginal, comprising 84.3% of the population, which is substantially higher than the regional average of 25.3%, Other, comprising 8.3% of the population, which is notably lower than the regional average of 28.1%, and Australian, comprising 2.1% of the population, which is notably lower than the regional average of 15.4%.
Frequently Asked Questions - Diversity
The median resident of Aurukun is 29, younger than 98% of areas nationally. 34.5% of residents are aged 15 to 34. Age cohorts are not raw Census counts: the Census split is re-based to the latest ABS population estimates and state projections.
Detail
With a median age of 29, Aurukun is materially younger than the Rest of Qld figure of 41 and is substantially under Australia's 38 years. Relative to Rest of Qld, Aurukun has a higher concentration of 25 - 34 residents (18.6%) but fewer 65 - 74 year-olds (5.5%). Since the 2021 Census, the 0 to 4 age group has grown from 7.9% to 9.8% of the population, while the 65 to 74 cohort increased from 4.0% to 5.5%. Conversely, the 45 to 54 cohort has declined from 14.2% to 10.7% and the 5 to 14 group dropped from 16.0% to 14.3%.
Population forecasts for 2041 indicate substantial demographic changes for Aurukun. The 25 to 34 cohort shows the strongest projected growth at 33%, adding 66 residents to reach 265. On the other hand, both 55 to 64 and 15 to 24 age groups will see reduced numbers.
Frequently Asked Questions - Age
Data & MethodBoundaries, Sources & Method for Aurukun
9 of 14 data sections on this page were updated within the last 12 months — the newest current to Sep 2026.
Everything is aggregated to the SA2 boundary shown above, on a 2021 Census baseline. Only 3 sections — housing, households and cultural diversity — still wait on the 2026 Census.
The ledger — source, cycle and currency by section
| Section | Source & update cycle | Currency |
|---|---|---|
| Updated within the last 12 months 9 sections | ||
| Population | ABS, GNAF, Geoscience Australia Annual (ABS ERP) | Aug 2026 last month headline measures · 2021 Census baseline |
| Re-based to the ABS Estimated Resident Population (June 2024 release) and updated with new dwellings from GNAF address data. Current to Aug 2026, with the 2021 Census supplying the small-area baseline. | ||
| Age profile | ABS, Geoscience Australia, State governments Annual | Aug 2026 last month headline measures · 2021 Census baseline |
| Age cohorts are re-based to the latest ABS population estimates and state projections, current to Aug 2026. Each cohort is held as a Census baseline and a current estimate. | ||
| Development & approvals | ABS, GNAF Monthly (ABS approvals) | Aug 2026 last month headline measures · Jul 2026 baseline |
| Property sales & rents | Valuer General, Rental Board, ABS Weekly sales, quarterly rents | Sep 2026 this month all 21 measures |
| Sales from the state Valuer General register, refreshed weekly, and rents from quarterly rental bond lodgements. Both are read live each time this page loads, current to Sep 2026. | ||
| Infrastructure projects | Infrastructure Australia, Local governments Daily | May 2026 4 months ago all 2 projects tracked here |
| Project pipeline maintained continuously from Infrastructure Australia, state agencies, local government and public announcements. Records are added and revised daily; this area was last updated May 2026. | ||
| Employment | ABS, DEWR, JSA Quarterly (ABS SALM) | Mar 2026 6 months ago headline measures · 2021 Census baseline |
| Unemployment and labour force from ABS Small Area Labour Markets, current to Mar 2026. The growth outlook applies Department of Employment (now Jobs and Skills Australia) forecasts for all 19 industry divisions to the local industry mix, so it measures sector composition rather than local expansion and makes no allowance for population growth. Job demand comes from the same agency via its Internet Vacancy Index; industry and occupation structure from the 2021 Census. | ||
| Education | ABS, ACARA Annual (ACARA) | Aug 2026 last month headline measures · 2021 Census baseline |
| Transport | ABS, State Transport Departments Each timetable release | Jul 2026 2 months ago headline measures · 2021 Census baseline |
| Services & amenities | Provider directories, ACECQA Continuous | Jul 2026 2 months ago all 14 measures |
| Annual and financial-year sources 2 sections | ||
| Income | ABS, ATO Annual (ATO) | FY 2023 3 years ago headline measures · 2021 Census baseline |
| ATO taxable income statistics for FY 2022, indexed forward using the Wage Price Index. Census household income provides the distribution detail. | ||
| Health | ABS, ATO Annual | 2024 2 years ago headline measures · 2021 Census baseline |
| Census-measured — next update: 2026 Census 3 sections No more current small-area source exists for these, so they are labelled as Census-measured rather than implied to be current. | ||
| Housing | ABS 5-yearly (Census) | 2021 Census next update 2026 all 30 measures |
| Households | ABS 5-yearly (Census) | 2021 Census next update 2026 all 18 measures |
| Cultural diversity | ABS, Geoscience Australia 5-yearly (Census) | 2021 Census next update 2026 all 44 measures |
"Currency" is the most recent release feeding that section. Where the Census supplies the structural baseline underneath a current headline figure, the row says so.
How the numbers are built
Population
The Census provides the small-area baseline, aggregated from mesh blocks to this boundary. It is then re-based to the ABS Estimated Resident Population (June 2024 release), and new dwellings built since Census night are counted from address data. The headline figure is therefore a current estimate for Nov 2025, not a 2021 count (1,101 at the 2021 Census → 1,066 now). Annual growth rates are compound (CAGR), not simple averages.
Age profile
Cohort shares are not raw Census counts. Every cohort is held as a pair — the Census baseline and a current estimate — and the split is re-based using ERP and state population projections, current to Nov 2025. Median age is the Census median plus modelled change since. Charts that show both are labelled "2021 Census vs Current Estimate".
Property sales
Sourced from the state valuation authority's sales register — current, not Census, and refreshed weekly. Medians are calculated from settled transactions in the period shown; periods with very low transaction counts are flagged or suppressed, because a handful of sales can move a median substantially.
Rents
Derived from state rental bond lodgement data, by dwelling type and bedroom count. Bonds are lodged at the start of a new tenancy, so this reflects new lettings, not the whole rented stock.
Development & infrastructure
Building approvals come from current ABS releases; development applications are collected from council and state planning portals; the infrastructure pipeline is compiled from Infrastructure Australia and local government sources. Applications are matched to this boundary by address or coordinates, so very recent lodgements may not yet appear.
Employment & income
Industry and occupation structure comes from the Census, but the headline labour-market indicators do not. Unemployment and labour force are derived from ABS Small Area Labour Markets (quarterly). The employment outlook applies Department of Employment forecasts for all 19 industry divisions to this area's own industry mix (the agency is now Jobs and Skills Australia), as does the Internet Vacancy Index used for job demand. Because it is weighted on industry composition alone, that outlook carries no allowance for local population growth — in fast-growing areas the real rise in local jobs will typically be higher. Income combines Census household income with ATO taxable-income statistics for FY 2022, indexed forward using the Wage Price Index.
Education, transport & amenities
School enrolments, ICSEA and performance come from ACARA's current release, not the Census. Public transport stops and service frequency are derived from GTFS timetable feeds published by state transport departments. Services and amenities are proximity and count scores built from provider directories, refreshed on their own cycle. The Census contributes only the travel-to-work and qualification measures.
Rankings and benchmarks. Where we rank this area, the comparison set is every area of the same boundary type — suburbs against suburbs, SA2s against SA2s. Benchmarks compare this area against its greater capital city region and the national figure for the same measure and period.
Limits worth knowing. Small areas carry larger error margins, and the ABS introduces small random adjustments to Census counts to protect confidentiality — so totals may not sum exactly. Estimates re-based from regional data describe the area's expected trajectory, not a direct count of it. Figures are indicative for research and are not financial, planning or valuation advice.
Cross-check us. The Census baseline for this boundary is at ABS 2021 Census QuickStats (315011395). QuickStats reports 2021 only — the figures on this page are more current wherever the ledger shows a later date.