Chart Color Schemes
This analysis uses ABS Statistical Areas Level 2 (SA2) boundaries, which can materially differ from Suburbs and Localities (SAL) even when sharing similar names.
SA2 boundaries are defined by the Australian Bureau of Statistics and are designed to represent communities for statistical reporting (e.g., census and ERP).
Suburbs and Localities (SAL) represent commonly-used suburb/locality names (postal-style areas) and may use different geographic boundaries. For comprehensive analysis, consider reviewing both boundary types if available.
est. as @ -- *
ABS ERP | -- people | --
2021 Census | -- people
Sales Activity
Curious about local property values? Filter the chart to assess the volume and appreciation (including resales) trends and regional comparisons, or scroll to the map below view this information at an individual property level.
Find a Recent Sale
Sales Detail
Population
Daintree has seen population growth performance typically on par with national averages when looking at short and medium term trends
Daintree's population is around 7,015 as of Nov 2025. This reflects an increase of 341 people since the 2021 Census, which reported a population of 6,674 people. The change is inferred from the estimated resident population of 6,979 from the ABS as of June 2024 and an additional 153 validated new addresses since the Census date. This level of population equates to a density ratio of 3.1 persons per square kilometer. Daintree's growth rate of 5.1% since census positions it within 1.4 percentage points of the SA3 area (6.5%). Population growth for the area was primarily driven by interstate migration, contributing approximately 55.5% of overall population gains during recent periods.
AreaSearch is adopting ABS/Geoscience Australia projections for each SA2 area, as released in 2024 with a base year of 2022. For areas not covered by this data and years post-2032, Queensland State Government's SA2 area projections are adopted, released in 2023 based on 2021 data. These state projections do not provide age category splits; hence proportional growth weightings in line with the ABS Greater Capital Region projections are applied for each age cohort. Looking at population projections moving forward, a population increase just below the median of regional areas across the nation is expected. The area is expected to expand by 932 persons to 2041 based on the latest annual ERP population numbers, reflecting an increase of 12.8% in total over the 17 years.
Frequently Asked Questions - Population
Development
AreaSearch analysis of residential development drivers sees Daintree recording a relatively average level of approval activity when compared to local markets analysed countrywide
Daintree has experienced approximately 31 dwelling approvals annually. Over the past five financial years, from FY21 to FY25, around 158 homes were approved, with an additional 16 approved in FY26 so far. On average, about two people moved to the area each year for every dwelling built during these years.
This balance between supply and demand has maintained stable market conditions while offering more affordable housing options, with new homes averaging around $226,000 in construction cost. In this financial year, commercial development approvals totaled $56.6 million, indicating strong local business investment. Compared to the rest of Queensland, Daintree shows moderately higher building activity, with an 11.0% increase per person over the five-year period.
This has preserved reasonable buyer options while sustaining existing property demand. However, development activity has decreased in recent periods. All new construction consists of detached dwellings, maintaining the area's traditional low-density character and appealing to families seeking space. The estimated population growth rate is 358 people per dwelling approval, reflecting its quiet development environment. According to AreaSearch's latest quarterly estimate, Daintree is projected to add 896 residents by 2041. Current development appears well-suited to future needs, supporting steady market conditions without extreme price pressure.
Frequently Asked Questions - Development
Infrastructure
Daintree has moderate levels of nearby infrastructure activity, ranking in the top 50% nationally
AreaSearch has identified a total of 26 projects that are likely to impact the area, with changes to local infrastructure being significant influencers on performance. Notable projects include the Mossman River Intake (Alternate Water Intake Project), Principal Cycle Network: Cooya Beach to Mossman (stage 3) & Cooya Beach Road (stage 2), Mossman River Alternate Water Intake Project, and Principal Cycle Network - Mossman to Newell Beach. The following list details those projects likely to be most relevant.
Professional plan users can use the search below to filter and access additional projects.
INFRASTRUCTURE SEARCH
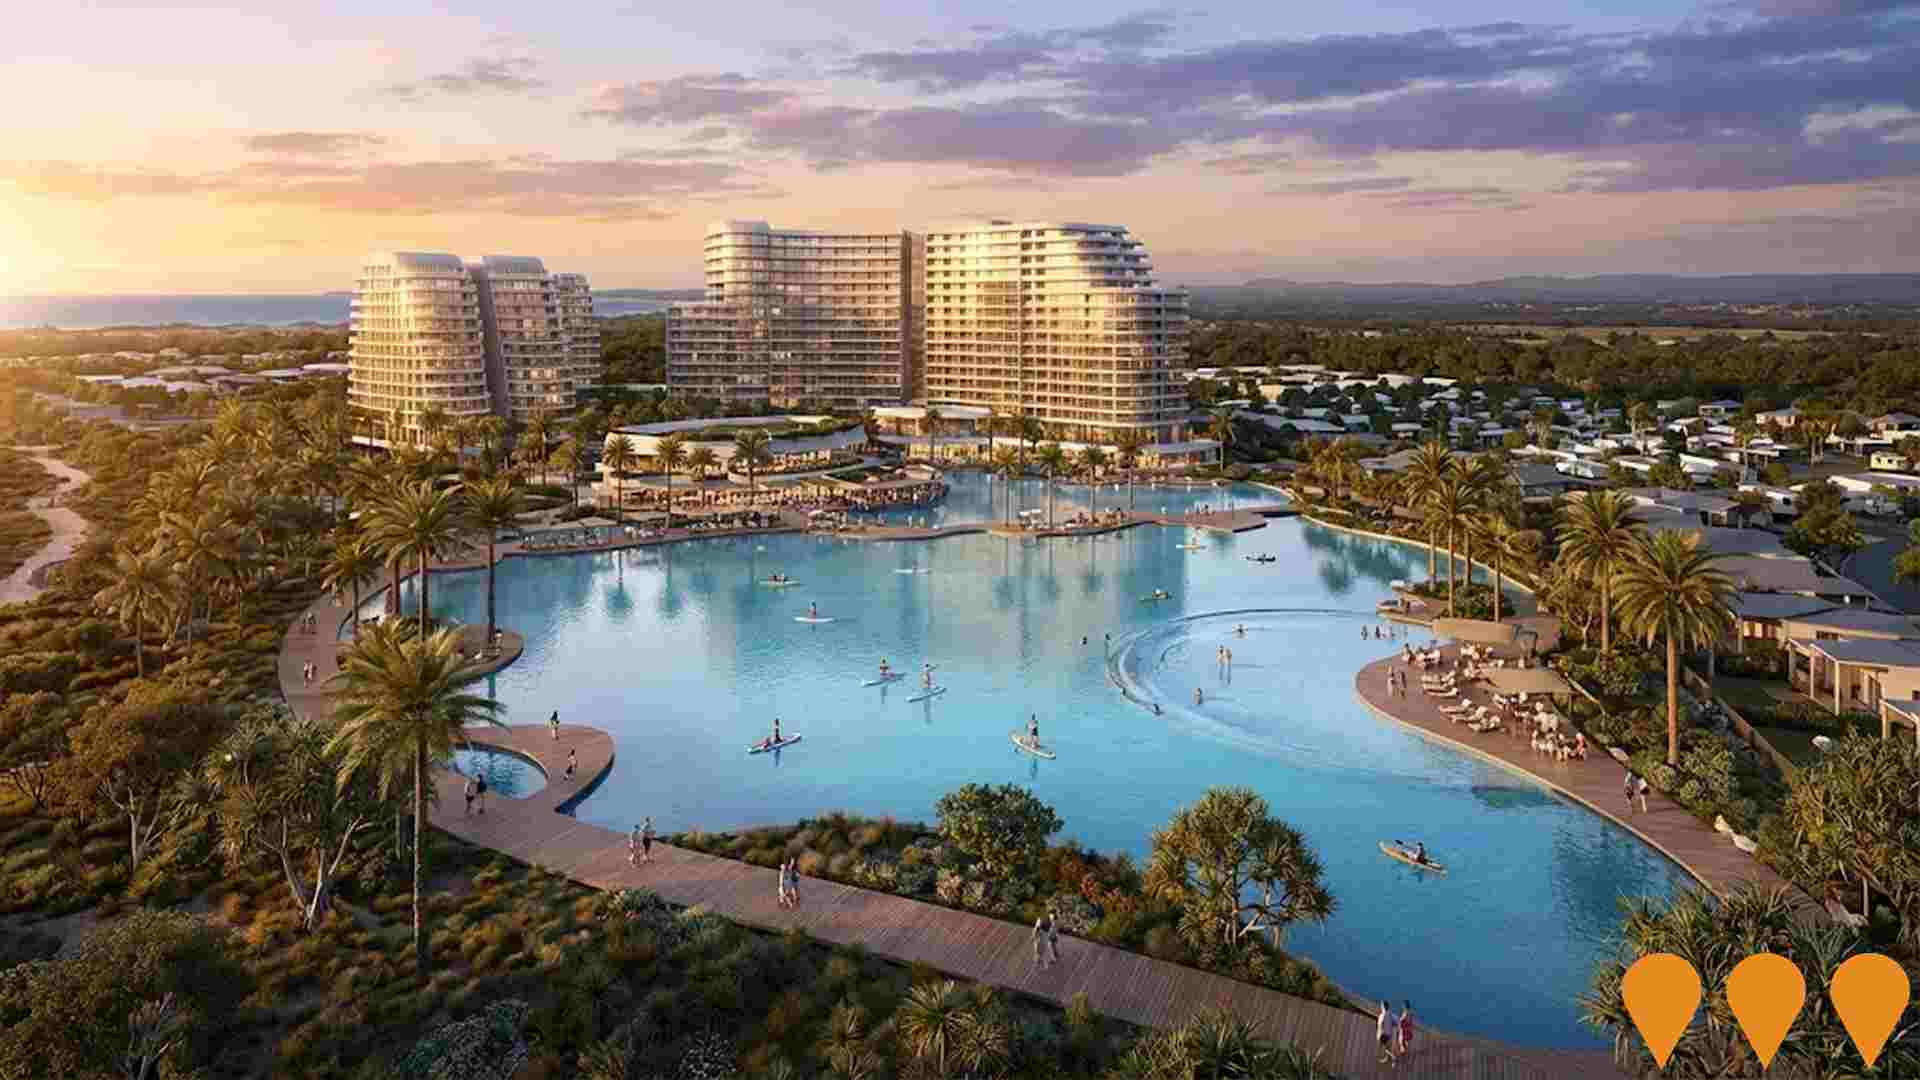
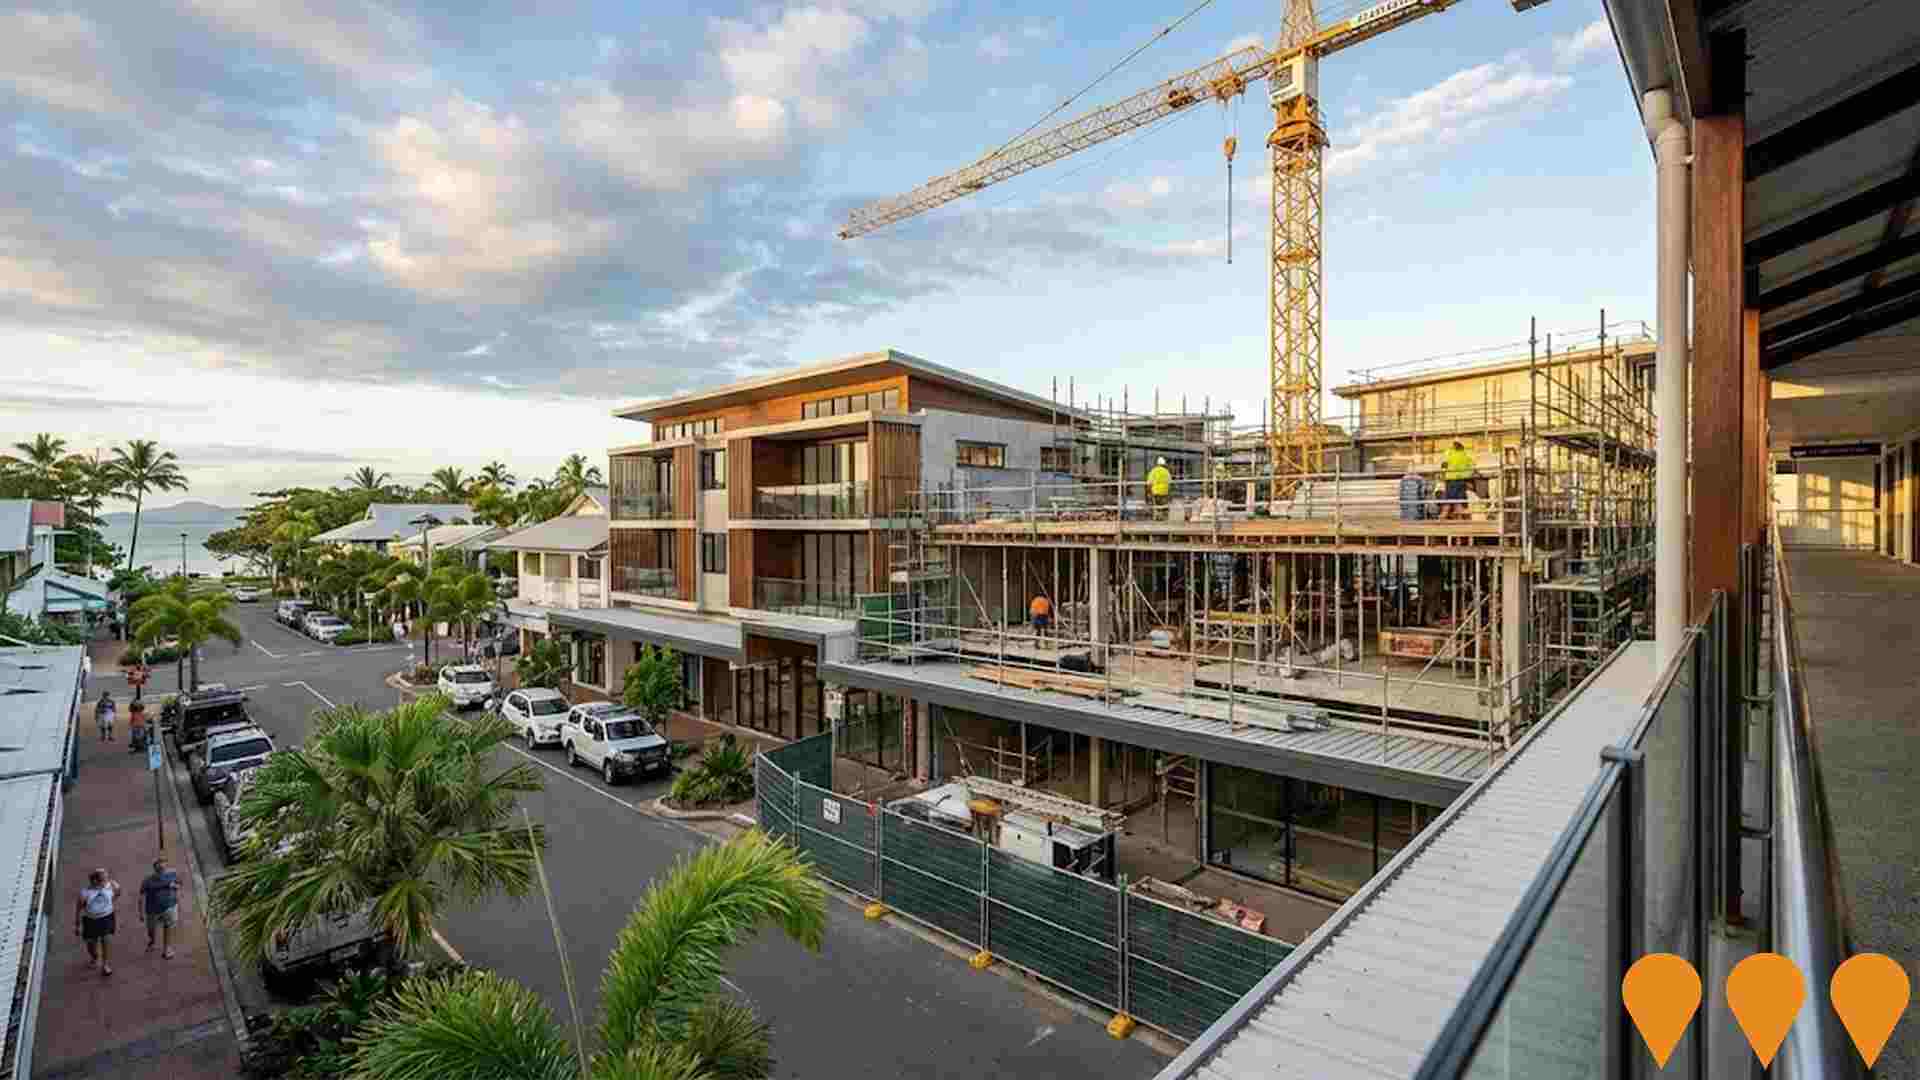
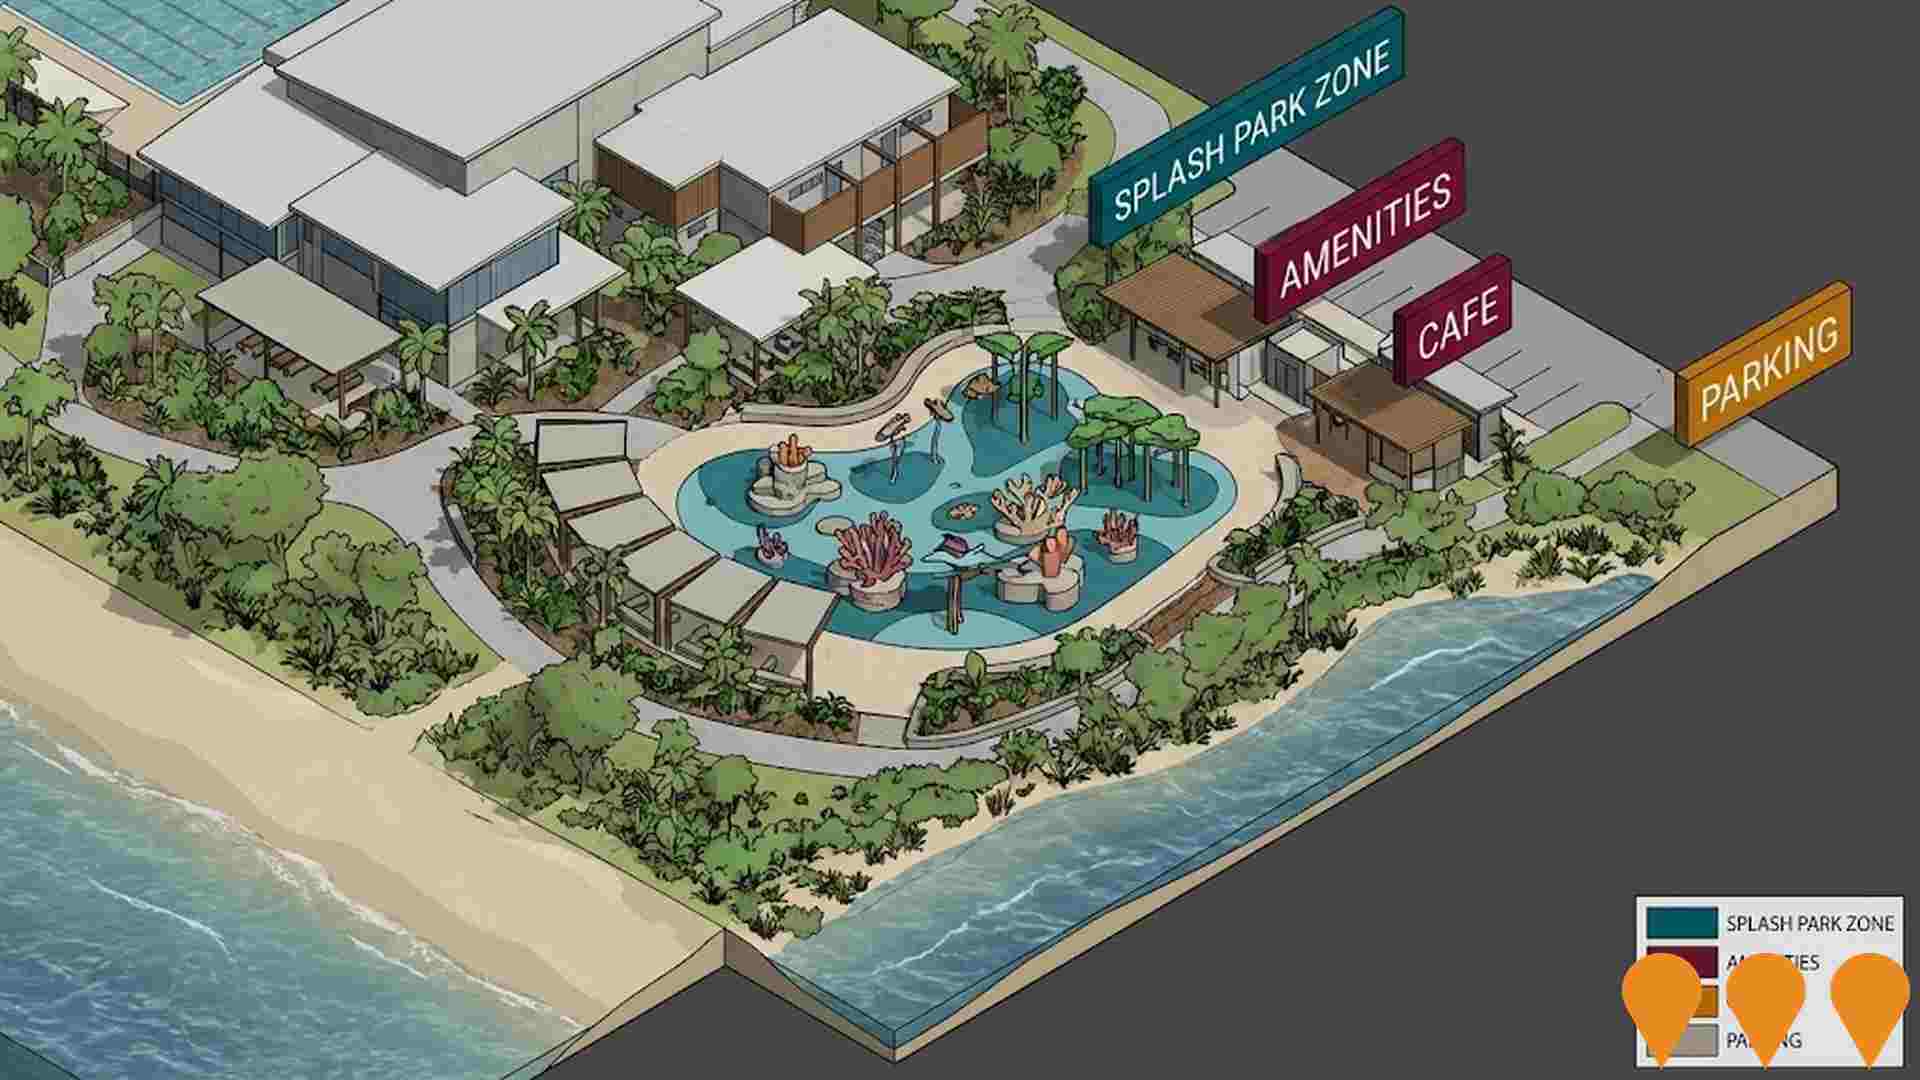
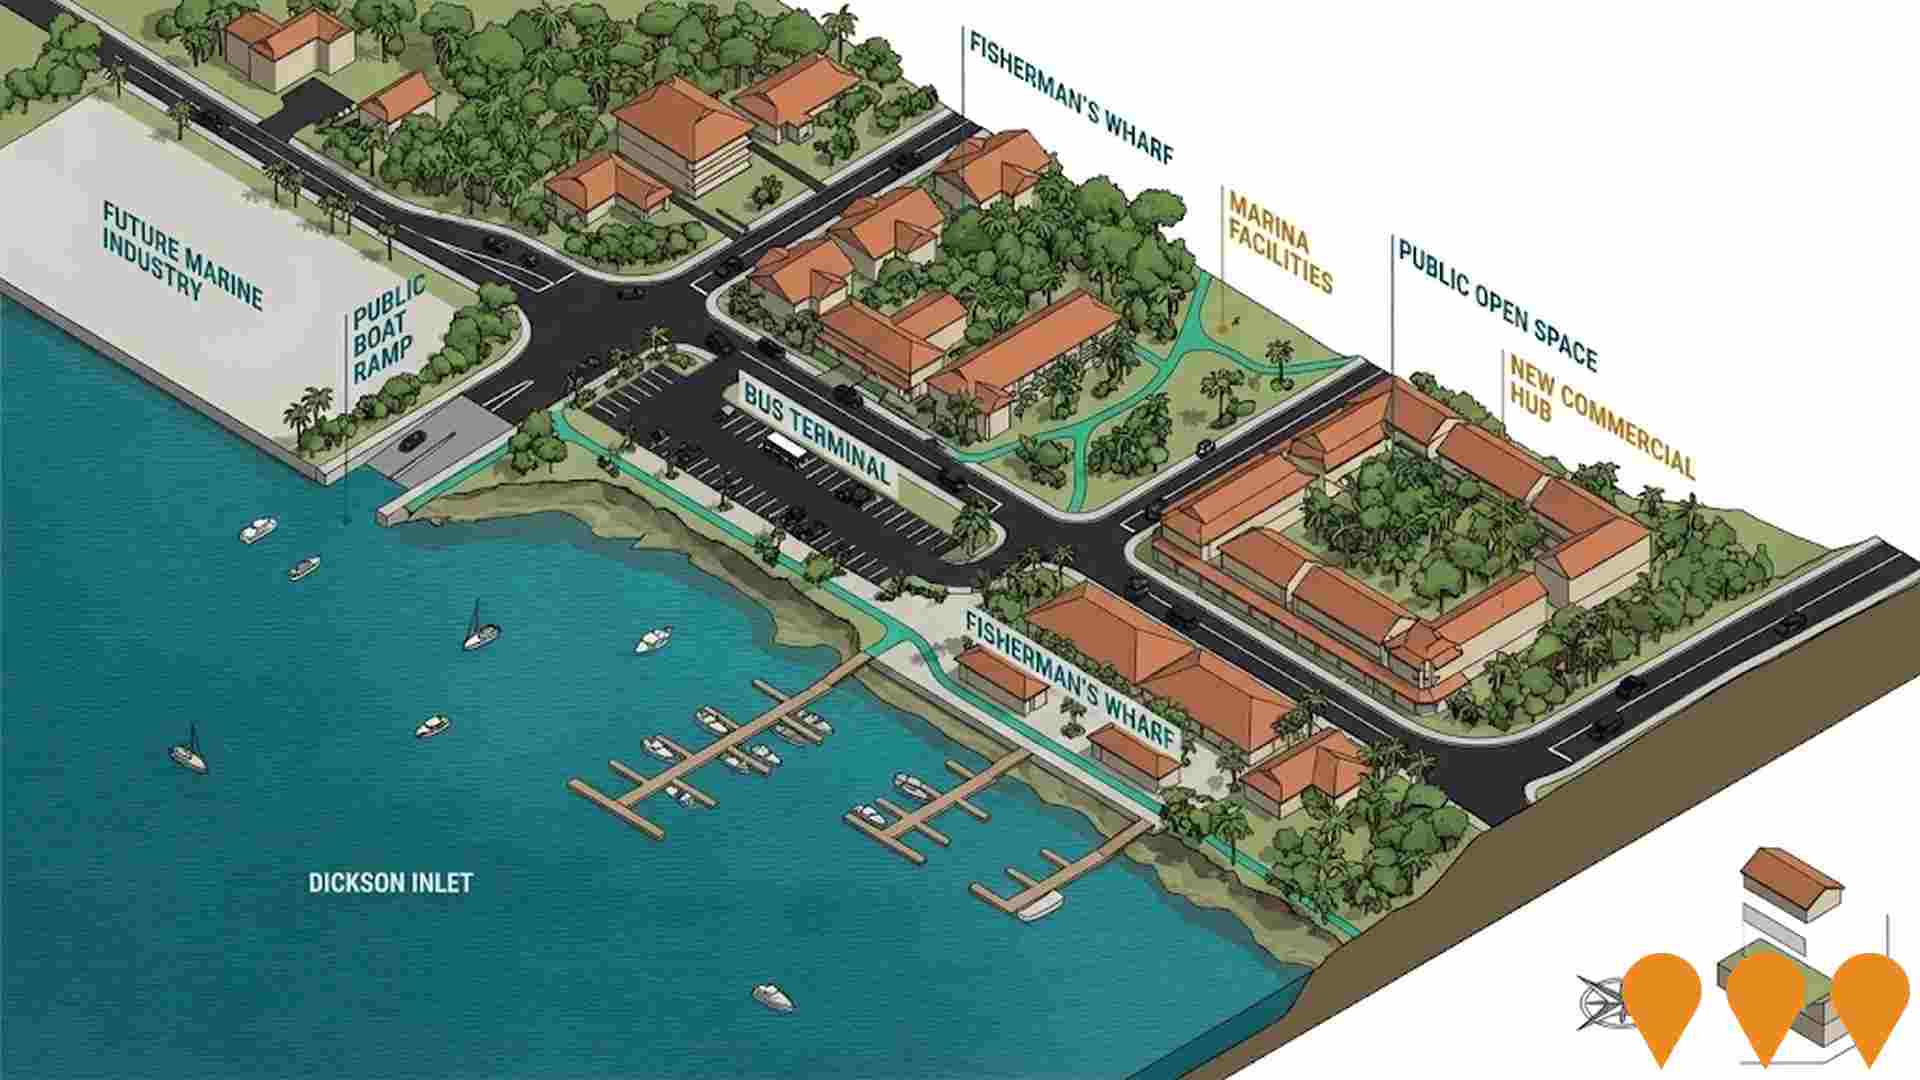
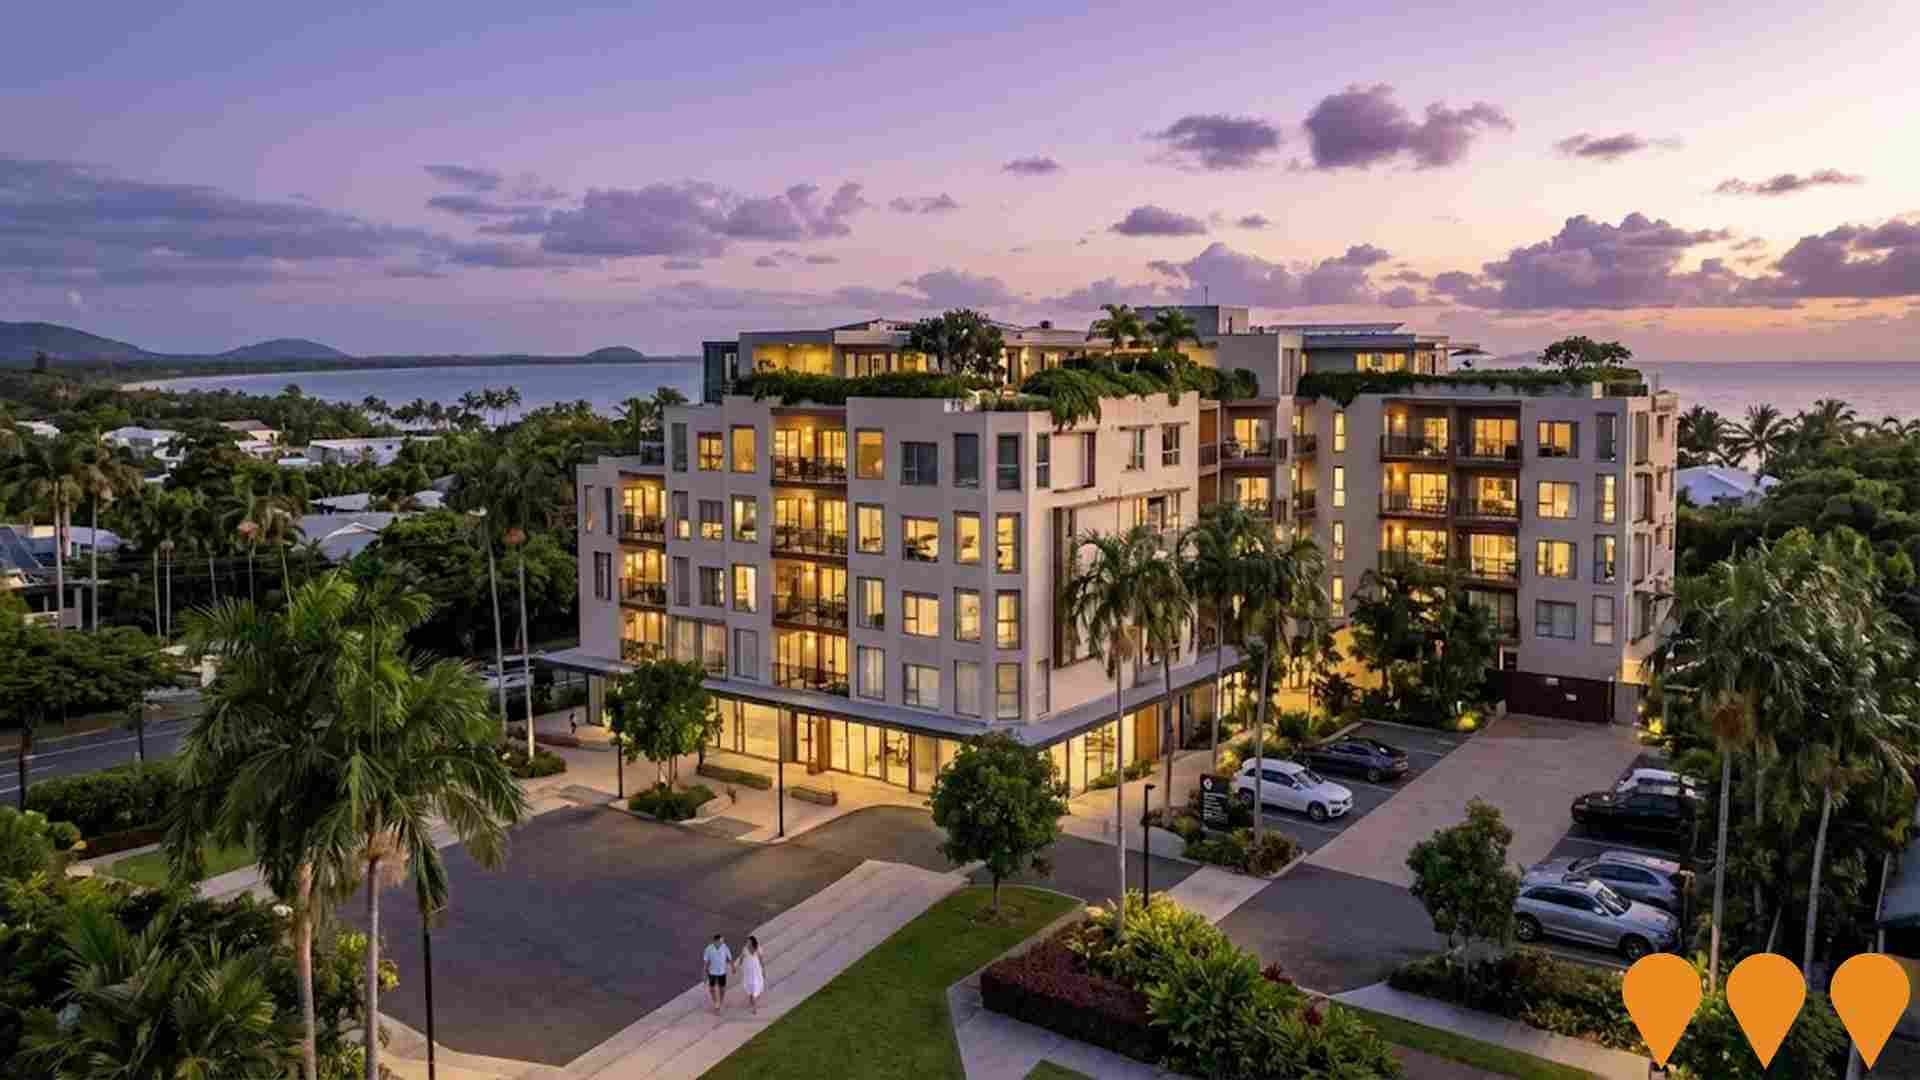
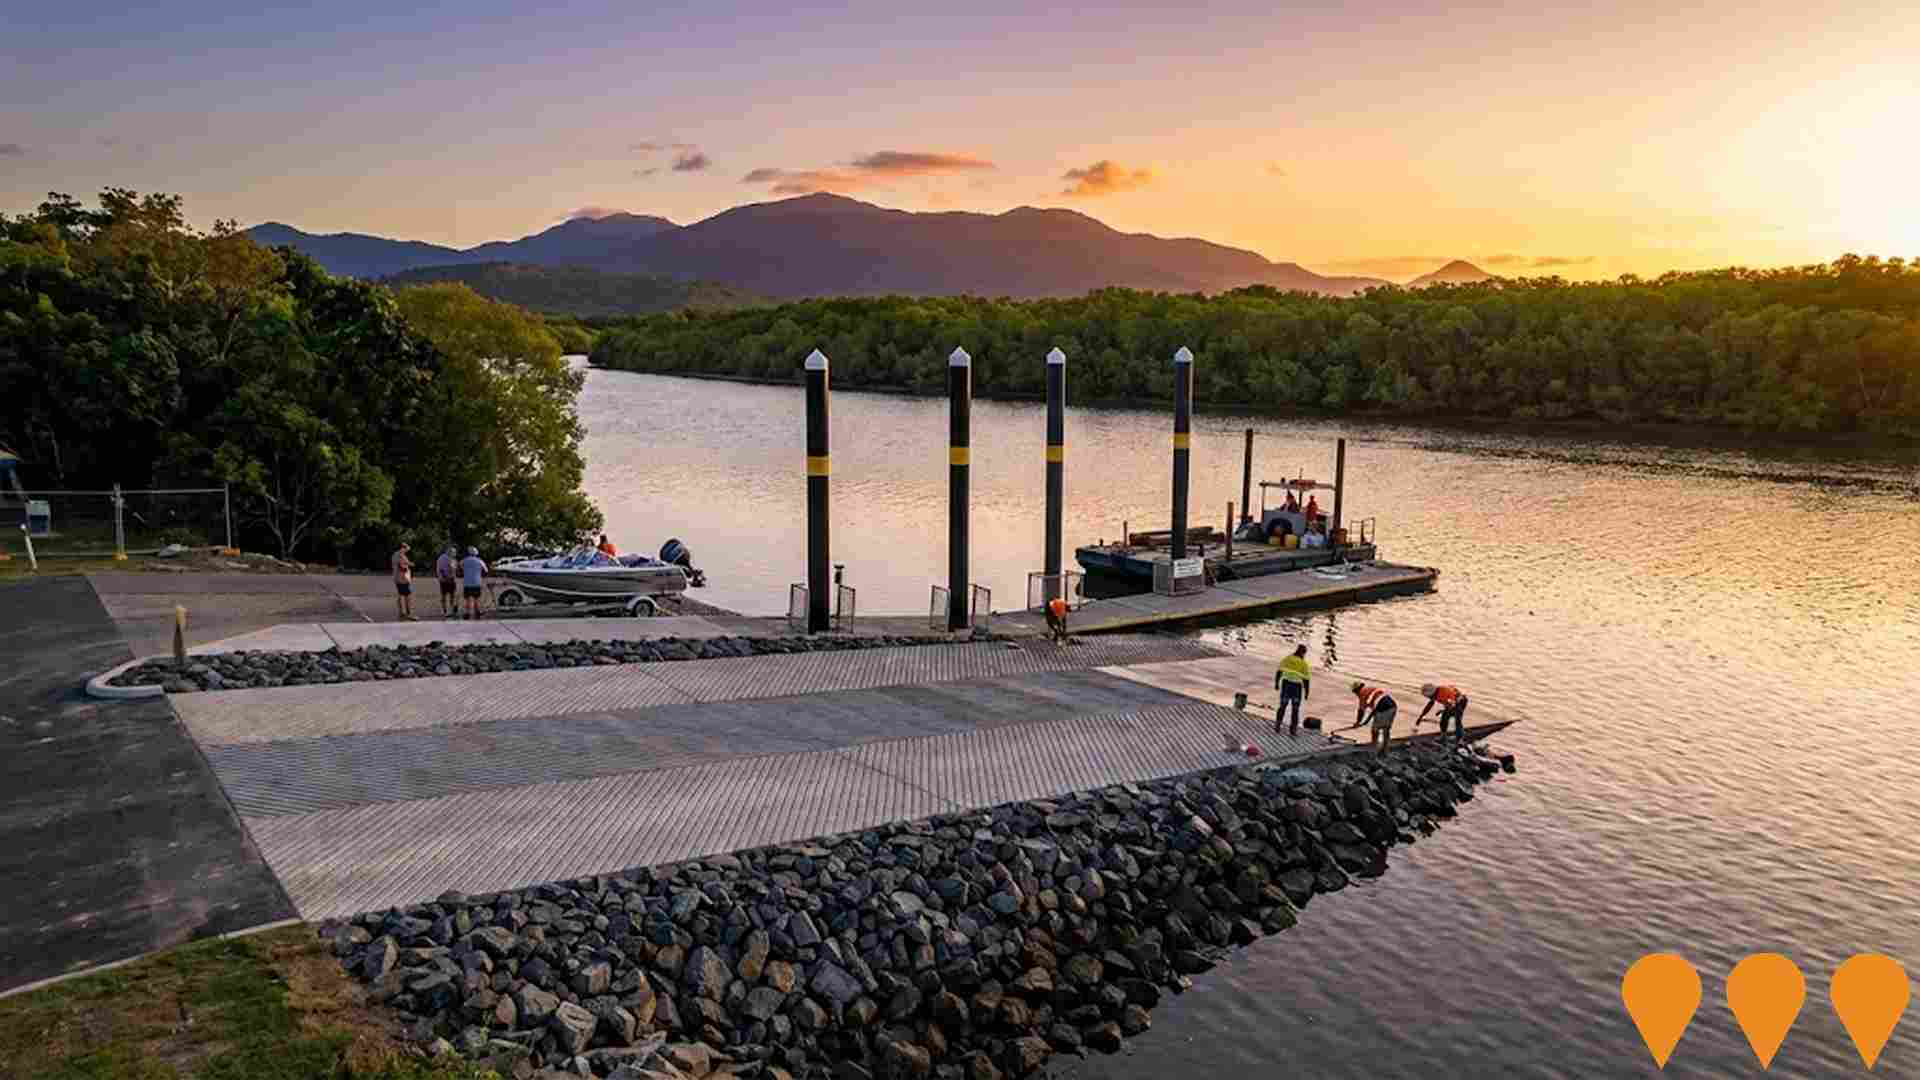
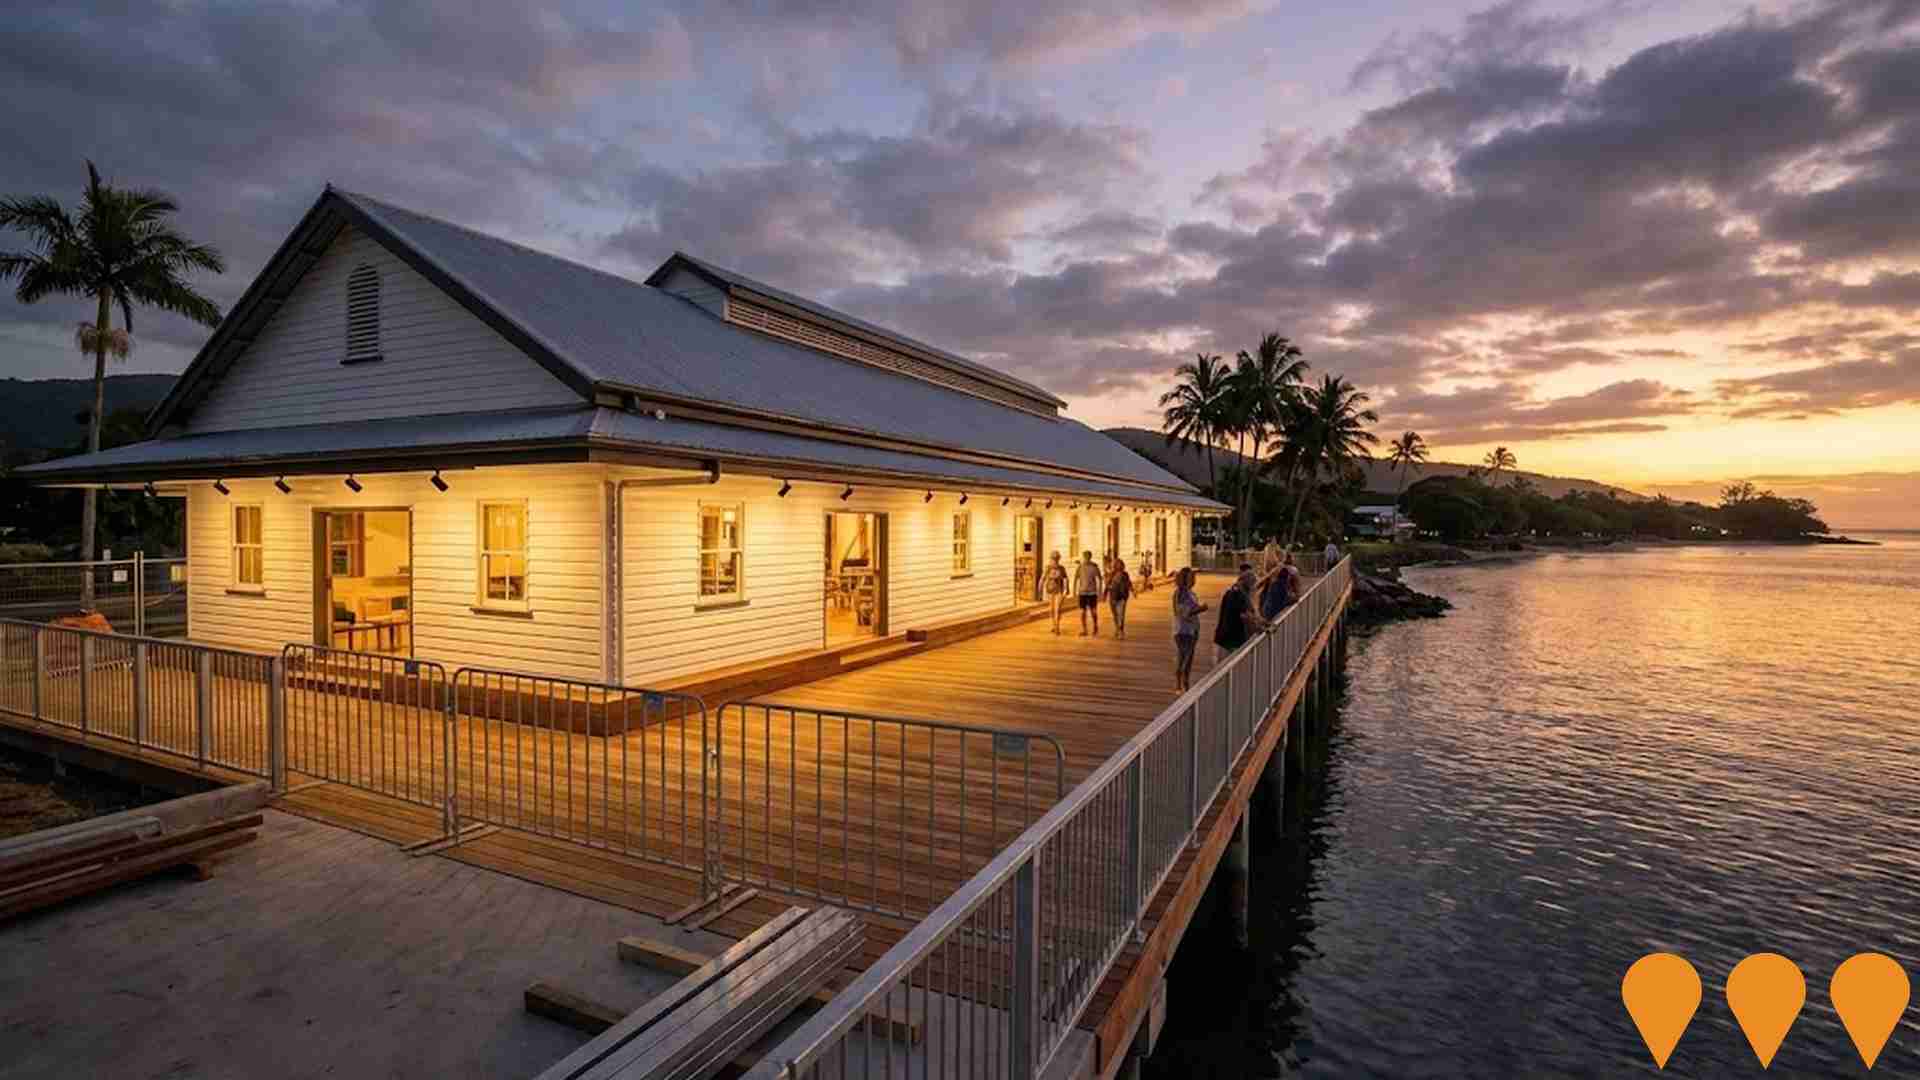
 Denotes AI-based impression for illustrative purposes only, not to be taken as definitive under any circumstances. Please follow links and conduct other investigations from the project's source for actual imagery. Developers and project owners wishing us to use original imagery please Contact Us and we will do so.
Frequently Asked Questions - Infrastructure
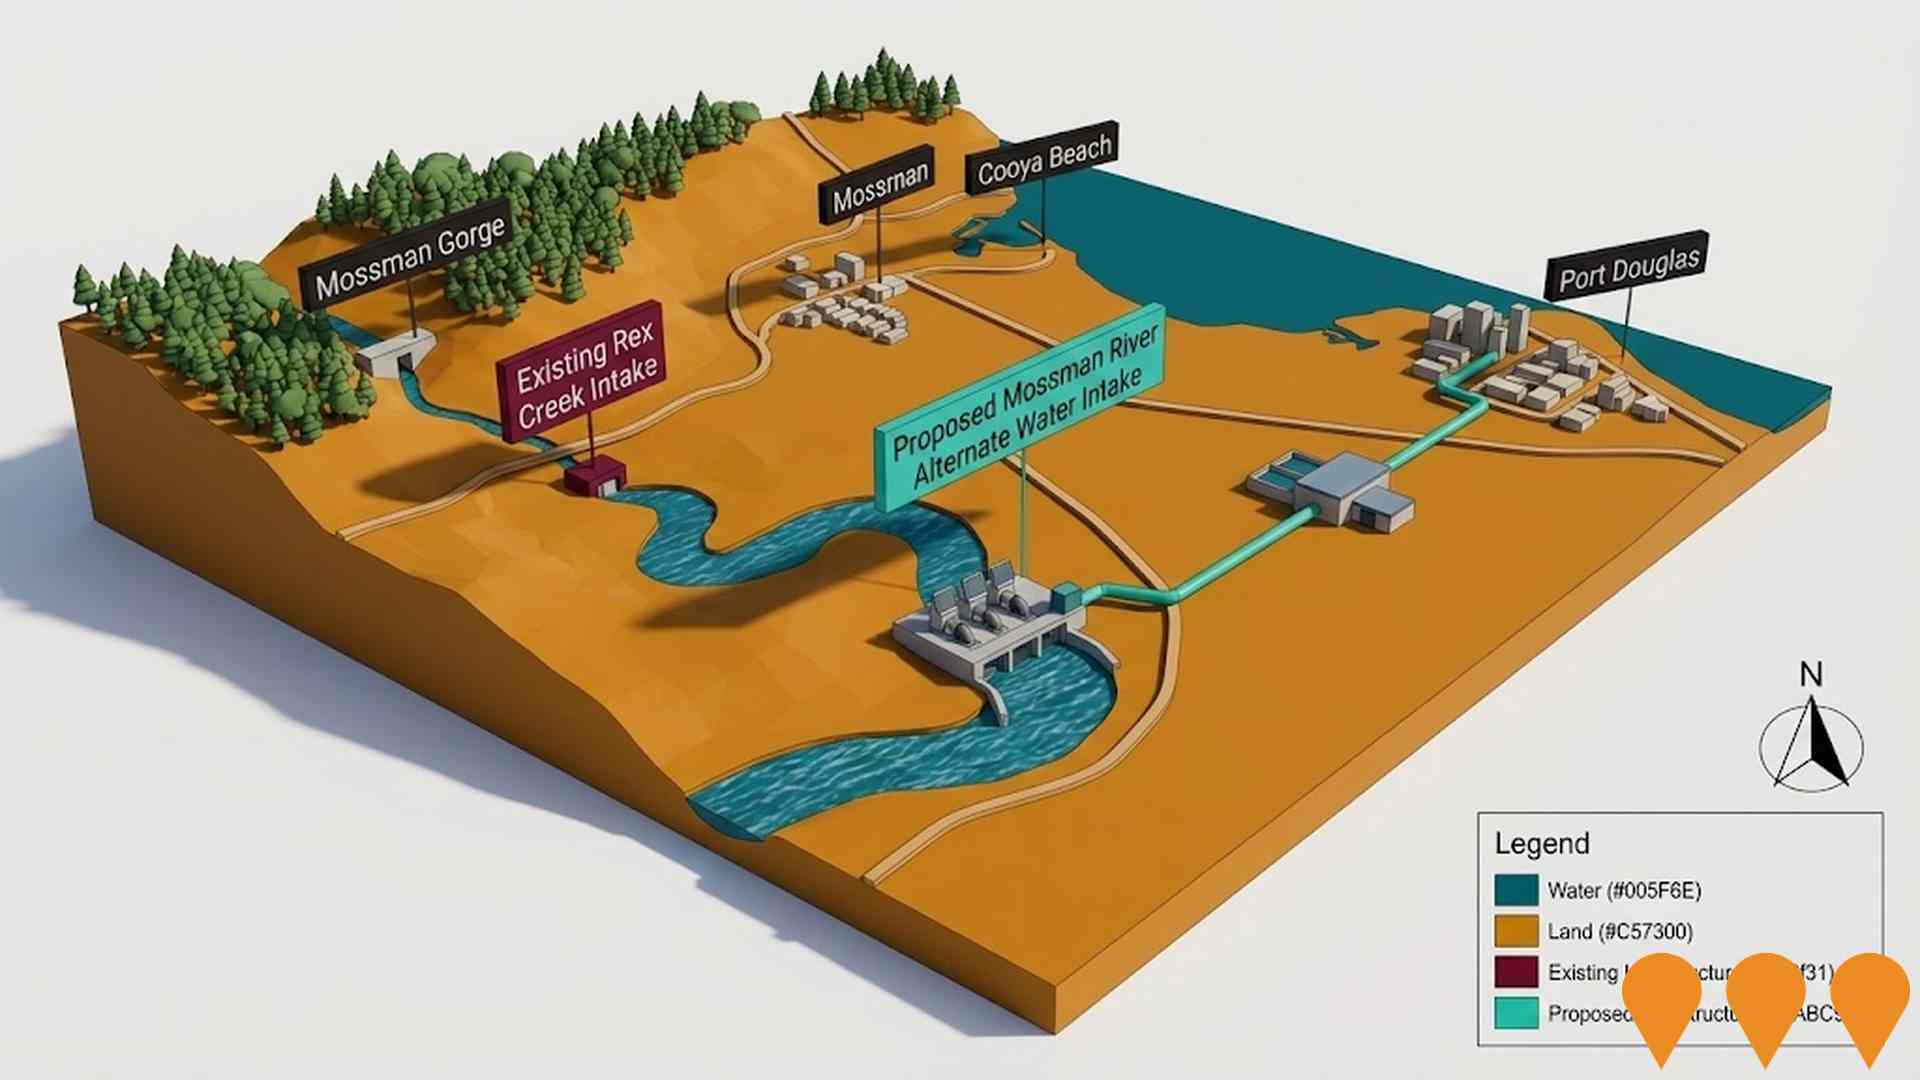
Mossman River Intake (Alternate Water Intake Project)
Council-led project to add a second raw water intake on the Mossman River (adjacent to the Drumsara site) to supplement the existing Rex Creek intake and improve drought and disaster resilience for Port Douglas, Craiglie and Mossman. Detailed design has been completed, external funding of $10m (state and federal) is secured toward a $16.4m total, licence application submitted in early 2025, and a pre-tender notice issued in July 2025 for detailed design, construction and commissioning.
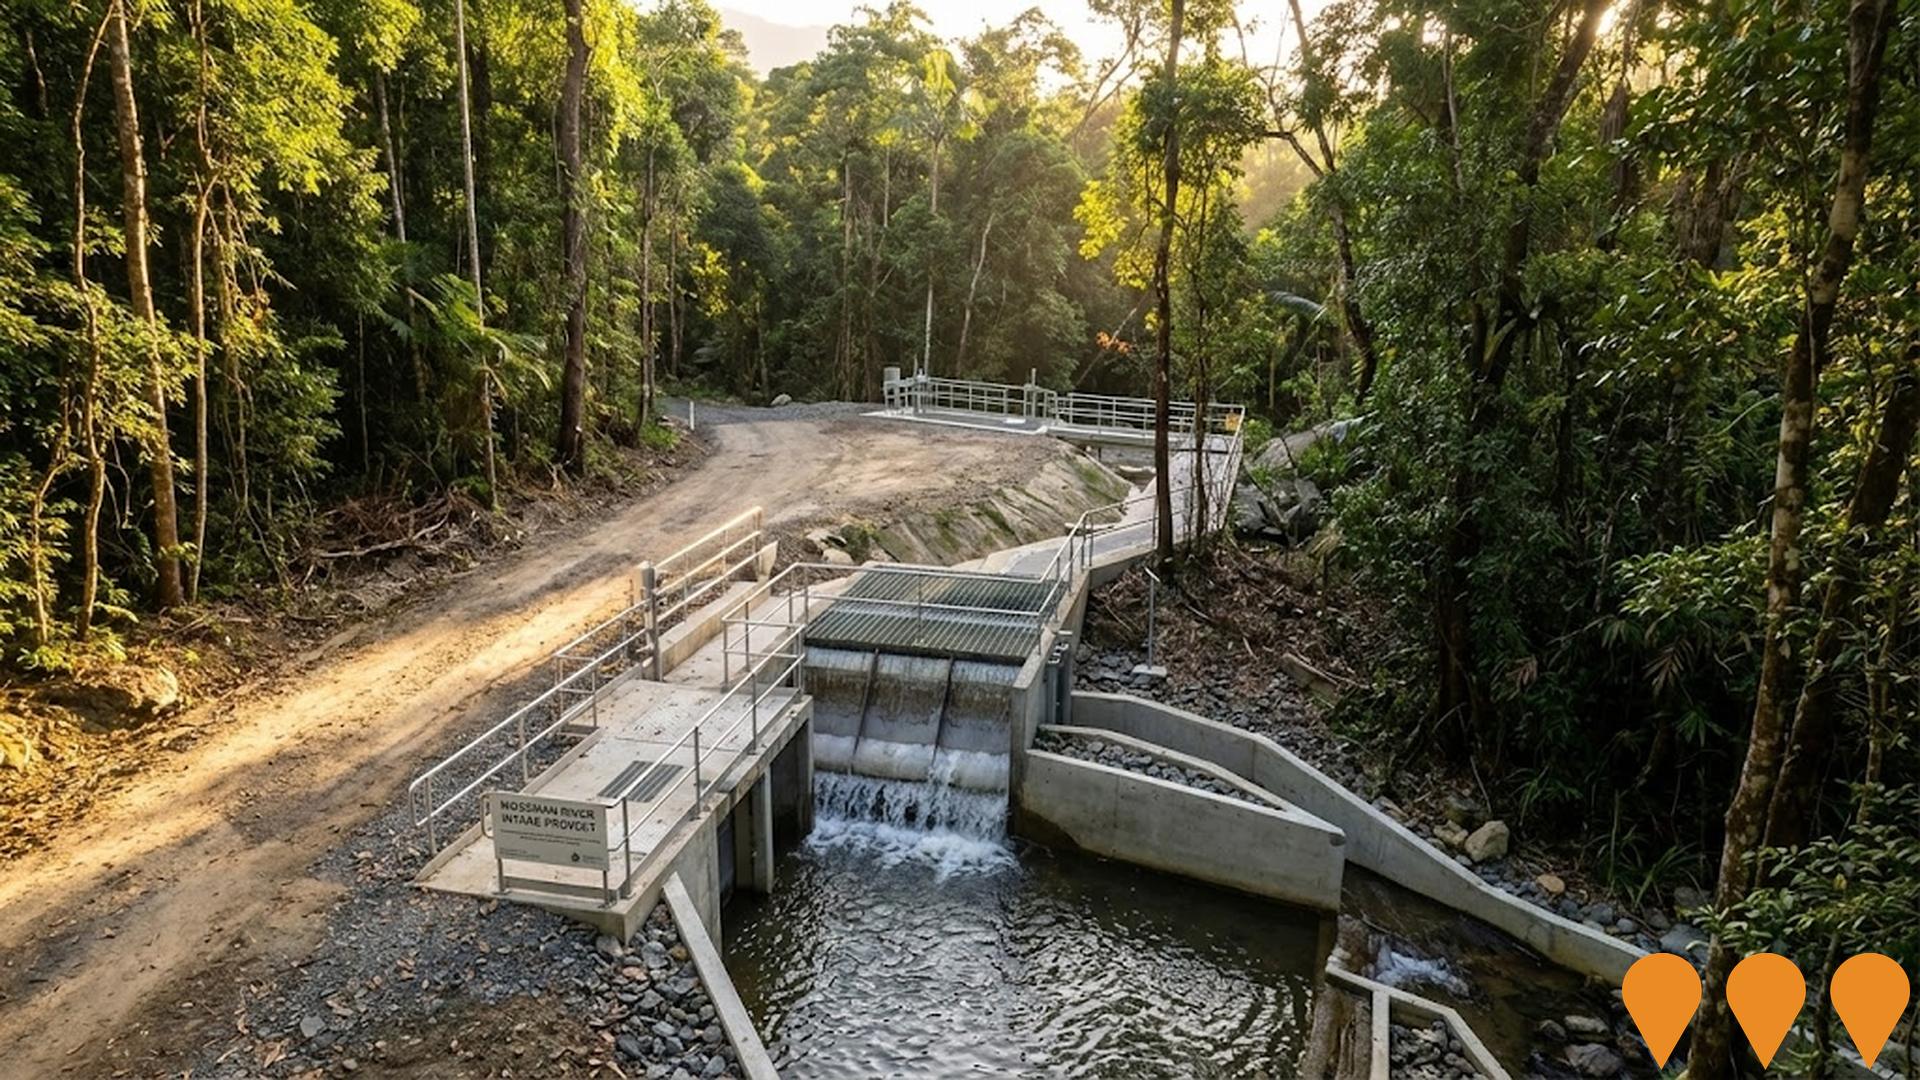
Mossman River Alternate Water Intake Project
Development of a second water intake on the Mossman River, approximately 5 km downstream of the Mossman Gorge Visitors Centre, to improve water security and resilience for the Mossman-Port Douglas catchment. The project is a key part of the Douglas Shire Council's Water Security Strategy and is required to supplement the existing Rex Creek intake, particularly during dry seasons and high turbidity events (e.g., after Tropical Cyclone Jasper). The design was completed in 2020 and is currently being reviewed and updated. Council intends to issue a Request for Tender in August 2025, with a construction contract awarded in January 2026. The estimated construction completion is June 2027.
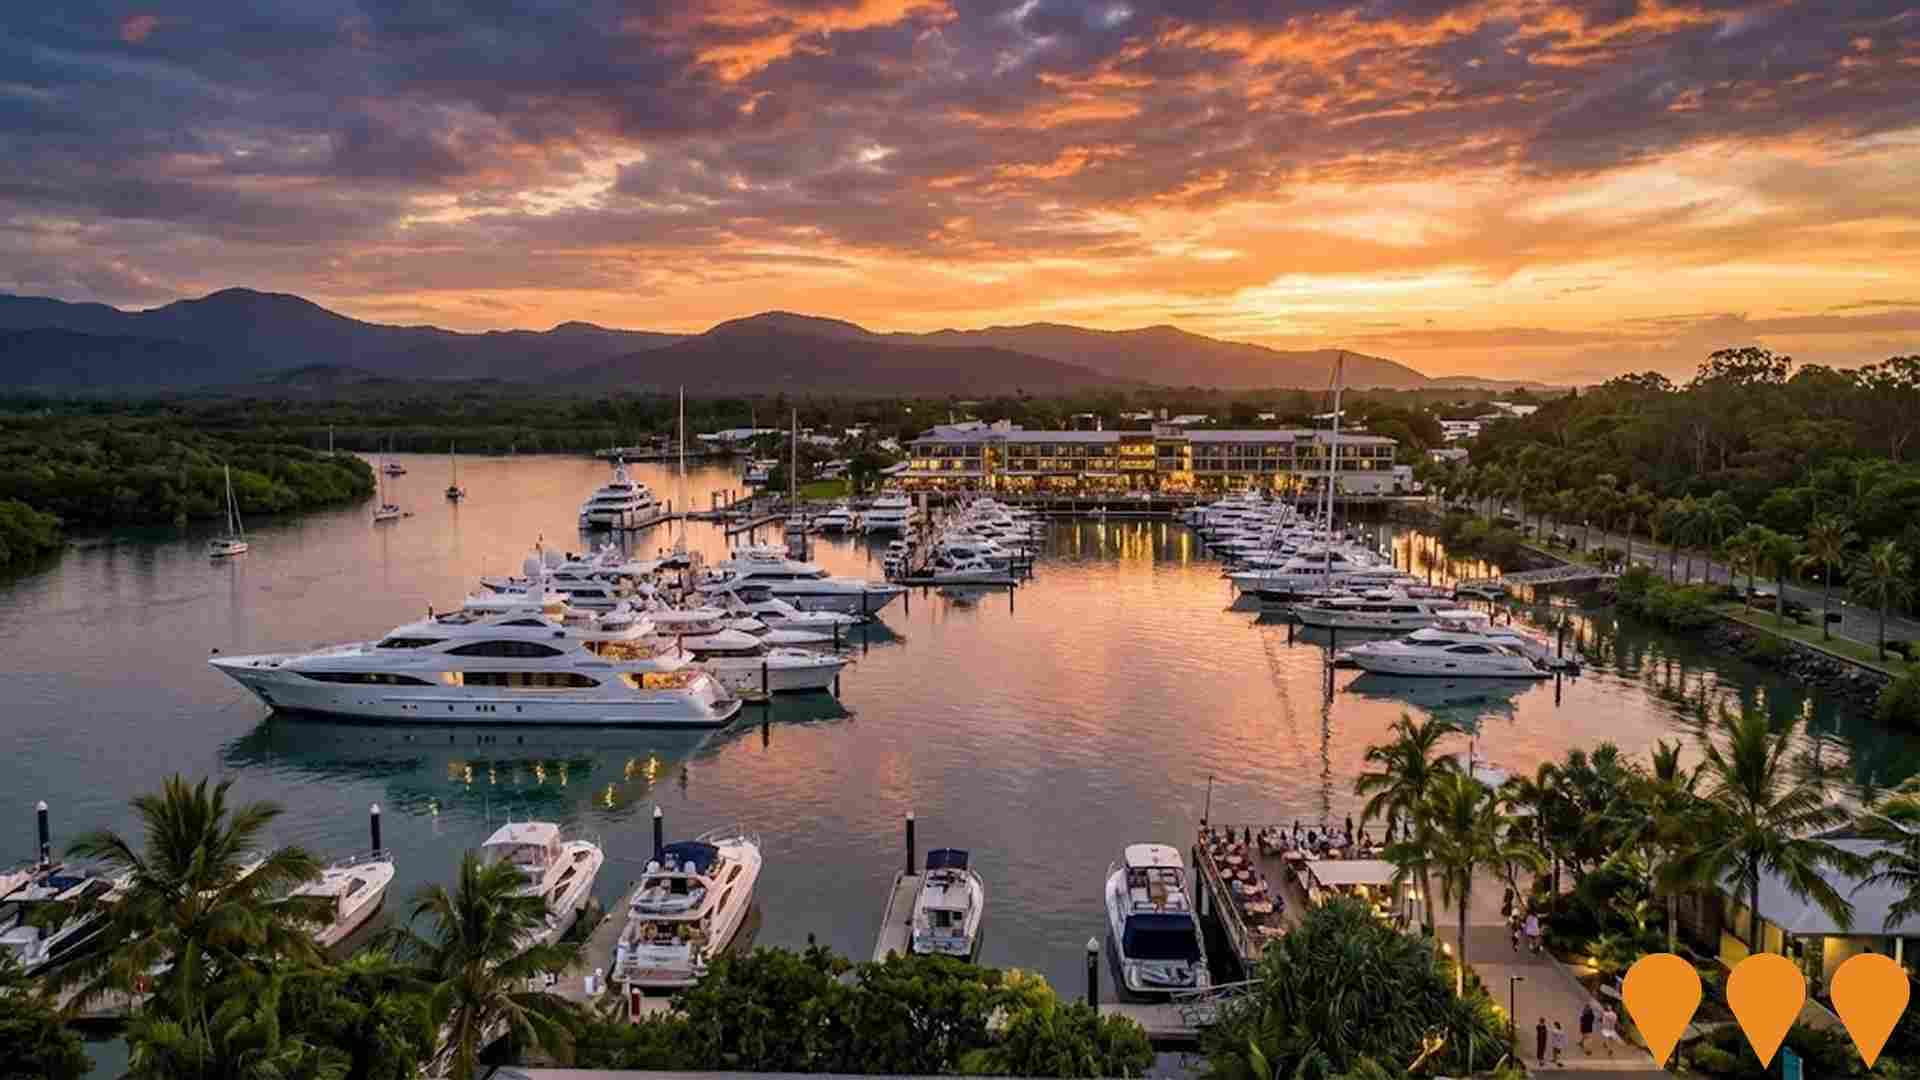
Crystalbrook Superyacht Marina Redevelopment
Proposed mixed-use renewal of the Port Douglas marina into a modern waterfront precinct, including a 5-star hotel, new superyacht berths, dining and retail, and a limited number of residences. Earlier development applications were withdrawn and the asset was marketed for sale in 2024; the marina continues operating while long-term redevelopment options are reviewed.
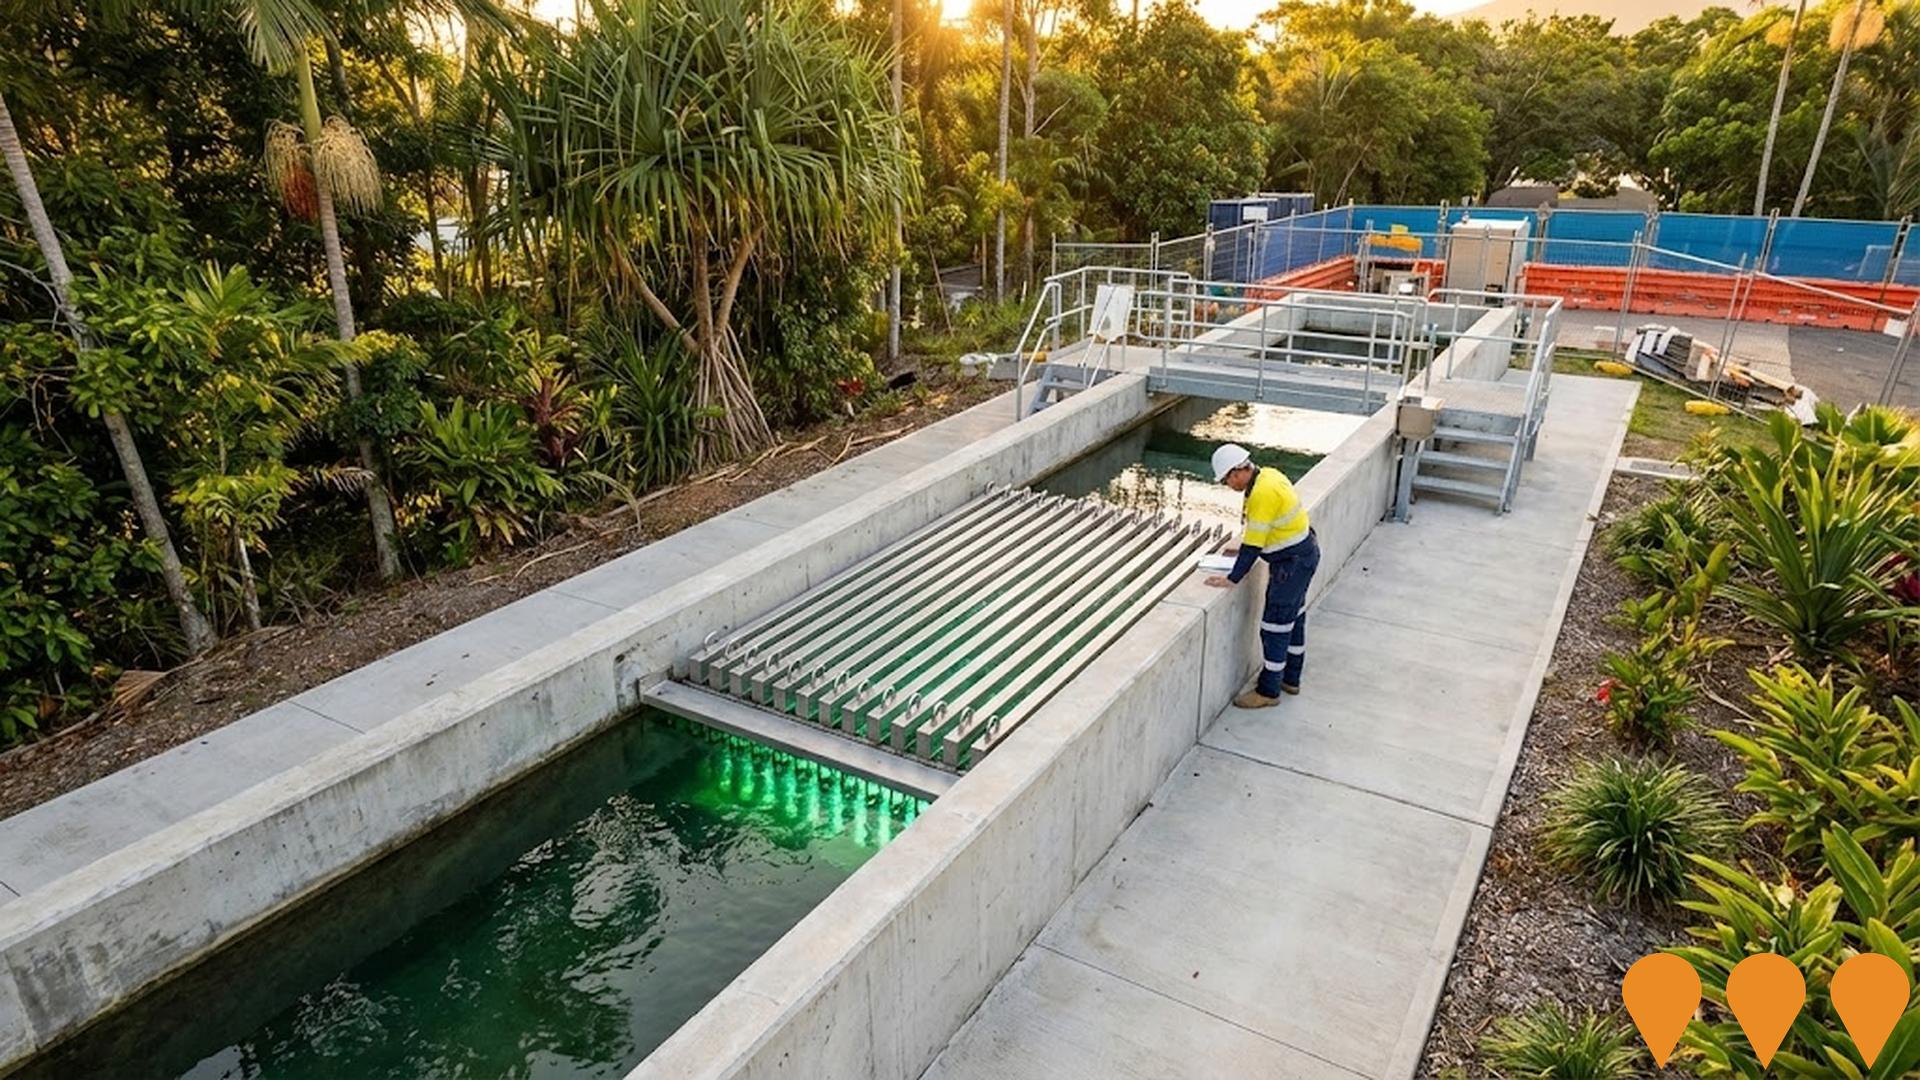
Port Douglas Wastewater Treatment Plant Ultraviolet Disinfection System Replacement Project
Replacement of the damaged ultraviolet disinfection system at the Port Douglas Wastewater Treatment Plant following an electrical fire in April 2024. A contractor has been engaged; planning and procurement commenced with an operational deadline of 3 February 2025 to restore final disinfection for recycled/discharge quality and improve reliability and efficiency.
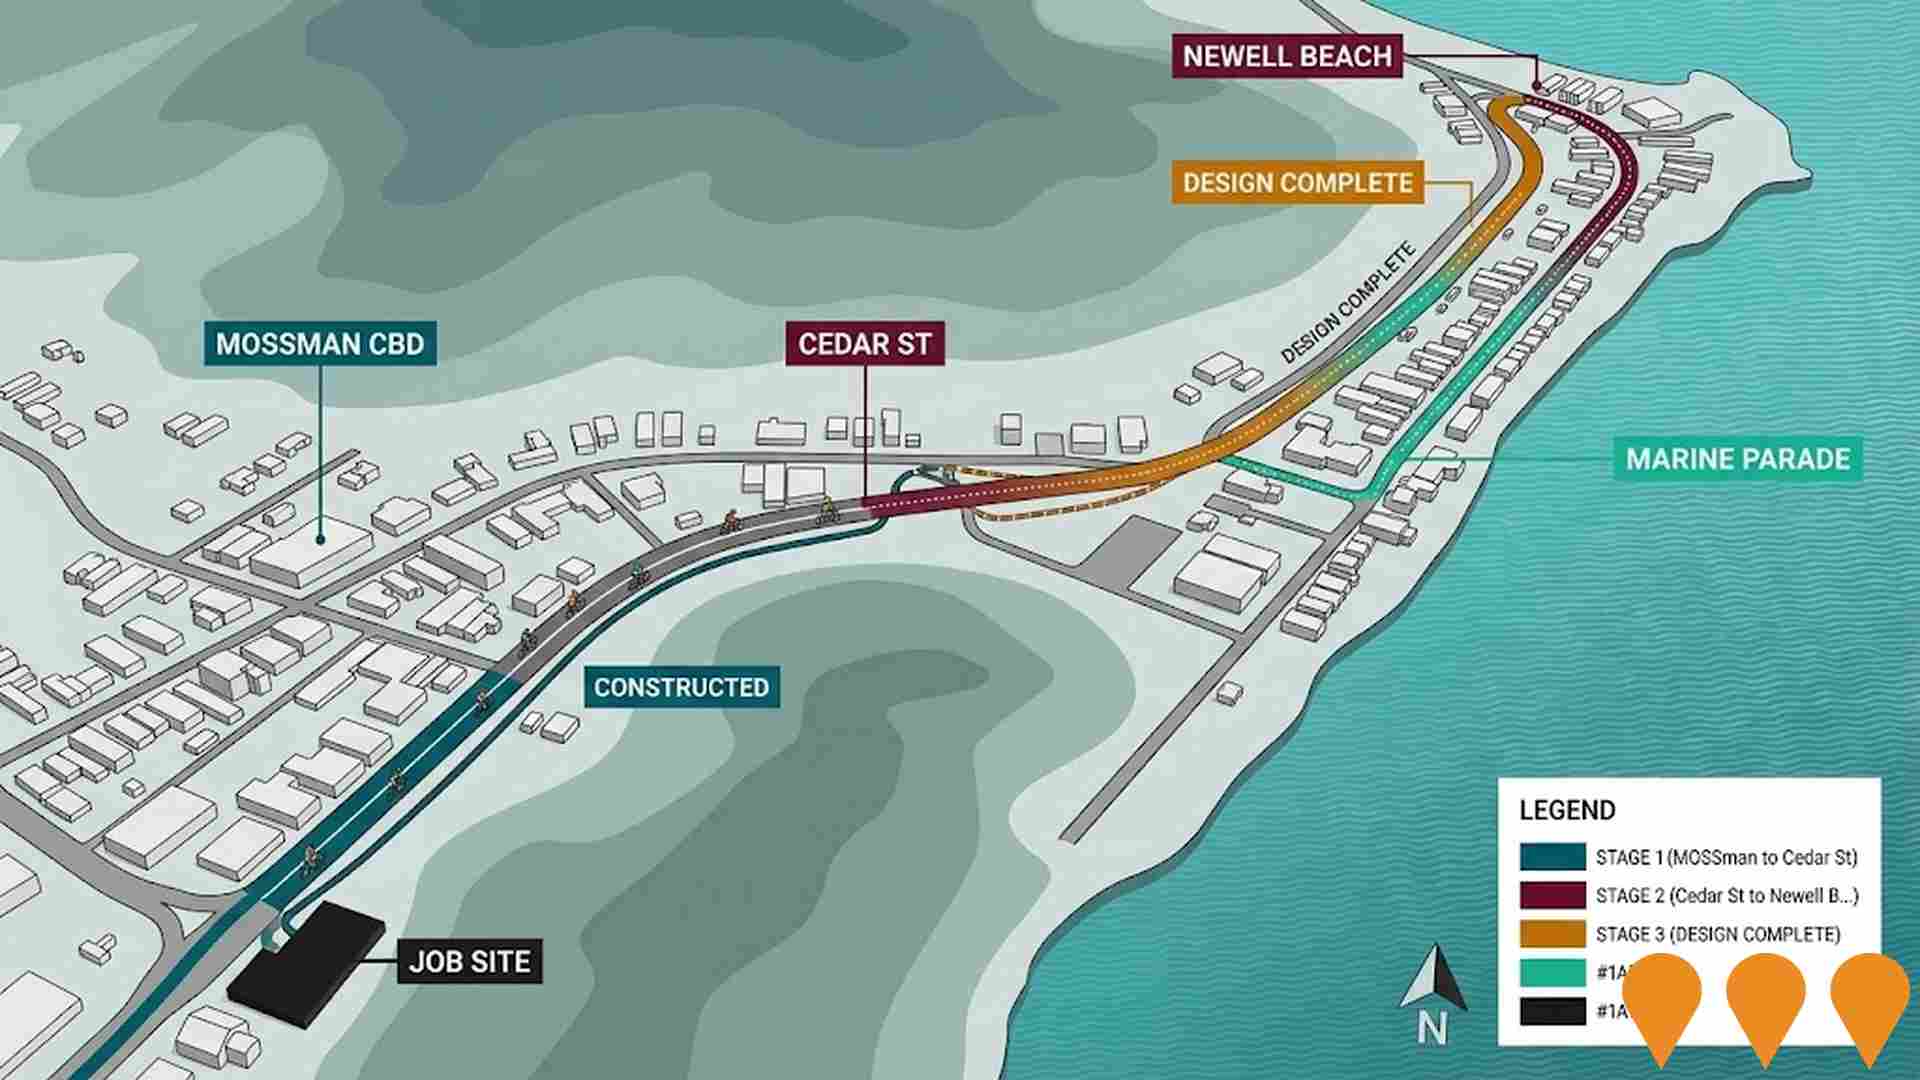
Principal Cycle Network - Mossman to Newell Beach
Construction of a 5.2km wide shared cycleway, a key priority of the Far North Queensland Principal Cycle Network Plan, connecting Mossman CBD to Newell Beach. The route is categorised into three stages: Stage 1 (Mossman CBD to Cedar Street, North Mossman) is Constructed; Stages 2 and 3 (Cedar Street to Newell Beach intersection, and Newell Beach intersection to Marine Parade) have Design Complete status, with funding for construction still to be sourced.
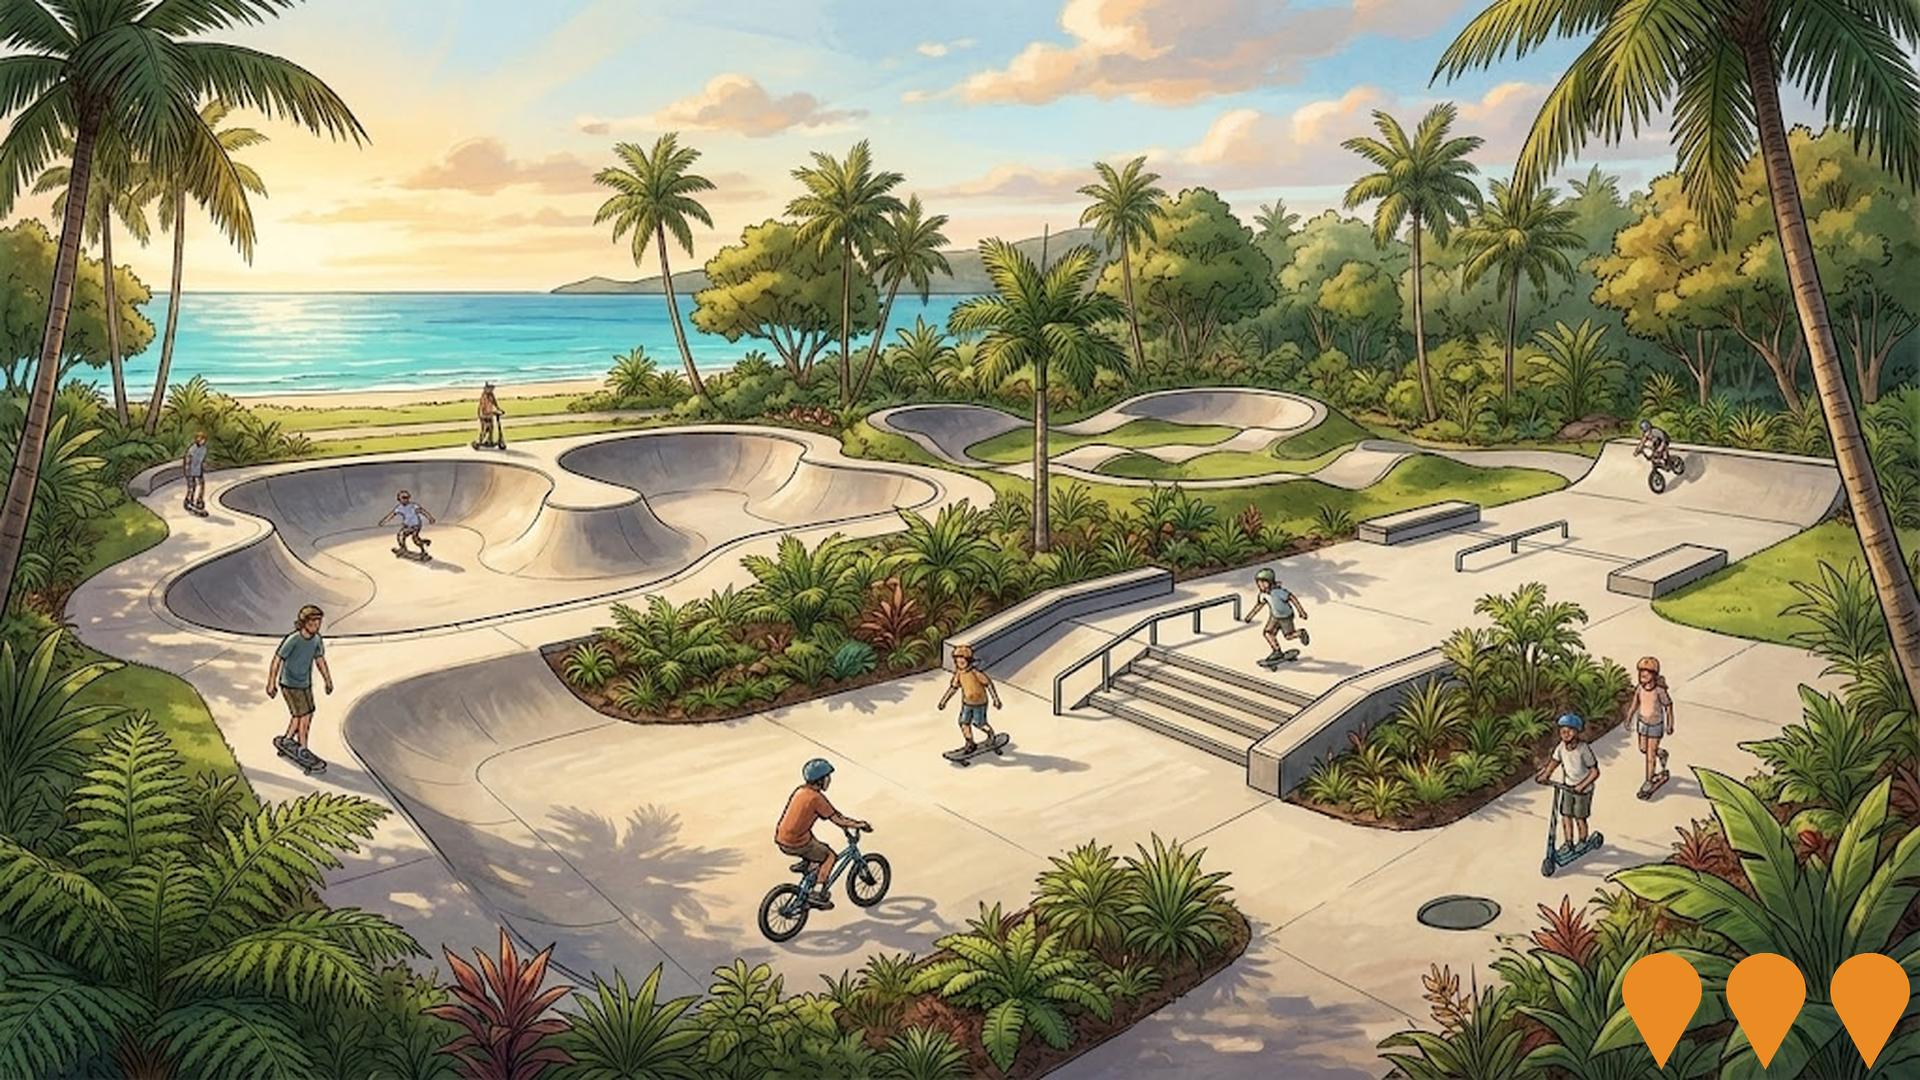
Port Douglas Skatepark Replacement
Replacement of the existing Port Douglas Skatepark with a new design developed in consultation with the community. The project has completed the design phase and is awaiting successful government grants for the construction stage. The next expected grant application is due in early 2025.
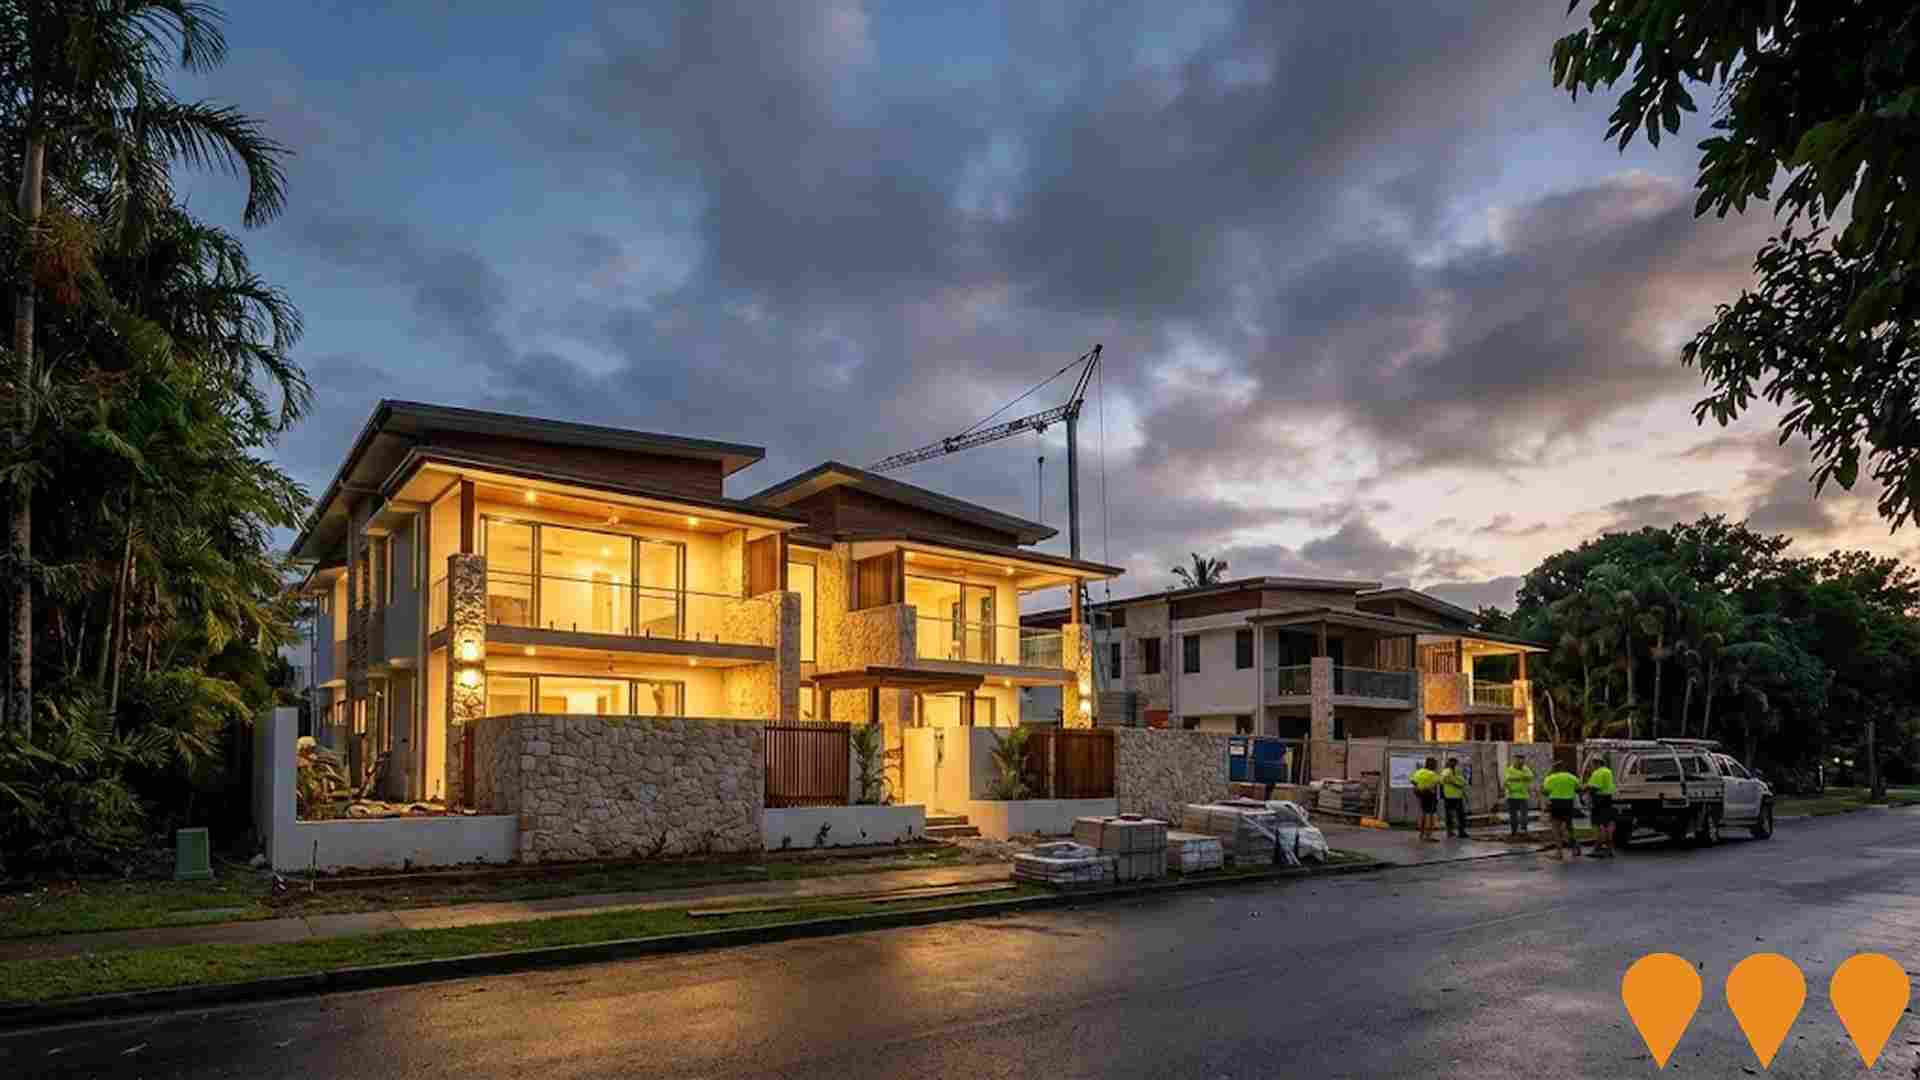
KAYA VILLAS
Four luxury freehold villas (each four bedrooms with private pool) on individual titles with no body corporate fees, located on Warner Street in central Port Douglas. DA approved with construction underway; one villa previously marketed as remaining for sale. Target completion indicated for late 2025.
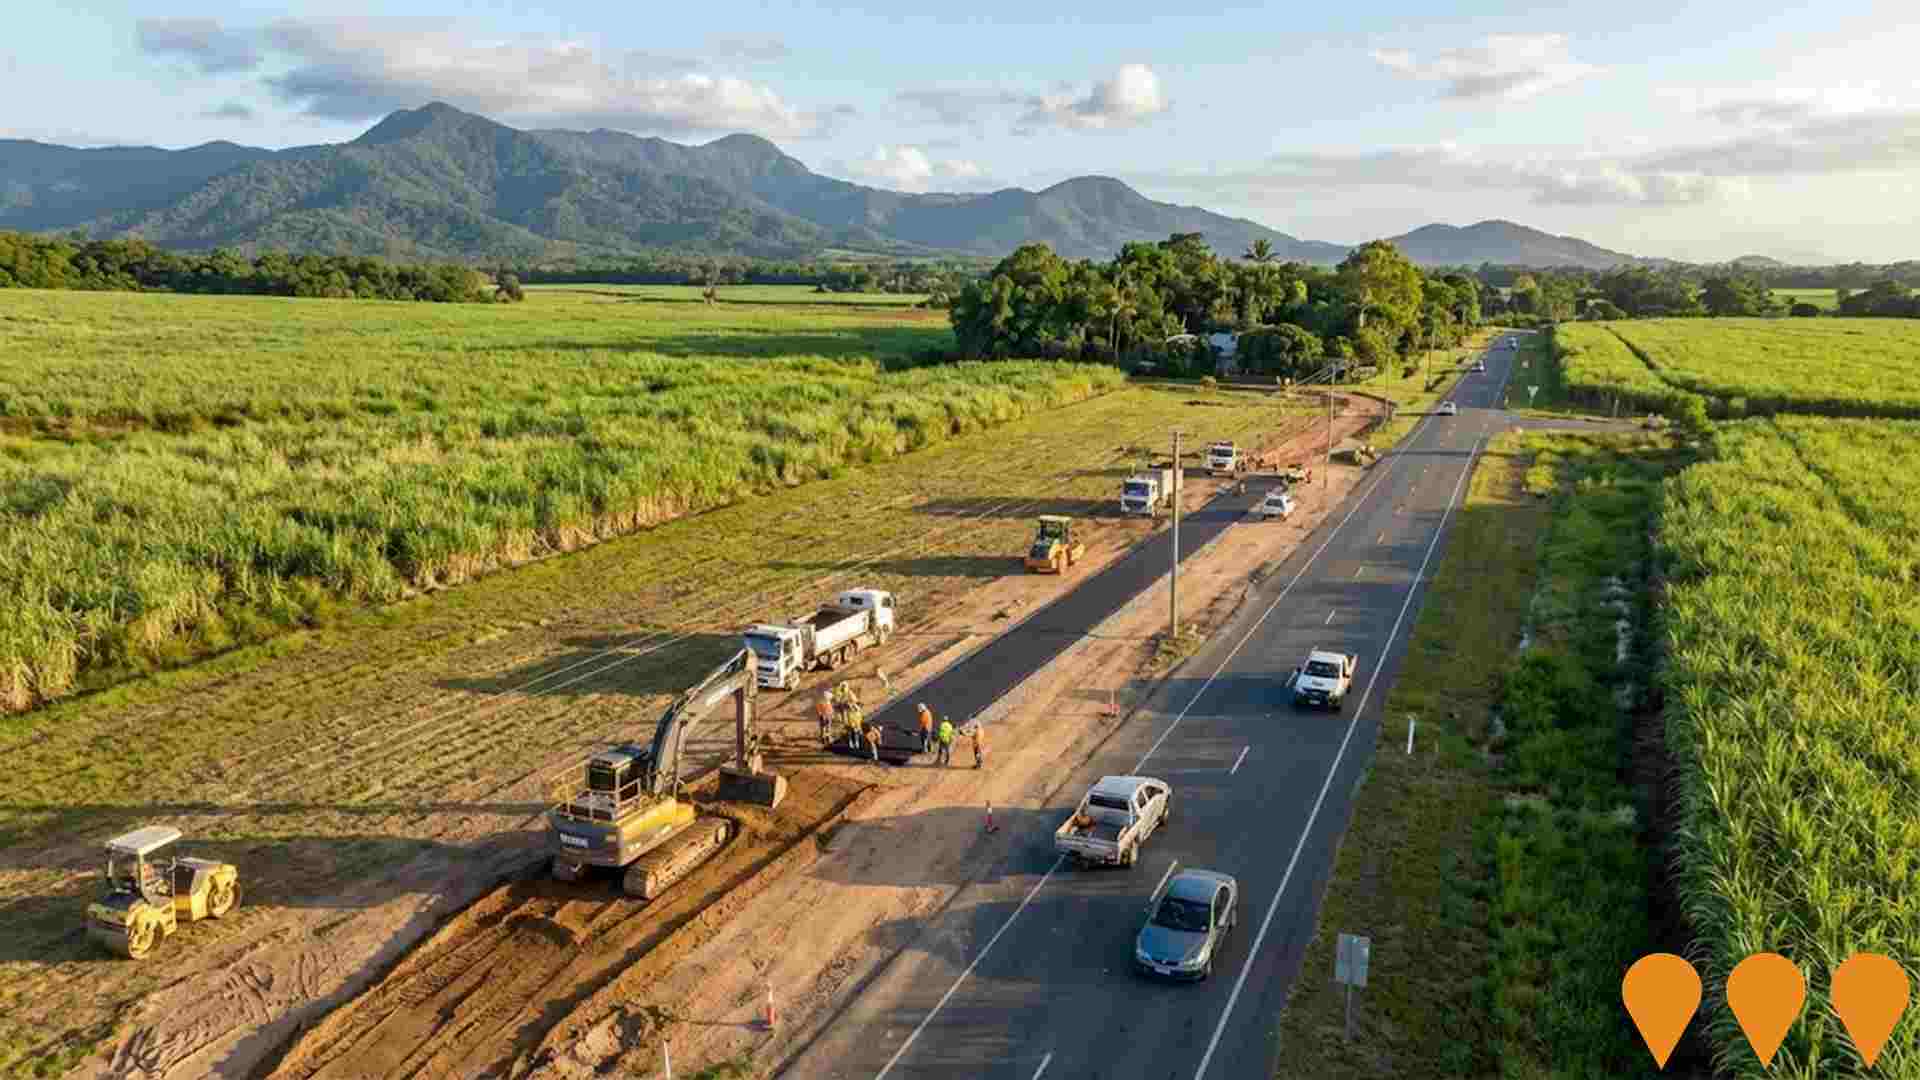
Principal Cycle Network: Cooya Beach to Mossman (stage 3) & Cooya Beach Road (stage 2)
Shared path construction to encourage active travel between Cooya Beach and Mossman.
Employment
Employment conditions in Daintree face significant challenges, ranking among the bottom 10% of areas assessed nationally
Daintree's workforce is balanced across white and blue-collar jobs, with tourism and hospitality sectors prominent. Its unemployment rate was 8.1% as of September 2025.
There were 3,253 employed residents, an unemployment rate 4.0% higher than Rest of Qld's 4.1%, indicating room for improvement. Workforce participation was lower at 55.3% compared to Rest of Qld's 59.1%. Leading employment industries included accommodation & food, retail trade, and health care & social assistance. Daintree had a strong specialization in accommodation & food (employment share 1.8 times the regional level), but limited presence in health care & social assistance (10.7% vs regional 16.1%).
The area may offer limited local employment opportunities, as Census data showed fewer working residents than expected. Between September 2024 and 2025, labour force levels decreased by 1.7%, and employment fell by 5.2%, causing unemployment to rise by 3.4 percentage points. In comparison, Rest of Qld saw employment grow by 1.7% and labour force expand by 2.1%, with a smaller unemployment increase of 0.3 percentage points. State-level data from 25-Nov-25 showed Queensland's employment contracted by 0.01% (losing 1,210 jobs), with an unemployment rate of 4.2%, closely matching the national rate of 4.3%. National employment forecasts from Jobs and Skills Australia predicted growth of 6.6% over five years and 13.7% over ten years. Applying these projections to Daintree's employment mix suggested local employment could increase by 5.7% over five years and 12.1% over ten years, though this was a simple extrapolation for illustrative purposes only.
Frequently Asked Questions - Employment
Income
Income metrics place the area in the bottom 10% of locations nationally according to AreaSearch analysis
AreaSearch's latest postcode level ATO data for financial year 2022 shows Daintree SA2 had a median income of $43,206 and an average of $51,363. This is lower than the national average. Rest of Qld had a median of $50,780 and an average of $64,844 during this period. Based on Wage Price Index growth of 13.99% since financial year 2022, estimated incomes for September 2025 would be approximately $49,251 (median) and $58,549 (average). Census 2021 data reveals Daintree's household, family, and personal incomes fall between the 13th and 19th percentiles nationally. The predominant income cohort in Daintree is 29.1% of locals (2,041 people) earning $1,500 - 2,999, similar to regional levels at 31.7%. After housing costs, 85.1% of income remains, ranking at the 15th percentile nationally.
Frequently Asked Questions - Income
Housing
Daintree is characterized by a predominantly suburban housing profile, with above-average rates of outright home ownership
In Daintree, as per the latest Census evaluation, 89.5% of dwellings were houses, with the remaining 10.4% comprising semi-detached homes, apartments, and other dwelling types. This is compared to Non-Metro Qld's 74.1% houses and 25.9% other dwellings. The home ownership rate in Daintree was higher at 39.3%, with mortgaged dwellings making up 32.8% and rented ones 27.9%. The median monthly mortgage repayment in the area was $1,408, lower than Non-Metro Qld's average of $1,517. The median weekly rent figure in Daintree was recorded at $260, compared to Non-Metro Qld's $310. Nationally, Daintree's mortgage repayments were significantly lower than the Australian average of $1,863, and rents were substantially below the national figure of $375.
Frequently Asked Questions - Housing
Household Composition
Daintree has a typical household mix, with a fairly typical median household size
Family households account for 66.7% of all households, including 22.7% couples with children, 31.7% couples without children, and 10.8% single parent families. Non-family households consist of the remaining 33.3%, with lone person households at 29.8% and group households comprising 3.6%. The median household size is 2.3 people, which aligns with the average for the Rest of Queensland.
Frequently Asked Questions - Households
Local Schools & Education
Daintree faces educational challenges, with performance metrics placing it in the bottom quartile of areas assessed nationally
The area's university qualification rate is 15.3%, significantly lower than the Australian average of 30.4%. Bachelor degrees are most common at 10.9%, followed by postgraduate qualifications (2.5%) and graduate diplomas (1.9%). Vocational credentials are prevalent, with 45.2% of residents aged 15+ holding them - advanced diplomas at 10.1% and certificates at 35.1%. Educational participation is high, with 28.8% of residents currently enrolled in formal education: 12.5% in primary, 9.3% in secondary, and 2.0% in tertiary education.
Educational participation is notably high, with 28.8% of residents currently enrolled in formal education. This includes 12.5% in primary education, 9.3% in secondary education, and 2.0% pursuing tertiary education.
Frequently Asked Questions - Education
Schools Detail
Nearby Services & Amenities
Transport
No public transport data available for this catchment area.
Frequently Asked Questions - Transport
Transport Stops Detail
Health
Health outcomes in Daintree are marginally below the national average with common health conditions slightly more prevalent than average across both younger and older age cohorts
Daintree had below-average health outcomes, with common conditions more prevalent than average across all age groups. Only 46% (~3254 people) had private health cover, lower than the national average of 55.3%.
The most common conditions were arthritis (8.1%) and mental health issues (7.1%), while 69.9% reported no medical ailments, compared to 71.7% in the rest of Queensland. Seniors made up 22.2% (1560 people) of the population, with strong health outcomes despite their age.
Frequently Asked Questions - Health
Cultural Diversity
Daintree ranks below the Australian average when compared to other local markets across a number of language and cultural background related metrics
Daintree, as per the census conducted on June 28th, 2016, displayed a below-average level of cultural diversity. The population was predominantly composed of citizens (85.2%), with a majority born in Australia (83.4%) and speaking English at home (92.4%). Christianity was the dominant religion, practiced by 45.5% of Daintree's residents.
Notably, Judaism was slightly overrepresented in Daintree compared to the rest of Queensland, with 0.1% versus 0.2%. The top three ancestry groups were English (26.9%), Australian (25.8%), and Australian Aboriginal (8.9%). Among other ethnicities, Italian (4.7%) was slightly overrepresented in Daintree compared to the regional average of 4.3%. New Zealand (0.9%) and German (4.3%) showed no significant divergence from their respective regional representations.
Frequently Asked Questions - Diversity
Age
Daintree hosts an older demographic, ranking in the top quartile nationwide
Daintree's median age is 47 years, which exceeds Rest of Qld's 41 years and is considerably older than the national norm of 38 years. The 55-64 cohort is notably over-represented in Daintree at 17.2%, compared to the Rest of Qld average, while the 25-34 year-olds are under-represented at 8.0%. This concentration of the 55-64 age group is well above the national figure of 11.2%. Between 2021 and present, the 15 to 24 age group has grown from 8.9% to 10.7% of the population. Conversely, the 5 to 14 cohort has declined from 13.3% to 11.5%, and the 45 to 54 group has dropped from 15.1% to 14.0%. Demographic modeling suggests that Daintree's age profile will evolve significantly by 2041. The 65 to 74 age cohort is projected to expand notably, increasing by 244 people (25%) from 970 to 1,215. Notably, the combined 65+ age groups are projected to account for 57% of total population growth, reflecting the area's aging demographic profile. In contrast, population declines are projected for the 15 to 24 and 5 to 14 cohorts.
