Chart Color Schemes
This analysis uses ABS Statistical Areas Level 2 (SA2) boundaries, which can materially differ from Suburbs and Localities (SAL) even when sharing similar names.
SA2 boundaries are defined by the Australian Bureau of Statistics and are designed to represent communities for statistical reporting (e.g., census and ERP).
Suburbs and Localities (SAL) represent commonly-used suburb/locality names (postal-style areas) and may use different geographic boundaries. For comprehensive analysis, consider reviewing both boundary types if available.
est. as @ -- *
ABS ERP | -- people | --
2021 Census | -- people
Sales Activity
Curious about local property values? Filter the chart to assess the volume and appreciation (including resales) trends and regional comparisons, or scroll to the map below view this information at an individual property level.
Find a Recent Sale
Sales Detail
Population
An assessment of population growth drivers in Cape York reveals an overall ranking slightly below national averages considering recent, and medium term trends
Cape York's population, as of November 2025, is approximately 8,389 people. This figure represents a growth of 586 individuals since the 2021 Census, which reported a population of 7,803. The increase is inferred from the estimated resident population of 8,391 in June 2024 and an additional 63 validated new addresses since the Census date. This results in a population density ratio of 0.10 persons per square kilometer. Cape York's growth of 7.5% since the 2021 census exceeds that of the SA4 region (4.5%) and the SA3 area, positioning it as a growth leader in the region. Natural growth contributed approximately 63.6% of overall population gains during recent periods.
AreaSearch adopts ABS/Geoscience Australia projections for each SA2 area, released in 2024 with a base year of 2022. For areas not covered and years post-2032, Queensland State Government's SA2 area projections from 2023, based on 2021 data, are used. These state projections do not provide age category splits, so AreaSearch applies proportional growth weightings in line with ABS Greater Capital Region projections released in 2023, based on 2022 data. Demographically, Cape York is expected to increase by just below the median of locations outside capital cities, with an anticipated expansion of 793 persons by 2041, reflecting a total gain of 9.5% over the 17 years.
Frequently Asked Questions - Population
Development
AreaSearch assessment of residential development activity positions Cape York among the top 25% of areas assessed nationwide
Cape York has seen approximately 50 new homes approved annually over the past five financial years, totalling 251 homes. As of FY-26, 5 approvals have been recorded so far. On average, 1.8 new residents per year have arrived for each new home built between FY-21 and FY-25, indicating a balanced supply and demand market that supports stable conditions. The average construction cost value of new properties is $345,000, aligning with regional trends.
This financial year has seen $30.9 million in commercial development approvals, reflecting strong commercial development momentum. Compared to the Rest of Qld, Cape York records 98.0% more construction activity per person, offering greater choice for buyers. Recent construction consists of 81.0% detached dwellings and 19.0% attached dwellings, maintaining the area's traditional low density character with a focus on family homes. The location has approximately 268 people per dwelling approval, suggesting room for growth.
Population forecasts indicate Cape York will gain 795 residents by 2041, based on the latest AreaSearch quarterly estimate. At current development rates, new housing supply should comfortably meet demand, providing good conditions for buyers and potentially supporting growth beyond current population projections.
Frequently Asked Questions - Development
Infrastructure
Cape York has strong levels of nearby infrastructure activity, ranking in the top 40% nationally
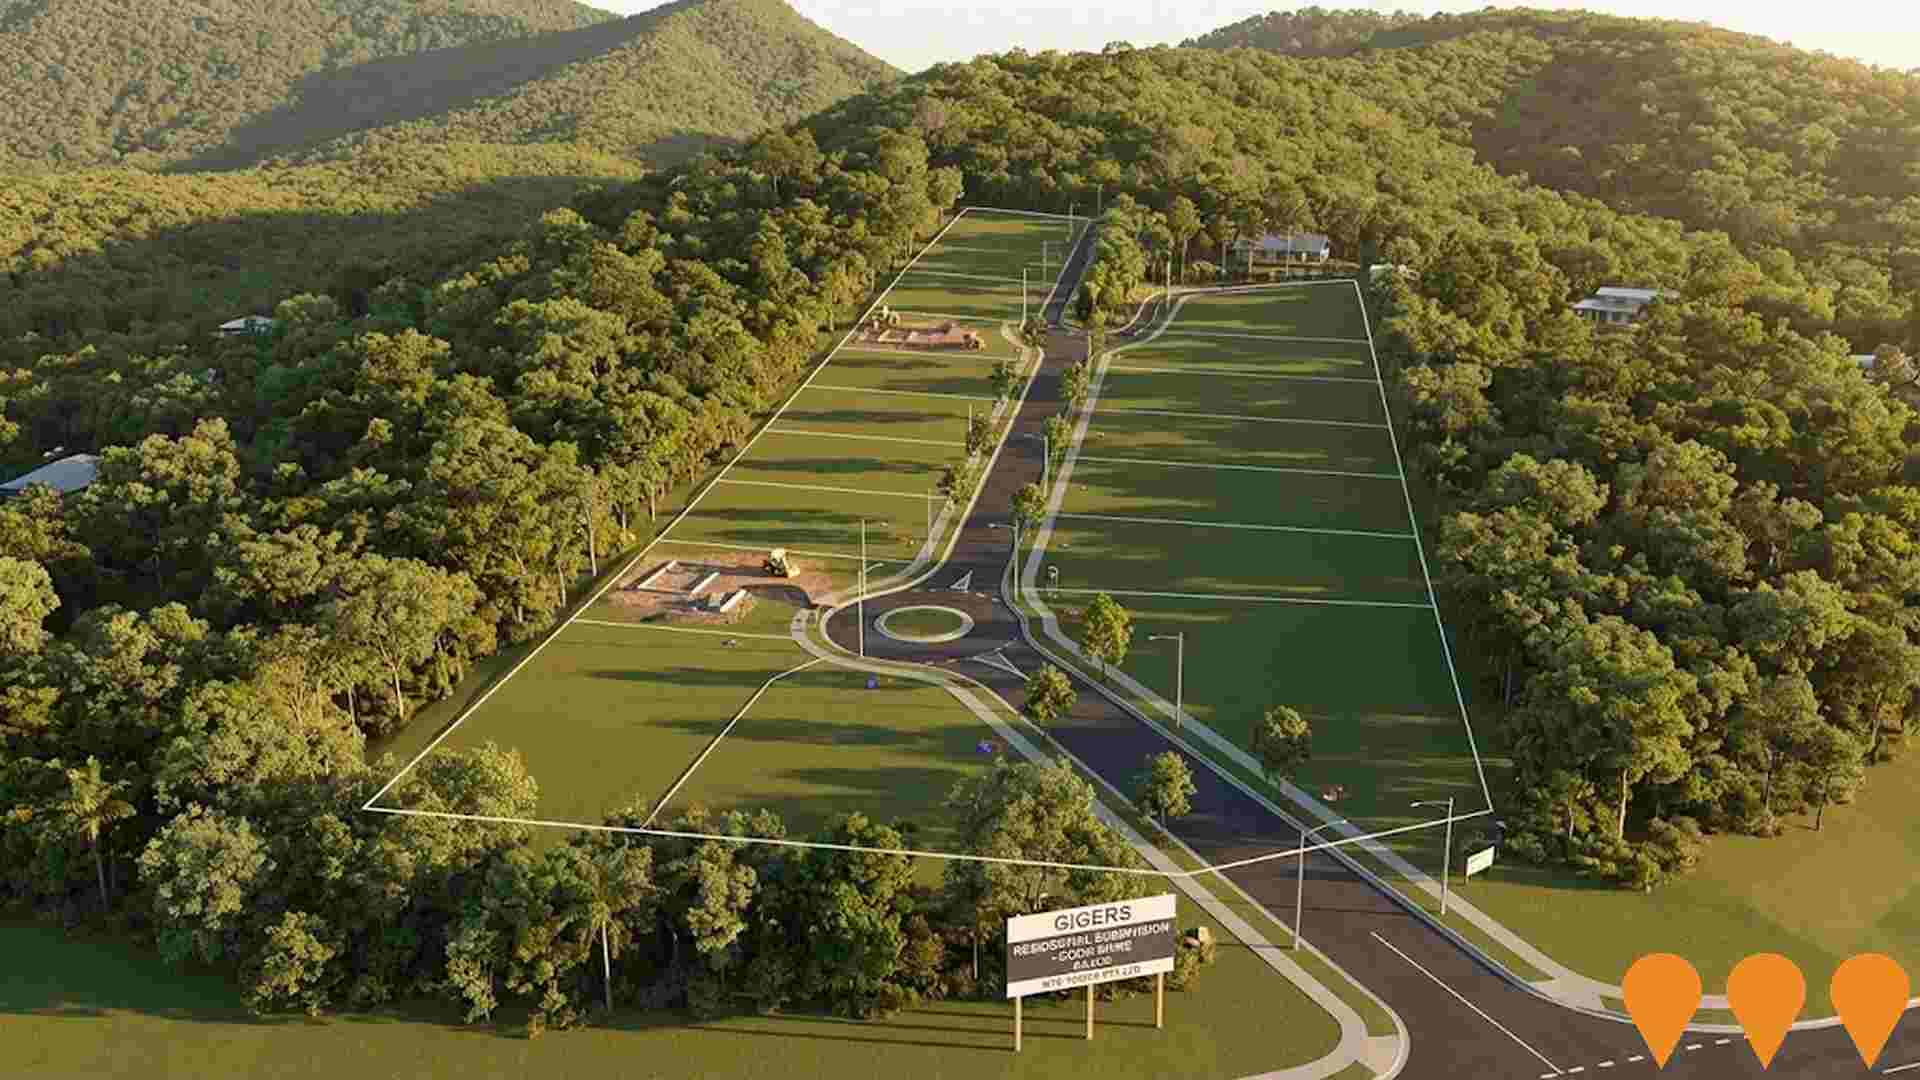
Five projects identified by AreaSearch are expected to impact the area significantly. These include the Cooktown Multi-Purpose Health Service Redevelopment, Gigers Residential Subdivision, Daintree Ferry Landside Infrastructure and Ferry Replacement Project, and Cow Bay Primary Health Centre. The following details those likely to be most relevant.
Professional plan users can use the search below to filter and access additional projects.
INFRASTRUCTURE SEARCH
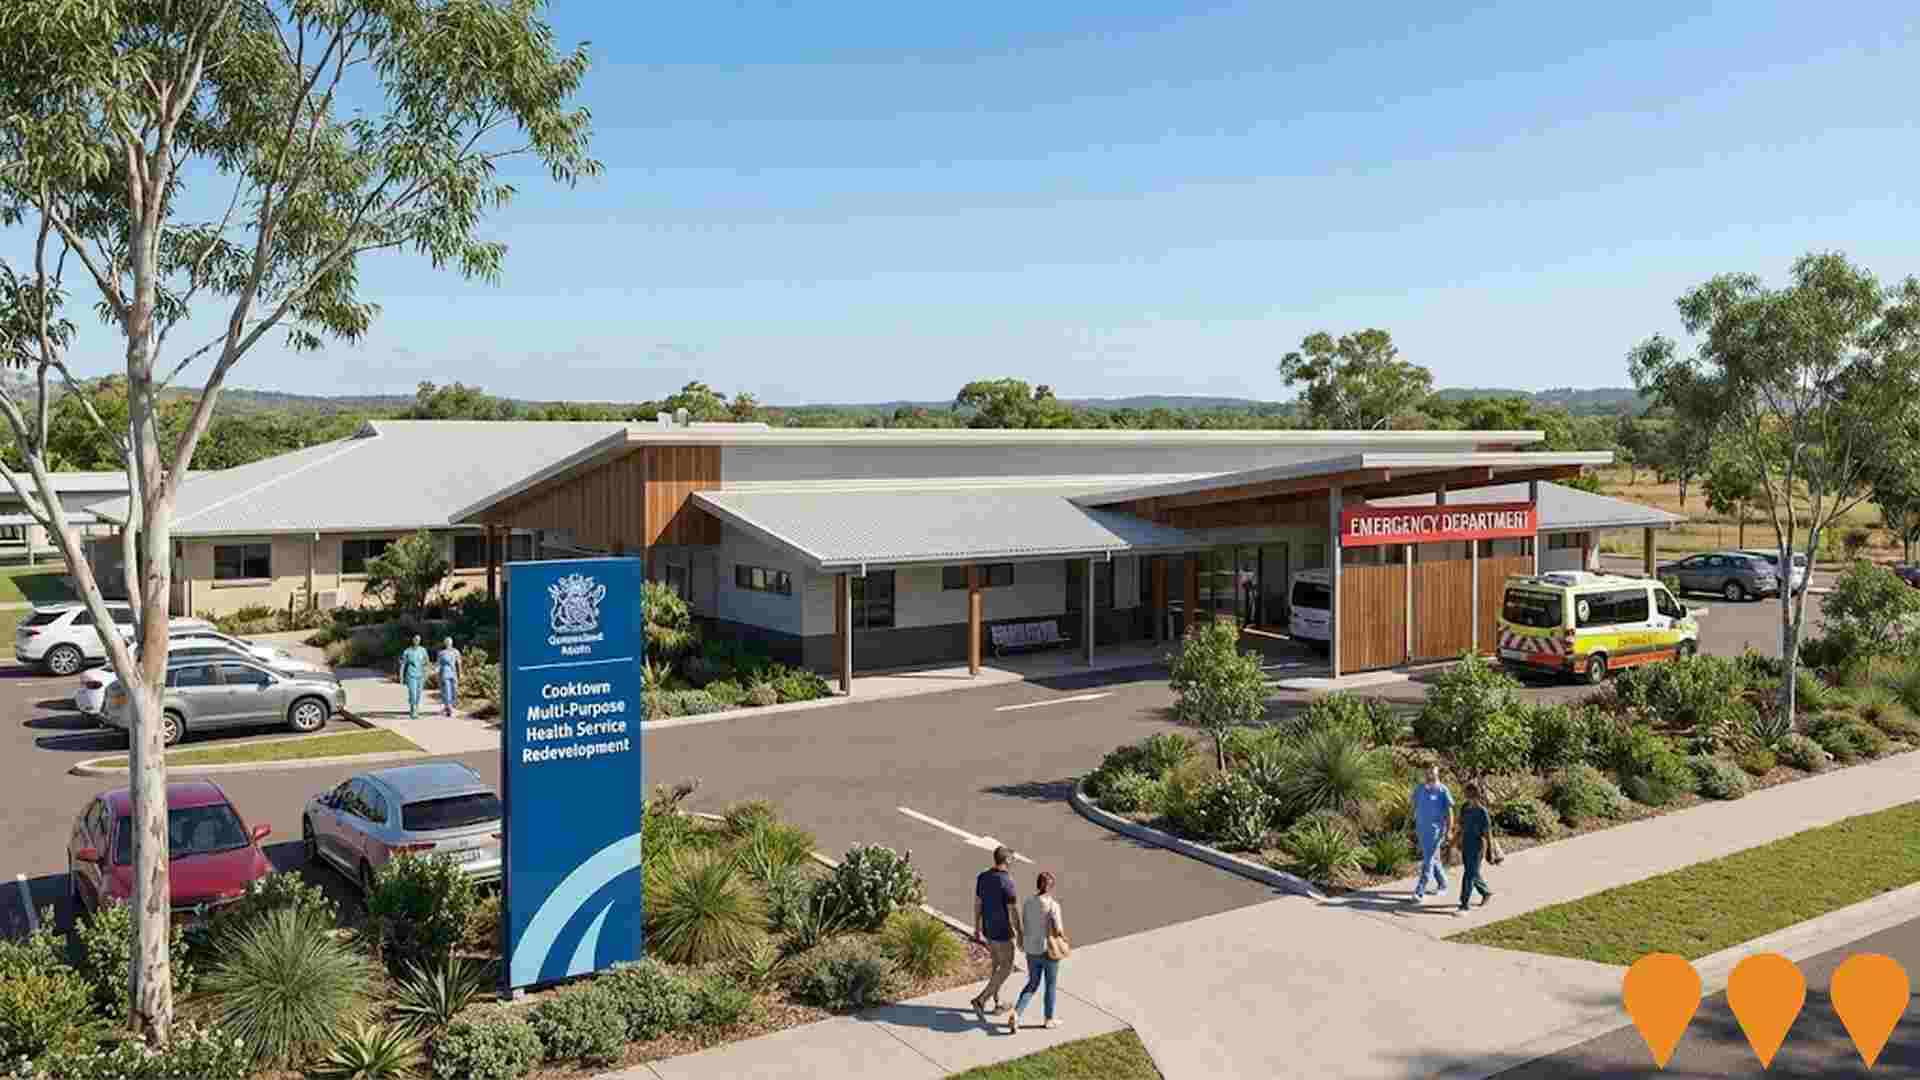
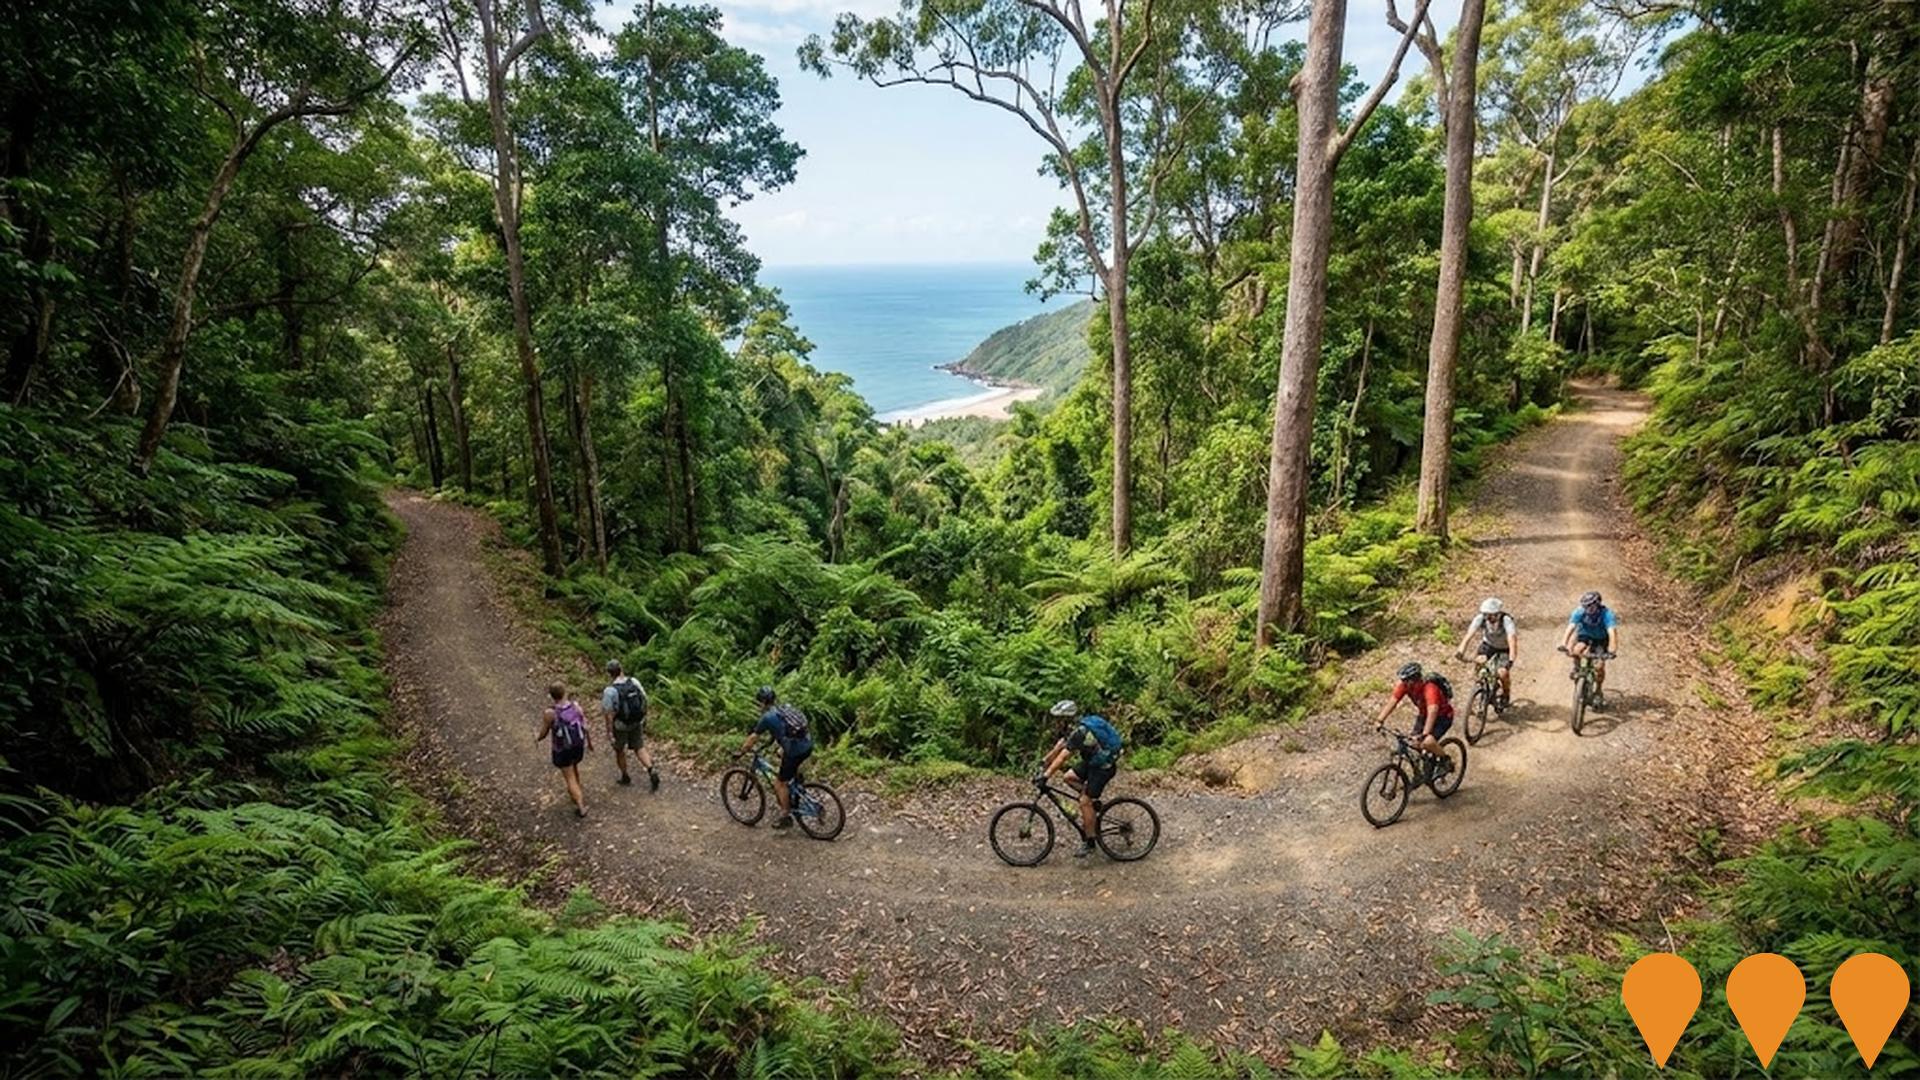
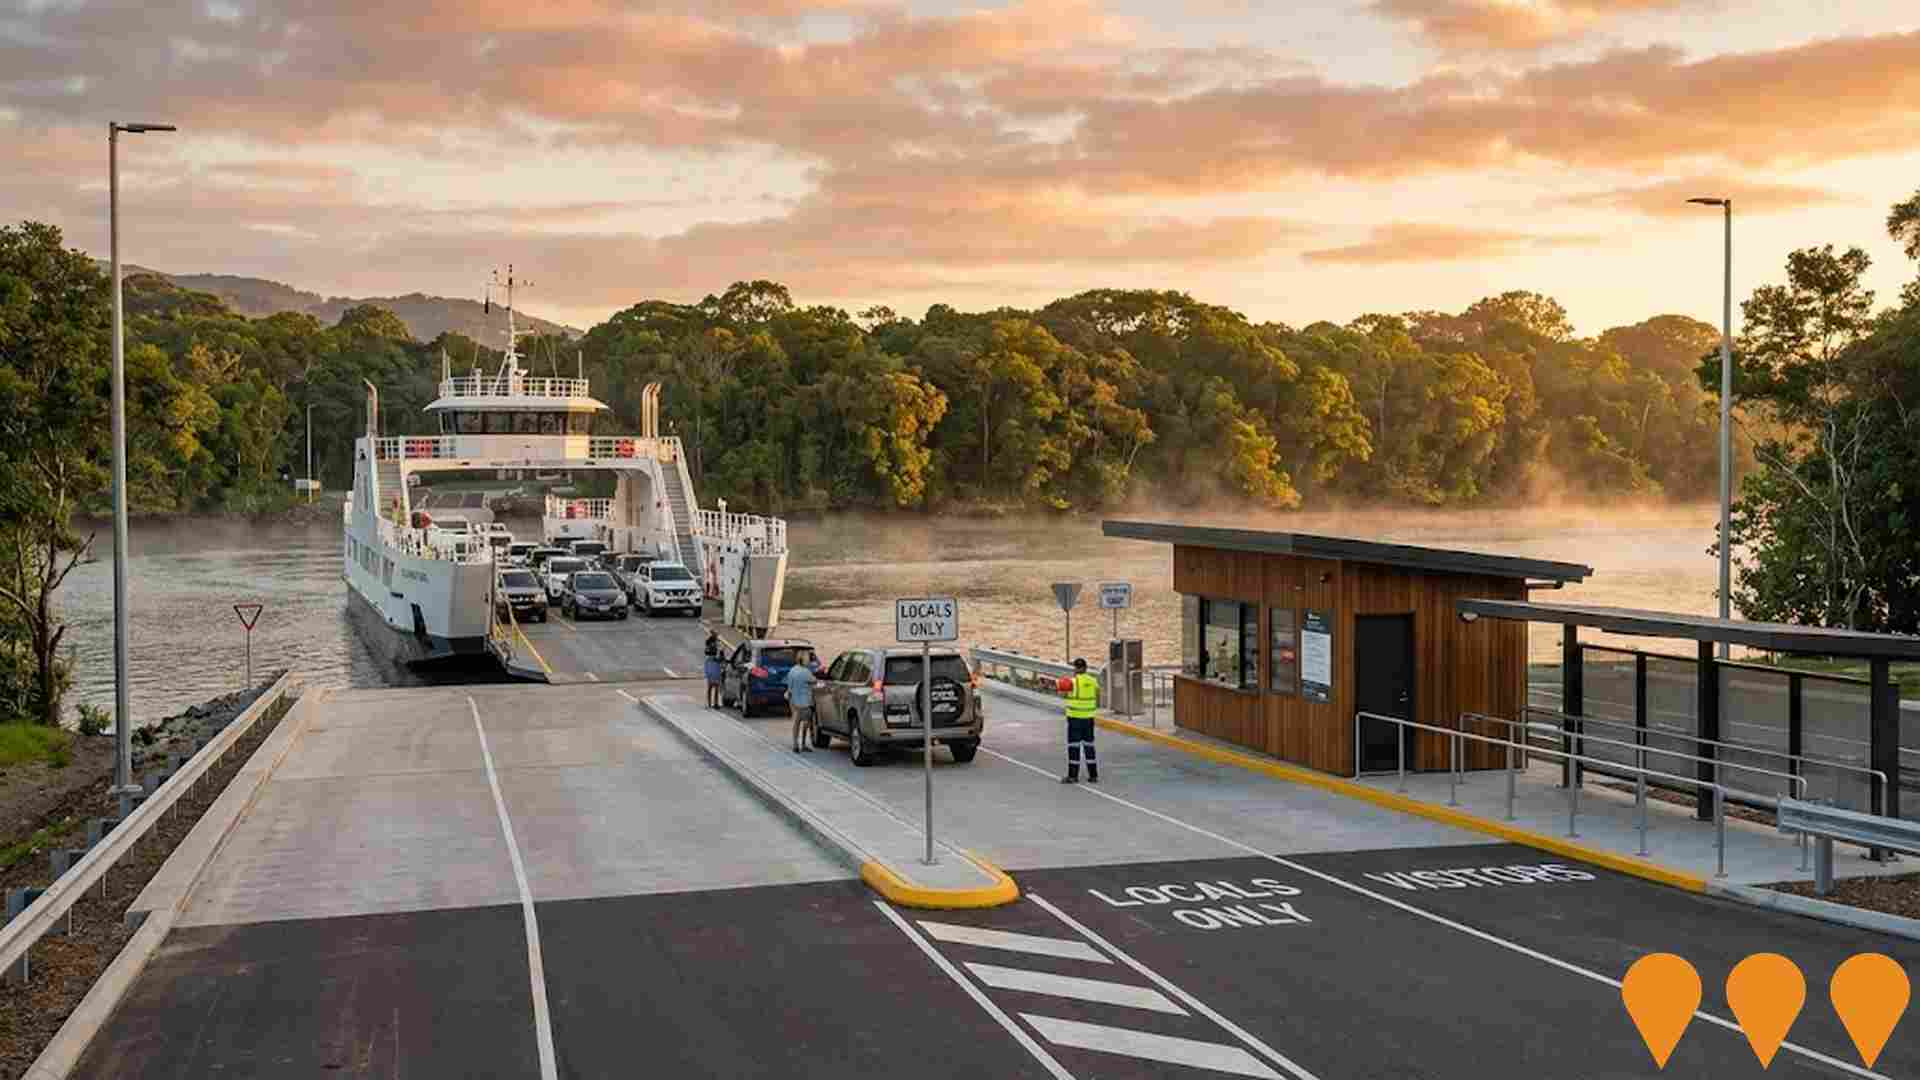
 Denotes AI-based impression for illustrative purposes only, not to be taken as definitive under any circumstances. Please follow links and conduct other investigations from the project's source for actual imagery. Developers and project owners wishing us to use original imagery please Contact Us and we will do so.
Frequently Asked Questions - Infrastructure
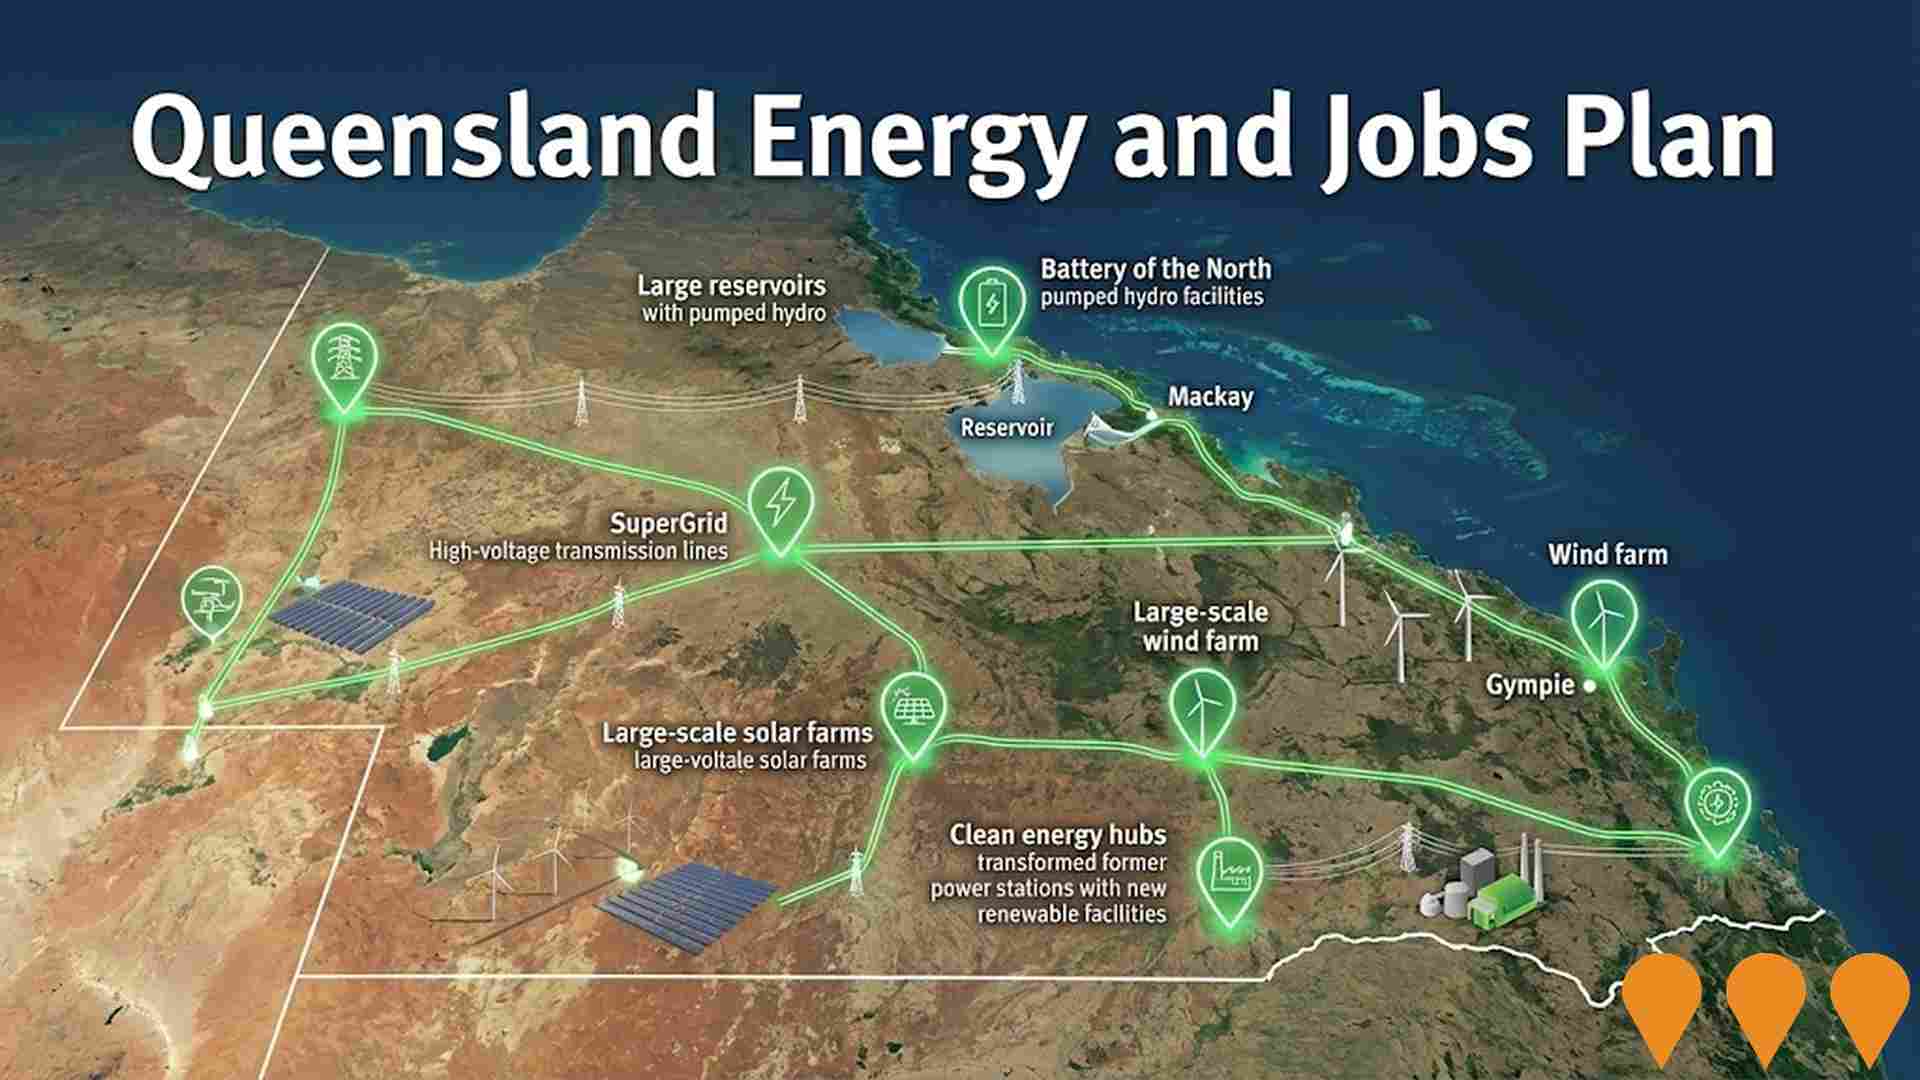
Queensland Energy and Jobs Plan
State-wide renewable energy transformation program delivering large-scale wind, solar, pumped hydro, battery storage and transmission infrastructure. Aims for 70% renewable energy by 2032 and 80% by 2035, supporting 100,000 jobs by 2040 across regional Queensland. Largest clean energy investment program in Australia.
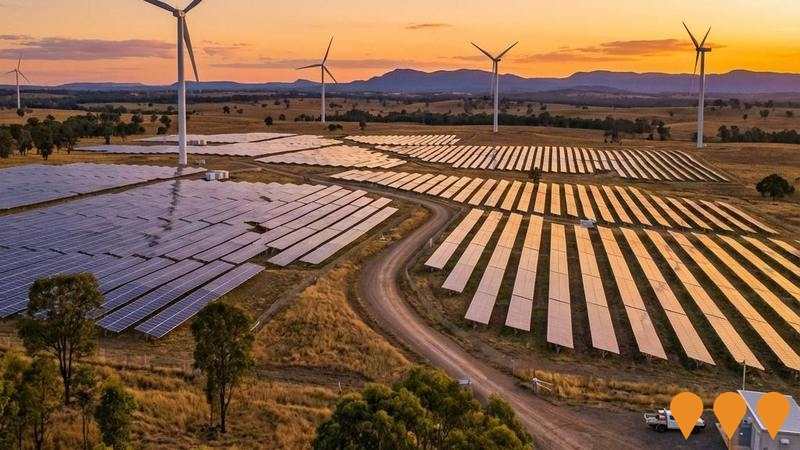
Queensland Energy and Jobs Plan SuperGrid
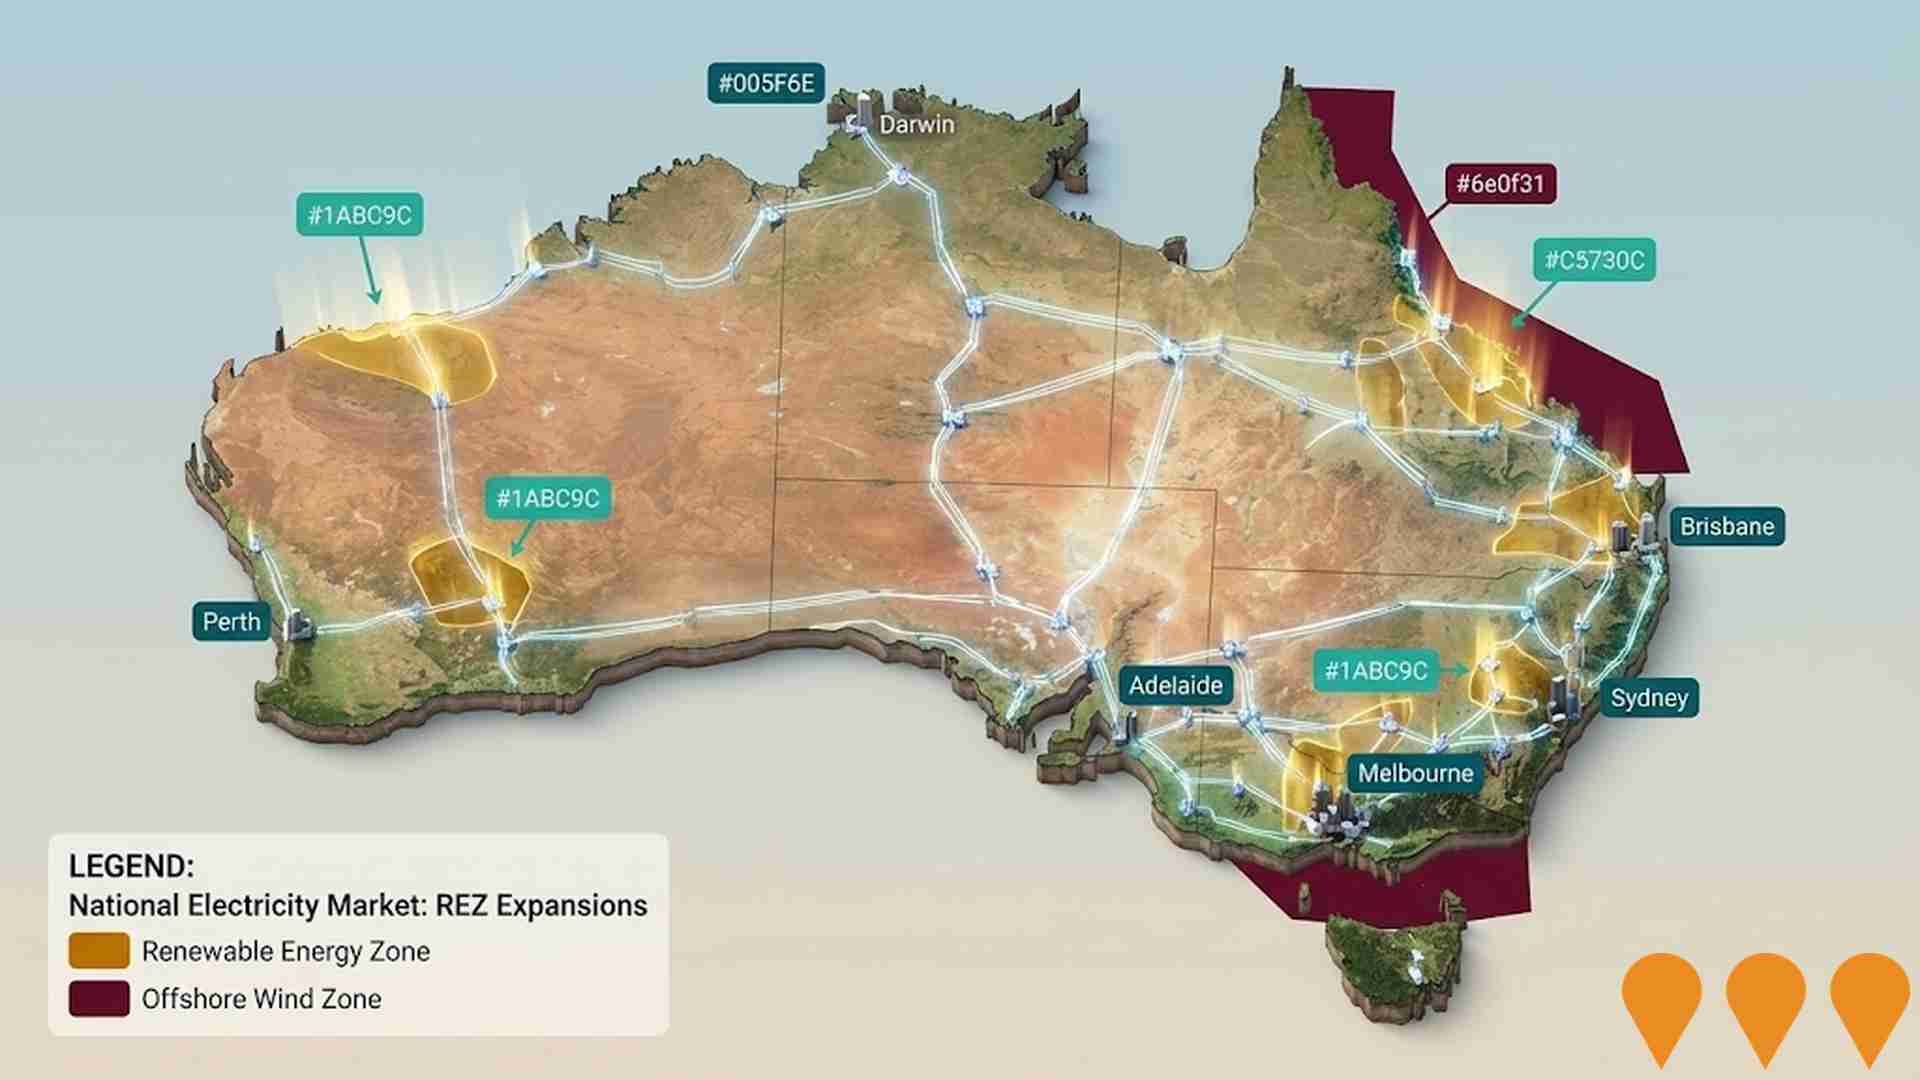
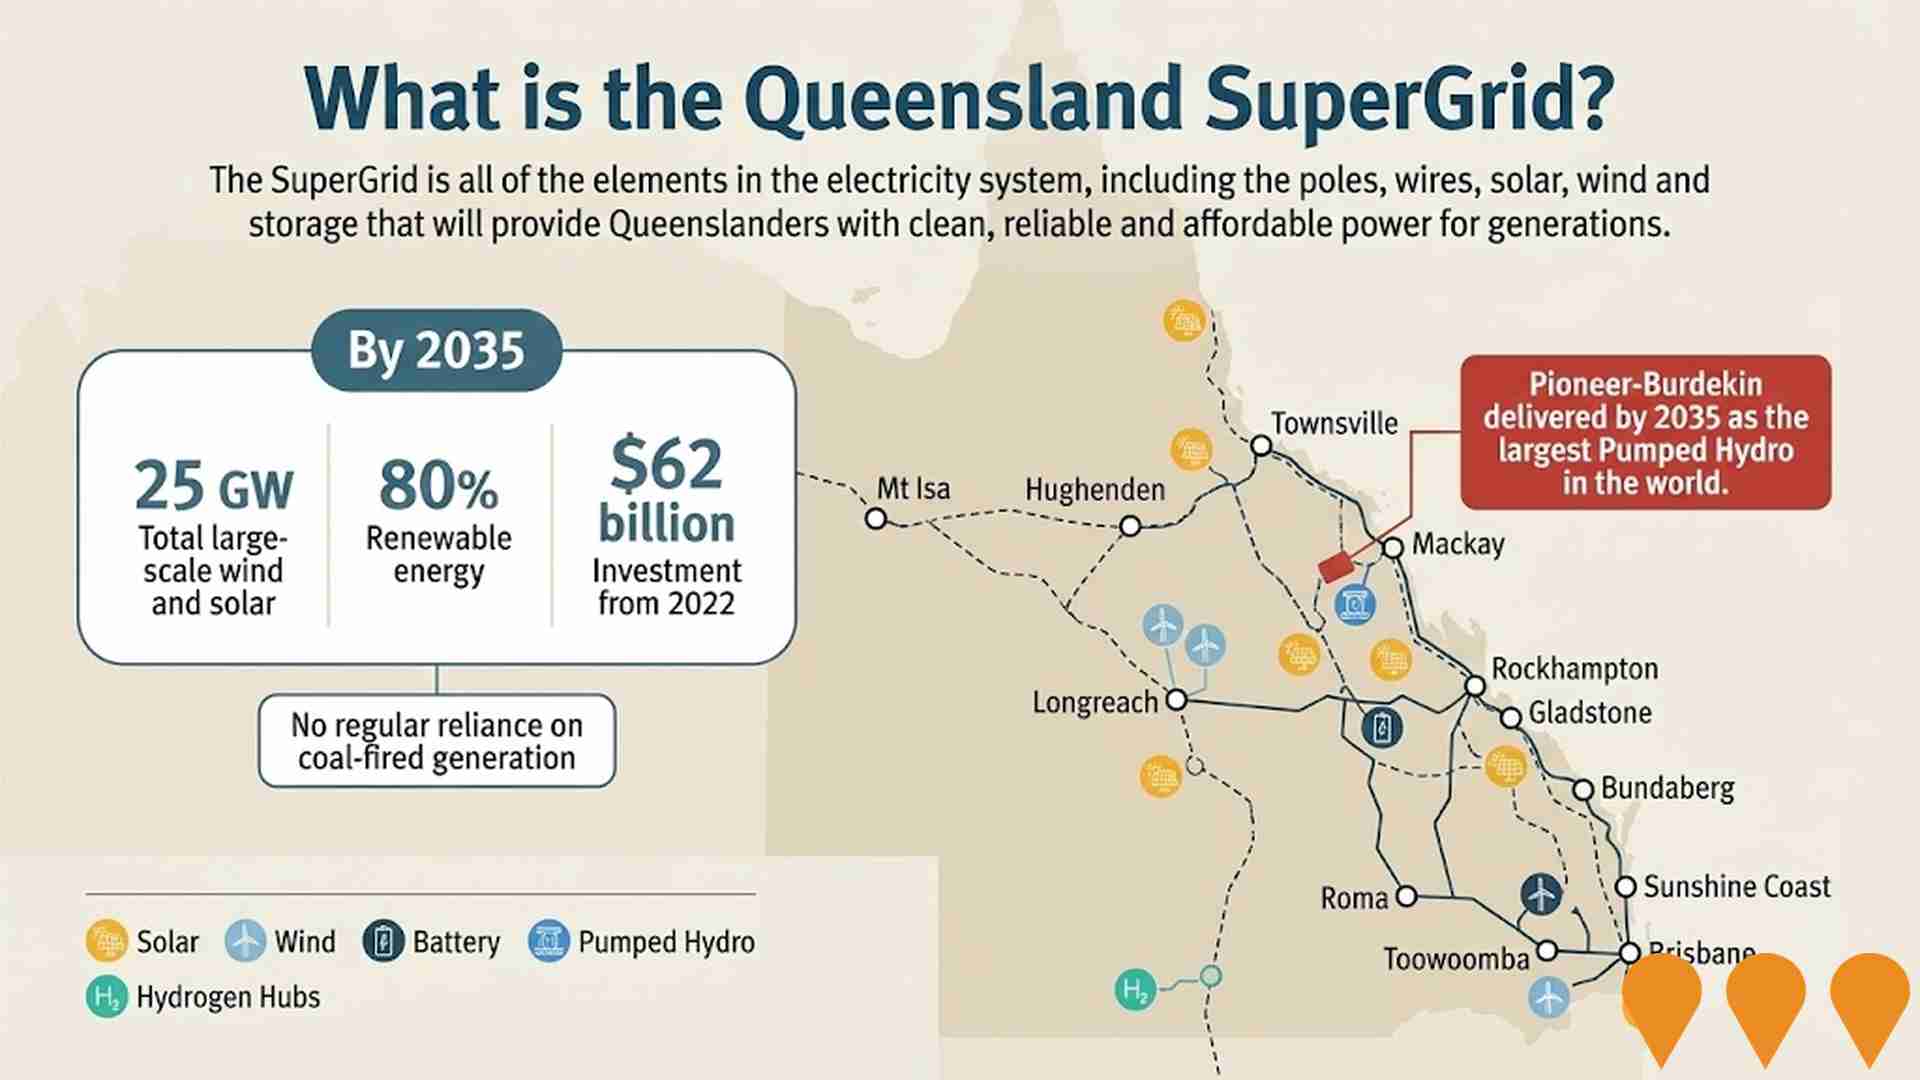
The Queensland Energy and Jobs Plan is delivering the Queensland SuperGrid and 22 GW of new renewable energy capacity through Renewable Energy Zones (REZs) across the state. Legislated targets are 50% renewables by 2030, 70% by 2032 and 80% by 2035. Key delivery mechanisms include the Energy (Renewable Transformation and Jobs) Act 2024, the SuperGrid Infrastructure Blueprint, the Queensland REZ Roadmap and the Priority Transmission Investments (PTI) framework. Multiple transmission projects are now in construction including CopperString 2032, Gladstone PTI (Central Queensland SuperGrid), Southern Queensland SuperGrid reinforcements, and numerous grid-scale batteries and pumped hydro projects under active development.
Queensland Energy and Jobs Plan
The Queensland Energy and Jobs Plan is a $62 billion+ statewide program to deliver publicly owned renewable energy generation, large-scale battery and pumped hydro storage, and the Queensland SuperGrid transmission backbone. Targets: 50% renewables by 2030, 70% by 2032, 80% by 2035. Multiple projects are now under construction including CopperString 2032, Pioneer-Burdekin Pumped Hydro, and numerous Renewable Energy Zones.
Cooktown Multi-Purpose Health Service Redevelopment
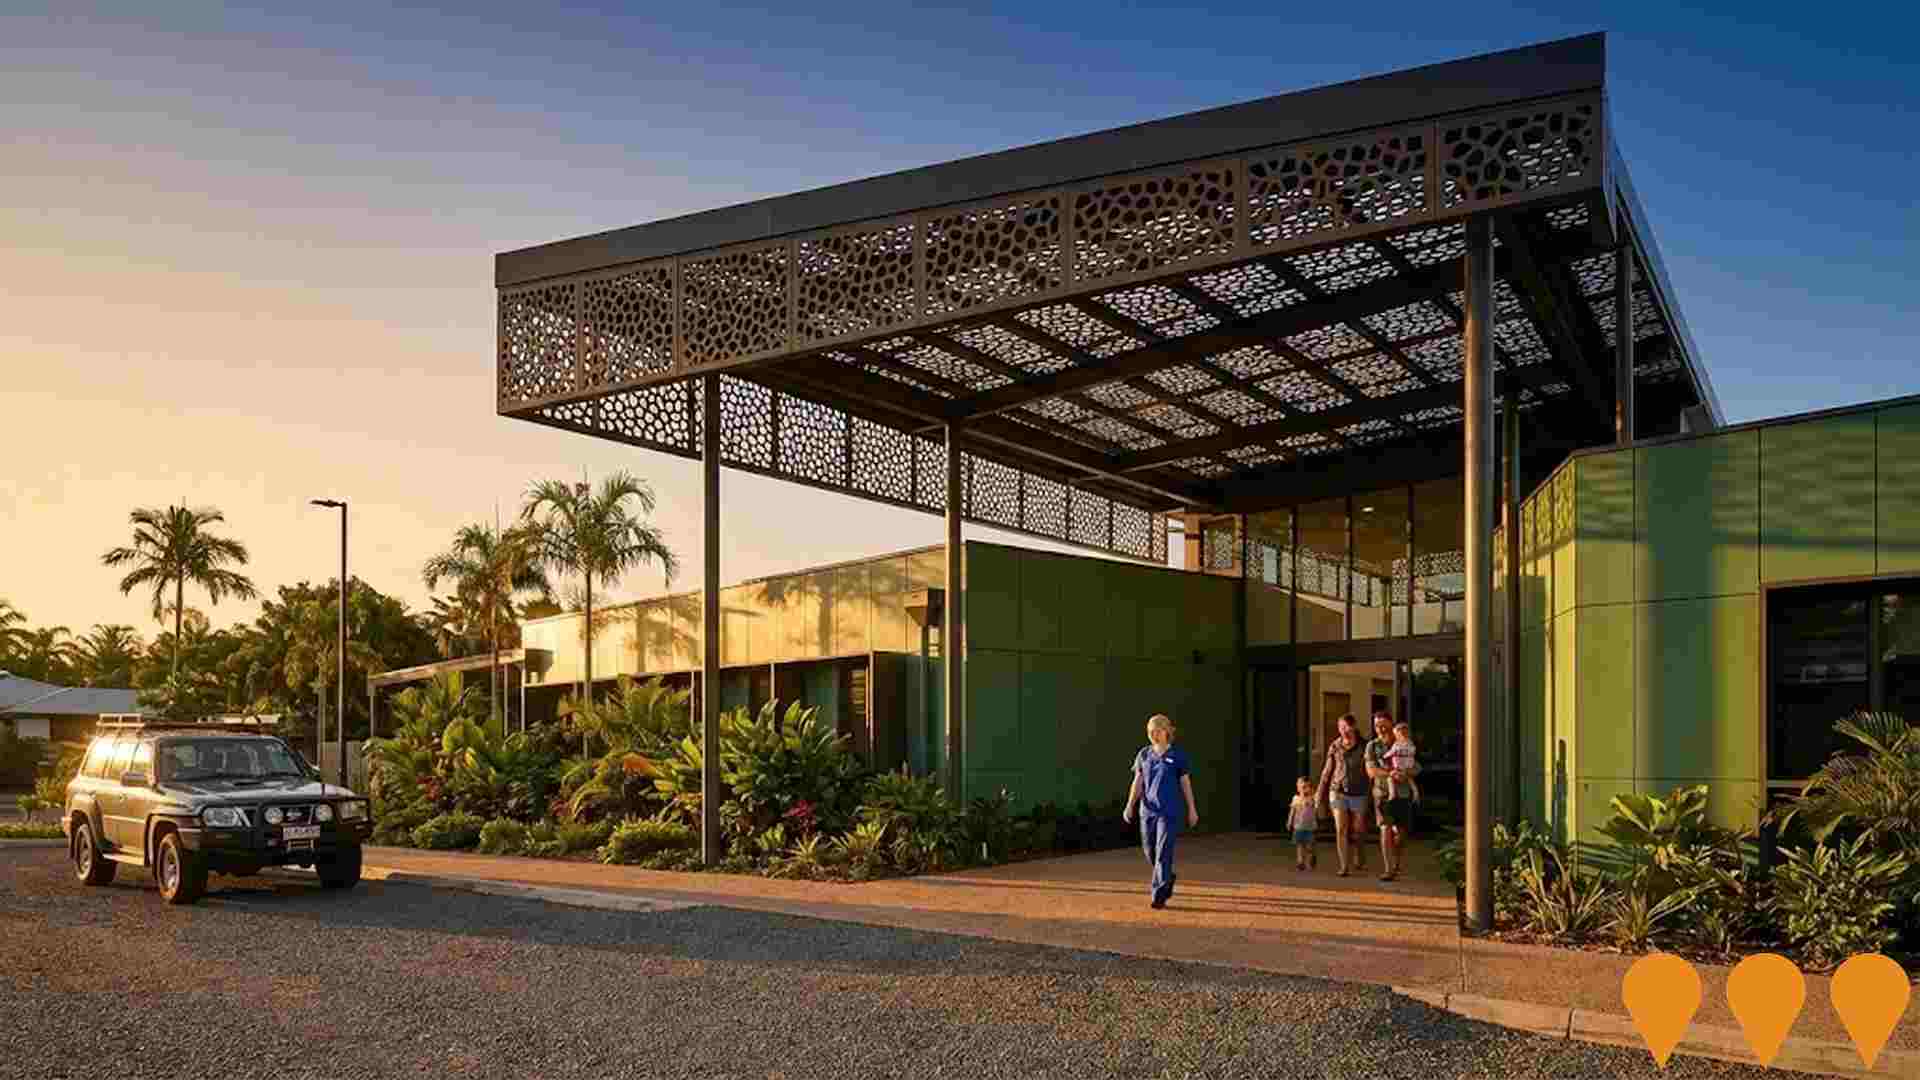
Comprehensive redevelopment of the Cooktown Multipurpose Health Service (CMPHS) to provide a modern, culturally appropriate health facility for the Cape York region. The upgrade includes a new main clinical building with an emergency department, a new operating theatre, a dedicated birthing suite to restore maternity services, medical imaging, specialist outpatient services, and is planned to increase beds by 8. The project is part of the Queensland Government's Hospital Rescue Plan.
Wangetti Trail
A $59.1 million major ecotourism project in Tropical North Queensland, the Wangetti Trail is a 94km dual walking and mountain biking track extending from Palm Cove to Port Douglas, showcasing World Heritage-listed Wet Tropics and coastal scenery on Djabugay Nation country. Queensland's first purpose-built multi-use trail through a national park, spanning three national parks and offering multi-day adventure experiences. The first 7.8km section (Palm Cove to Ellis Beach) opened in September 2024. The full trail is expected to be operational in 2028, with construction of the next section (Ellis Beach to Wangetti) commencing in early 2026. Project includes $8 million from the Australian Government's National Tourism Icons Program.
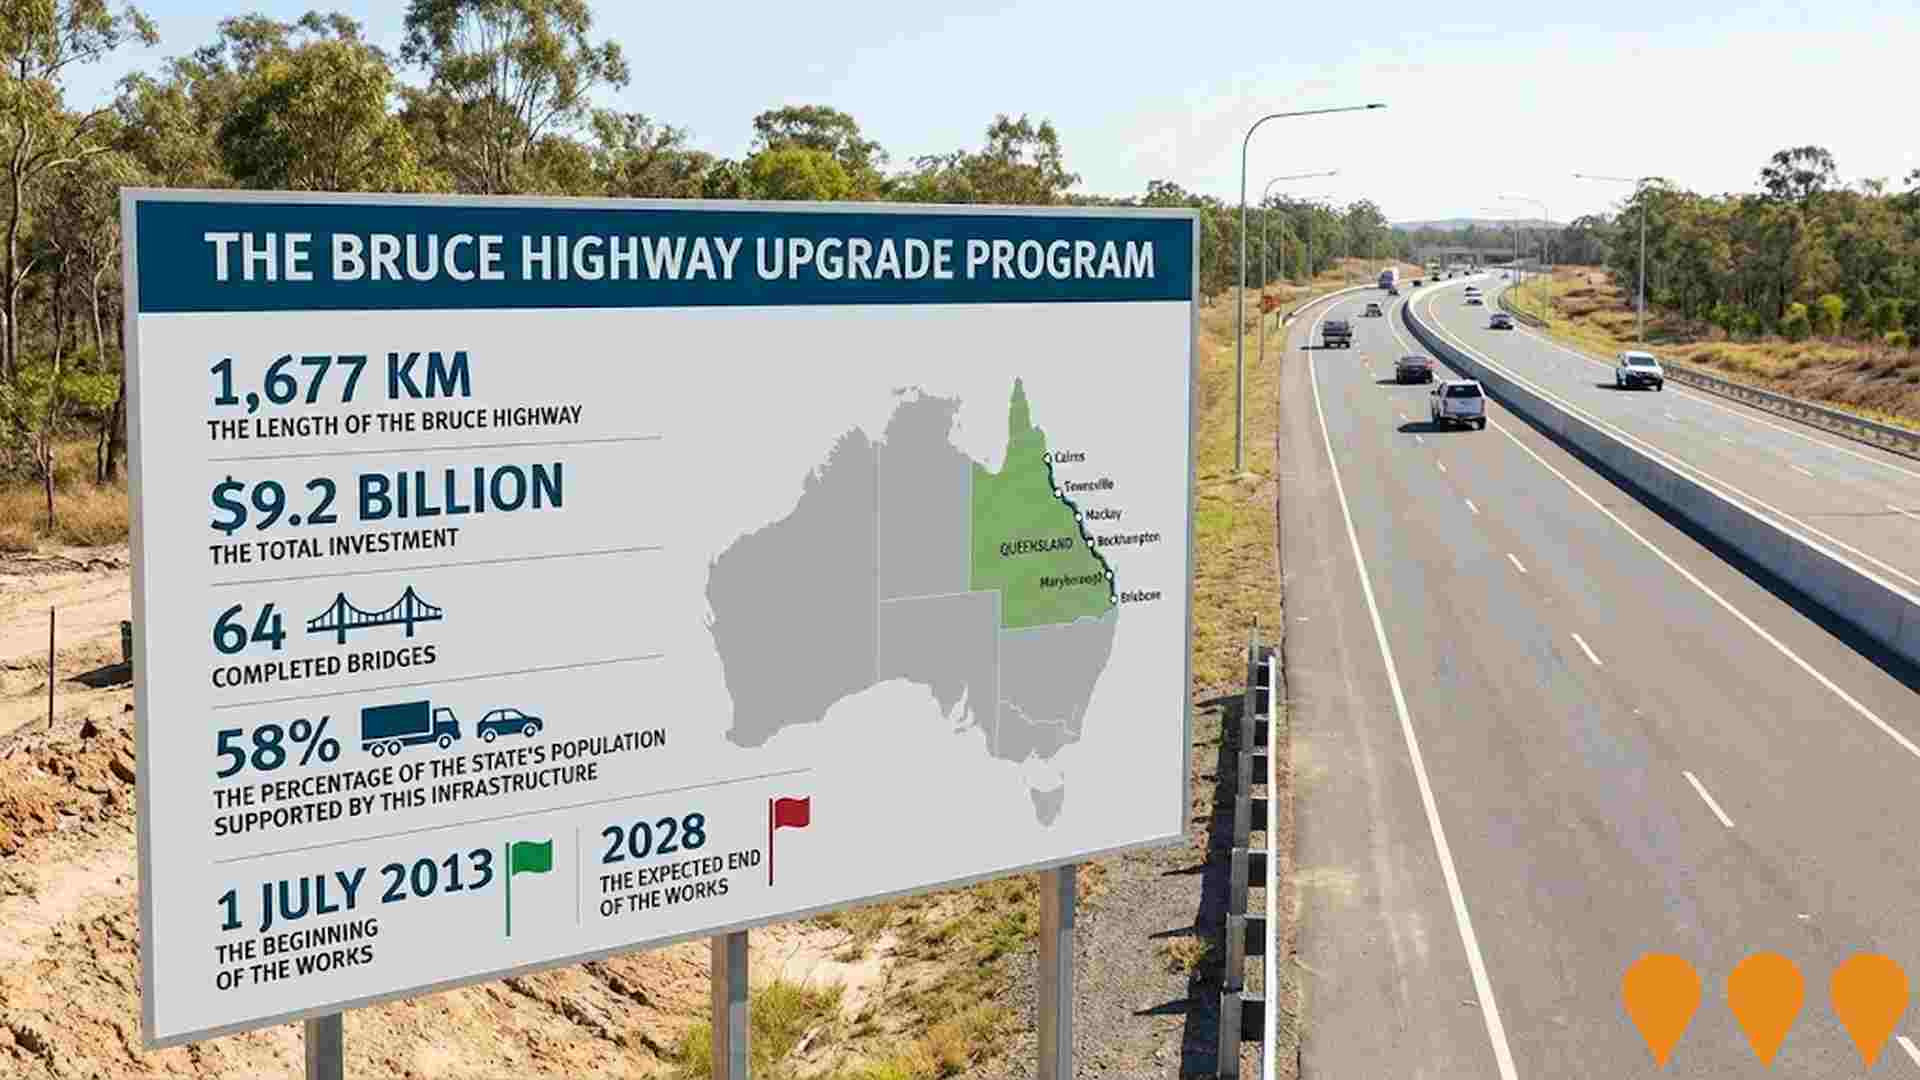
Bruce Highway Upgrade Program
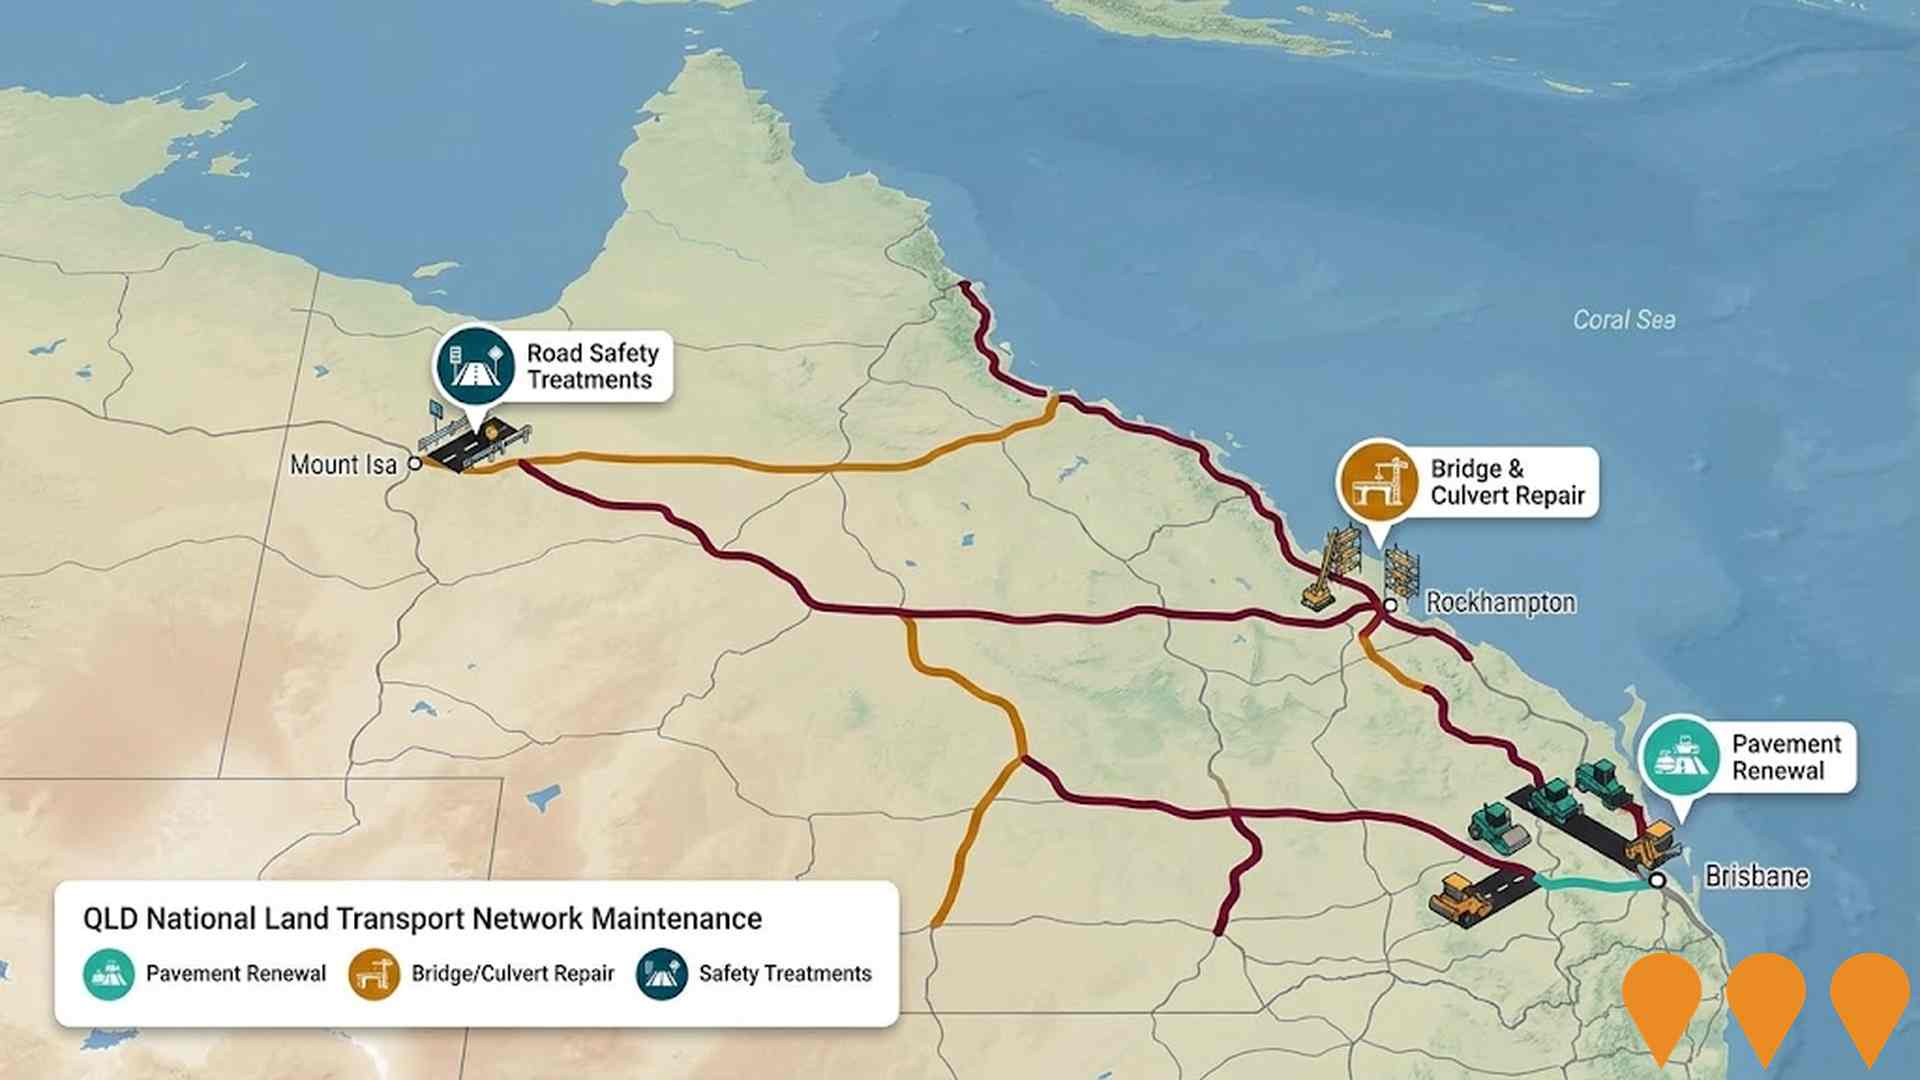
The Bruce Highway Upgrade Program is Queensland's largest road infrastructure initiative, delivering safety, flood resilience, and capacity improvements along the 1,677km corridor from Brisbane to Cairns. The massive investment program includes the $9 billion Targeted Safety Program, major bypass projects (including Gympie, Rockhampton, and Tiaro), bridge replacements, and wide centre line treatments. Jointly funded by the Australian and Queensland governments, works are progressing across multiple sections simultaneously.
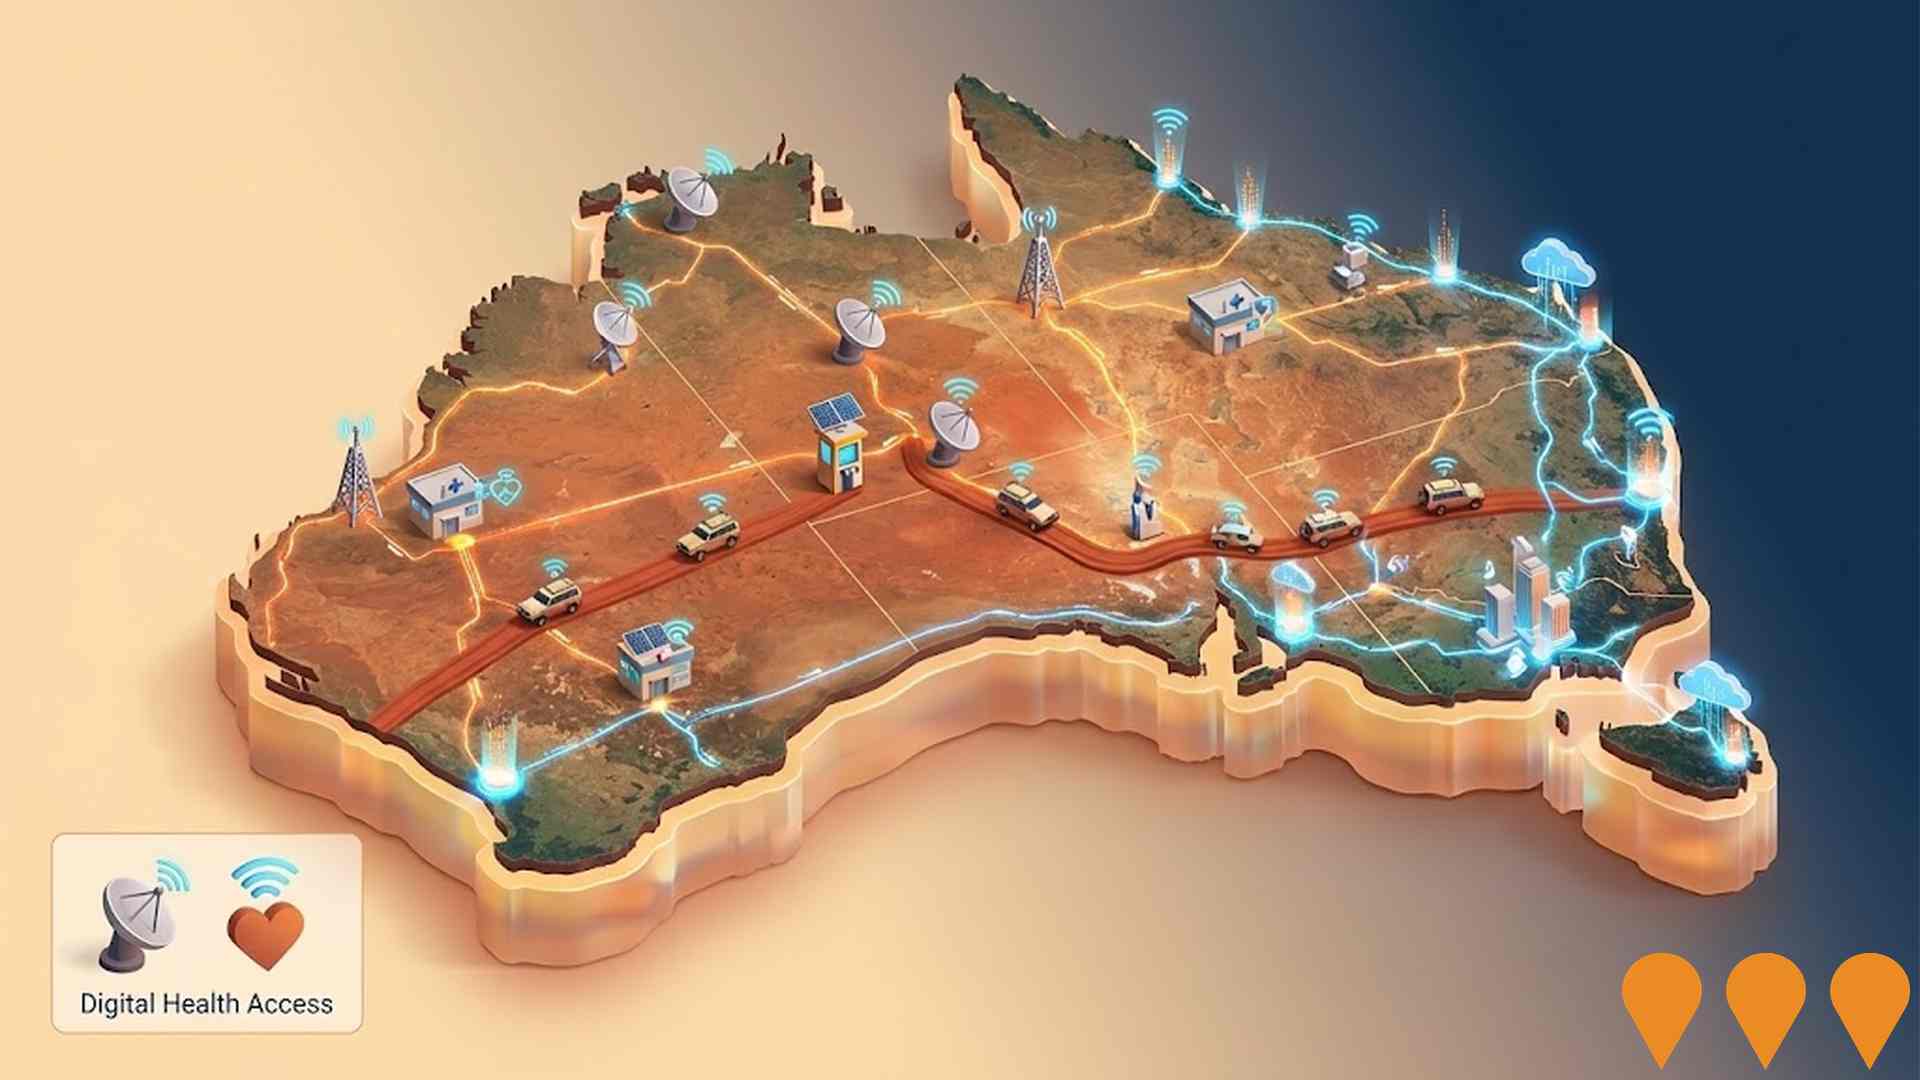
Enabling Digital Health Services for Regional and Remote Australia
National initiative to expand and improve digital health access for people in regional and remote Australia. Focus areas include enabling telehealth and virtual care, upgrading clinical systems and connectivity, supporting secure information exchange, and building workforce capability in digital health, aligned with the Australian Government's Digital Health Blueprint and Action Plan 2023-2033.
Daintree Ferry Landside Infrastructure and Ferry Replacement Project
Douglas Shire Council is delivering a coordinated project to replace the existing Daintree River ferry with a new larger four-lane vessel (designed, built and operated by Birdon Pty Ltd, delivery end 2027) and upgrade landside infrastructure on both sides of the river (contractor: Durack Civil). Landside works include new approach roads, ramps, priority lanes for locals, relocated ticket booths, streamlined queuing areas, dual-loading ramps and safety enhancements to reduce wait times, improve traffic flow and support residents, tourism and essential services. The projects are integrated but have separate contracts, with landside construction starting after the 2026 wet season and full commissioning in late 2027.
Employment
Employment drivers in Cape York are experiencing difficulties, placing it among the bottom 20% of areas assessed across Australia
Cape York has a balanced workforce with both white and blue collar jobs. Key sectors include public administration & safety, health care & social assistance, and agriculture, forestry & fishing.
As of September 2025, there are 3,303 employed residents, an unemployment rate of 9.9%, and estimated employment growth of 0.7% over the past year. The unemployment rate is 5.8% higher than Rest of Qld's rate of 4.1%. Workforce participation lags at 46.4%, compared to Rest of Qld's 59.1%. Public administration & safety employs a significant share, 3.2 times the regional level, while manufacturing employs only 0.7% of local workers, below Rest of Qld's 5.6%.
Many residents commute elsewhere for work. Between September 2024 and September 2025, employment levels increased by 0.7%, labour force decreased by 0.5%, resulting in a 1.0 percentage point decrease in unemployment. In contrast, Rest of Qld recorded employment growth of 1.7% and unemployment rose by 0.3%. State-level data to 25-Nov-25 shows Queensland employment contracted by 0.01% with an unemployment rate of 4.2%, broadly inline with the national rate of 4.3%. National employment forecasts suggest growth of 6.6% over five years and 13.7% over ten years, but local projections vary significantly by industry sector. Applying these projections to Cape York's employment mix suggests local employment should increase by 5.8% over five years and 12.5% over ten years.
Frequently Asked Questions - Employment
Income
Income figures position the area below 75% of locations analysed nationally by AreaSearch
In AreaSearch's latest postcode level ATO data for financial year 2022, Cape York SA2 had a median taxpayer income of $50,782 and an average of $58,159. This was lower than the national average, with Rest of Qld having a median of $50,780 and average of $64,844. Based on Wage Price Index growth of 13.99% since financial year 2022, estimated incomes as of September 2025 would be approximately $57,886 (median) and $66,295 (average). According to Census 2021 income data, Cape York's household, family, and personal incomes all fell between the 4th and 5th percentiles nationally. Income distribution showed that 26.4% of individuals earned within the $400 - 799 range, differing from regional levels where the $1,500 - 2,999 category was predominant at 31.7%. Despite modest housing costs allowing for 88.9% income retention, total disposable income ranked at just the 10th percentile nationally.
Frequently Asked Questions - Income
Housing
Cape York is characterized by a predominantly suburban housing profile, with above-average rates of outright home ownership
Cape York's dwelling structures, as per the latest Census, consisted of 86.5% houses and 13.5% other dwellings (semi-detached, apartments, 'other' dwellings), compared to Non-Metro Qld's 82.5% houses and 17.6% other dwellings. Home ownership in Cape York was higher at 27.6%, with the rest being mortgaged (14.1%) or rented (58.3%). The median monthly mortgage repayment was $1,286, lower than Non-Metro Qld's average of $1,517. The median weekly rent figure was $130, compared to Non-Metro Qld's $140 and the national average of $375. Nationally, Cape York's mortgage repayments were significantly lower at $1,286 than the Australian average of $1,863.
Frequently Asked Questions - Housing
Household Composition
Cape York features high concentrations of lone person households, with a lower-than-average median household size
Family households account for 66.4% of all households, including 24.9% couples with children, 21.9% couples without children, and 16.7% single parent families. Non-family households constitute the remaining 33.6%, with lone person households at 30.9% and group households comprising 2.9%. The median household size is 2.7 people, which is smaller than the Rest of Qld average of 2.9.
Frequently Asked Questions - Households
Local Schools & Education
Cape York faces educational challenges, with performance metrics placing it in the bottom quartile of areas assessed nationally
The area's university qualification rate is 14.0%, significantly lower than Australia's average of 30.4%. Bachelor degrees are the most common at 10.1%, followed by postgraduate qualifications (2.0%) and graduate diplomas (1.9%). Vocational credentials are prevalent, with 44.2% of residents aged 15+ holding them, including advanced diplomas (8.6%) and certificates (35.6%). Educational participation is high, with 33.7% currently enrolled in formal education: 17.6% in primary, 8.6% in secondary, and 1.7% in tertiary education.
Educational participation is notably high, with 33.7% of residents currently enrolled in formal education. This includes 17.6% in primary education, 8.6% in secondary education, and 1.7% pursuing tertiary education.
Frequently Asked Questions - Education
Schools Detail
Nearby Services & Amenities
Transport
No public transport data available for this catchment area.
Frequently Asked Questions - Transport
Transport Stops Detail
Health
Cape York's residents boast exceedingly positive health performance metrics with very low prevalence of common health conditions across all age groups
Cape York shows excellent health outcomes with very low prevalence of common health conditions across all ages. Approximately 49% (~4,102 people) have private health cover, lower than the national average of 55.3%.
Diabetes and arthritis are the most prevalent conditions, affecting 6.4 and 5.0% of residents respectively. 76.7% report no medical ailments, compared to 79.2% in Rest of Qld. The area has a higher proportion of seniors aged 65 and over at 14.4% (1,206 people), compared to 11.5% in Rest of Qld. Senior health outcomes are notably strong, outperforming the general population in health metrics.
Frequently Asked Questions - Health
Cultural Diversity
In terms of cultural diversity, Cape York records figures broadly comparable to the national average, as found in AreaSearch's assessment of a number of language and cultural background related metrics
Cape York's cultural diversity aligns with the wider region's average, with 81.9% of its population being citizens, 89.2% born in Australia, and 71.7% speaking English only at home. Christianity is the dominant religion in Cape York, comprising 57.6%, compared to 64.7% across the rest of Queensland. The top three ancestry groups are Australian Aboriginal (38.3%), Australian (16.0%), and English (15.8%).
Notably, Samoan representation is higher at 0.3% in Cape York than regionally at 0.2%. Other ethnicities show significant differences: Other at 12.7% vs regional 28.1%, and Maori at 0.5% vs regional 0.4%.
Frequently Asked Questions - Diversity
Age
Cape York's population is younger than the national pattern
The median age in Cape York is 35 years, which is lower than Queensland's average of 41 years and below the national average of 38 years. The 5-14 age cohort is notably higher at 15.1% compared to the rest of Queensland's average, while the 75-84 age group is under-represented at 4.6%. Post-2021 Census data shows that the 75-84 age group has increased from 3.5% to 4.6%, and the 45-54 cohort has decreased from 12.9% to 11.0%. Population forecasts for 2041 indicate significant demographic changes in Cape York, with the 25-34 age group projected to grow by 22% (282 people), reaching 1,539 from 1,256. Conversely, both the 55-64 and 5-14 age groups are expected to decrease in number.
