Chart Color Schemes
est. as @ -- *
ABS ERP | -- people | --
2021 Census | -- people
Sales Activity
Curious about local property values? Filter the chart to assess the volume and appreciation (including resales) trends and regional comparisons, or scroll to the map below view this information at an individual property level.
Find a Recent Sale
Sales Detail
Population
Fremantle lies within the top quartile of areas nationally for population growth performance according to AreaSearch analysis of recent, and medium to long-term trends
Fremantle's population, as of November 2025, is approximately 19,892. This figure represents a growth of 3,172 people since the 2021 Census, which recorded a population of 16,720. The increase is inferred from ABS data showing an estimated resident population of 19,584 in June 2024 and an additional 510 validated new addresses since the Census date. This results in a population density of 673 persons per square kilometer. Fremantle's growth rate of 19.0% from 2021 to 2025 exceeded the national average of 8.9%. Overseas migration contributed approximately 50.4% of overall population gains during this period, with other drivers including interstate migration and natural growth also being positive factors.
AreaSearch uses ABS/Geoscience Australia projections for each SA2 area released in 2024, based on 2022 data. For areas not covered by this data, AreaSearch utilises ABS Greater Capital Region projections released in 2023, based on 2022 data. Demographic trends project an above median population growth for the area, with an expected expansion of 4,502 persons to reach a total of 24,394 by 2041, indicating a 21.1% increase over the 17-year period.
Frequently Asked Questions - Population
Development
The level of residential development activity in Fremantle was found to be higher than 90% of real estate markets across the country
Fremantle has recorded approximately 160 residential properties granted approval each year over the past five financial years, totalling 803 homes. In FY26 so far, 46 approvals have been recorded. On average, 3.7 people per year moved to the area for each dwelling built between FY21 and FY25. This high demand exceeds new supply, typically leading to price growth and increased buyer competition.
The average construction cost of new properties is $489,000, indicating developers target the premium market segment with higher-end properties. Commercial approvals this financial year amount to $65.2 million, reflecting strong commercial development momentum. Compared to Greater Perth, Fremantle shows 66.0% higher new home approvals per person, offering greater choice for buyers. New building activity consists of 13.0% detached houses and 87.0% townhouses or apartments, promoting higher-density living that creates more affordable entry points, appealing to downsizers, investors, and first-home buyers. This shift marks a significant departure from the current housing pattern of 46.0% houses, likely due to diminishing developable land availability and evolving lifestyle preferences. The estimated count of 433 people per dwelling approval reflects Fremantle's quiet development environment.
Population forecasts indicate Fremantle will gain 4,194 residents by 2041. Existing development levels seem aligned with future requirements, maintaining stable market conditions without significant price pressures.
Frequently Asked Questions - Development
Infrastructure
Fremantle has moderate levels of nearby infrastructure activity, ranking in the 47thth percentile nationally
Infrastructure changes significantly influence an area's performance. AreaSearch identified 60 projects likely impacting the region. Notable initiatives include Swan River Crossings Project, Muse at Artisan Place, Monument East, and Serai North Fremantle. The following details projects expected to have the most relevance.
Professional plan users can use the search below to filter and access additional projects.
INFRASTRUCTURE SEARCH
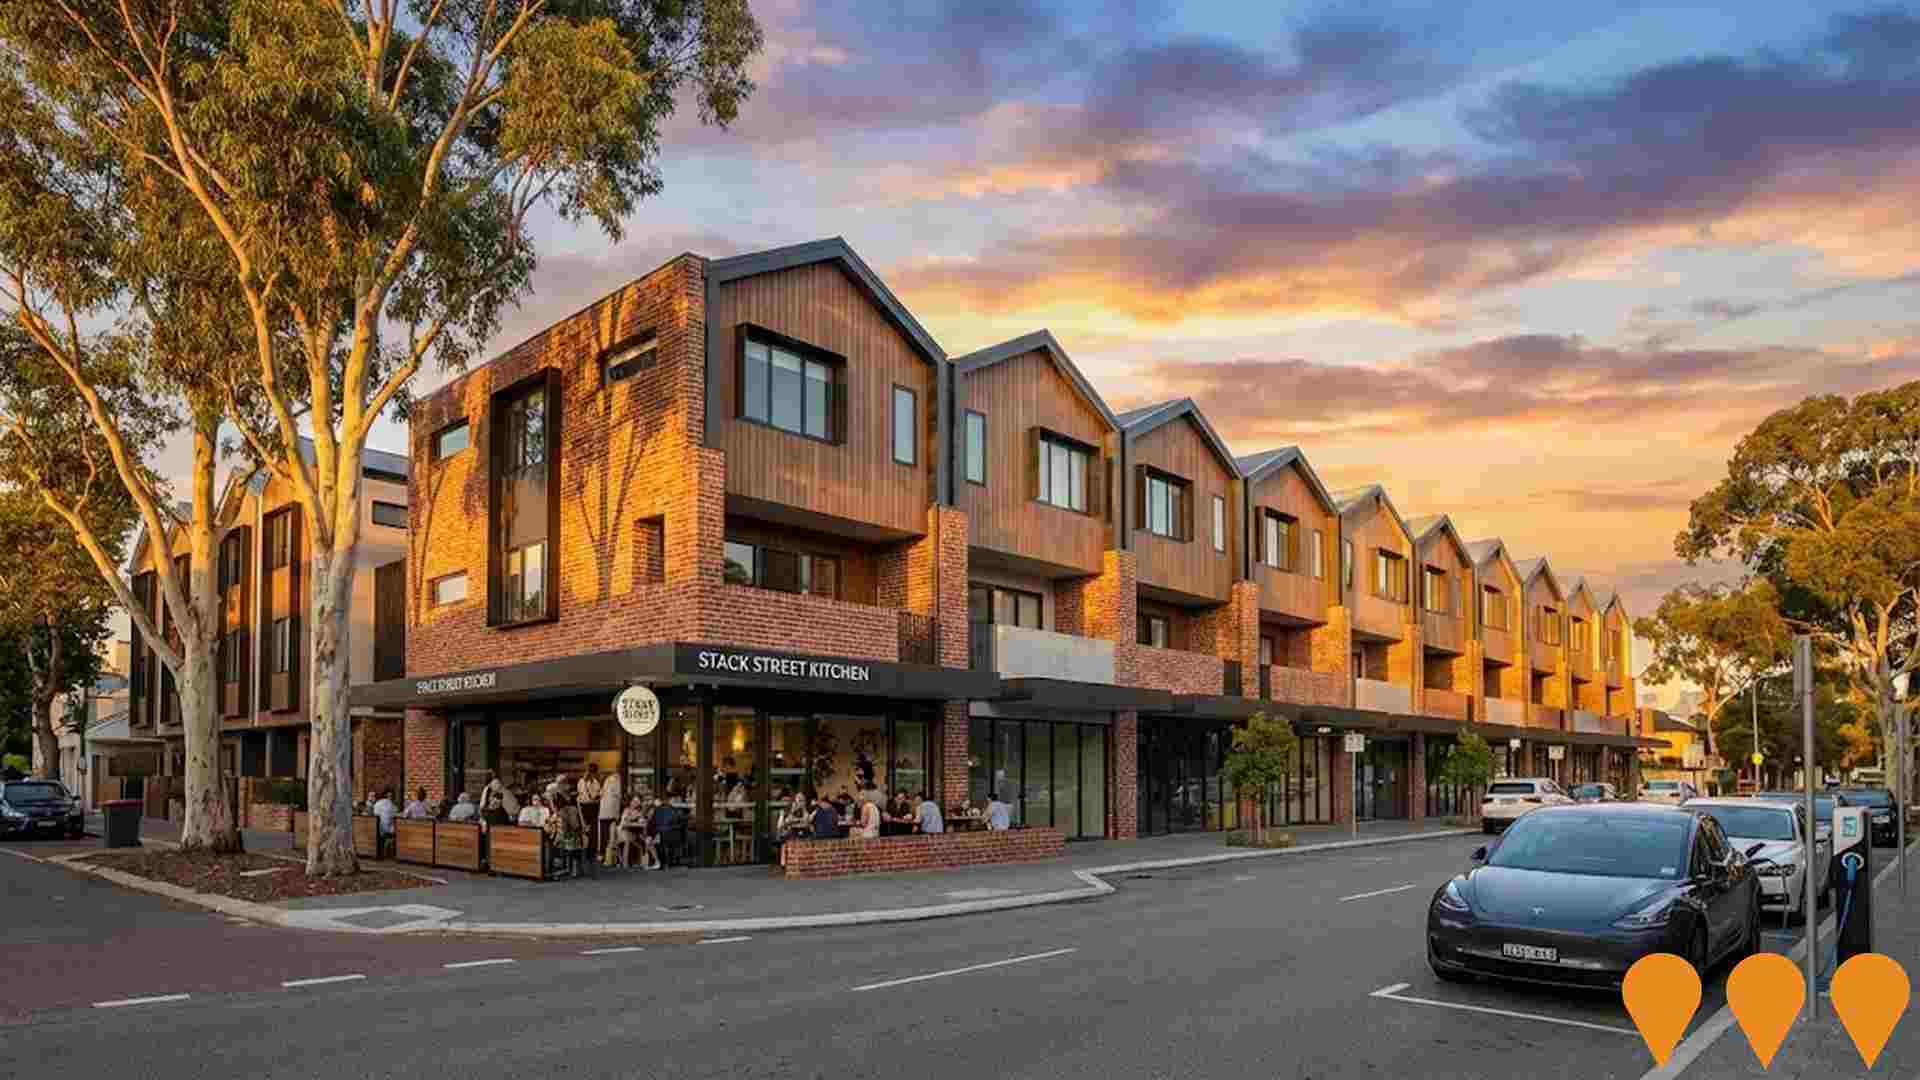
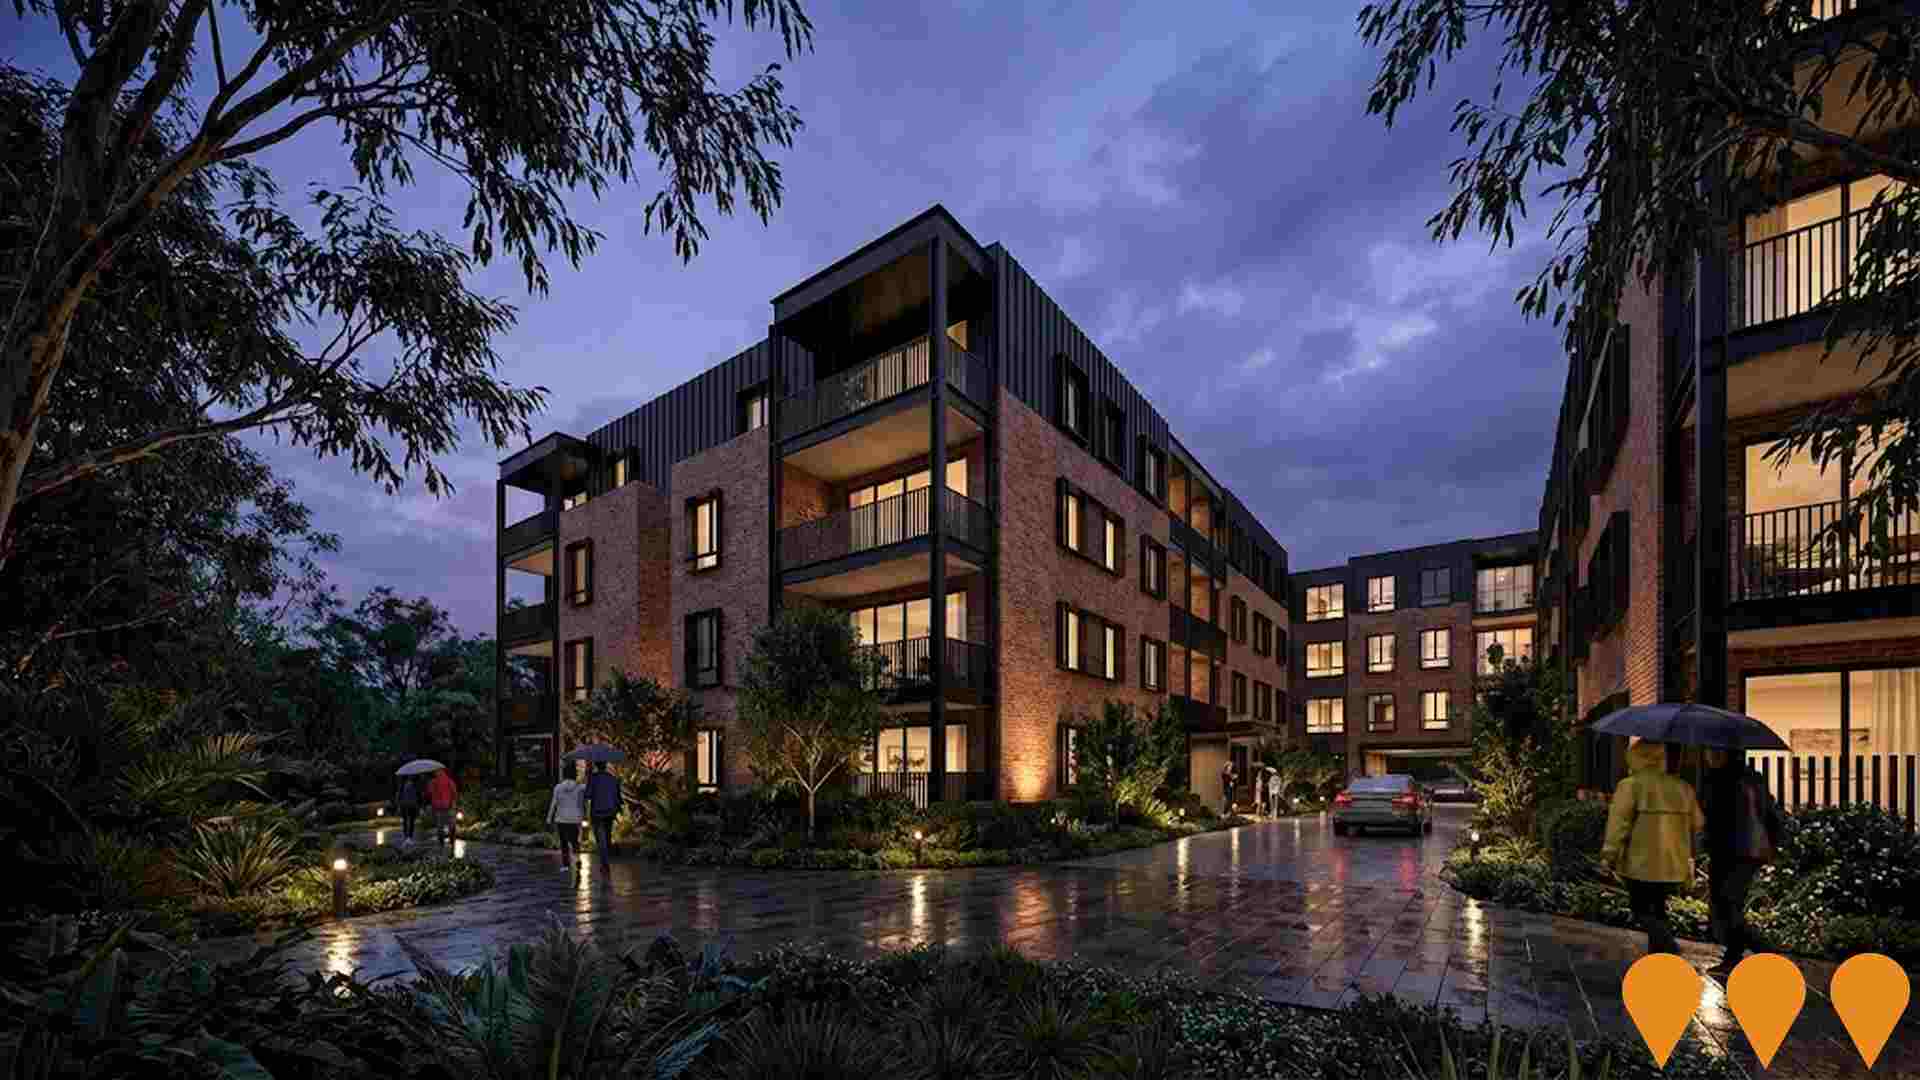
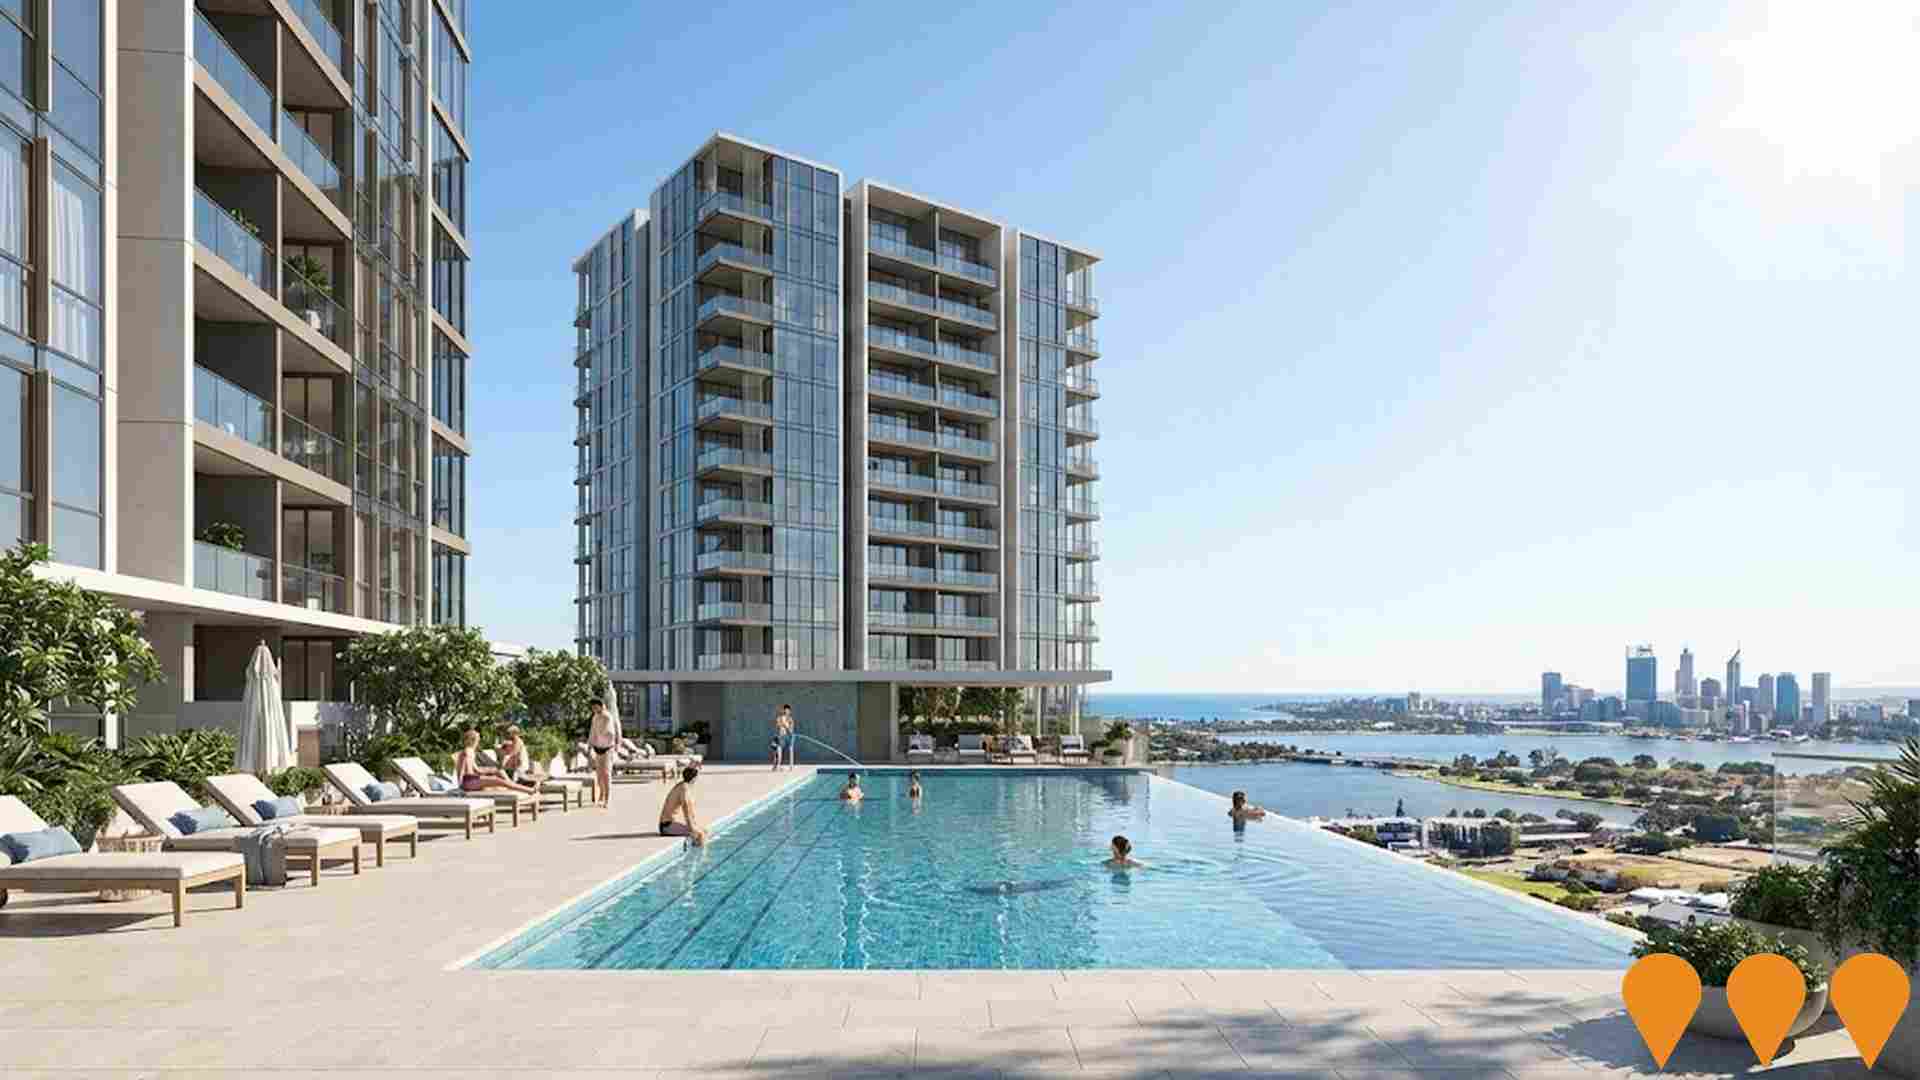
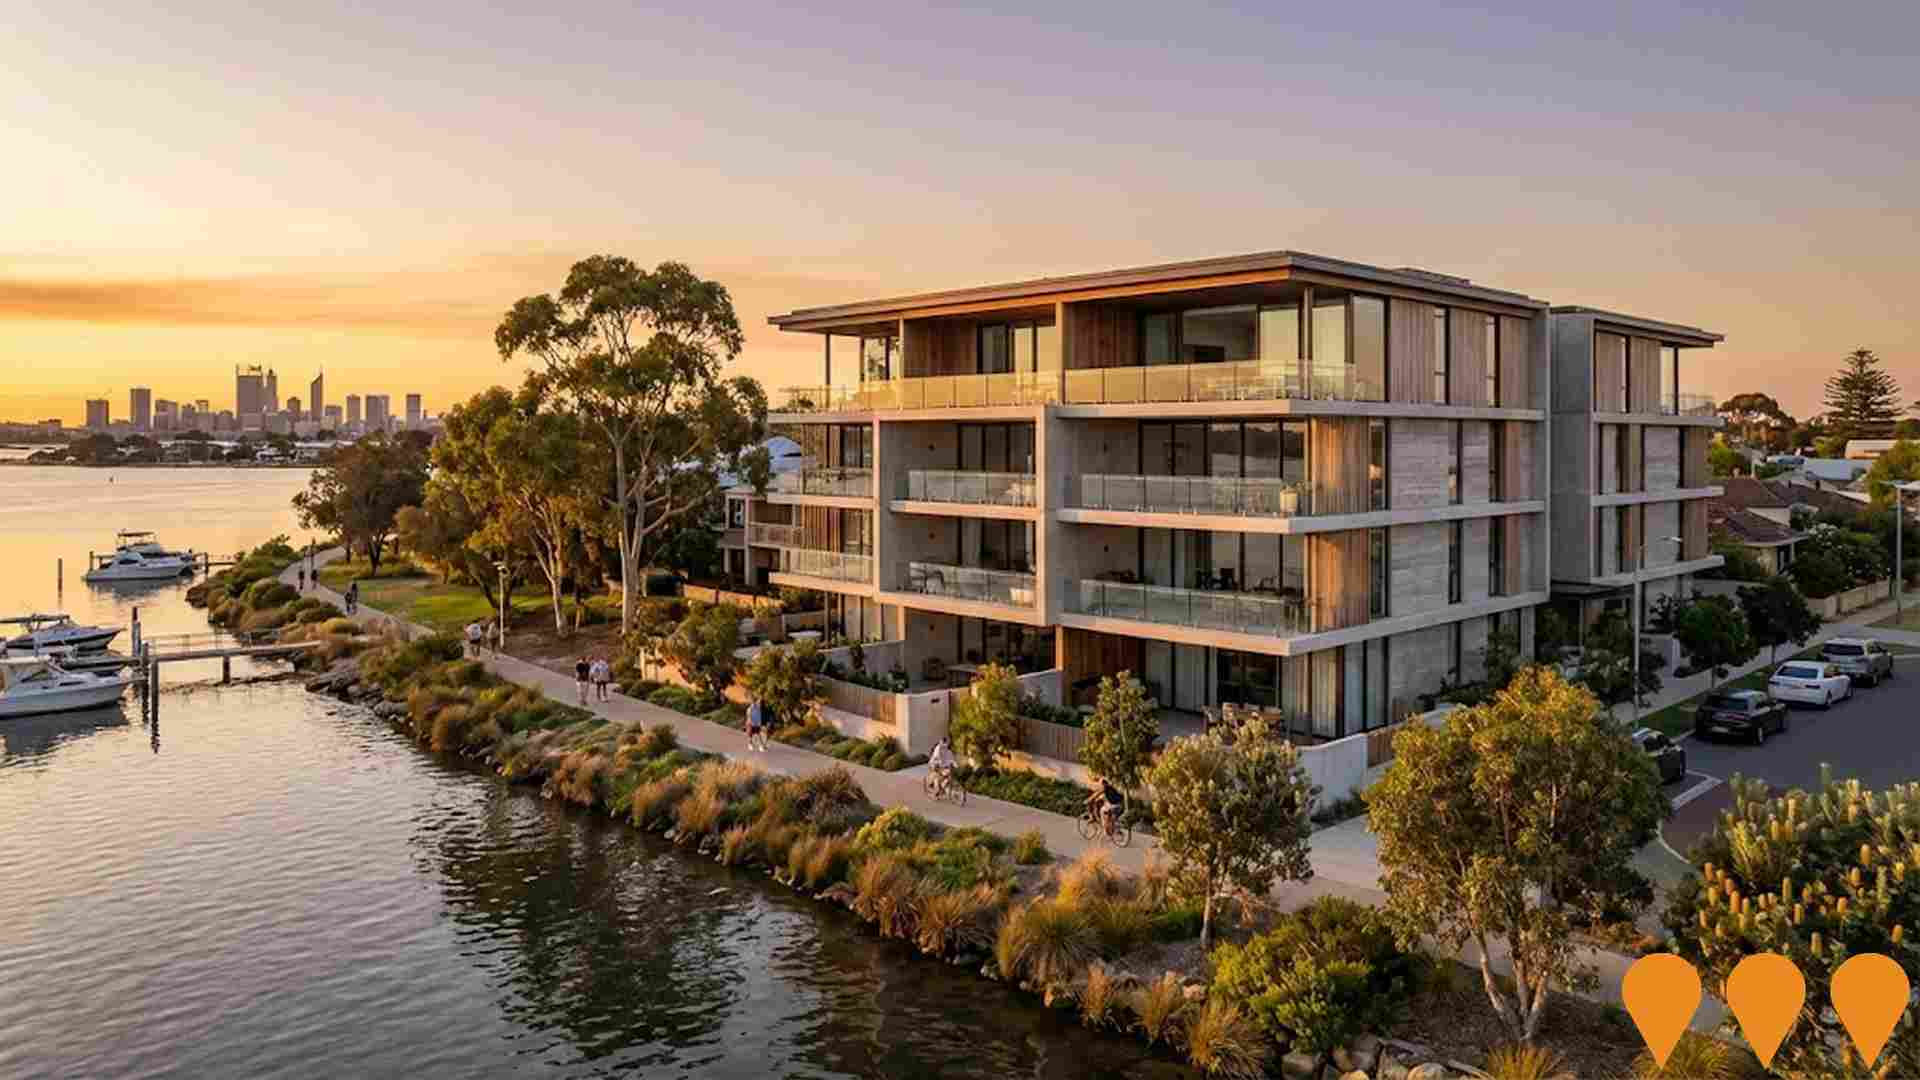
 Denotes AI-based impression for illustrative purposes only, not to be taken as definitive under any circumstances. Please follow links and conduct other investigations from the project's source for actual imagery. Developers and project owners wishing us to use original imagery please Contact Us and we will do so.
Frequently Asked Questions - Infrastructure
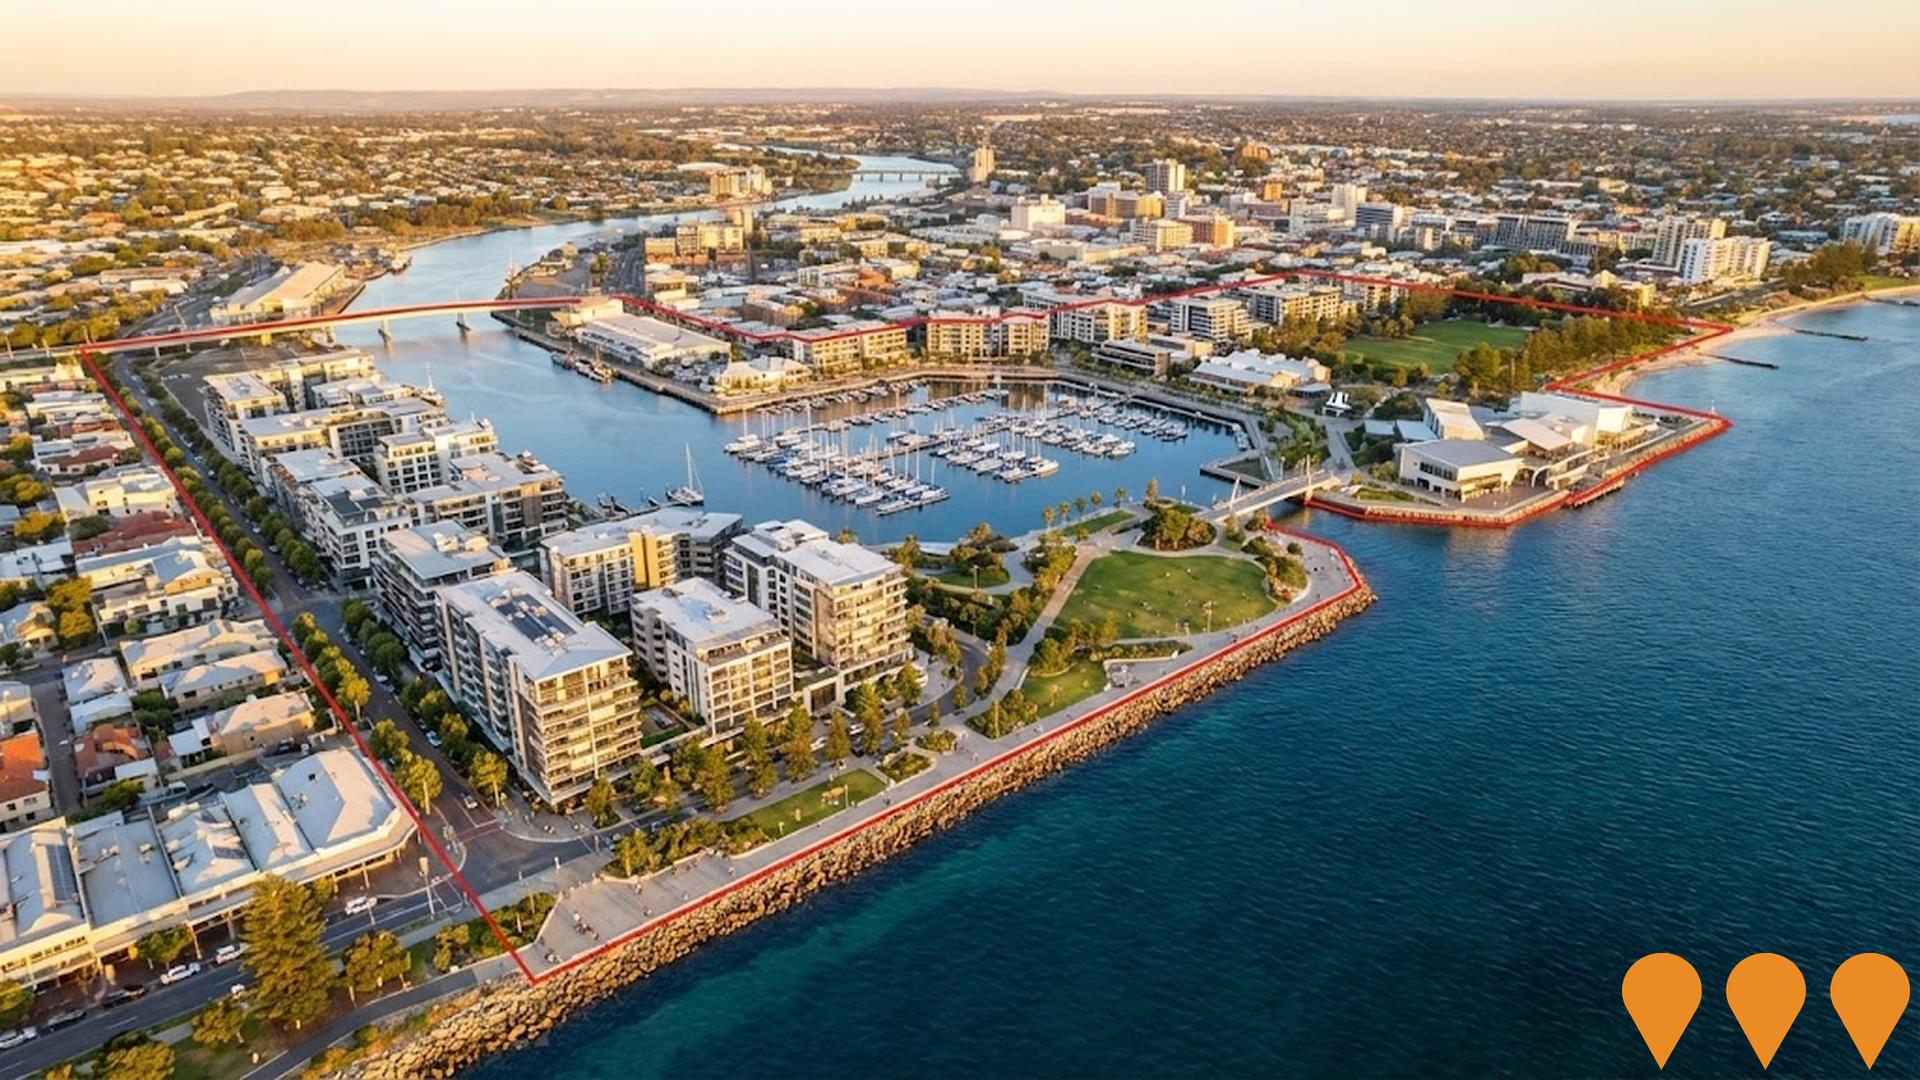
Future of Fremantle Waterfront
Long-term (50+ year) transformation of Fremantle's Inner Harbour and surrounding precincts after container shipping moves to Kwinana. The endorsed State Government vision will deliver a world-class waterfront city with up to 20,000 new dwellings, 55,000 residents, 10+ km of activated ocean and river frontage, major public parklands, tourism, cultural and education facilities, and an estimated 45,000 ongoing jobs.
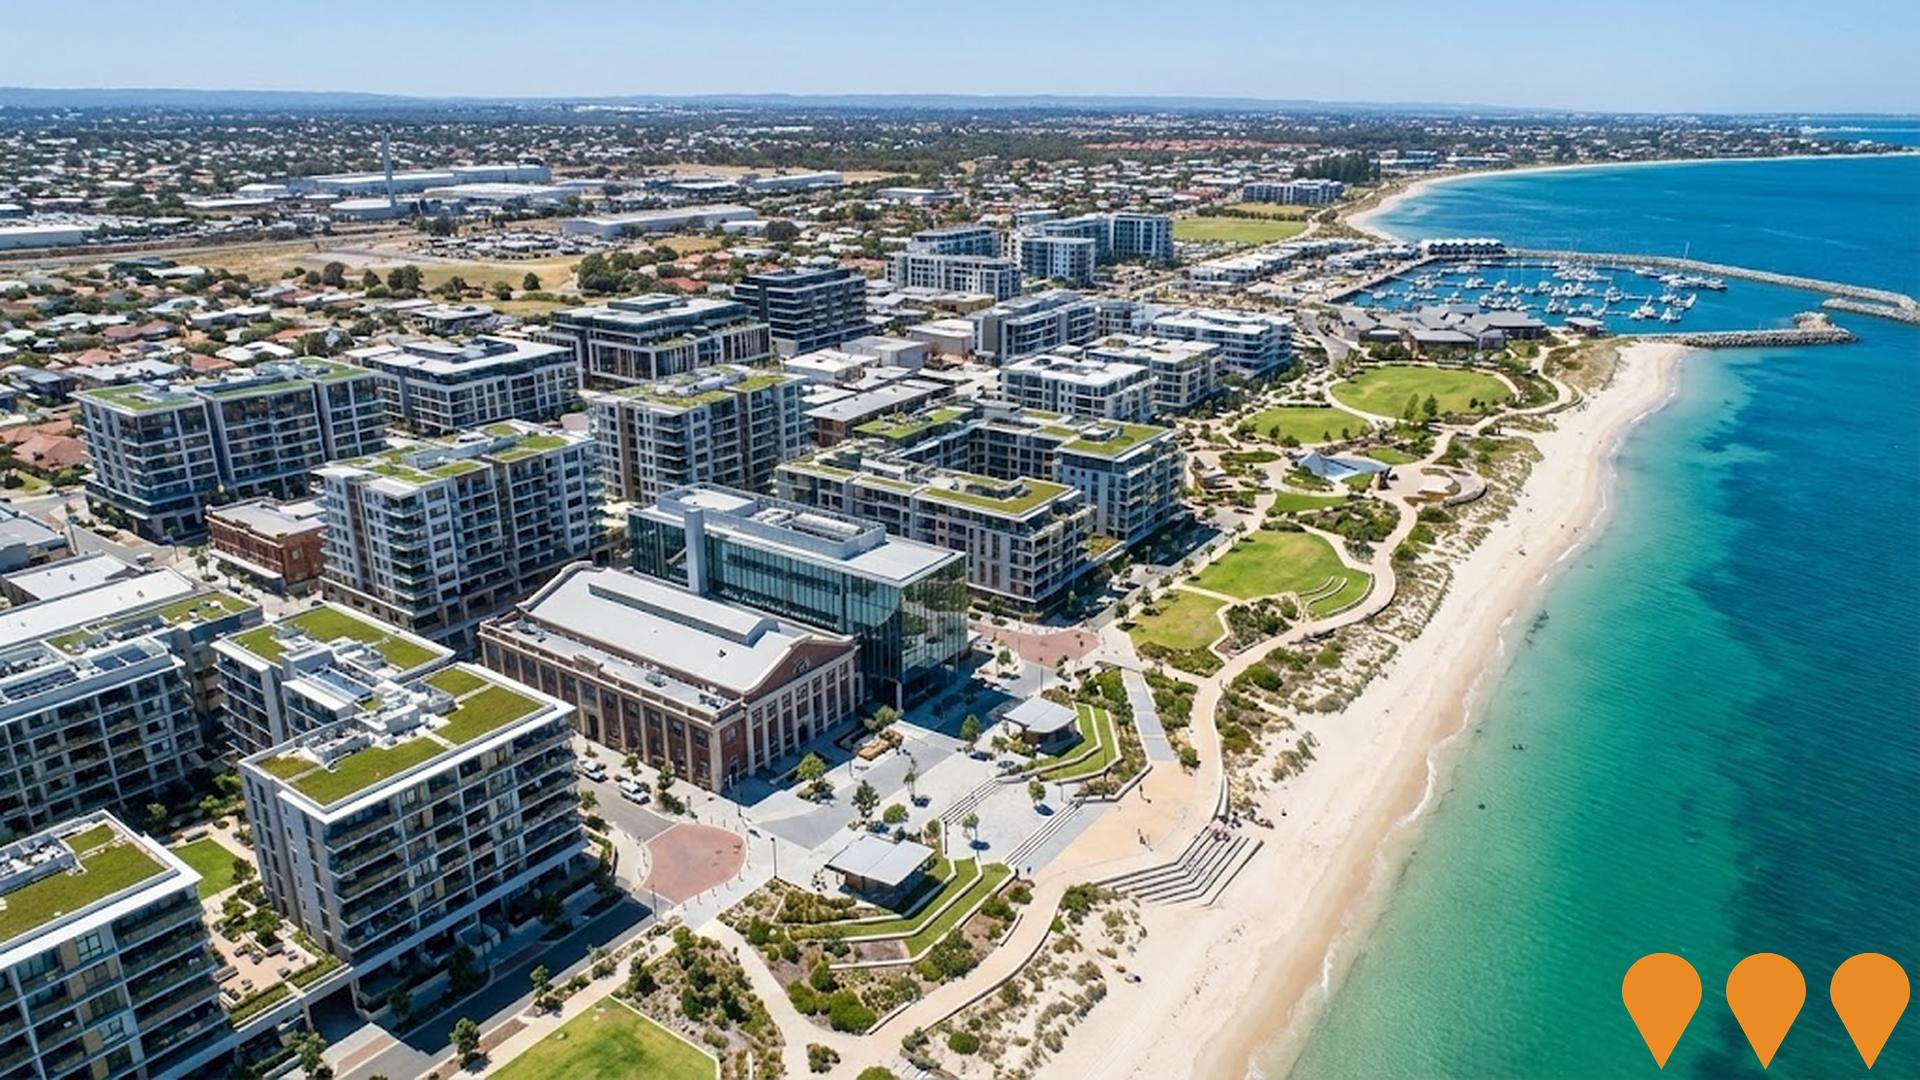
Cockburn Coast Redevelopment
Long term coastal urban renewal of about 98 hectares between South Beach and Port Coogee, transforming former industrial land into a mixed residential and commercial community. The project is planned for around 12,000 residents in about 6,000 dwellings across the Shoreline, Hilltop and Power Station precincts, with new community spaces, foreshore upgrades and adaptive reuse of the heritage South Fremantle Power Station as a key activity center.
Victoria Quay Revitalisation
Long-term revitalisation of Victoria Quay into a premier hospitality, entertainment, and tourism precinct. The first phase of short-term activation works is underway, including improving public spaces, enhancing access to Bathers Beach, and the redevelopment of heritage-listed B Shed into a new Rottnest ferry terminal, multi-use performance space, and common user ferry berth. This project is part of the broader Future of Fremantle Place and Economic Vision.

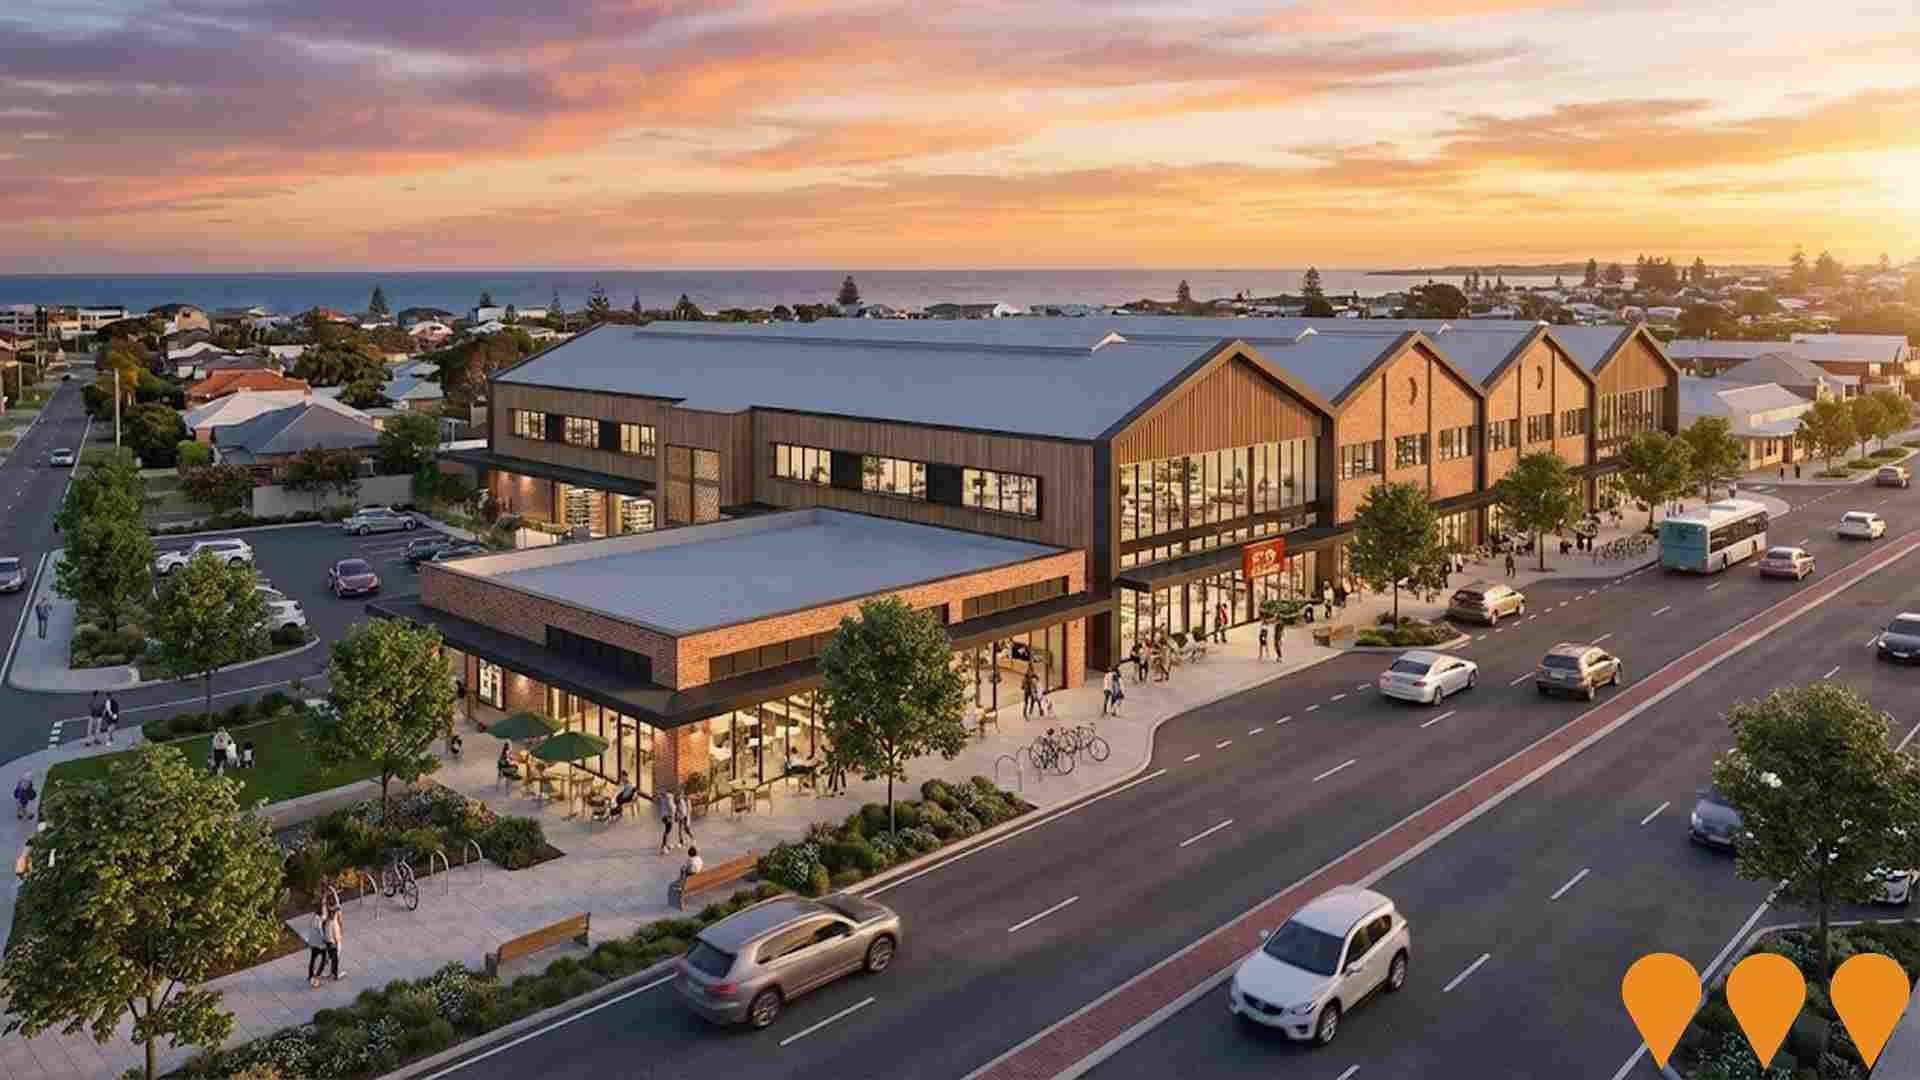
FOMO - Walyalup Koort (Kings Square)
FOMO (Fremantle On My Own) is the flagship retail component of the Walyalup Koort (formerly Kings Square) redevelopment, the largest public-private infrastructure project in Fremantle's history. The 5,500 sqm mixed-use precinct incorporates the adaptive reuse of the former Myer building and Queensgate carpark into a contemporary laneway retail and dining destination inspired by Asian hawker markets. The project seamlessly blends art, architecture, culture, retail, food and entertainment experiences, featuring a diverse mix of dining venues, FunLab entertainment complex (including Strike Bowling, Holey Moley, and B.Lucky & Sons), IGA Freo supermarket, and independent retailers. The development is part of the broader Walyalup Koort precinct which includes 20,800 sqm of WA State Government office space and the new Walyalup Civic Centre. FOMO has received multiple awards including PCA State Development of the Year 2023, Best Retail Under 75 Stores 2022, and Best Mixed-Use Development 2022, setting a new benchmark for urban regeneration and experiential retail in Western Australia.

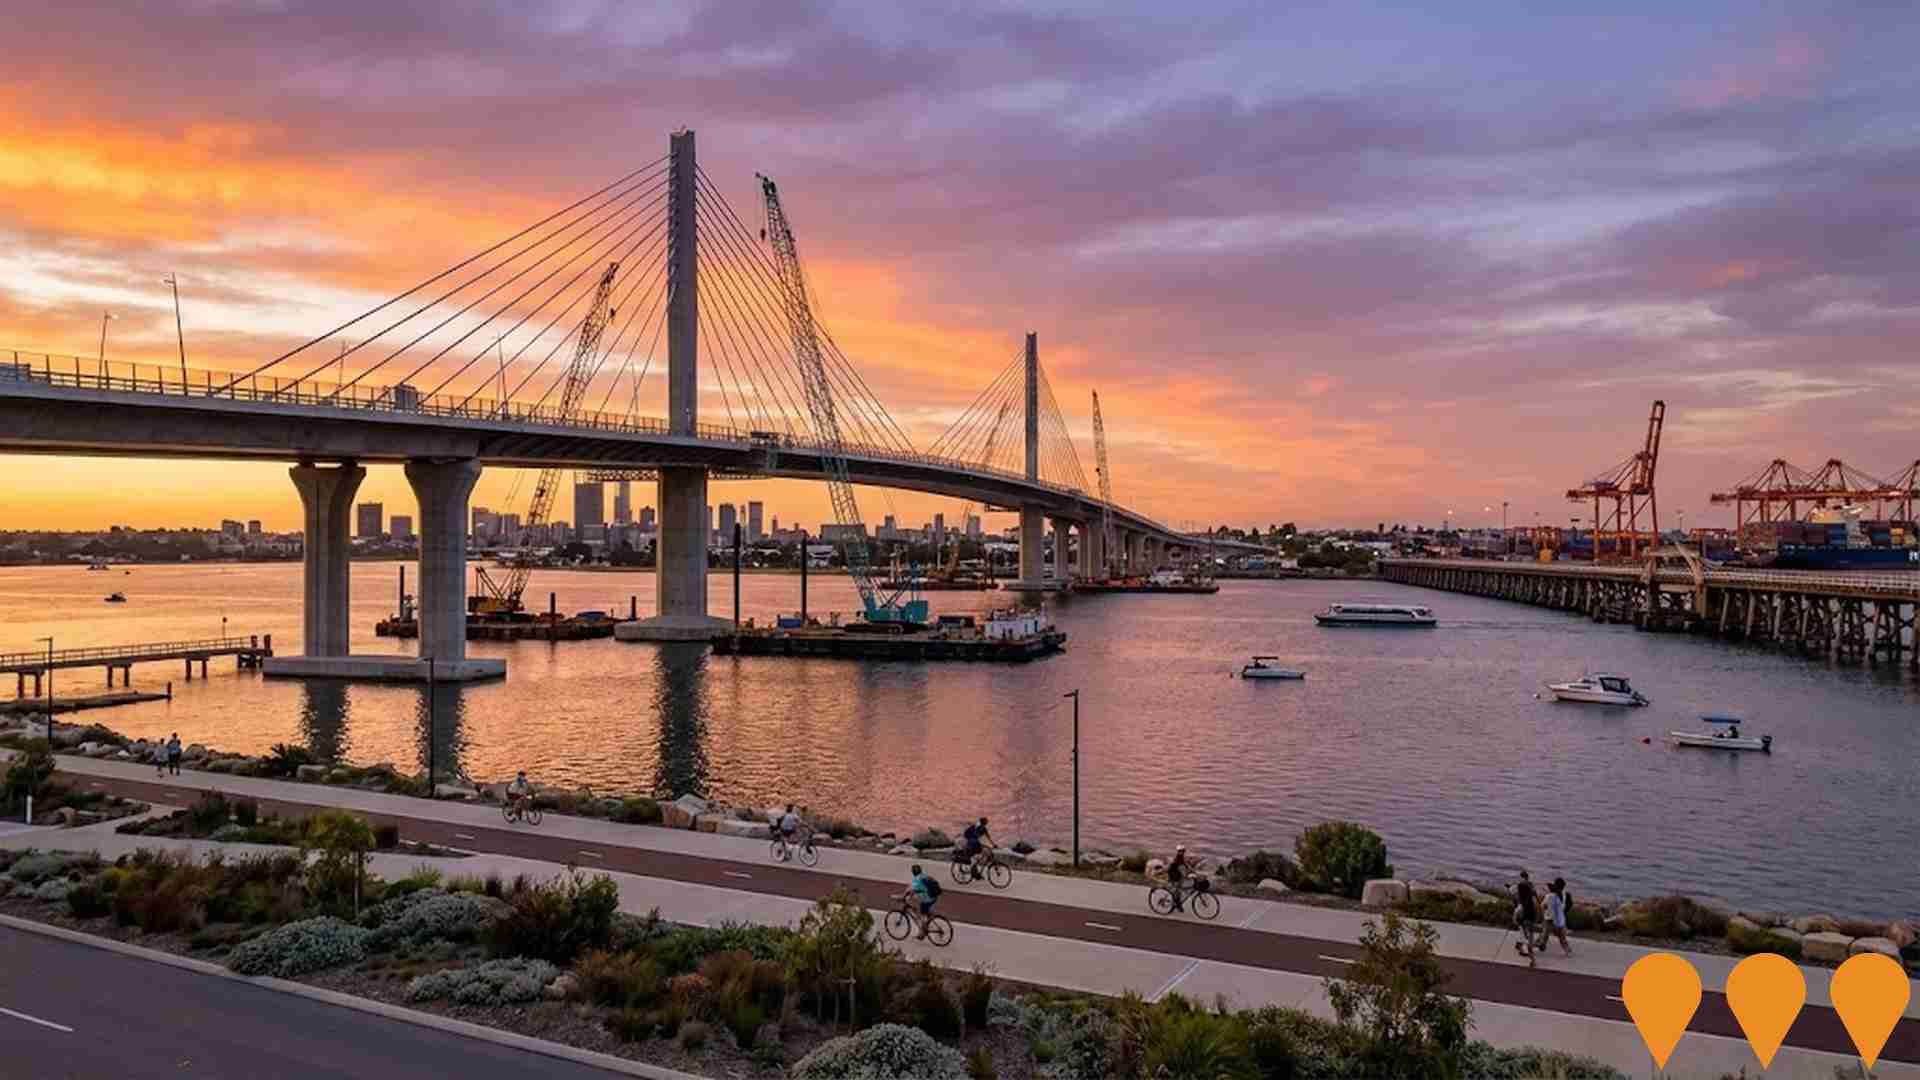
Swan River Crossings Project
The Swan River Crossings Project is replacing the aging Fremantle Traffic Bridge with Australia's first extradosed bridge, featuring two lanes in each direction, wider active transport paths (up to 4m wide), higher clearance for watercraft (up to 9m), and enhanced connectivity between Fremantle and North Fremantle. The new bridge combines balanced cantilever precast segmental construction with cable supports and will serve as an iconic gateway to Fremantle. Construction is underway with completion expected in 2026, and the existing bridge will remain operational until early 2026 to minimize disruption.
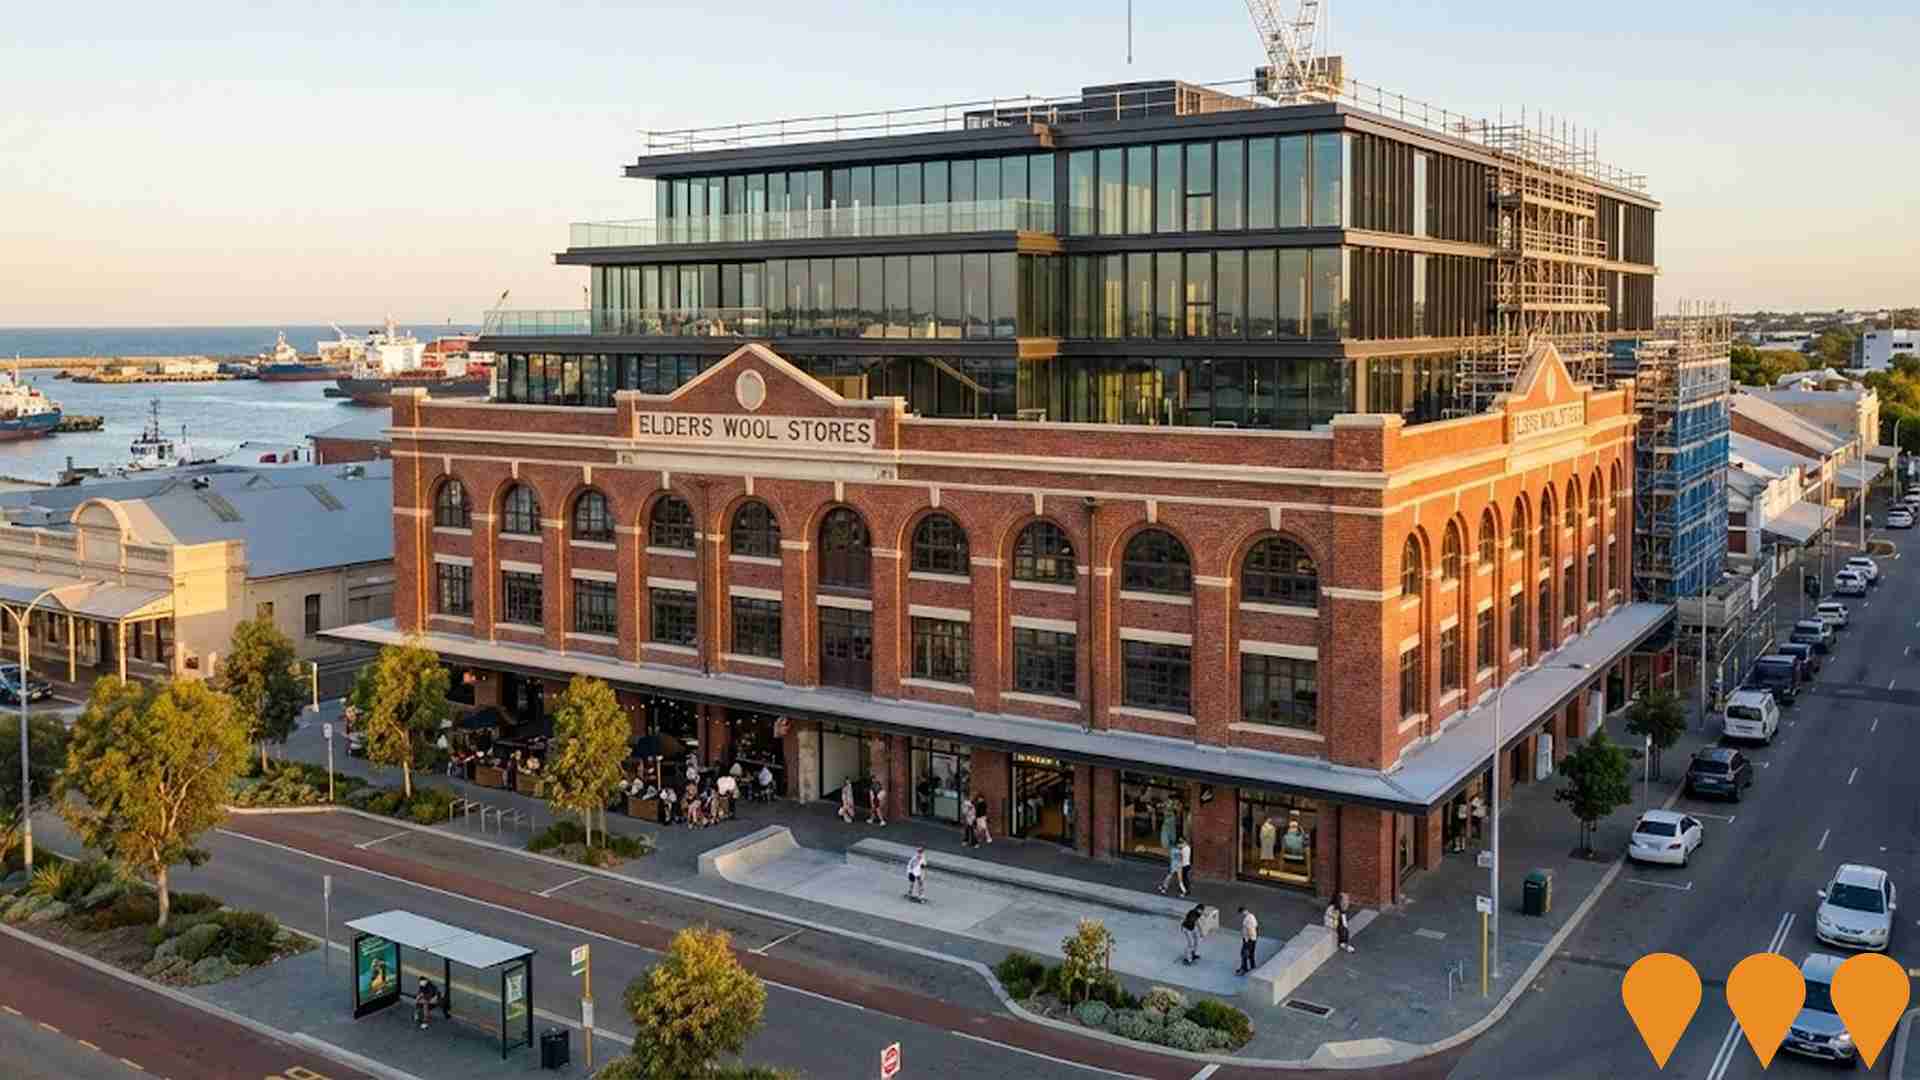
Elder Place Fremantle (Elders Wool Stores Redevelopment)
A $110 million heritage redevelopment of the Elders Wool Stores (built 1927, extended 1950s), transforming the long-vacant buildings into Western Australia's largest heritage redevelopment. The seven-storey mixed-use development will comprise 213 residential units including 33 boutique apartments (1, 2 and 3-bedroom plus penthouses), 6 three-level townhouses, and 174 co-living rental units with shared facilities. The project will deliver over 6,600 square meters of commercial office space, ground floor hospitality venues including a tavern, cafes, restaurants and bars, plus small retail outlets along Cantonment Street. Designed by Fremantle architects Spaceagency, the development will retain 80% of the world-famous skate ledge and preserve the heritage facades while adding three levels to the original structure. Development application received Council support in April 2025, with ongoing community consultation regarding heritage elements and skate ledge access.
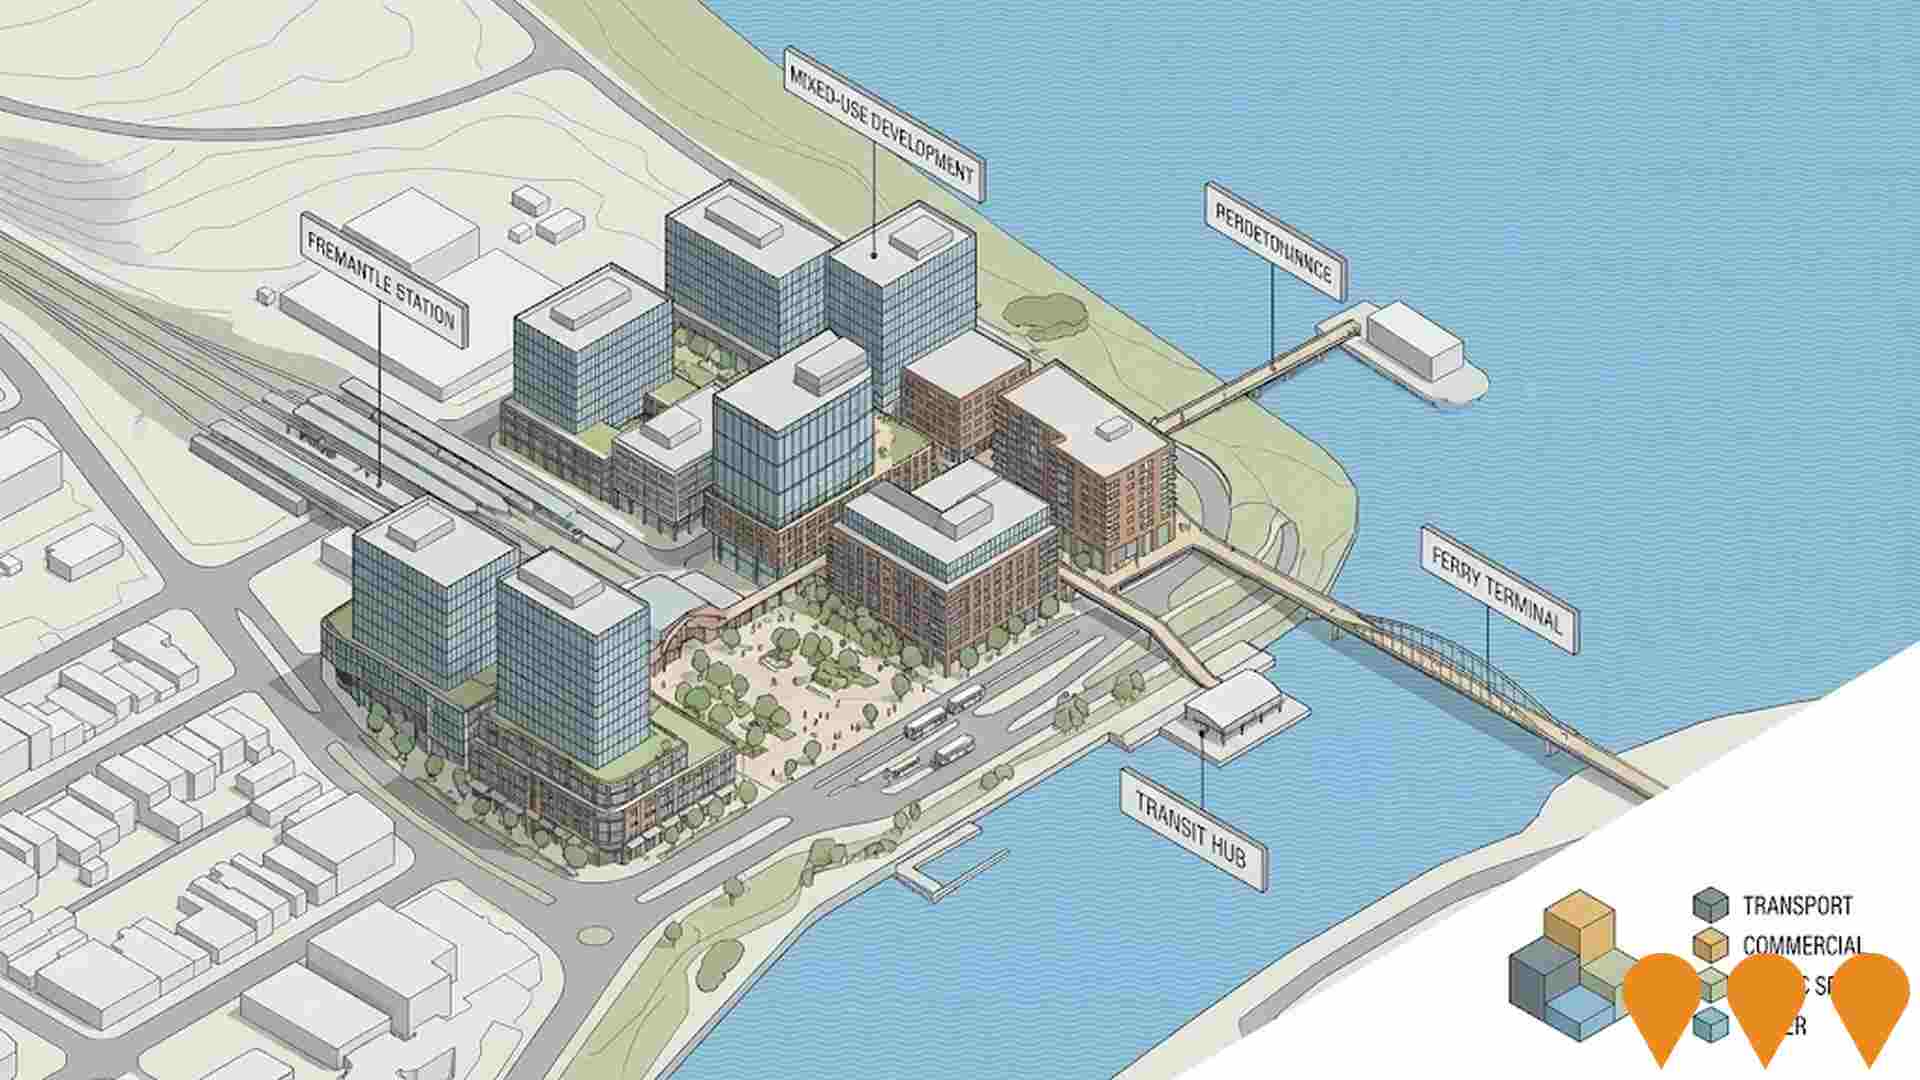
Fremantle Station Precinct Plan
Strategic planning for Fremantle Station precinct redevelopment including transit-oriented development, improved connectivity, and mixed-use opportunities. Integration with broader Fremantle transformation initiatives.
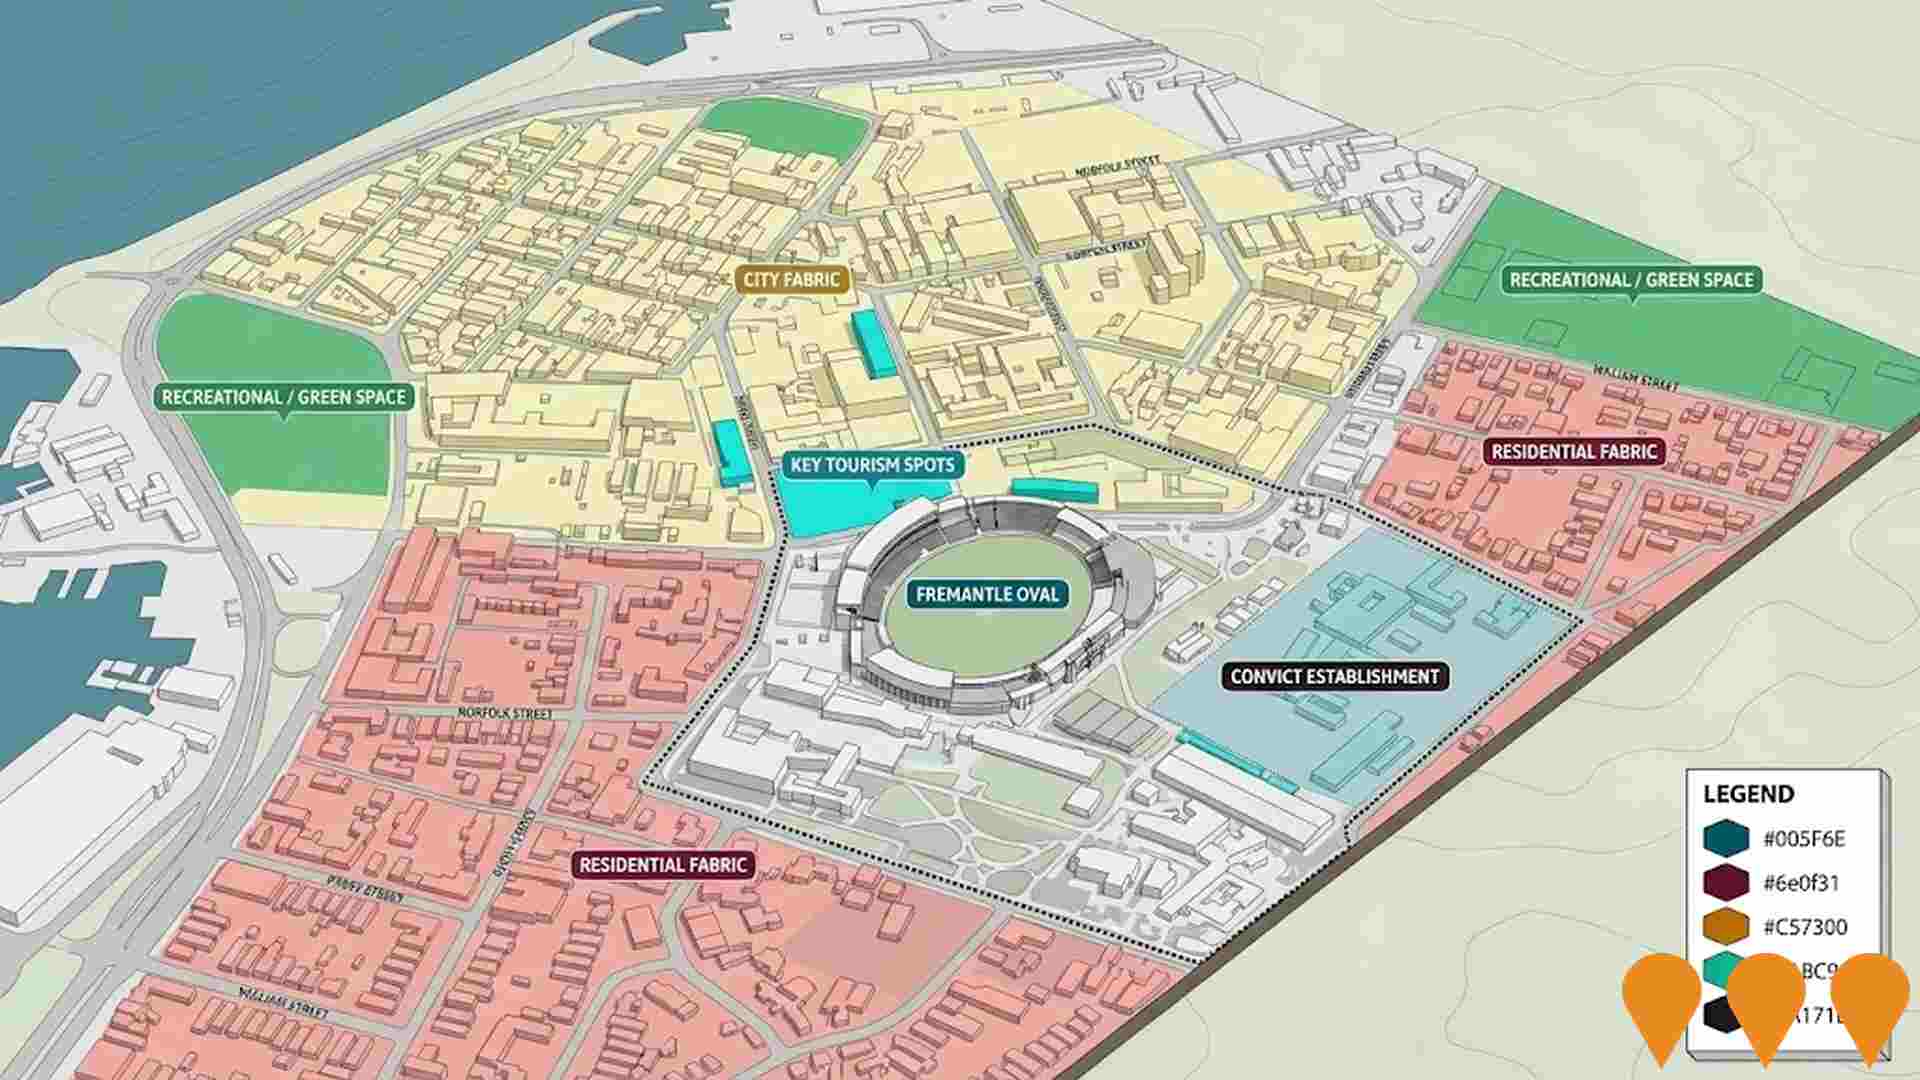
Fremantle Oval Precinct Masterplan
Council-endorsed masterplan to redevelop the Fremantle Oval precinct with upgraded football facilities, improved spectator experience, better community access, event capability, and refurbishment of Victoria Pavilion. The City is preparing a business case and seeking State and Federal funding to progress detailed design and delivery.
Employment
Fremantle has seen below average employment performance when compared to national benchmarks
Fremantle has a highly educated workforce with strong representation in professional services. Its unemployment rate was 5.2% as of June 2024.
Employment growth over the past year was estimated at 4.9%. As of June 2025, 11,612 residents were employed, with an unemployment rate of 5.3%, 1.4% higher than Greater Perth's rate of 3.9%. Workforce participation in Fremantle was broadly similar to Greater Perth's at 65.2%. Key industries for employment among residents are health care & social assistance, professional & technical services, and education & training.
Fremantle has a particularly strong specialization in professional & technical services, with an employment share of 1.6 times the regional level. Retail trade employs only 6.1% of local workers, lower than Greater Perth's 9.3%. As at the Census, there are 1.1 workers for every resident, indicating that Fremantle functions as an employment hub hosting more jobs than residents and attracting workers from surrounding areas. Between June 2024 and June 2025, employment levels increased by 4.9% and labour force grew by 5.8%, causing the unemployment rate to rise by 0.8 percentage points. In contrast, Greater Perth saw employment rise by 3.7%, labour force grow by 3.8%, and unemployment increase by only 0.1 percentage points. Jobs and Skills Australia's national employment forecasts from May 2025 project a 6.6% expansion in employment over five years and 13.7% over ten years. However, growth rates vary significantly between industry sectors. Applying these projections to Fremantle's employment mix suggests local growth of approximately 6.9% over five years and 14.3% over ten years.
Frequently Asked Questions - Employment
Income
Income metrics indicate excellent economic conditions, with the area achieving higher performance than 75% of national locations assessed by AreaSearch
Fremantle's income level is among the top percentile nationally according to ATO data aggregated by AreaSearch for financial year 2022. Fremantle's median income among taxpayers was $60,926 and the average income stood at $94,686. These figures compare to Greater Perth's median of $58,380 and average of $78,020 respectively. Based on Wage Price Index growth of 14.2% since financial year 2022, current estimates would be approximately $69,577 for the median income and $108,131 for the average as of September 2025. Census data reveals individual earnings stand out at the 84th percentile nationally ($1,059 weekly). In Fremantle, 27.2% of the population (5,410 individuals) fall within the $1,500 - 2,999 income range, mirroring the region where 32.0% occupy this bracket. A substantial proportion of high earners, 32.3%, are above $3,000/week, indicating strong economic capacity throughout Fremantle. High housing costs consume 15.3% of income, though strong earnings still place disposable income at the 64th percentile nationally. The area's SEIFA income ranking places it in the 8th decile.
Frequently Asked Questions - Income
Housing
Fremantle displays a diverse mix of dwelling types, with a higher proportion of rental properties than the broader region
In Fremantle, as per the latest Census, 45.6% of dwellings were houses while 54.4% comprised semi-detached homes, apartments, and other types. This contrasted with Perth metro's dwelling structure of 61.2% houses and 38.8% other dwellings. Home ownership in Fremantle stood at 31.5%, with mortgaged dwellings at 30.4% and rented ones at 38.0%. The median monthly mortgage repayment was $2,167, aligning with Perth metro's average, while the median weekly rent was $385 compared to Perth metro's $379. Nationally, Fremantle's mortgage repayments were higher than the Australian average of $1,863, and rents exceeded the national figure of $375.
Frequently Asked Questions - Housing
Household Composition
Fremantle features high concentrations of lone person households and group households, with a lower-than-average median household size
Family households constitute 57.0% of all households, including 19.9% couples with children, 28.2% couples without children, and 8.2% single parent families. Non-family households comprise the remaining 43.0%, with lone person households at 36.9% and group households making up 6.1%. The median household size is 2.1 people, which is smaller than the Greater Perth average of 2.3.
Frequently Asked Questions - Households
Local Schools & Education
Fremantle shows strong educational performance, ranking in the upper quartile nationally when assessed across multiple qualification and achievement indicators
Educational attainment in Fremantle is notably high with 48.9% of residents aged 15+ holding university qualifications, compared to 27.9% in WA and 28.6% in the SA4 region. Bachelor degrees are most prevalent at 30.5%, followed by postgraduate qualifications (13.7%) and graduate diplomas (4.7%). Vocational credentials are also common with 25.8% of residents aged 15+ holding such qualifications, including advanced diplomas (10.9%) and certificates (14.9%). Educational participation is high at 26.9%, comprising 9.1% in tertiary education, 6.5% in primary education, and 6.1% pursuing secondary education.
Fourteen schools serve a total of 3,943 students in the area, with an ICSEA score of 1116 indicating significant socio-educational advantages and academic achievement. Education provision is balanced with eight primary and six secondary schools serving distinct age groups.
Frequently Asked Questions - Education
Schools Detail
Nearby Services & Amenities
Transport
Transport servicing is high compared to other areas nationally based on assessment of service frequency, route connectivity and accessibility
Fremantle has 121 active transport stops operating within its boundaries. These consist of a mix of train and bus stops serviced by 37 individual routes. Together, these routes provide 7,986 weekly passenger trips.
Residents enjoy good transport accessibility, with an average distance of 268 meters to the nearest stop. Service frequency averages 1,140 trips per day across all routes, equating to approximately 66 weekly trips per individual stop.
Frequently Asked Questions - Transport
Transport Stops Detail
Health
Fremantle's residents are healthier than average in comparison to broader Australia with a fairly standard level of common health conditions seen across both young and old age cohorts
Fremantle's health data shows positive results with common conditions affecting both young and elderly residents similarly. Private health cover is high at approximately 69% of Fremantle's total population (13,785 people), compared to Greater Perth's 67.0% and the national average of 55.3%. Mental health issues impact 10.1% and arthritis affects 7.2% of Fremantle residents.
69.1% report no medical ailments, slightly lower than Greater Perth's 69.6%. As of 2021, 20.4% of Fremantle residents are aged 65 and over (4,050 people). Health outcomes among seniors in Fremantle are particularly strong, outperforming the general population in health metrics.
Frequently Asked Questions - Health
Cultural Diversity
Fremantle was found to be more culturally diverse than the vast majority of local markets in Australia, upon assessment of a range of language and cultural background related metrics
Fremantle's population showed high cultural diversity, with 12.9% speaking a language other than English at home and 31.5% born overseas. Christianity was the predominant religion, comprising 36.2%. Notably, Judaism had a higher representation in Fremantle at 0.4%, compared to Greater Perth's 0.3%.
In terms of ancestry, the top groups were English (30.9%), Australian (19.9%), and Irish (10.6%). Some ethnicities showed notable differences: French was slightly overrepresented at 1.2% in Fremantle versus 1.0% regionally, as were Welsh at 1.1% (versus 1.0%) and Croatian at 1.2% (versus 1.4%).
Frequently Asked Questions - Diversity
Age
Fremantle hosts an older demographic, ranking in the top quartile nationwide
The median age in Fremantle is 43 years, which is higher than Greater Perth's average of 37 years and exceeds the national average of 38 years. The age profile shows that those aged 55-64 are particularly prominent at 13.6%, while those aged 5-14 are relatively smaller at 9.7%. Between 2021 and present, the 5-14 age group has increased from 7.8% to 9.7%, while the 75-84 cohort has risen from 5.9% to 6.9%. Conversely, the 45-54 age group has decreased from 13.8% to 12.2%. By 2041, demographic projections indicate significant shifts in Fremantle's age structure. The 75-84 age cohort is projected to rise substantially by 1,046 people (76%), from 1,376 to 2,423. Notably, the combined 65+ age groups are expected to account for 57% of total population growth, reflecting the area's aging demographic profile. Meanwhile, the 0-4 and 35-44 cohorts are projected to experience population declines.
