Chart Color Schemes
This analysis uses ABS Statistical Areas Level 2 (SA2) boundaries, which can materially differ from Suburbs and Localities (SAL) even when sharing similar names.
SA2 boundaries are defined by the Australian Bureau of Statistics and are designed to represent communities for statistical reporting (e.g., census and ERP).
Suburbs and Localities (SAL) represent commonly-used suburb/locality names (postal-style areas) and may use different geographic boundaries. For comprehensive analysis, consider reviewing both boundary types if available.
est. as @ -- *
ABS ERP | -- people | --
2021 Census | -- people
Sales Activity
Curious about local property values? Filter the chart to assess the volume and appreciation (including resales) trends and regional comparisons, or scroll to the map below view this information at an individual property level.
Find a Recent Sale
Sales Detail
Population
Population growth drivers in Balga - Mirrabooka are slightly above average based on AreaSearch's ranking of recent, and medium term trends
Based on AreaSearch's analysis, Balga - Mirrabooka's population was around 23,324 as of Nov 2025. This reflected an increase of 2,292 people (10.9%) since the 2021 Census, which reported a population of 21,032 people. The change was inferred from the estimated resident population of 23,317 from the ABS as of June 2024 and an additional 62 validated new addresses since the Census date. This level of population equated to a density ratio of 2,468 persons per square kilometer, placing it in the upper quartile relative to national locations assessed by AreaSearch. Balga - Mirrabooka's 10.9% growth since the 2021 census exceeded the national average (8.9%), along with the SA3 area, marking it as a growth leader in the region. Population growth for the area was primarily driven by overseas migration that contributed approximately 71.4% of overall population gains during recent periods.
AreaSearch is adopting ABS/Geoscience Australia projections for each SA2 area, as released in 2024 with 2022 as the base year. For any SA2 areas not covered by this data, and to estimate growth across all areas in the years post-2032, AreaSearch is utilising the growth rates by age cohort provided by the ABS in its latest Greater Capital Region projections (released in 2023, based on 2022 data). As we examine future population trends, a population increase just below the median of national areas is expected, with the area expected to expand by 2,660 persons to 2041 based on the latest annual ERP population numbers, reflecting a gain of 11.4% in total over the 17 years.
Frequently Asked Questions - Population
Development
AreaSearch assessment of residential development activity positions Balga - Mirrabooka among the top 25% of areas assessed nationwide
Balga - Mirrabooka has averaged approximately 93 new dwelling approvals annually over the past five financial years, from FY21 to FY25, with a total of 468 homes approved during this period. Additionally, 56 dwellings have been approved in FY26 up until now. On average, 4.3 new residents arrive per year for each dwelling constructed between FY21 and FY25.
This has led to demand significantly outstripping new supply, typically resulting in price growth and increased buyer competition. The average construction cost of new properties is $190,000, which is below the regional average, indicating more affordable housing options for buyers. In terms of commercial development, $3.1 million worth of approvals have been registered this financial year, suggesting the area's predominantly residential character.
Compared to Greater Perth, Balga - Mirrabooka has similar development levels per capita, maintaining market balance consistent with the broader region. The current new building activity shows 71.0% detached dwellings and 29.0% attached dwellings, reflecting the area's suburban identity with a concentration of family homes suited to buyers seeking space. As of now, there are approximately 234 people per approval in Balga - Mirrabooka, indicating a transitioning market. According to the latest AreaSearch quarterly estimate, the area is forecasted to gain around 2,653 residents by 2041. Current construction rates appear balanced with future demand, fostering steady market conditions without excessive price pressure.
Frequently Asked Questions - Development
Infrastructure
Balga - Mirrabooka has emerging levels of nearby infrastructure activity, ranking in the 36thth percentile nationally
Changes to local infrastructure significantly influence an area's performance. AreaSearch has identified 18 projects likely to impact the area. Notable ones include Perth Active Transport Network, TAFE Balga Campus Skills Hub, Perth Film Studios, and Girrawheen Hub Precinct Redevelopment. The following list details those projected to be most relevant.
Professional plan users can use the search below to filter and access additional projects.
INFRASTRUCTURE SEARCH
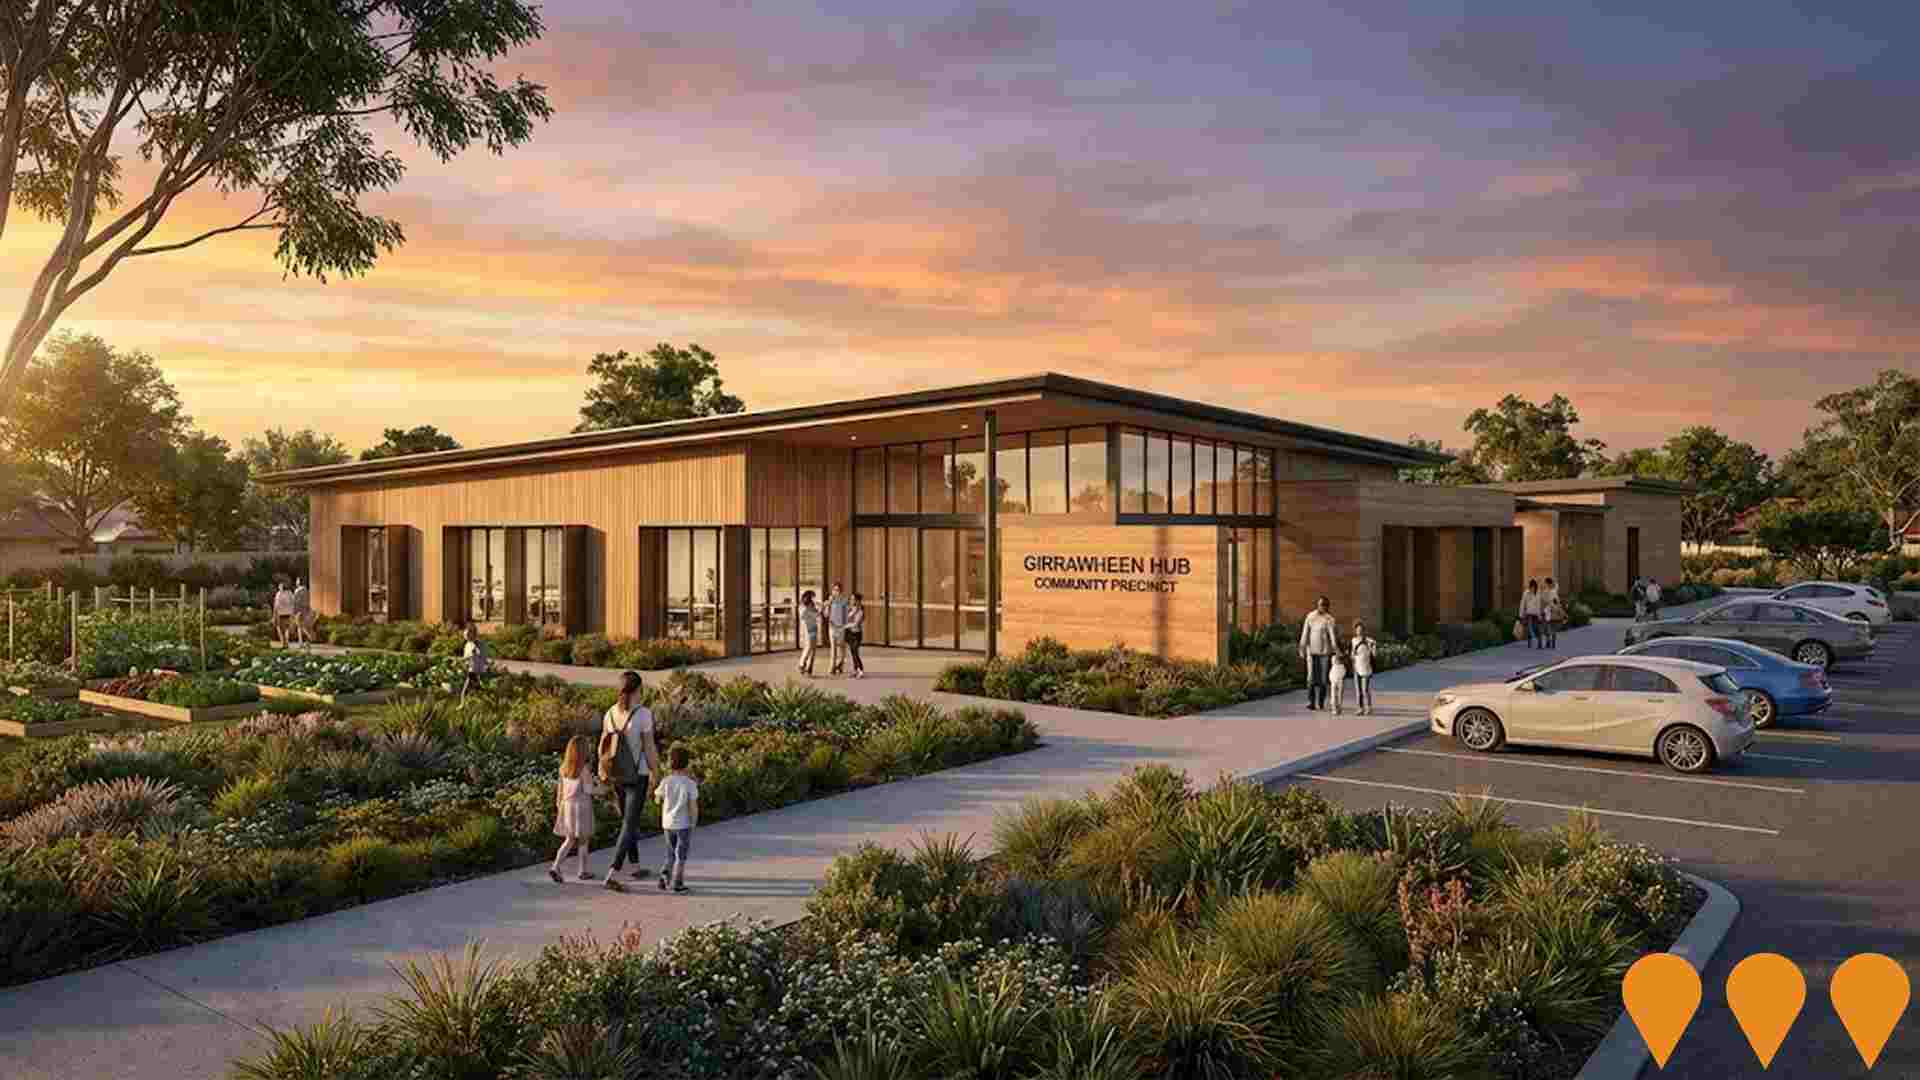
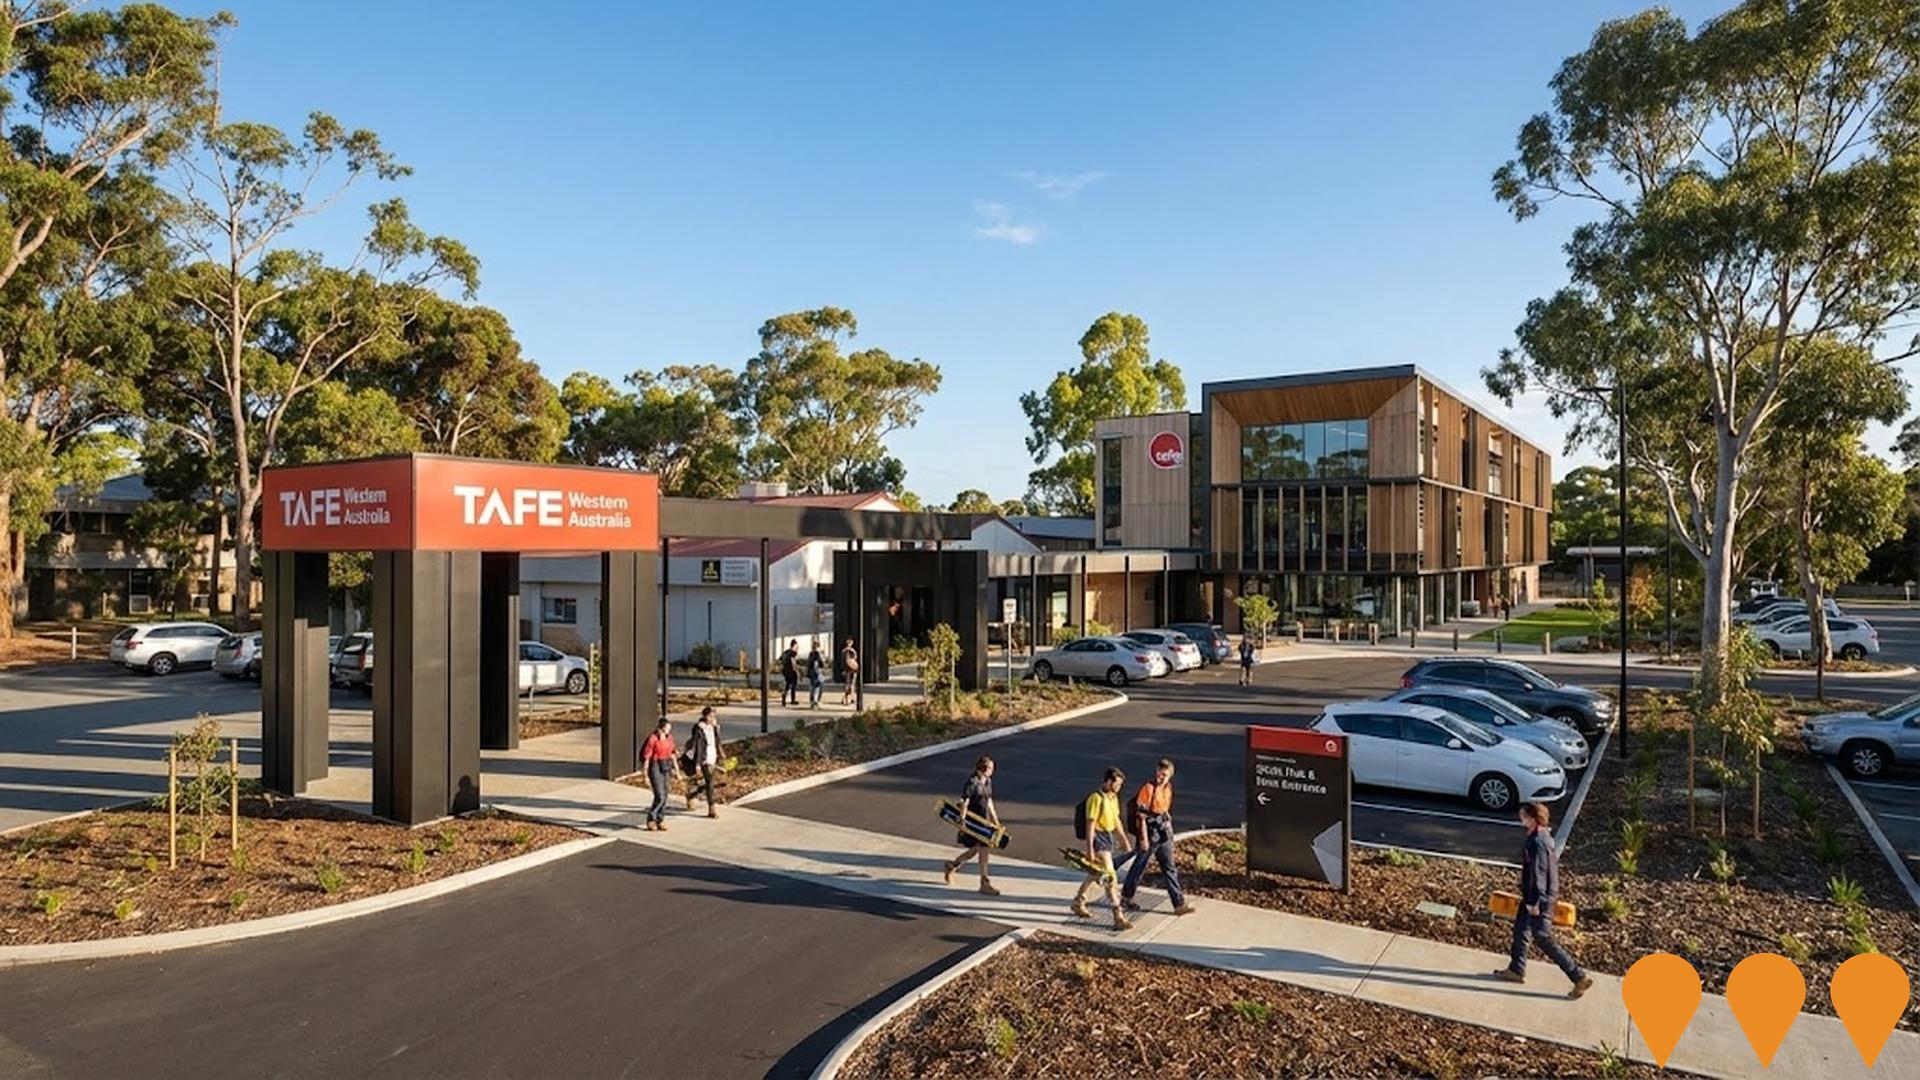
 Denotes AI-based impression for illustrative purposes only, not to be taken as definitive under any circumstances. Please follow links and conduct other investigations from the project's source for actual imagery. Developers and project owners wishing us to use original imagery please Contact Us and we will do so.
Frequently Asked Questions - Infrastructure
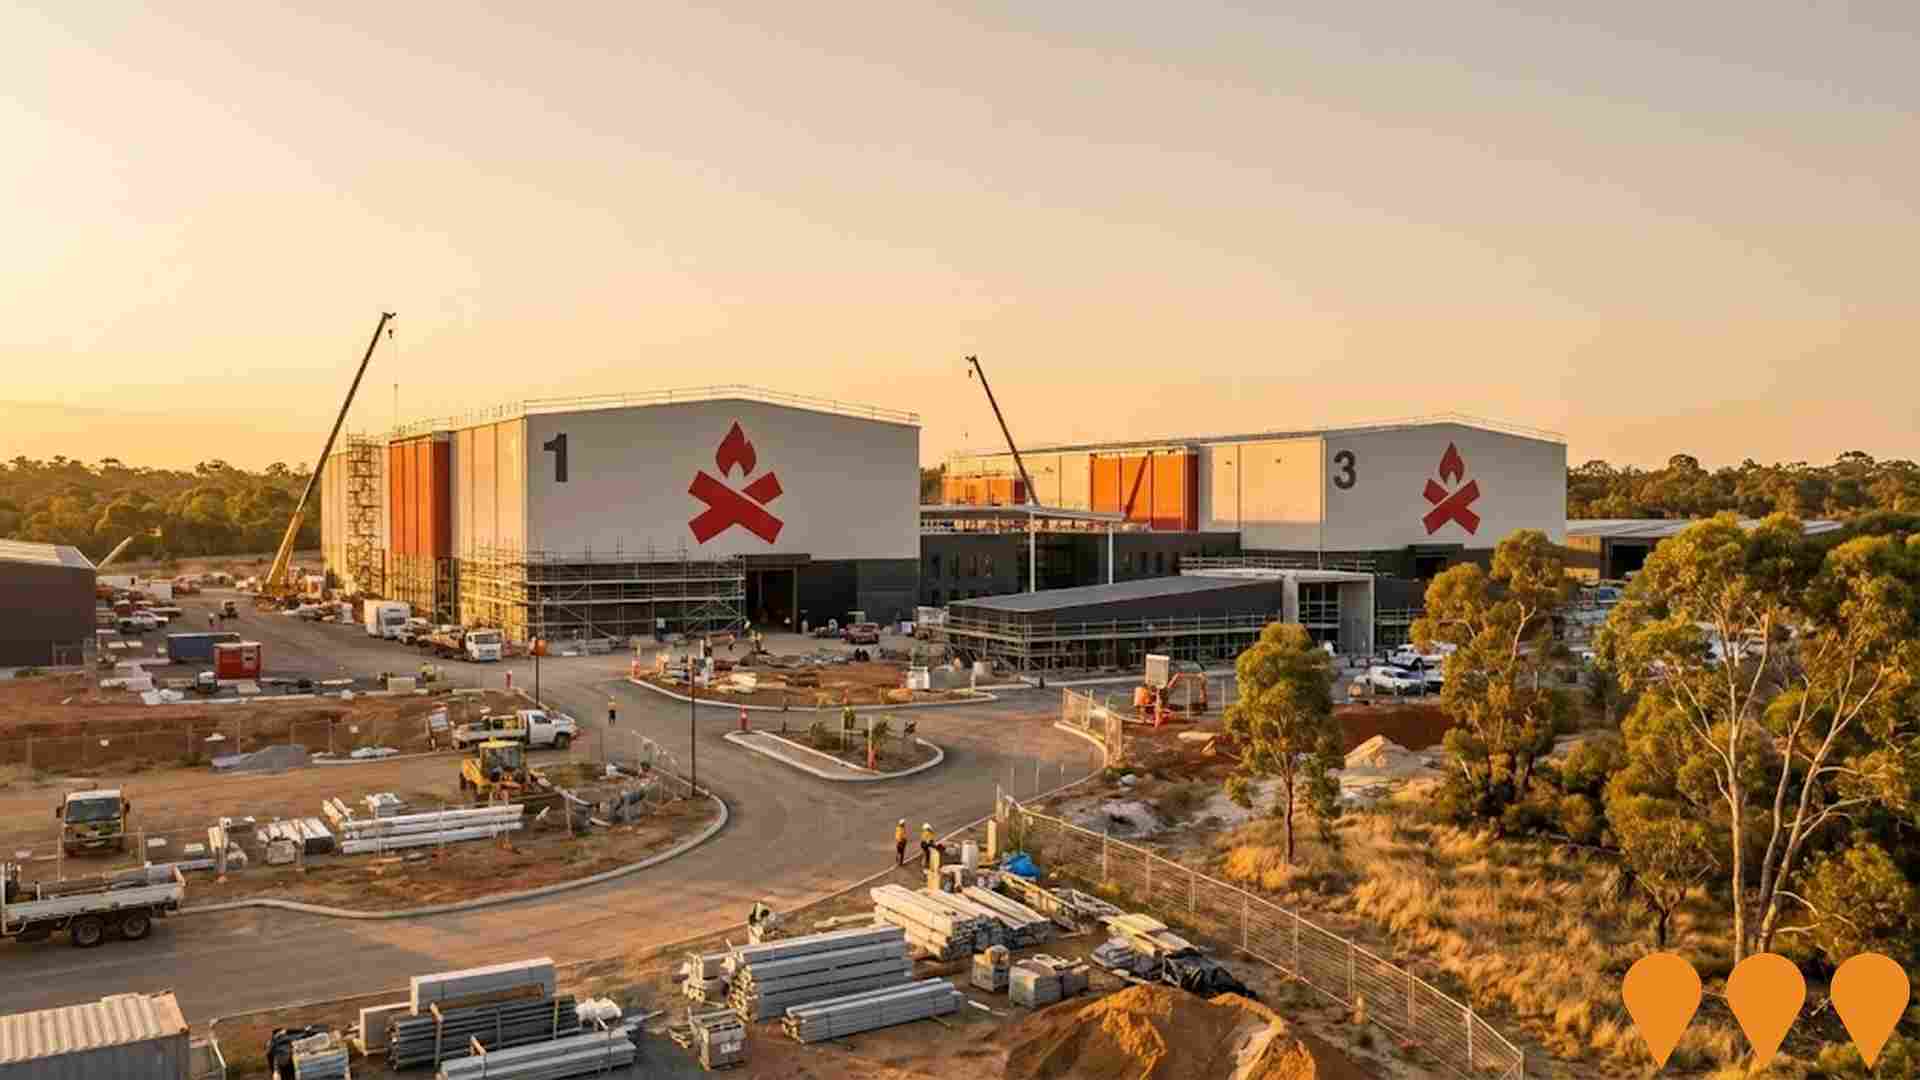
Perth Film Studios
A state-of-the-art screen production facility for major film and TV projects, including four sound stages (90,000 sq ft total), two large workshops, a 5-acre backlot, and production offices, aiming to support economic diversification through the screen industry. Construction is approximately 60% complete, targeting a mid-2026 first production, and is targeting a 4-Star Green Star rating.
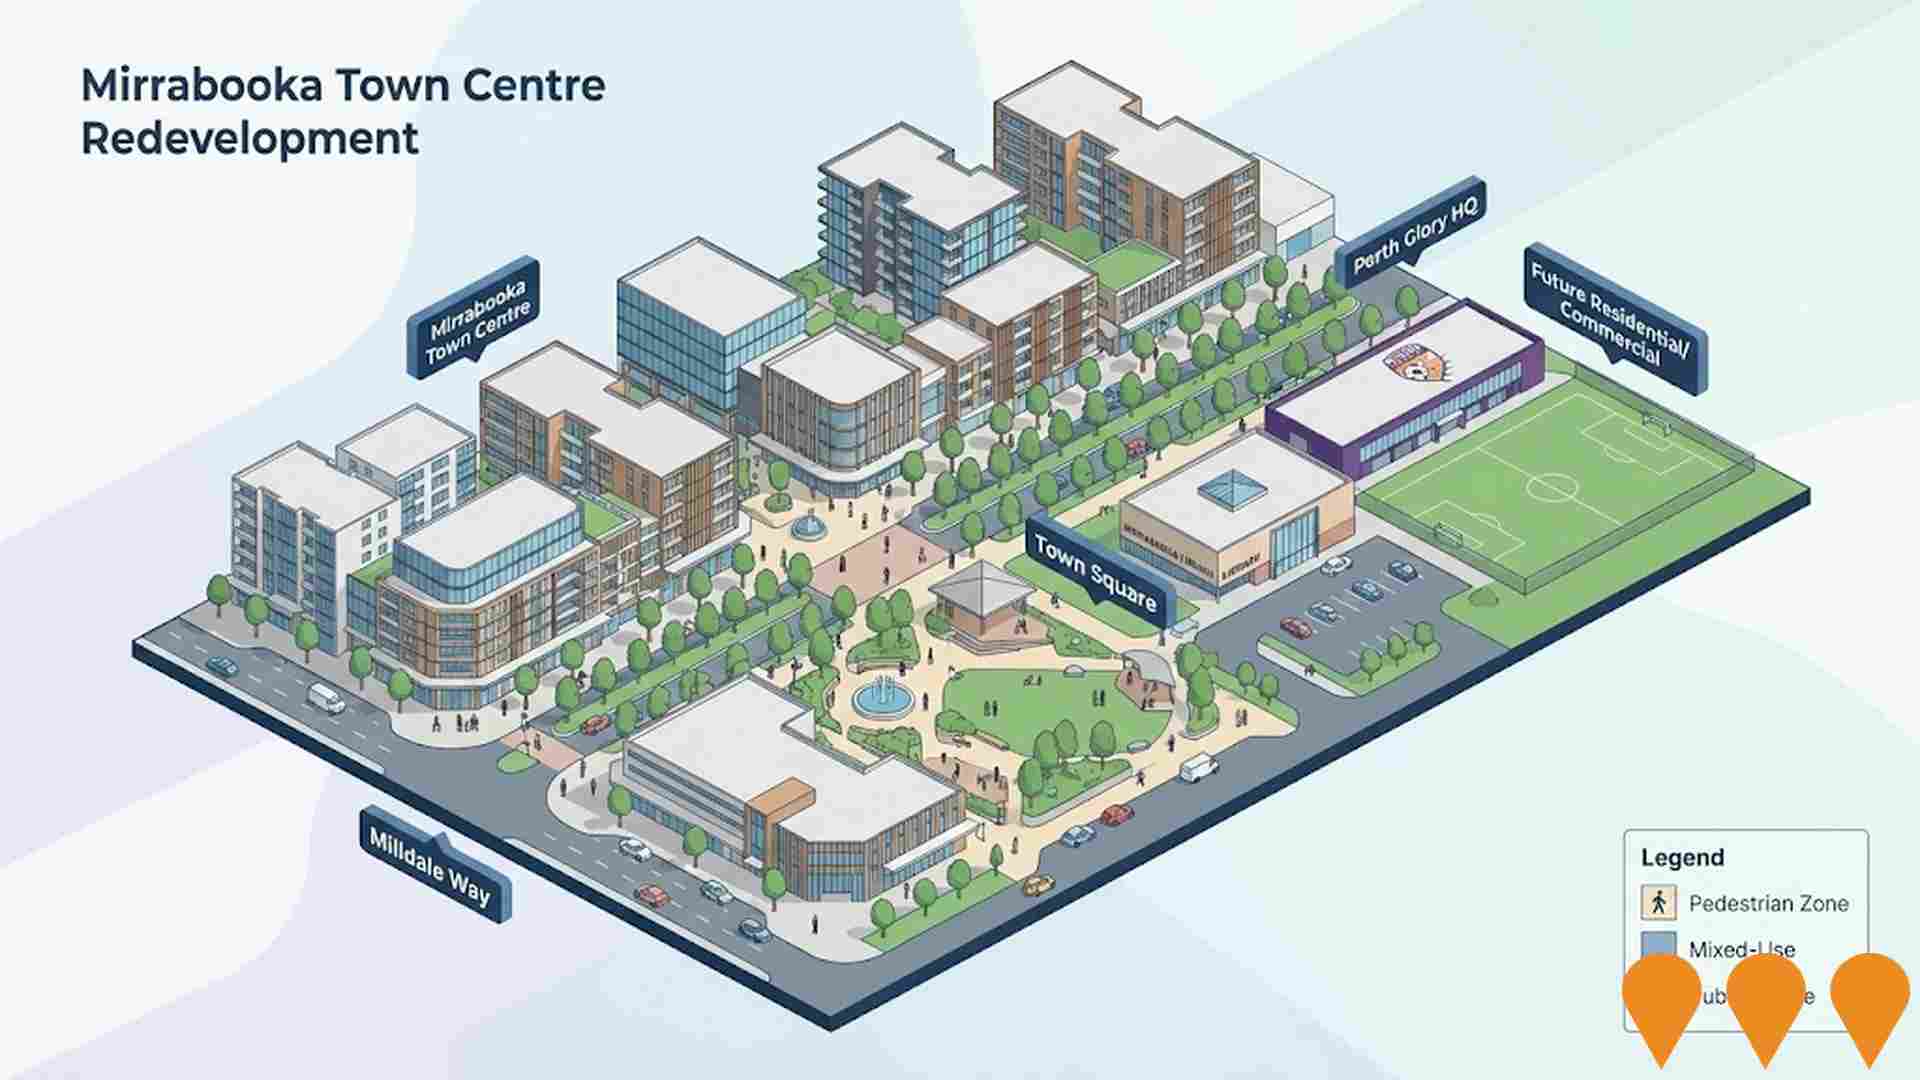
Mirrabooka Town Centre Redevelopment
Revitalisation of the Mirrabooka Activity Centre into a vibrant mixed-use precinct. Key components include the $1M upgrade of Mirrabooka Town Square (completion due late 2025), the relocation of the Perth Glory administration and training headquarters to the precinct, and the development of future high-density residential and commercial buildings on Milldale Way.
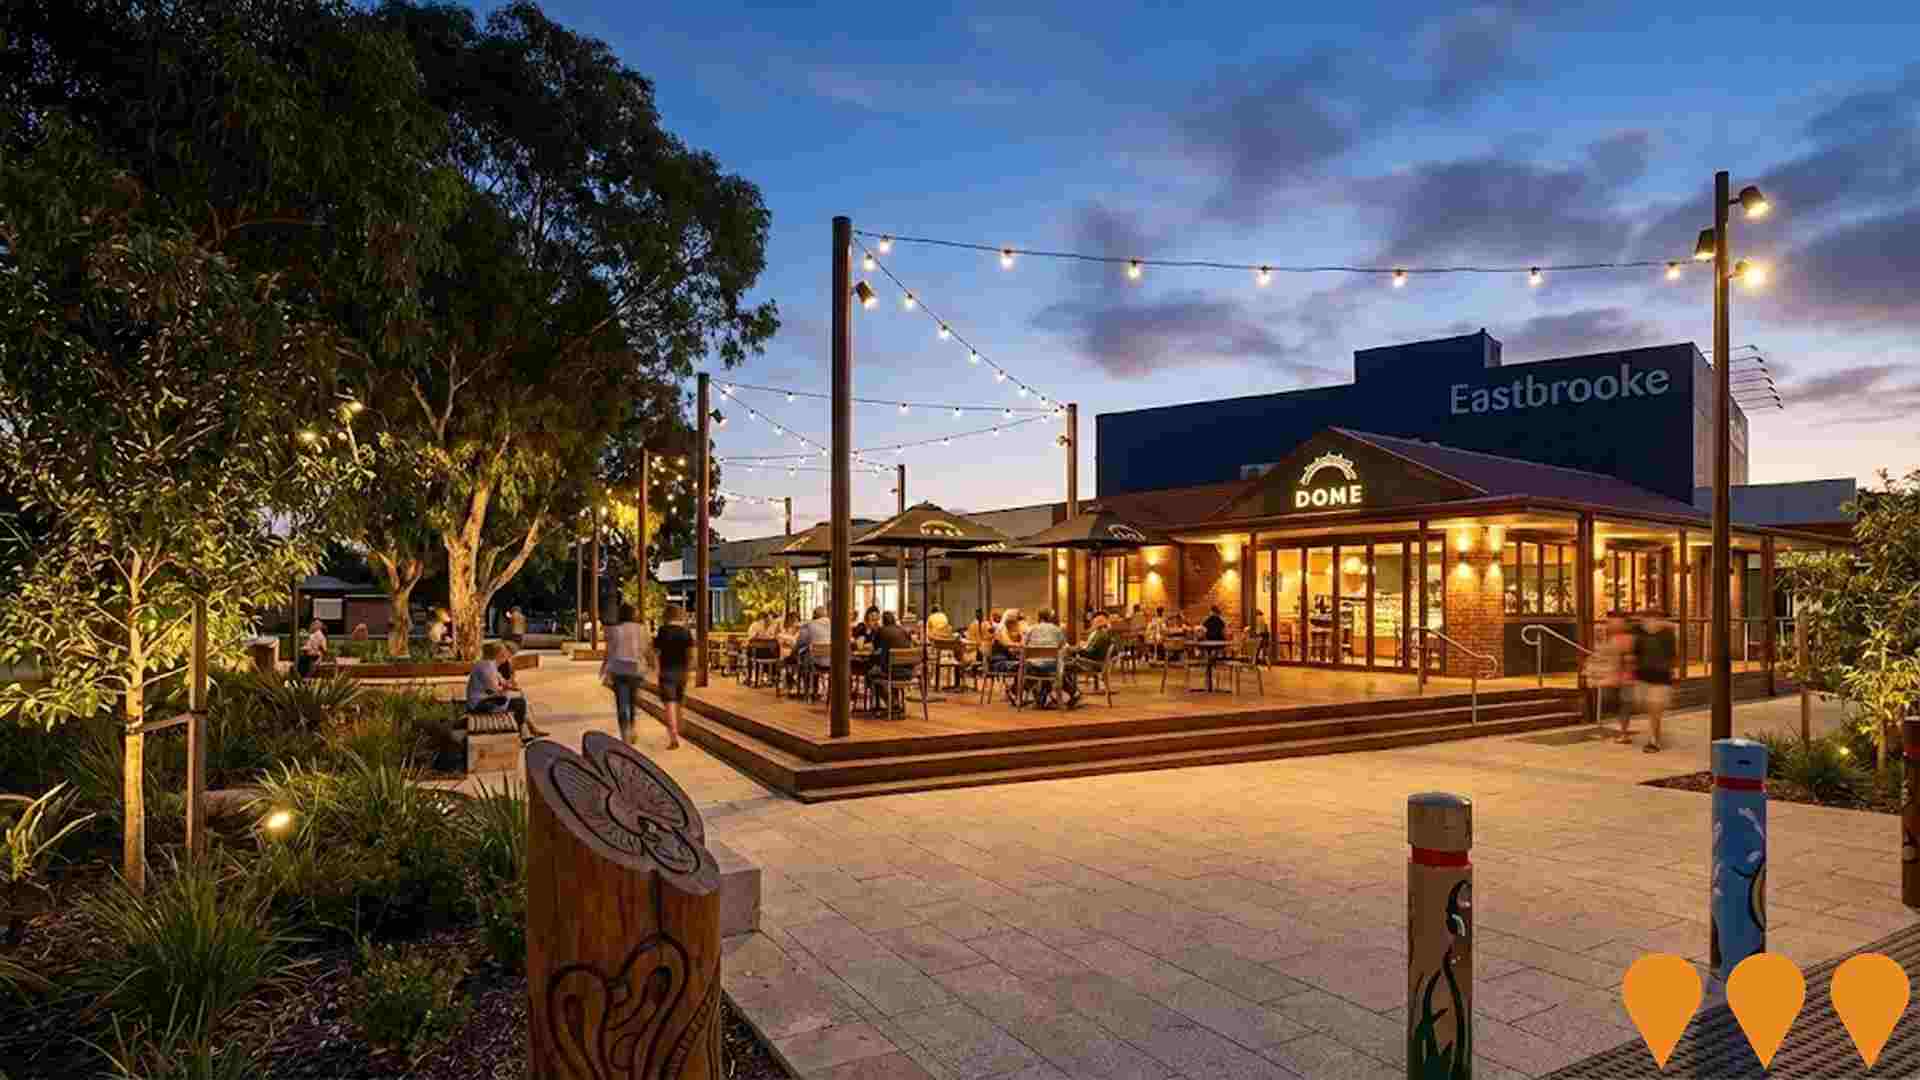
Mirrabooka Town Square Upgrade
Completed $1 million upgrade of Mirrabooka Town Square between Mirrabooka Bus Station and The Square Mirrabooka, delivered by the City of Stirling with Kardan Construction and design partner Hatch. Works replaced hard paving with native planting and shade trees, added new bench seating and a timber alfresco deck linked to the Dome cafe, informal childrens play elements, CPTED based lighting and sightlines, and integrated public art including painted bollards, carved timber pieces and printed shade sails. Construction ran from April to August 2025, with a community celebration and official opening in November 2025.
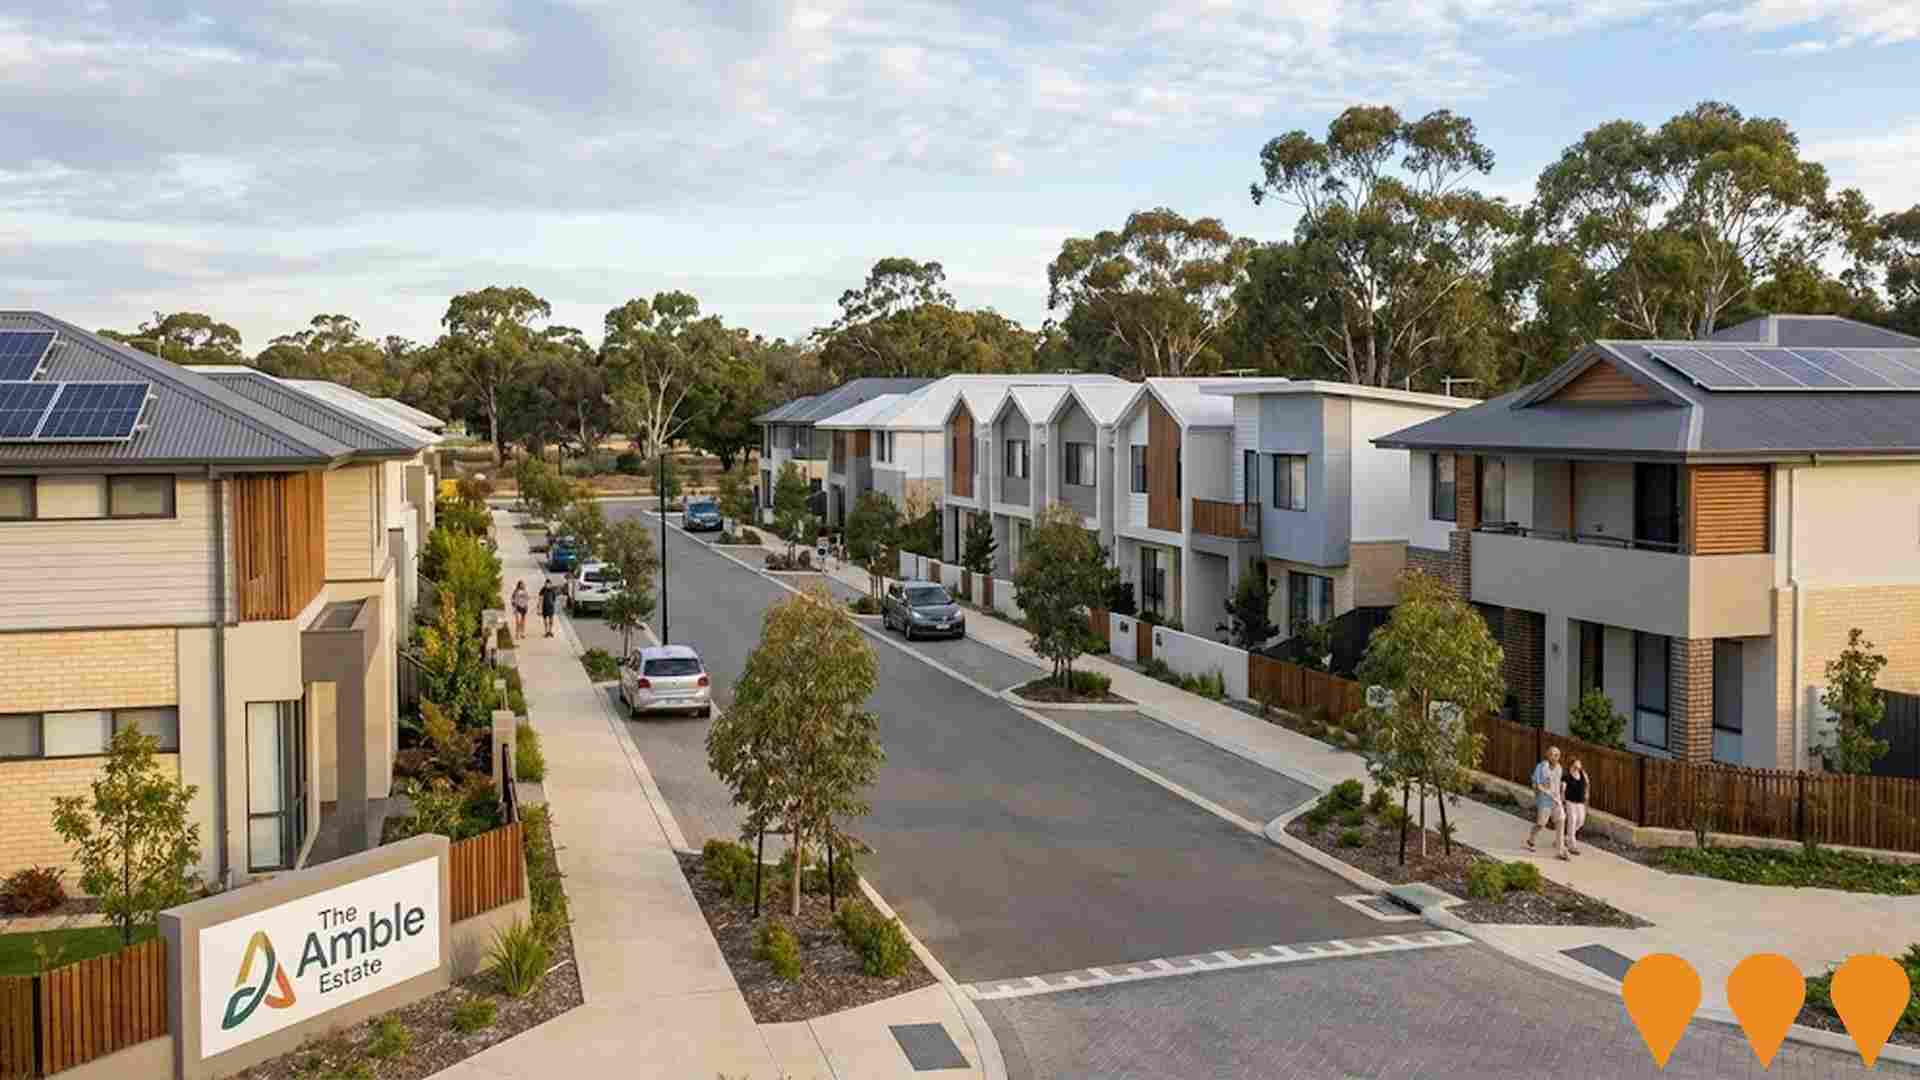
The Amble Estate (Former Hainsworth Primary School Site Redevelopment)
Redevelopment of the 4.2-hectare former Hainsworth Primary School site into an affordable and sustainable residential community known as 'The Amble Estate'. The development, guided by Bioregional's One Planet Living framework, includes 130 dwellings comprising small lot houses, apartments, and townhouses, with a focus on sustainability and a mix of private, social, and shared equity housing. The final stage was completed in May 2019, and the project is 100% sold out.
Stirling Better Suburbs Urban Renewal Strategy
Urban renewal and planning program led by the City of Stirling to coordinate infill housing, higher activity around centres and corridors, improved transport use, and better public realm across Balga, Dianella, Mirrabooka, Nollamara and Westminster. Workstreams are delivered through the Local Planning Strategy and related tools including the Better Suburbs Neighbourhood Centres Local Development Plan.

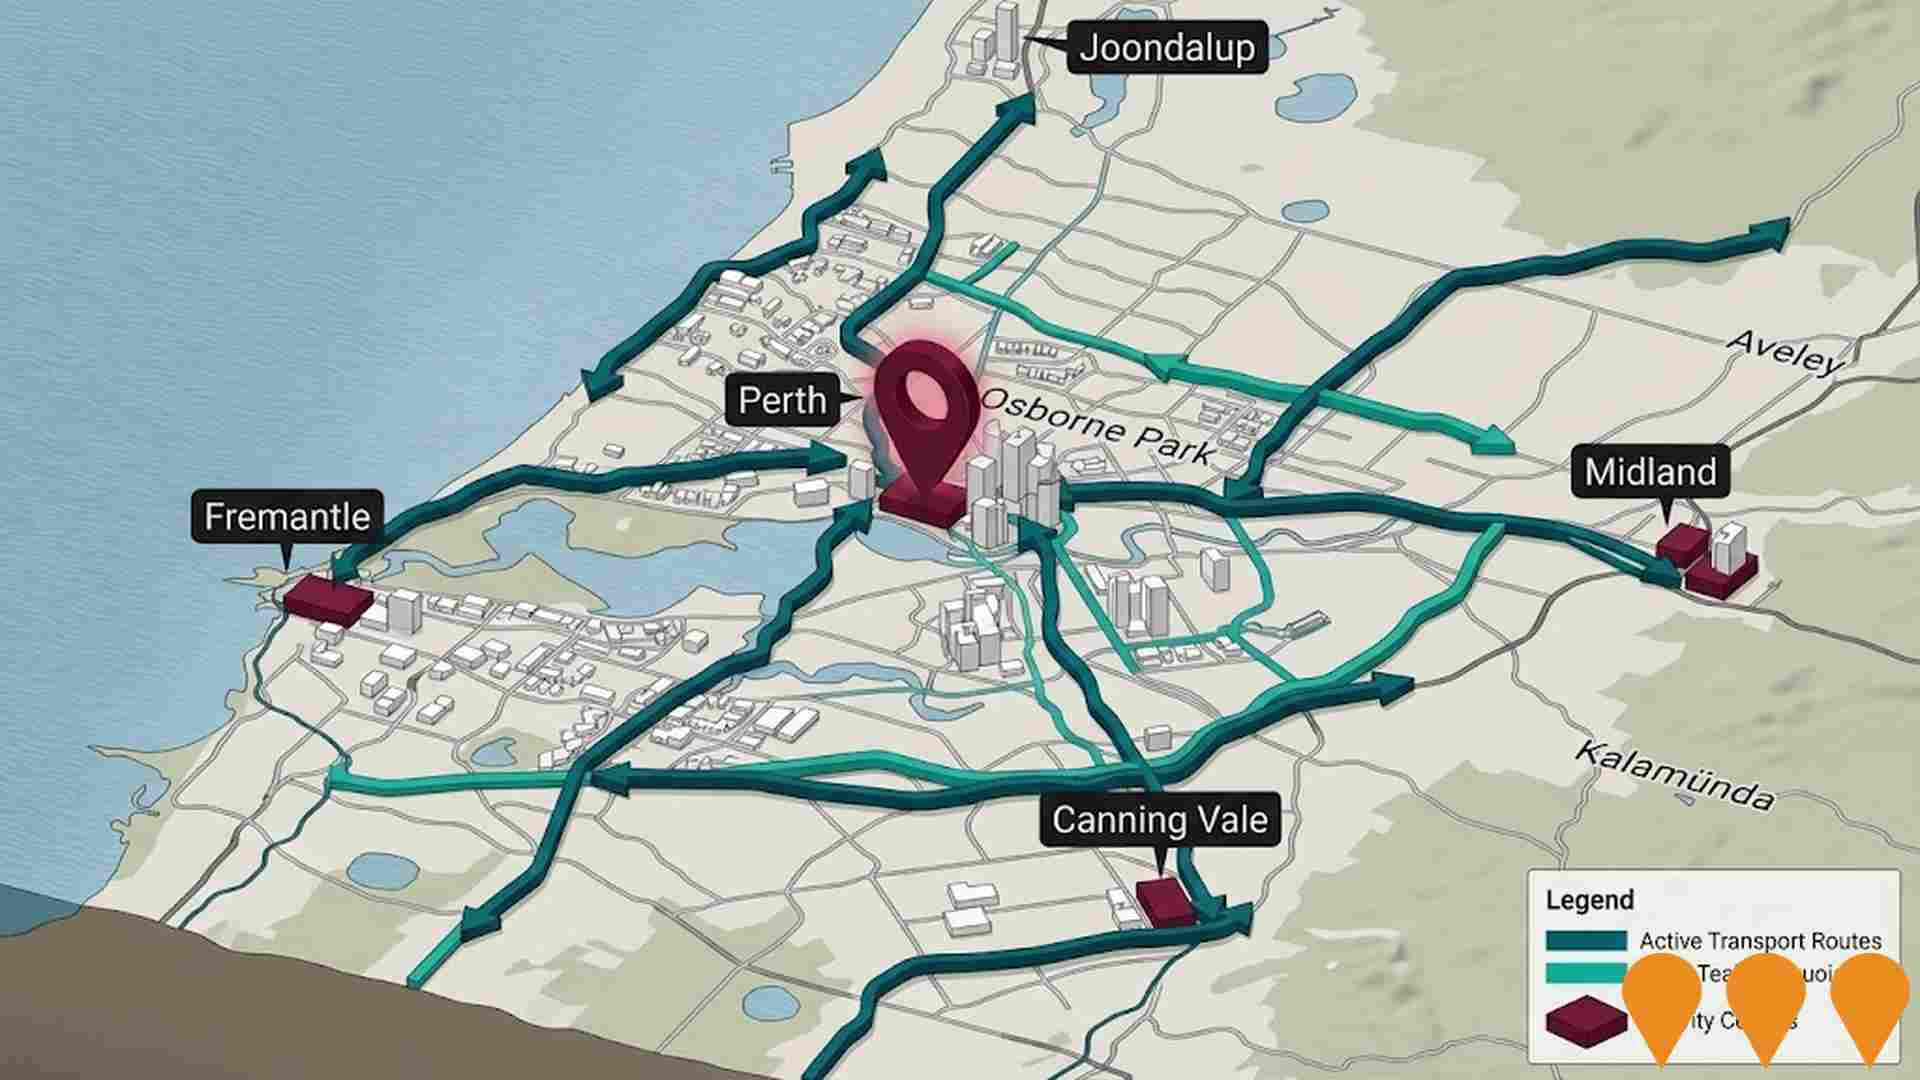
Perth Active Transport Network
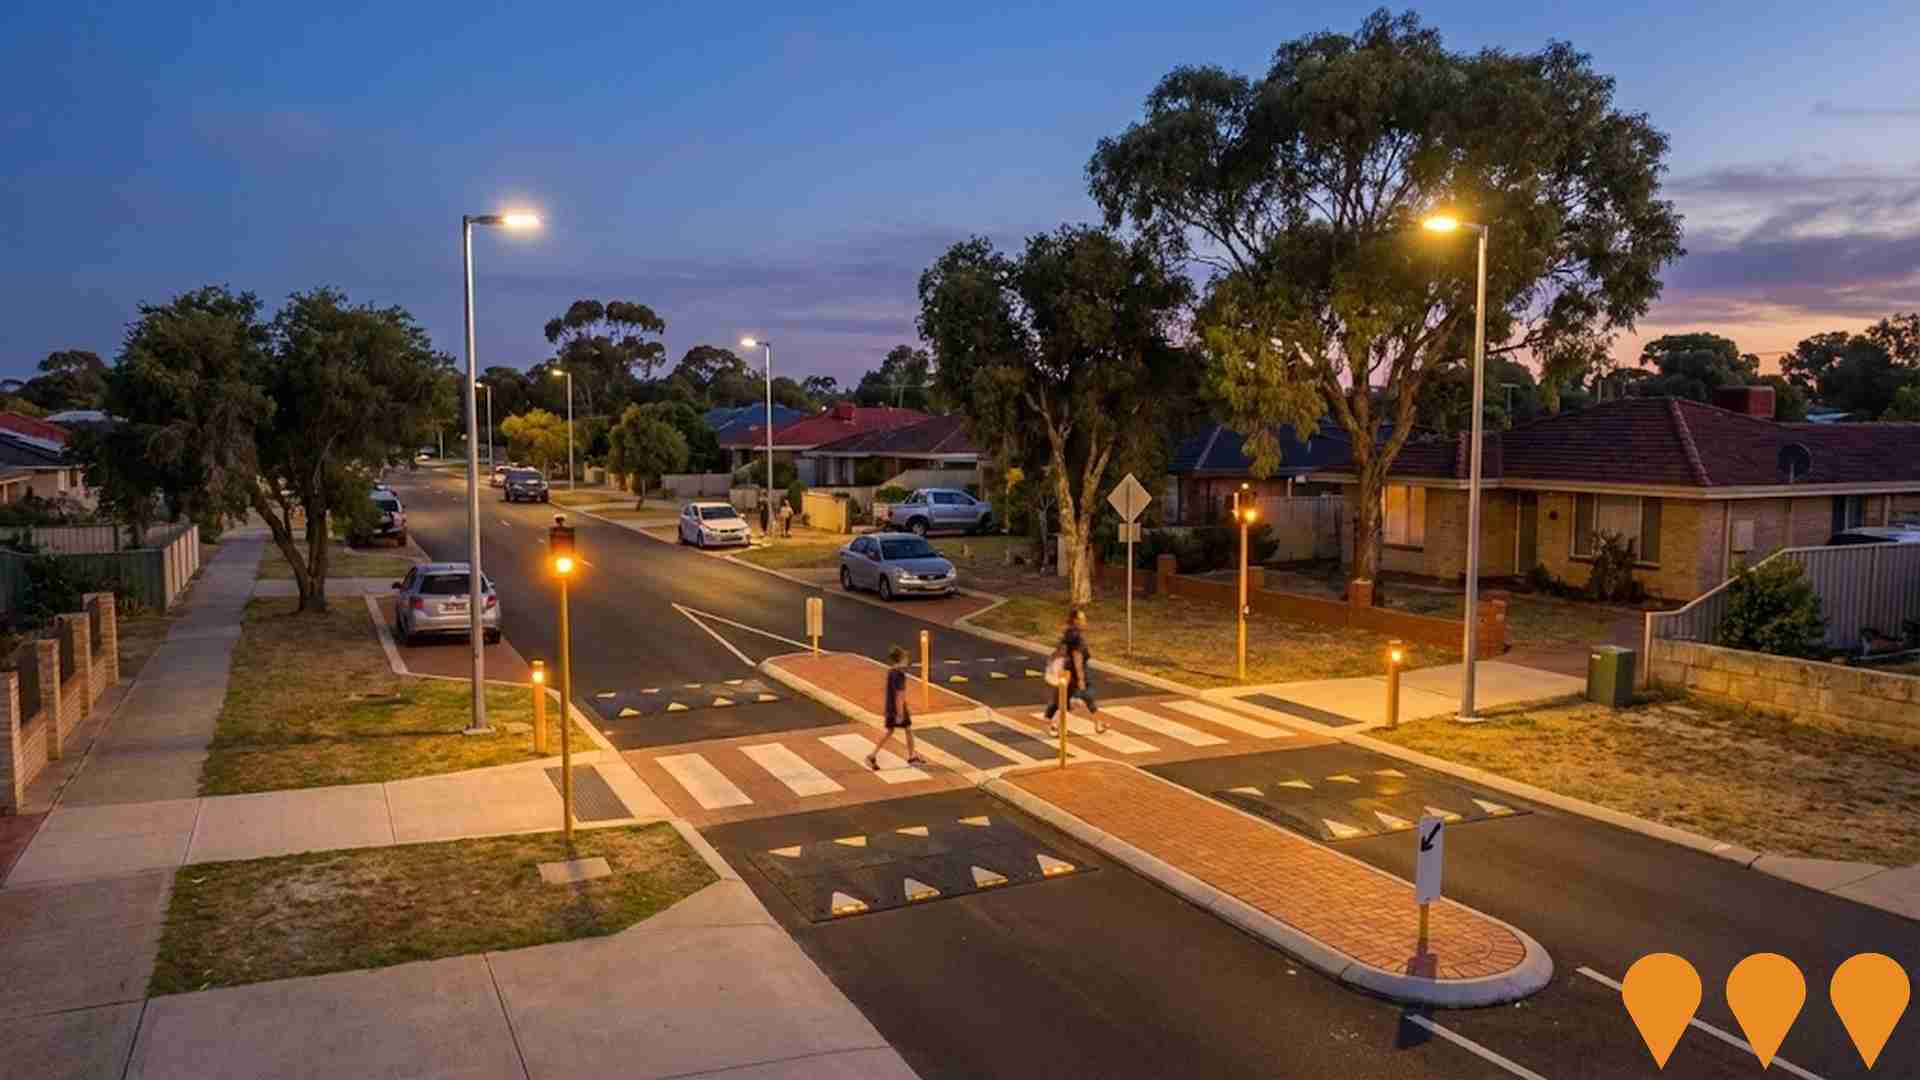
Program of cycling and walking upgrades across the Perth metropolitan area, delivering new and improved shared paths, safer street treatments and active transport connections between key activity centres and public transport hubs, including links through Nollamara and surrounding northern suburbs. Works form part of the broader WA Bicycle Network and long term cycle network program and are being progressively rolled out toward an expected completion around 2026.
Girrawheen Hub Precinct Redevelopment
City of Wanneroo-led redevelopment of the Girrawheen Hub, Library, Community Centre and community garden into a modern single-storey multi-purpose precinct. Council approved a revised concept design in Feb 2025; detailed design is progressing with construction targeted to commence in 2026 and completion earmarked for June 2027. Estimated project cost is about $30 million.
TAFE Balga Campus Skills Hub
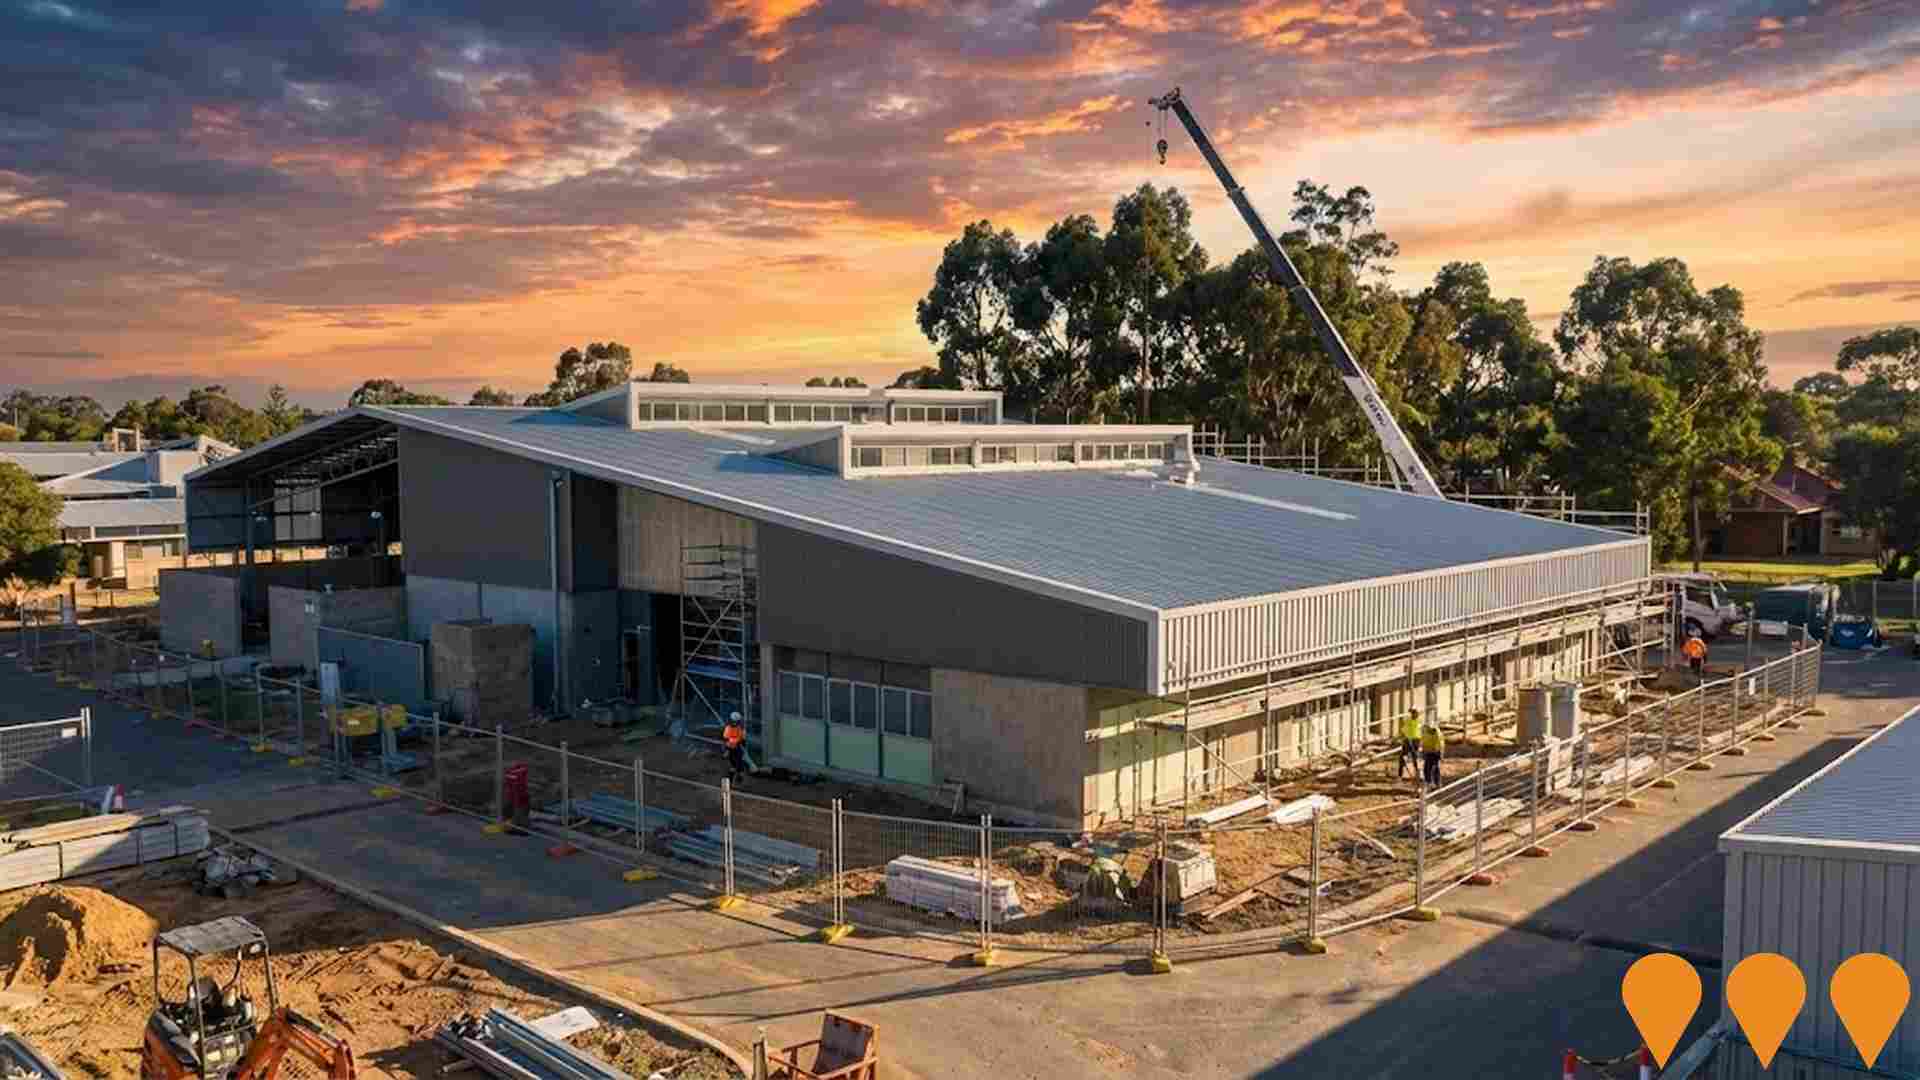
Development of a new skills training hub at TAFE Balga Campus to provide modern vocational education facilities and expand training capacity for the northern suburbs.
Employment
AreaSearch assessment indicates Balga - Mirrabooka faces employment challenges relative to the majority of Australian markets
Balga - Mirrabooka has a skilled workforce with diverse sector representation. The unemployment rate in the area was 10.9% as of September 2025, with an estimated employment growth of 6.8% over the past year.
As of that date, 10,980 residents were employed while the unemployment rate stood at 7.0%, which is above Greater Perth's rate of 4.0%. The workforce participation rate in Balga - Mirrabooka was 58.7%, significantly lower than Greater Perth's 65.2%. Leading employment industries among residents include health care & social assistance, retail trade, and accommodation & food. The area has a notably high concentration in transport, postal & warehousing, with employment levels at 1.7 times the regional average.
Conversely, professional & technical services show lower representation at 4.5% compared to the regional average of 8.2%. Over the 12 months to September 2025, employment increased by 6.8% while labour force increased by 3.7%, causing the unemployment rate to fall by 2.6 percentage points. By comparison, Greater Perth recorded employment growth of 2.9%, with a marginal increase in unemployment. State-level data to 25-Nov-2025 shows WA employment contracted by 0.27% (losing 5,520 jobs), with the state unemployment rate at 4.6%, compared to the national rate of 4.3%. Jobs and Skills Australia's national employment forecasts from May-25 suggest that while national employment is forecast to expand by 6.6% over five years and 13.7% over ten years, growth rates differ significantly between industry sectors. Applying these projections to Balga - Mirrabooka's employment mix suggests local employment should increase by 6.2% over five years and 13.2% over ten years.
Frequently Asked Questions - Employment
Income
The area's income levels rank in the lower 15% nationally based on AreaSearch comparative data
The median income among taxpayers in Balga - Mirrabooka SA2 was $43,976 in financial year 2022. The average income stood at $49,392 during the same period. These figures are lower than those for Greater Perth, which were $58,380 and $78,020 respectively. By September 2025, estimated median and average incomes in Balga - Mirrabooka would be approximately $50,221 and $56,406 based on a 14.2% growth in wages since financial year 2022. According to census data, household, family, and personal incomes in Balga - Mirrabooka fall between the 15th and 19th percentiles nationally. Income distribution shows that 31.3% of the population (7,300 individuals) have incomes ranging from $1,500 to $2,999, similar to the surrounding region where 32.0% fall within this bracket. Housing affordability pressures are severe in Balga - Mirrabooka, with only 80.0% of income remaining, ranking at the 16th percentile nationally.
Frequently Asked Questions - Income
Housing
Balga - Mirrabooka is characterized by a predominantly suburban housing profile, with a higher proportion of rental properties than the broader region
Dwelling structure in Balga - Mirrabooka, as per the latest Census, had 73.7% houses and 26.3% other dwellings (semi-detached, apartments, 'other' dwellings). In comparison, Perth metro had 59.6% houses and 40.4% other dwellings. Home ownership in Balga - Mirrabooka was at 19.6%, with the rest being mortgaged (36.2%) or rented (44.2%). The median monthly mortgage repayment was $1,482, below Perth metro's average of $1,950. Median weekly rent in Balga - Mirrabooka was $305, compared to Perth metro's $350. Nationally, Balga - Mirrabooka's mortgage repayments were lower than the Australian average of $1,863, and rents were below the national figure of $375.
Frequently Asked Questions - Housing
Household Composition
Balga - Mirrabooka features high concentrations of group households, with a higher-than-average median household size
Family households account for 65.8% of all households, including 28.9% couples with children, 18.8% couples without children, and 16.0% single parent families. Non-family households constitute the remaining 34.2%, with lone person households at 29.0% and group households comprising 5.2%. The median household size is 2.6 people, larger than the Greater Perth average of 2.4.
Frequently Asked Questions - Households
Local Schools & Education
Educational outcomes in Balga - Mirrabooka fall within the lower quartile nationally, indicating opportunities for improvement in qualification attainment
The area's university qualification rate is 20.1%, significantly lower than the SA3 average of 37.1%. Bachelor degrees are most common at 14.4%, followed by postgraduate qualifications (4.4%) and graduate diplomas (1.3%). Vocational credentials are prevalent, with 34.4% of residents aged 15+ holding them, including advanced diplomas (10.7%) and certificates (23.7%). Educational participation is high at 35.0%, with 11.3% in primary education, 8.3% in secondary education, and 5.8% pursuing tertiary education.
Educational participation is notably high, with 35.0% of residents currently enrolled in formal education. This includes 11.3% in primary education, 8.3% in secondary education, and 5.8% pursuing tertiary education.
Frequently Asked Questions - Education
Schools Detail
Nearby Services & Amenities
Transport
Transport servicing is good compared to other areas nationally based on assessment of service frequency, route connectivity and accessibility
Balga - Mirrabooka has 134 active public transport stops. These are served by a mix of buses on 17 different routes. The total weekly passenger trips across these routes is 3,489.
Residents have excellent accessibility to transport, with an average distance of 178 meters to the nearest stop. On average, there are 498 trips per day across all routes, which equates to about 26 weekly trips per individual stop.
Frequently Asked Questions - Transport
Transport Stops Detail
Health
The level of general health in Balga - Mirrabooka is notably higher than the national average with prevalence of common health conditions low among the general population though higher than the nation's average across older, at risk cohorts
Balga - Mirrabooka shows better-than-average health outcomes with low prevalence of common conditions among its general population, but higher rates among older and at-risk cohorts. Private health cover is extremely low here, at approximately 46% (10,752 people), compared to Greater Perth's 59.9%. Nationally, it stands at 55.3%.
Mental health issues and asthma are the most common conditions, affecting 7.0% and 6.4% of residents respectively. 74.8% report no medical ailments, slightly higher than Greater Perth's 73.0%. The area has 13.6% seniors (3,174 people), lower than Greater Perth's 18.3%. Health outcomes among seniors require more attention.
Frequently Asked Questions - Health
Cultural Diversity
Balga - Mirrabooka is among the most culturally diverse areas in the country based on AreaSearch assessment of a range of language and cultural background related metrics
Balga-Mirrabooka is among the most culturally diverse areas in Australia, with 54.3% of its population speaking a language other than English at home as of 2016 census data. Also by this date, 52.4% of Balga-Mirrabooka's population was born overseas. Christianity is the main religion in Balga-Mirrabooka, comprising 43.2% of its people.
However, Islam is notably overrepresented, making up 16.2% of the population compared to Greater Perth's average of 4.2%. In terms of ancestry, the top three groups in Balga-Mirrabooka are 'Other', at 32.5%, English at 16.2%, and Australian at 14.3%. Vietnamese people are notably overrepresented in Balga-Mirrabooka at 4.9% compared to the regional average of 1.7%. Similarly, Macedonian people make up 1.9% of Balga-Mirrabooka's population versus 1.5% regionally, and Serbian people comprise 0.7% compared to 0.5%.
Frequently Asked Questions - Diversity
Age
Balga - Mirrabooka's young demographic places it in the bottom 15% of areas nationwide
Balga - Mirrabooka has a median age of 33, which is younger than Greater Perth's figure of 37 and Australia's national average of 38 years. Compared to Greater Perth, Balga - Mirrabooka has a higher proportion of residents aged 25-34 (17.6%) but fewer residents aged 45-54 (10.9%). Between the 2021 Census and the present day, the population aged 75 to 84 has grown from 3.6% to 4.5%. Conversely, the proportion of residents aged 25 to 34 has decreased from 18.6% to 17.6%. By 2041, demographic forecasts indicate significant changes for Balga - Mirrabooka's population. The 75 to 84 age group is projected to grow by 74%, adding 781 residents and reaching a total of 1,833. This growth will contribute to the increasing proportion of residents aged 65 and older, who are expected to represent 59% of the population growth. Meanwhile, the populations aged 0-4 and 35-44 are anticipated to decline.


