Chart Color Schemes
This analysis uses ABS Statistical Areas Level 2 (SA2) boundaries, which can materially differ from Suburbs and Localities (SAL) even when sharing similar names.
SA2 boundaries are defined by the Australian Bureau of Statistics and are designed to represent communities for statistical reporting (e.g., census and ERP).
Suburbs and Localities (SAL) represent commonly-used suburb/locality names (postal-style areas) and may use different geographic boundaries. For comprehensive analysis, consider reviewing both boundary types if available.
est. as @ -- *
ABS ERP | -- people | --
2021 Census | -- people
Sales Activity
Curious about local property values? Filter the chart to assess the volume and appreciation (including resales) trends and regional comparisons, or scroll to the map below view this information at an individual property level.
Find a Recent Sale
Sales Detail
Population
An assessment of population growth drivers in Albany reveals an overall ranking slightly below national averages considering recent, and medium term trends
Albany's population was around 15,694 as of November 2025. This showed an increase of 866 people, a 5.8% rise from the 2021 Census figure of 14,828. The change is inferred from ABS' estimated resident population of 15,801 in June 2024 and address validation since the Census date. This results in a density ratio of 511 persons per square kilometer. Over the past decade, Albany's growth rate was 0.8% annually, outpacing its SA4 region. Overseas migration contributed approximately 60.7% of overall population gains recently.
AreaSearch uses ABS/Geoscience Australia projections for each SA2 area, released in 2024 with a base year of 2022. For areas not covered by this data and post-2032 estimates, AreaSearch utilises growth rates by age cohort provided by the ABS in its Greater Capital Region projections (released in 2023, based on 2022 data). Future population trends indicate a median increase for locations outside capital cities, with Albany expected to gain 1,819 persons by 2041, reflecting a total increase of 12.3% over the 17 years.
Frequently Asked Questions - Population
Development
Recent residential development output has been above average within Albany when compared nationally
Albany has averaged approximately 70 new dwelling approvals per year. Over the past five financial years, from FY21 to FY25, a total of 351 homes were approved, with an additional 24 approved so far in FY26. On average, around 2.1 people have moved to the area annually for each new home constructed during these years.
This robust demand supports property values, with new homes being built at an average construction cost value of $358,000. In terms of commercial development, $69.8 million in approvals have been registered this financial year. Compared to the Rest of WA, Albany shows around 75% of the construction activity per person and ranks among the 57th percentile nationally when assessed areas are considered.
New development consists predominantly of standalone homes at 86.0%, with townhouses or apartments making up the remaining 14.0%. This preserves Albany's low-density nature, attracting space-seeking buyers. With approximately 271 people per approval, Albany reflects a low-density area. According to AreaSearch's latest quarterly estimate, Albany is forecasted to gain around 1,926 residents by 2041. Current construction rates appear balanced with future demand, fostering steady market conditions without excessive price pressure.
Frequently Asked Questions - Development
Infrastructure
Albany has emerging levels of nearby infrastructure activity, ranking in the 20thth percentile nationally
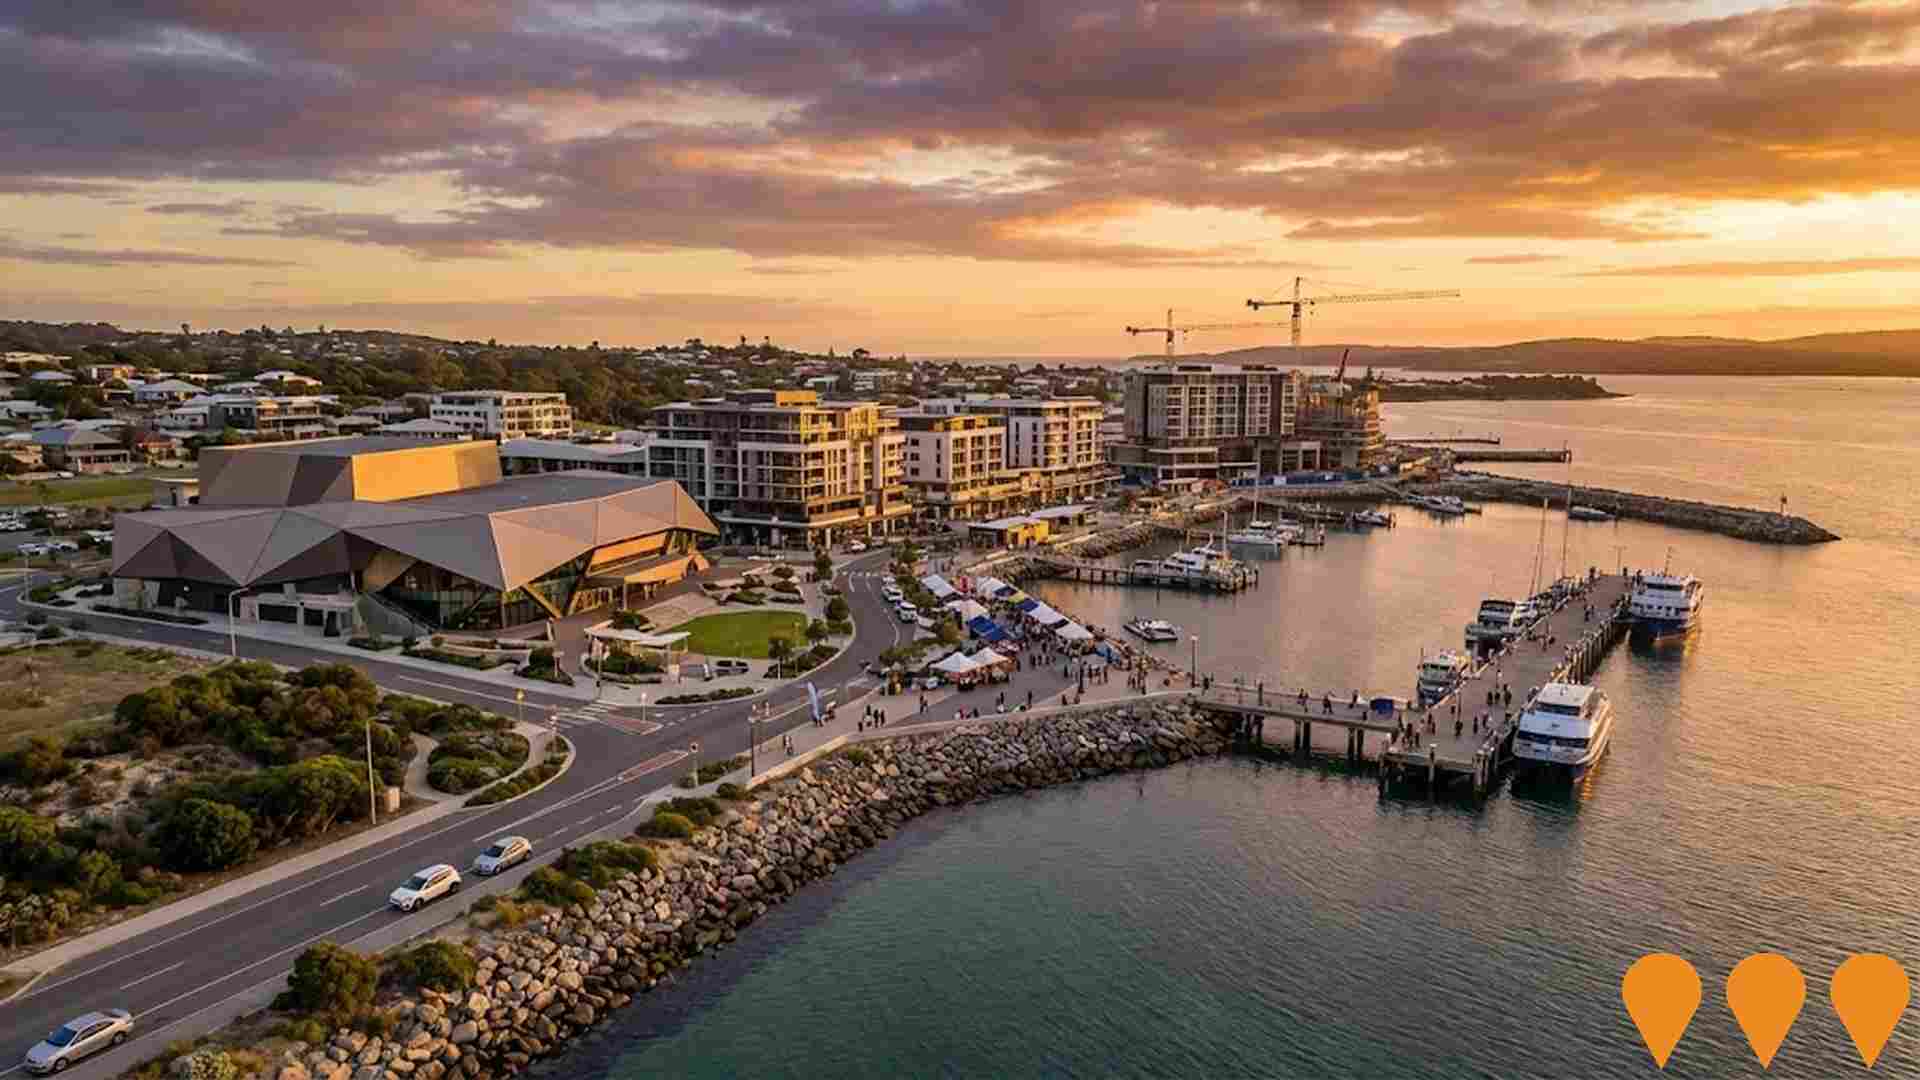
Changes to local infrastructure significantly impact an area's performance. AreaSearch has identified 19 projects likely affecting the region. Notable initiatives include Spencer Park Renewal Project - Hardie Road Mixed-Use Development, Yakamia/Lange Structure Plan, Middleton Beach Hotel, and Albany Waterfront Redevelopment. Below is a list of most relevant projects.
Professional plan users can use the search below to filter and access additional projects.
INFRASTRUCTURE SEARCH
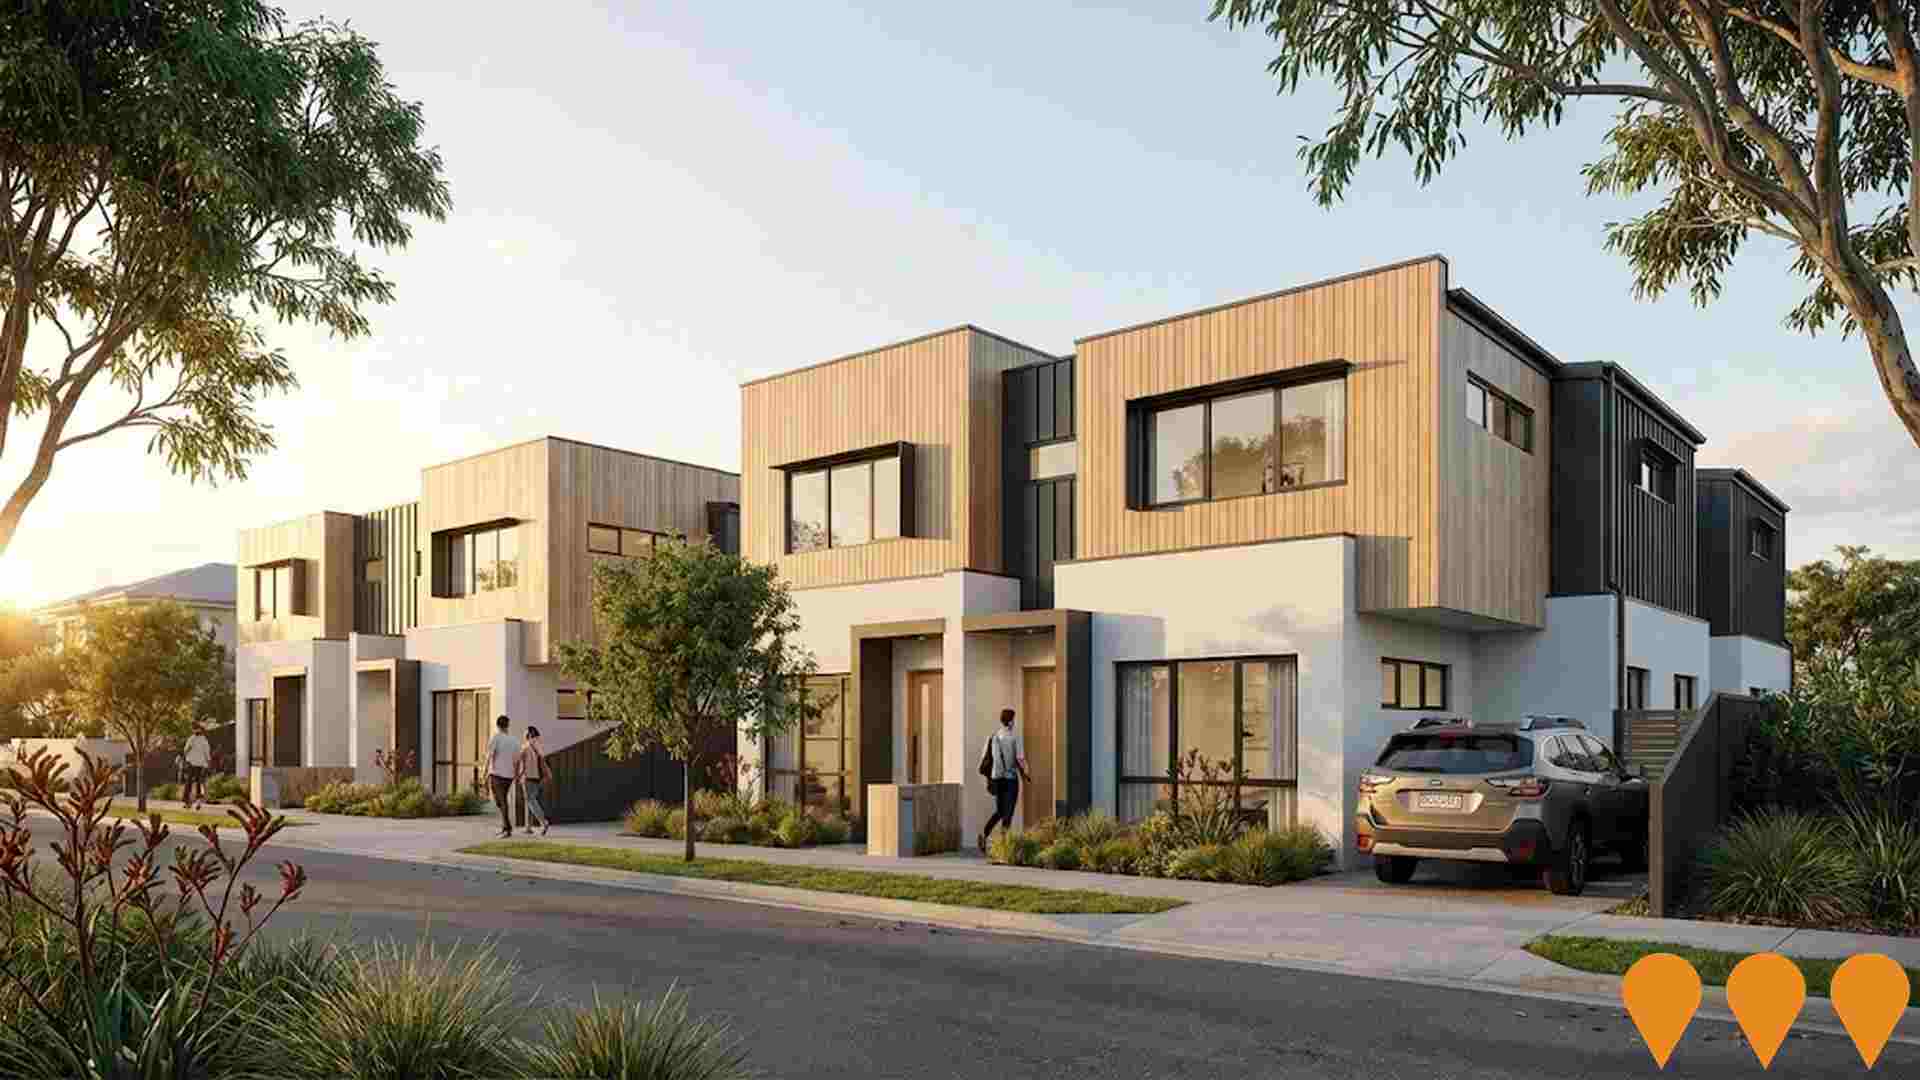
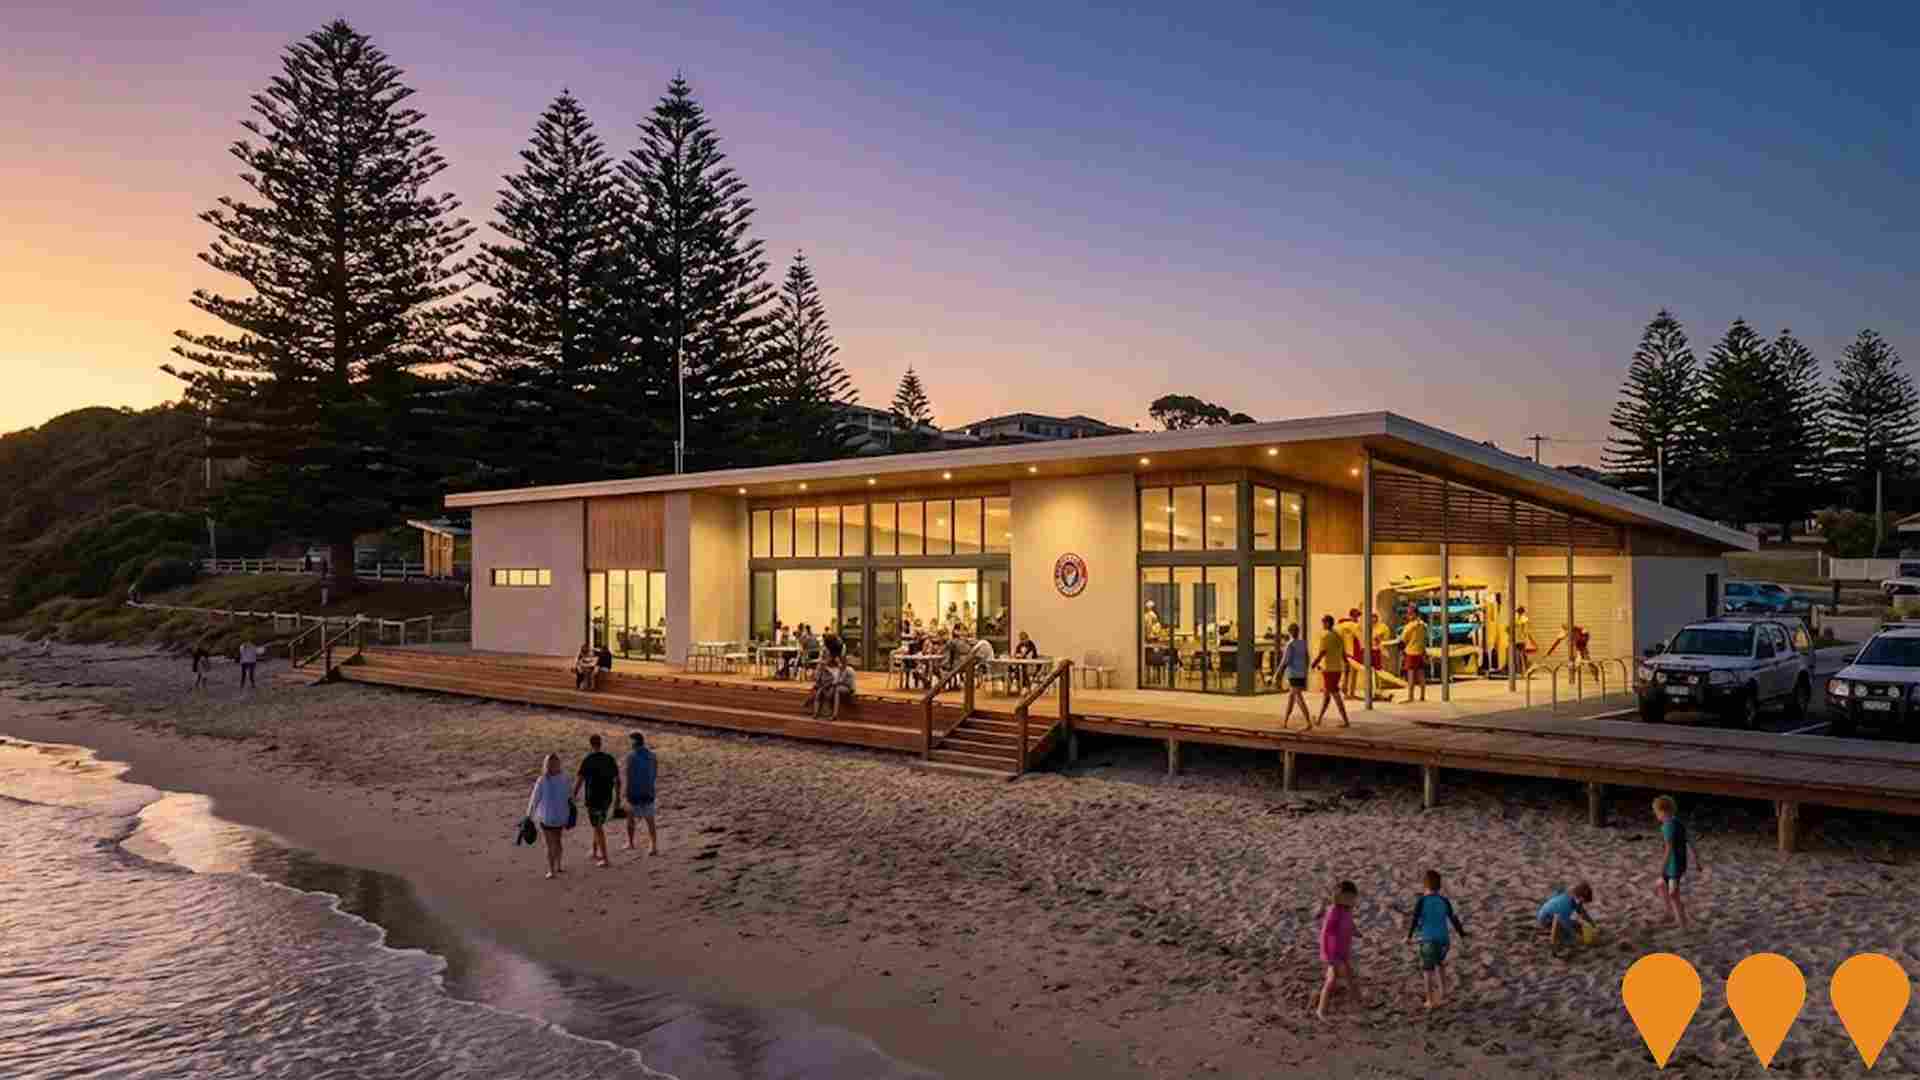
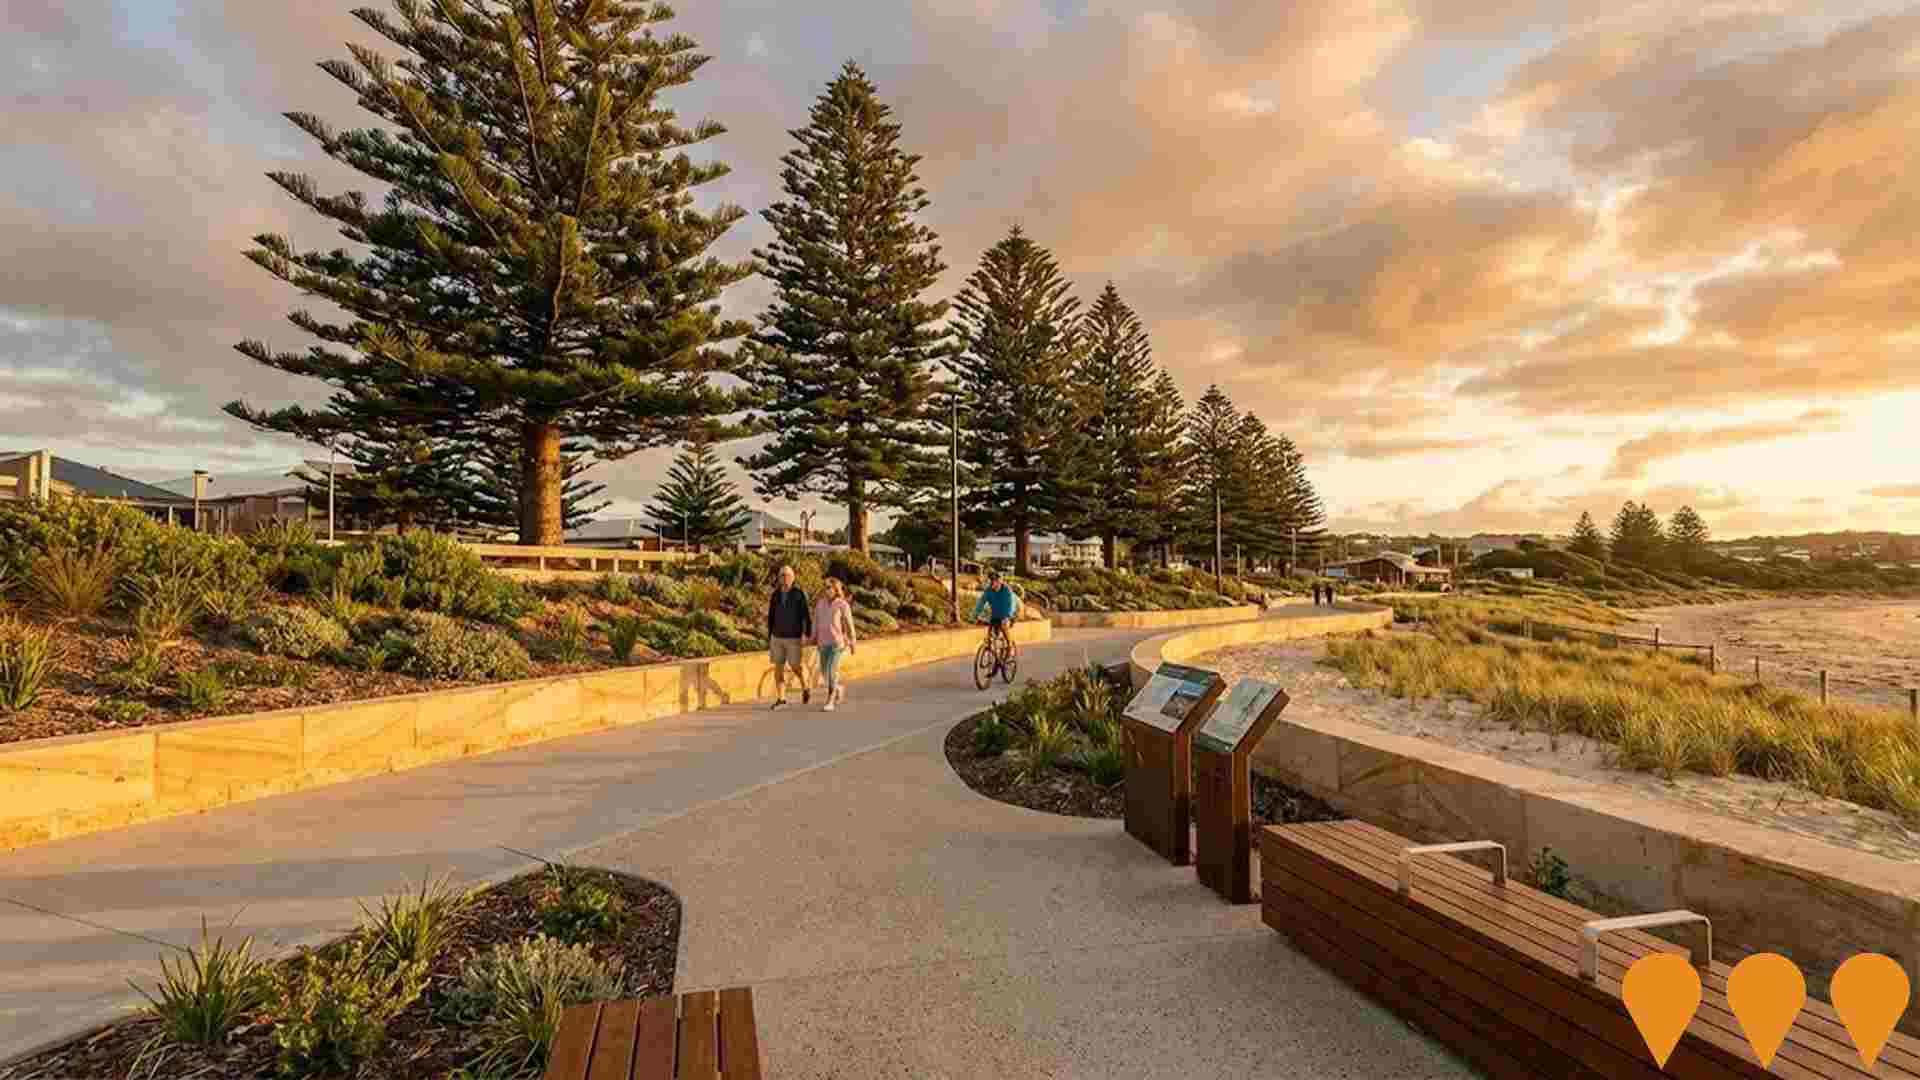
 Denotes AI-based impression for illustrative purposes only, not to be taken as definitive under any circumstances. Please follow links and conduct other investigations from the project's source for actual imagery. Developers and project owners wishing us to use original imagery please Contact Us and we will do so.
Frequently Asked Questions - Infrastructure
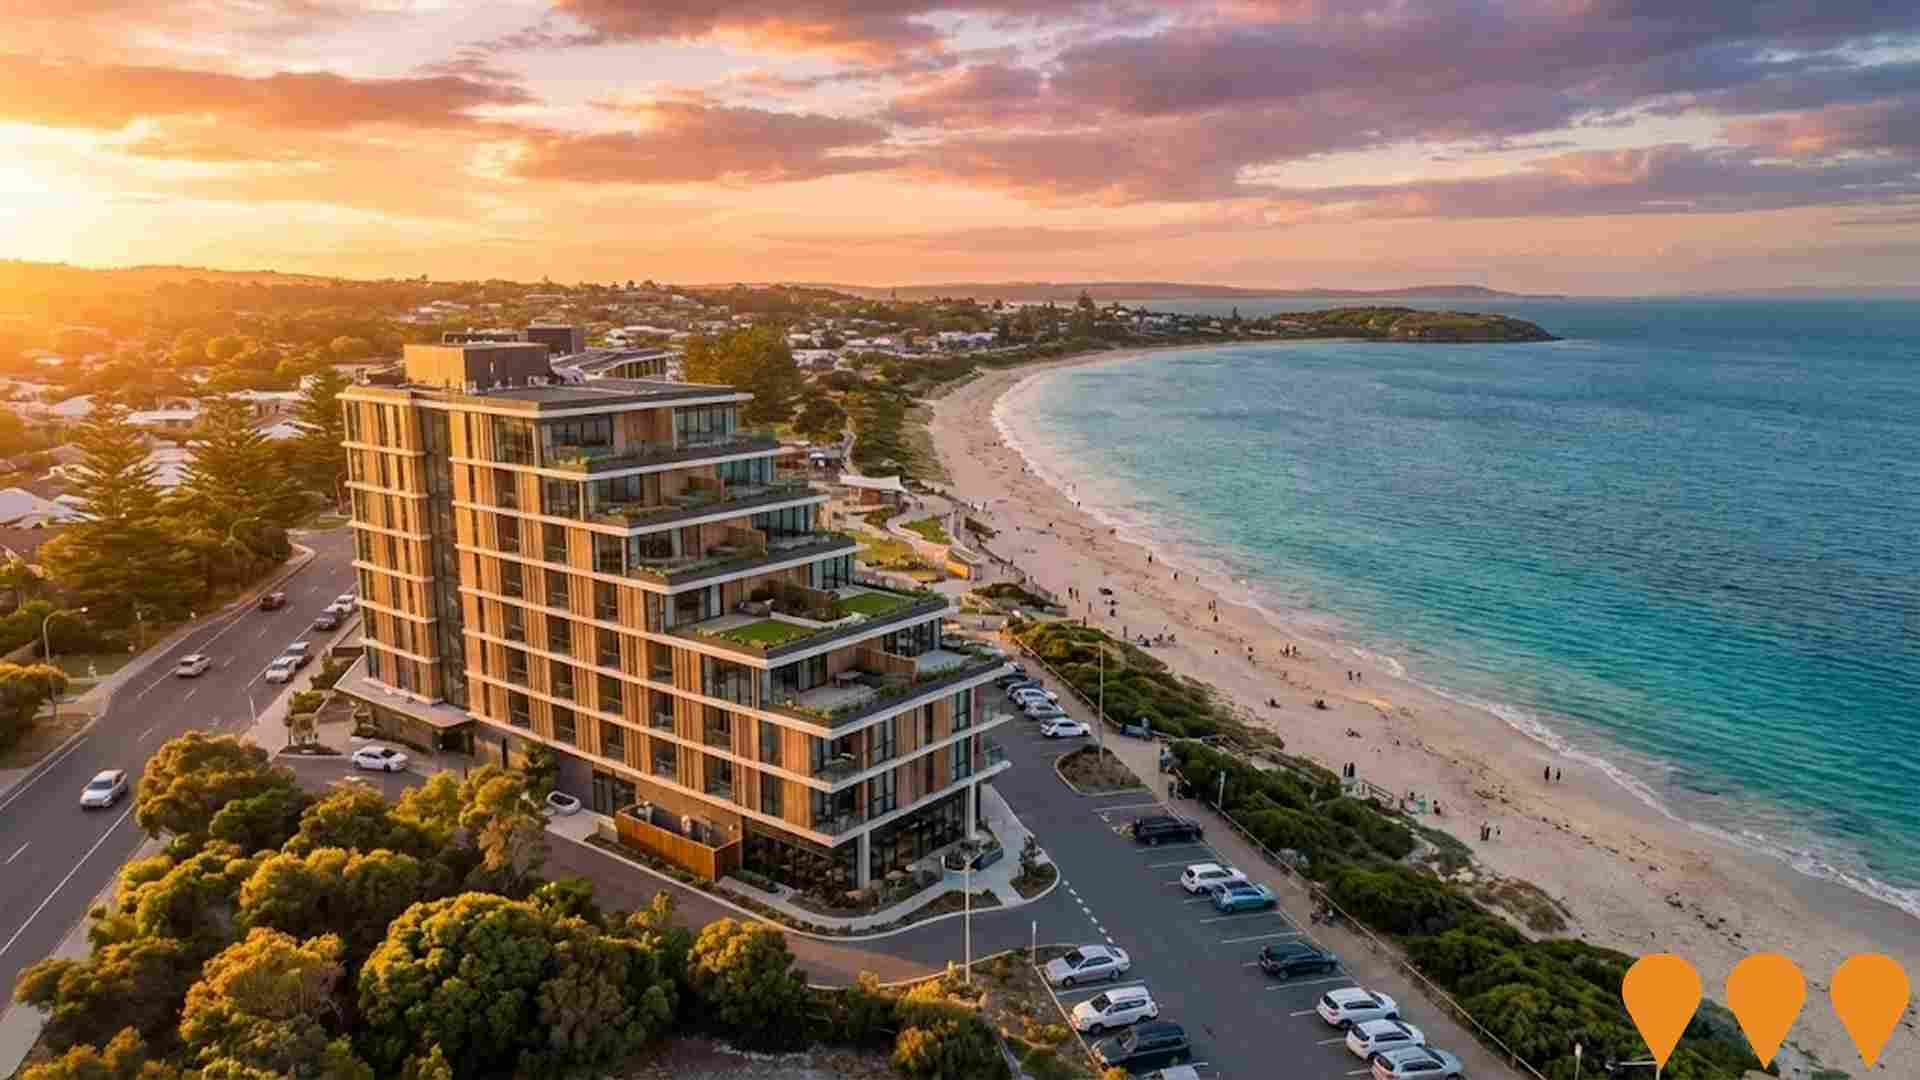
Middleton Beach Hotel
A new 8-storey hotel with 69 suites, featuring food and beverage facilities, a tavern, and retail store. Operated by Seashells Hospitality Group, the development is designed with a terraced structure on the former Esplanade Hotel site.
Middleton Beach Activity Centre
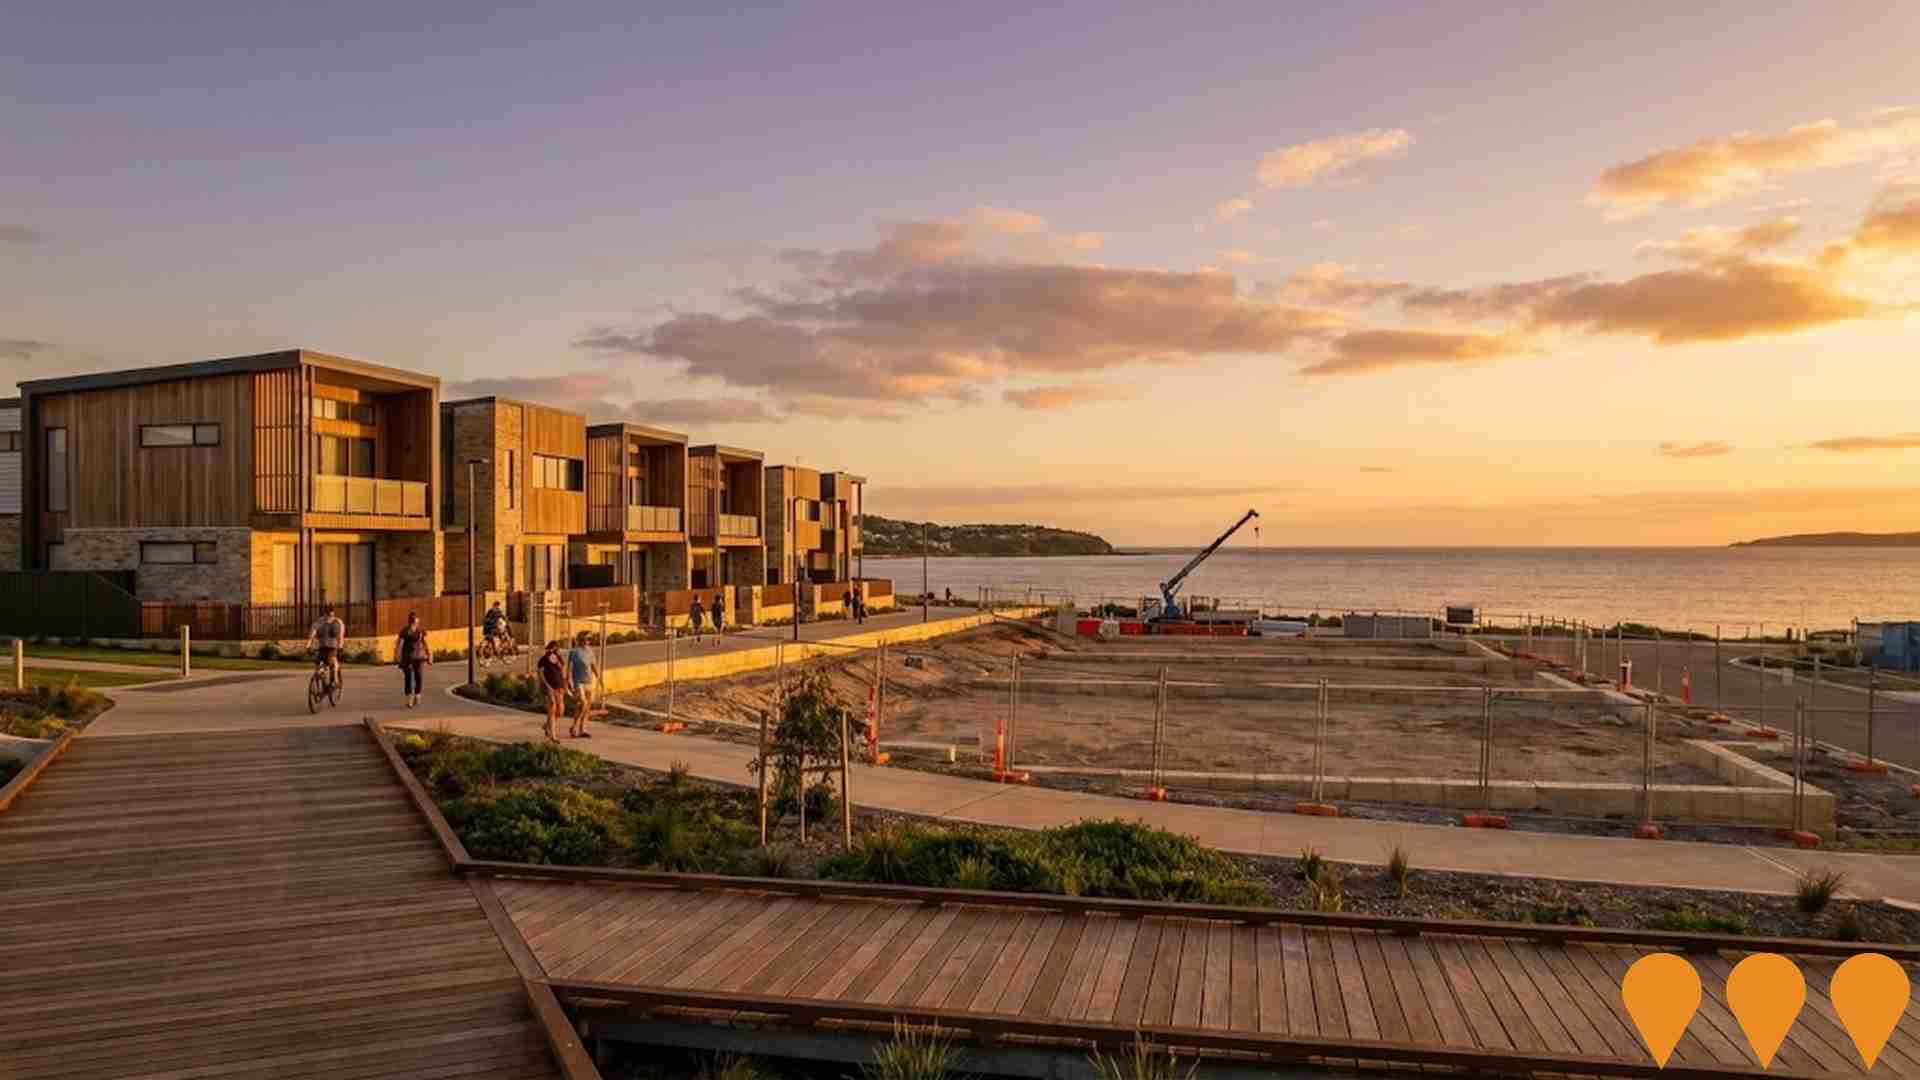
Mixed-use foreshore precinct led by DevelopmentWA activating the former Esplanade Hotel site and surrounds. Civil works and seawall upgrades are complete, six Duette townhouses have been delivered, and the hotel site on Lot 10 has Development Approval (Feb 2024) for an eight-storey, 69-suite hotel by Pacifica Ausglobal. Additional medium-density lots (7, 8, 9) were released/marketed in 2025 to boost local housing supply.
Spencer Park Renewal Project
A revitalisation project to refurbish existing social housing, improve public spaces and streetscapes, and enhance connectivity in Spencer Park. The $4 million investment component included the refurbishment of eight public housing units, construction of eight new public housing dwellings, and upgrades to Hardie Road and Mokare Park. This investment has been substantially delivered, and the overall project continues to evolve with additional housing components.
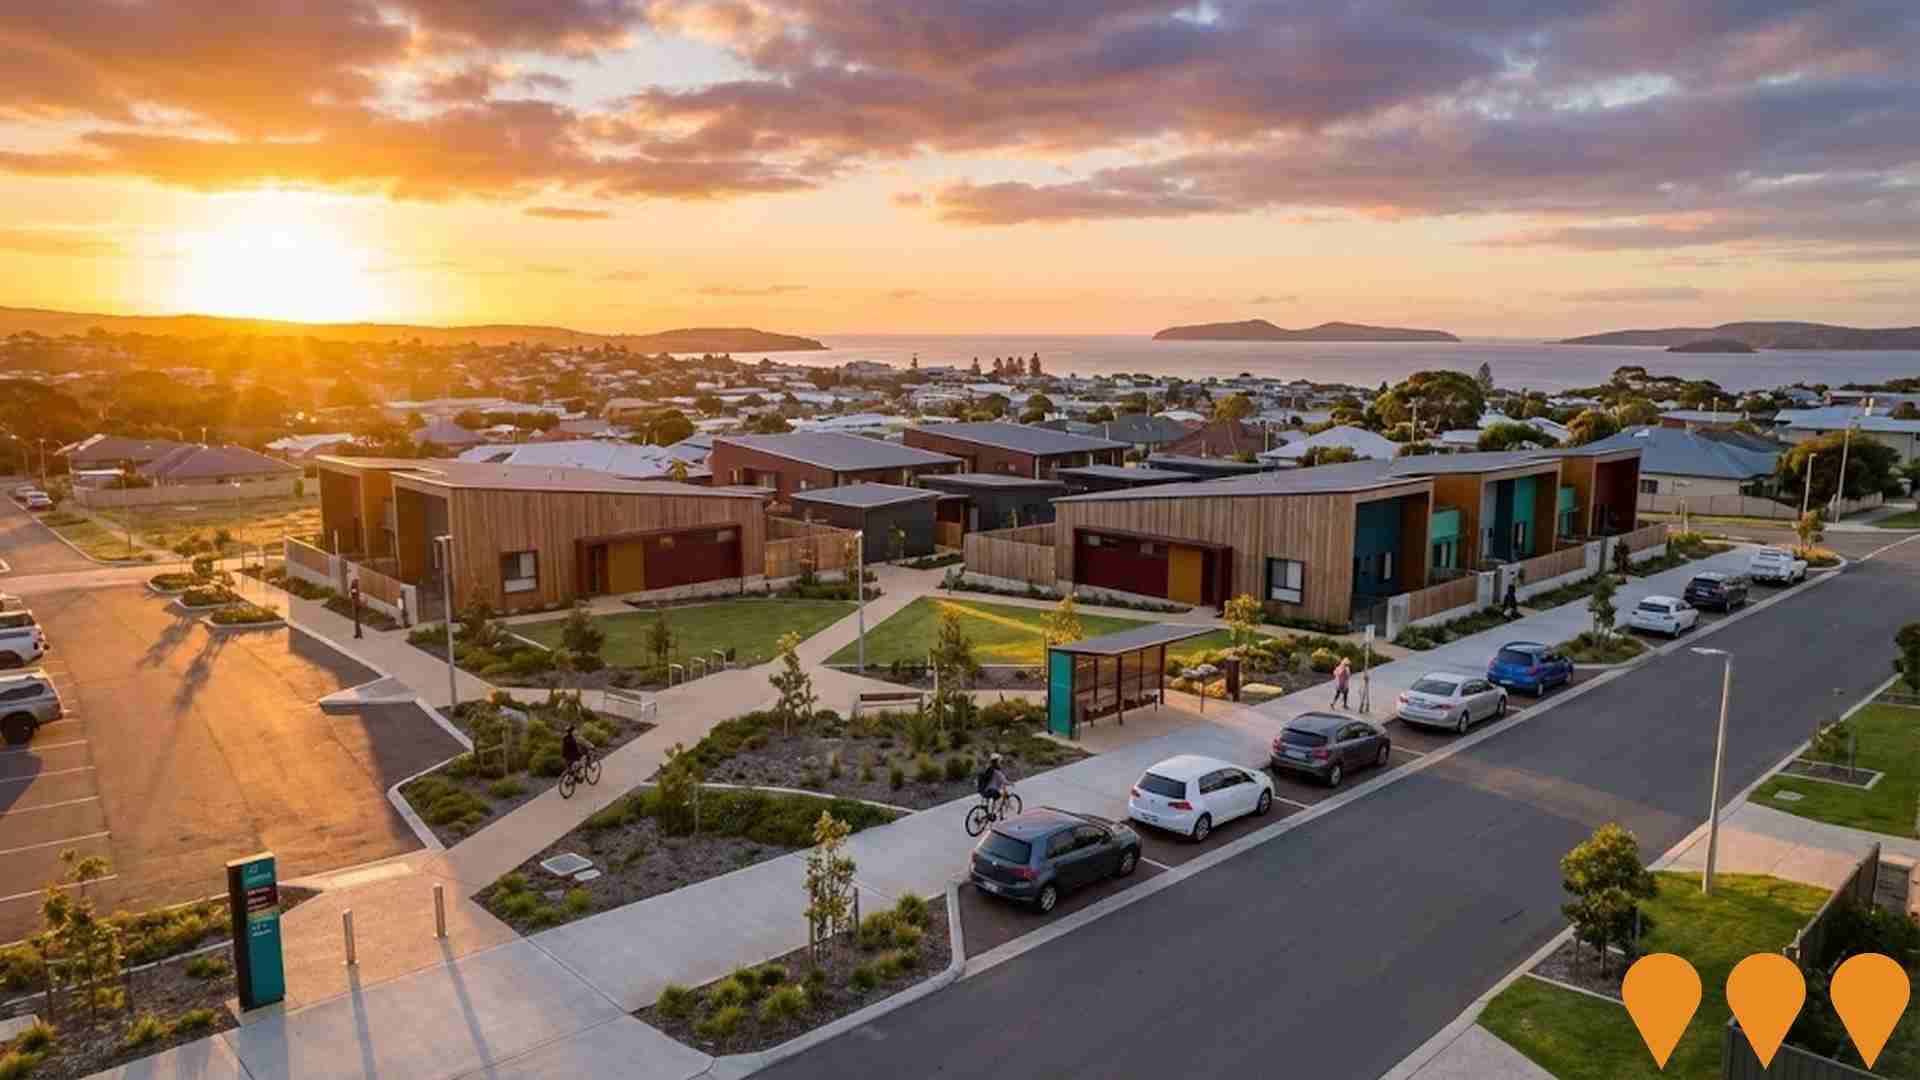
Emu Point Precinct Structure Plan
Structure plan guiding future growth and development over 560 hectares for a mix of residential, tourism, recreation, community, aquaculture, and marine-related land uses. It will make recommendations on zoning, density, built form, land uses, and the public realm. The plan is currently in the stage of **Preparation of the Draft PSP** considering preliminary engagement insights, with **formal advertising** and feedback sought in **Mid - Late 2025**, and **determination** expected in **Late 2025 - Mid 2026**.
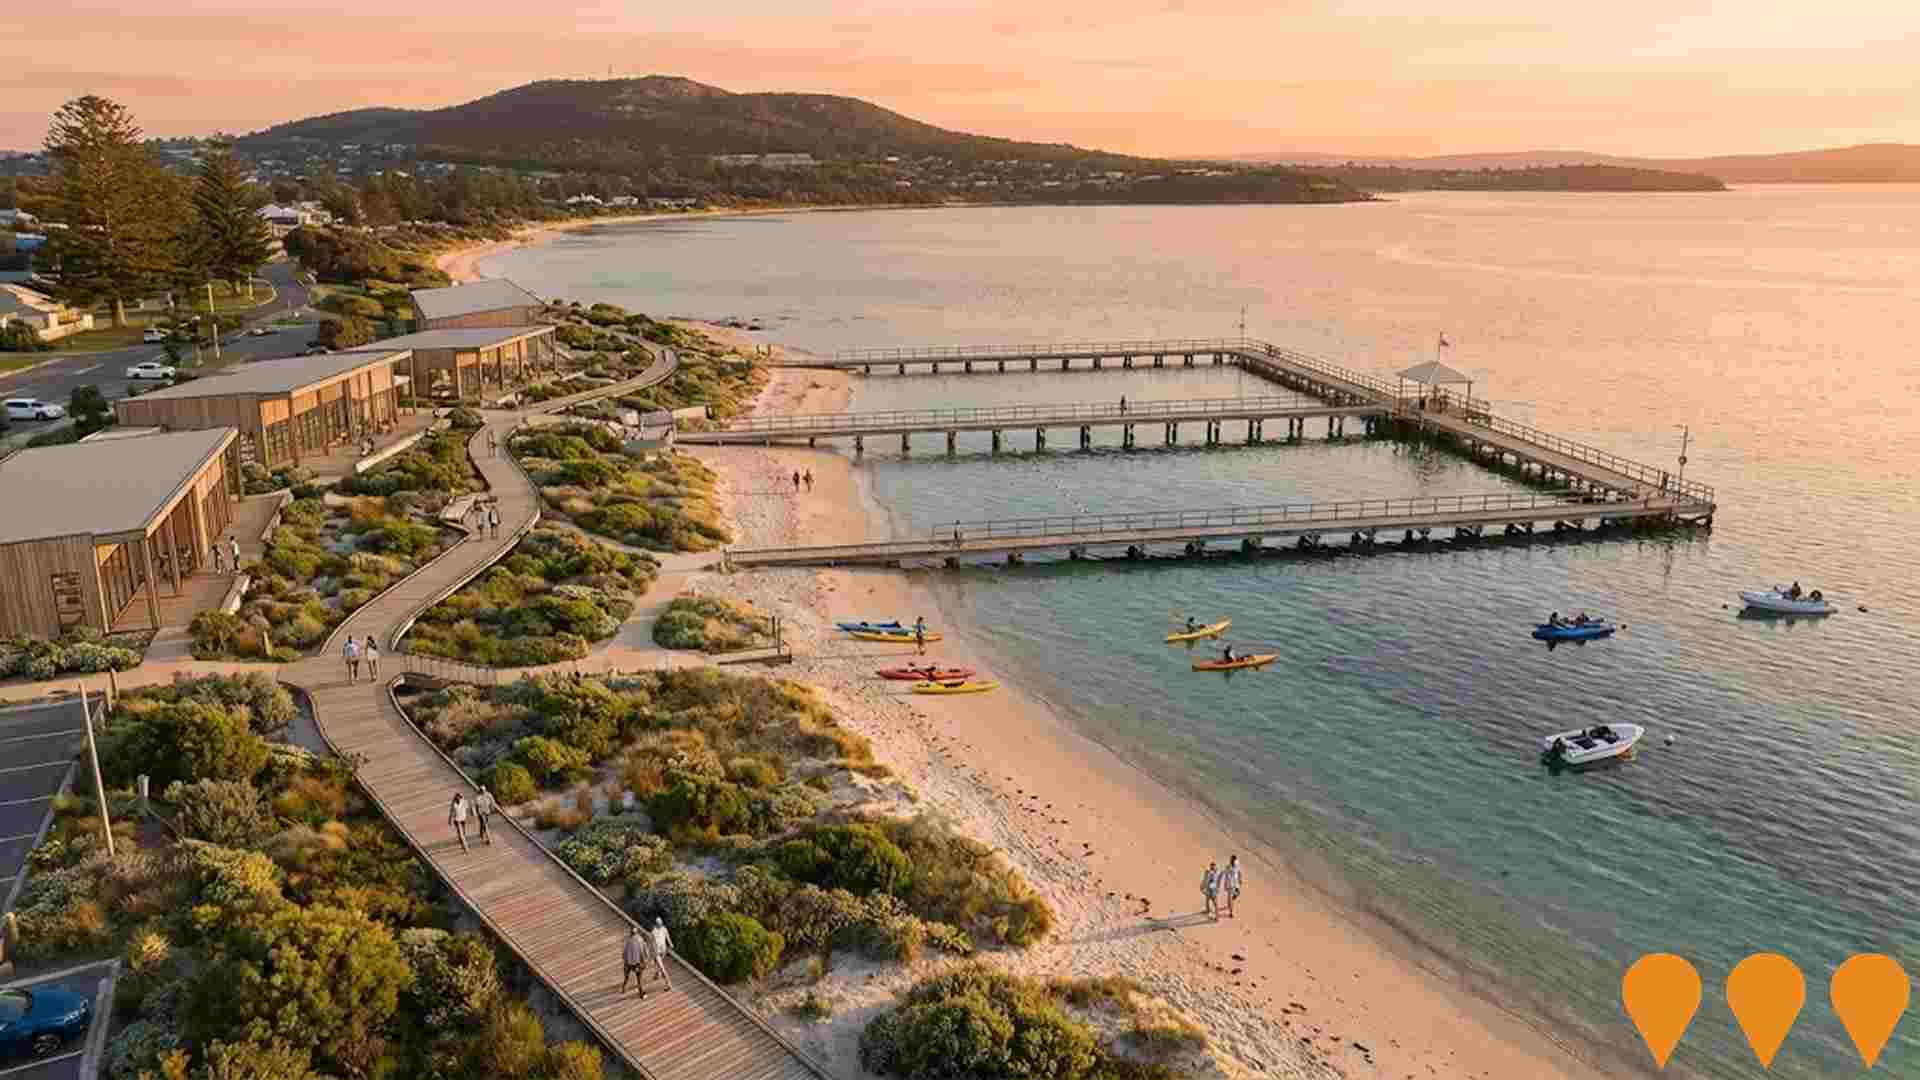
Spencer Park Education Support Centre Redevelopment
Redevelopment and upgrade of the Spencer Park Education Support Centre facilities, which caters to students with Autism, Intellectual Disabilities, and other special learning needs. The need for additional space was highlighted in a 2017 review, and the school has since undertaken a review process to align with Department of Education requirements and a new Business Plan (2025-2027) for improvement in learning and inclusion.
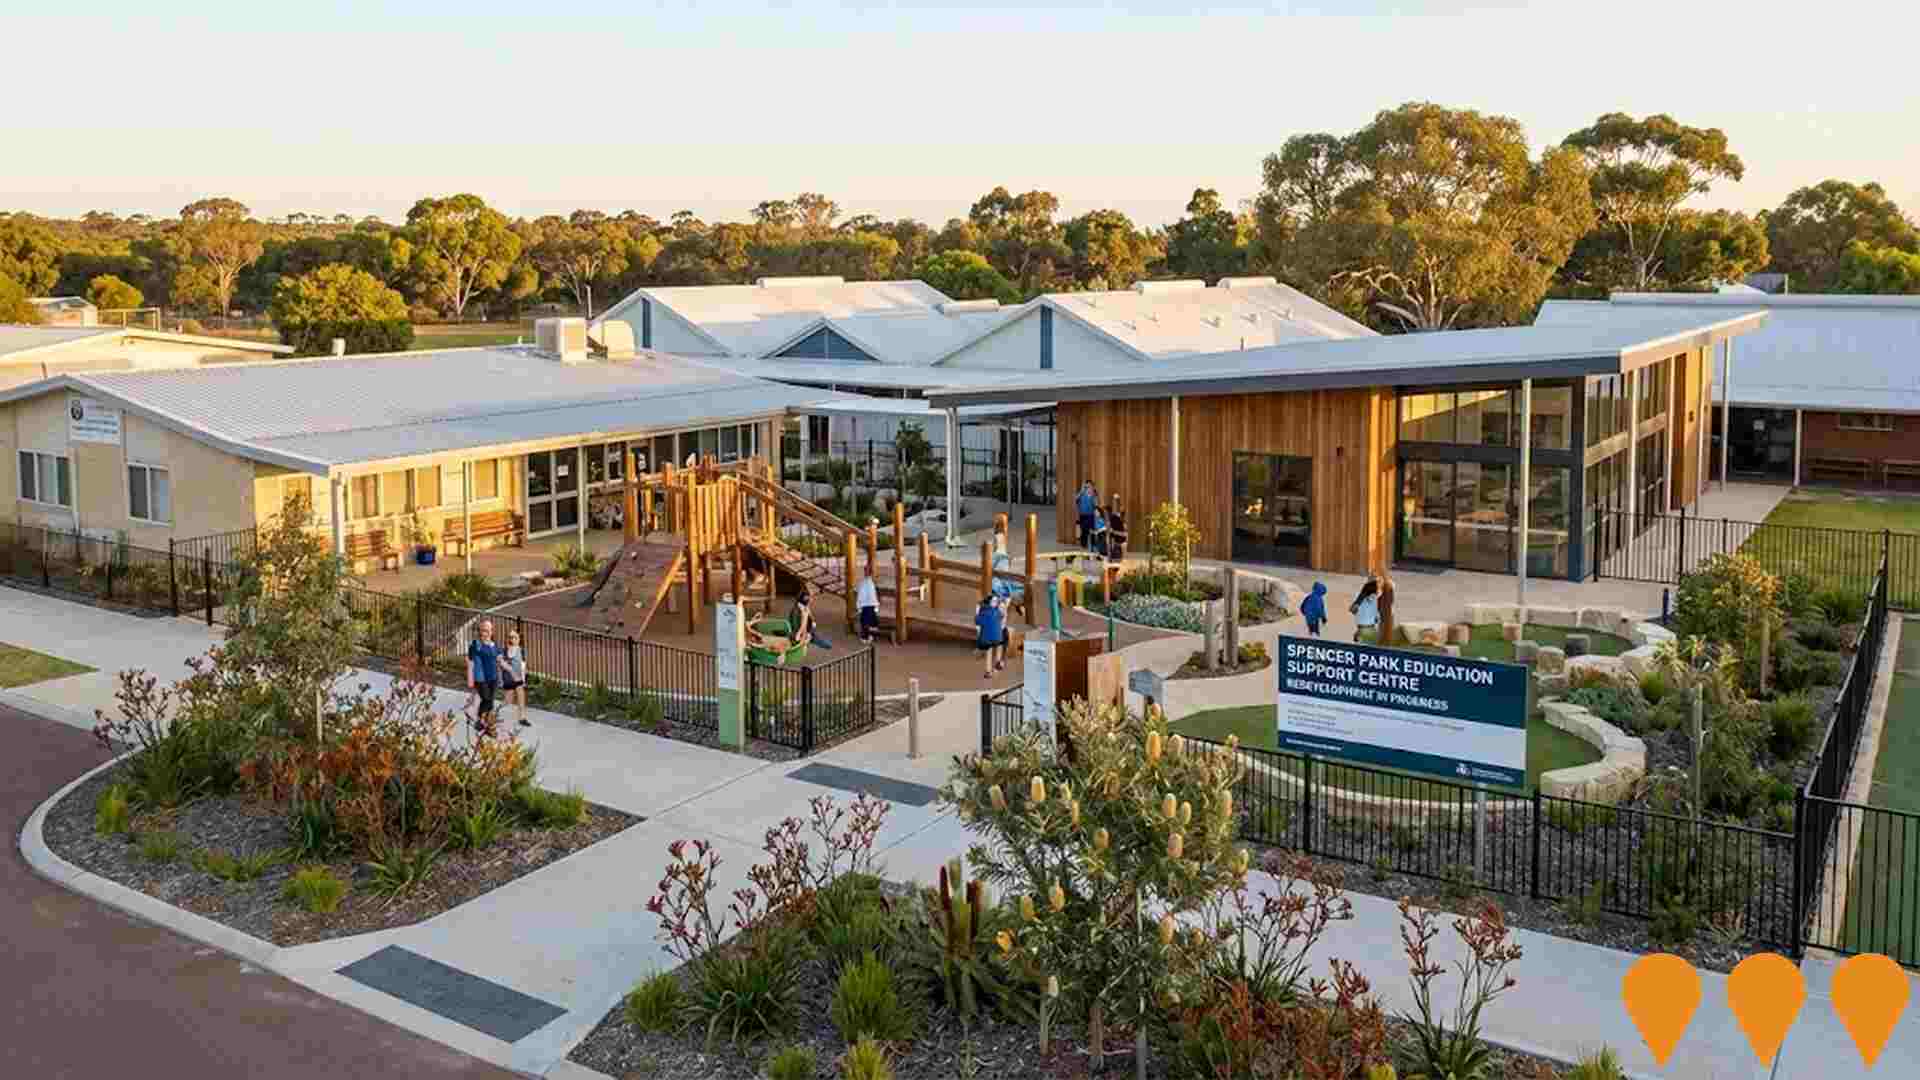
Mount Lockyer Primary School Rebuild
A $16.6 million redevelopment delivering four new general classroom blocks, a new administration building, a new library and an undercover assembly area, increasing permanent capacity to about 650 students. Construction commenced in 2020 and facilities were opened in August 2022.

Spencer Park Renewal Project - Hardie Road Mixed-Use Development
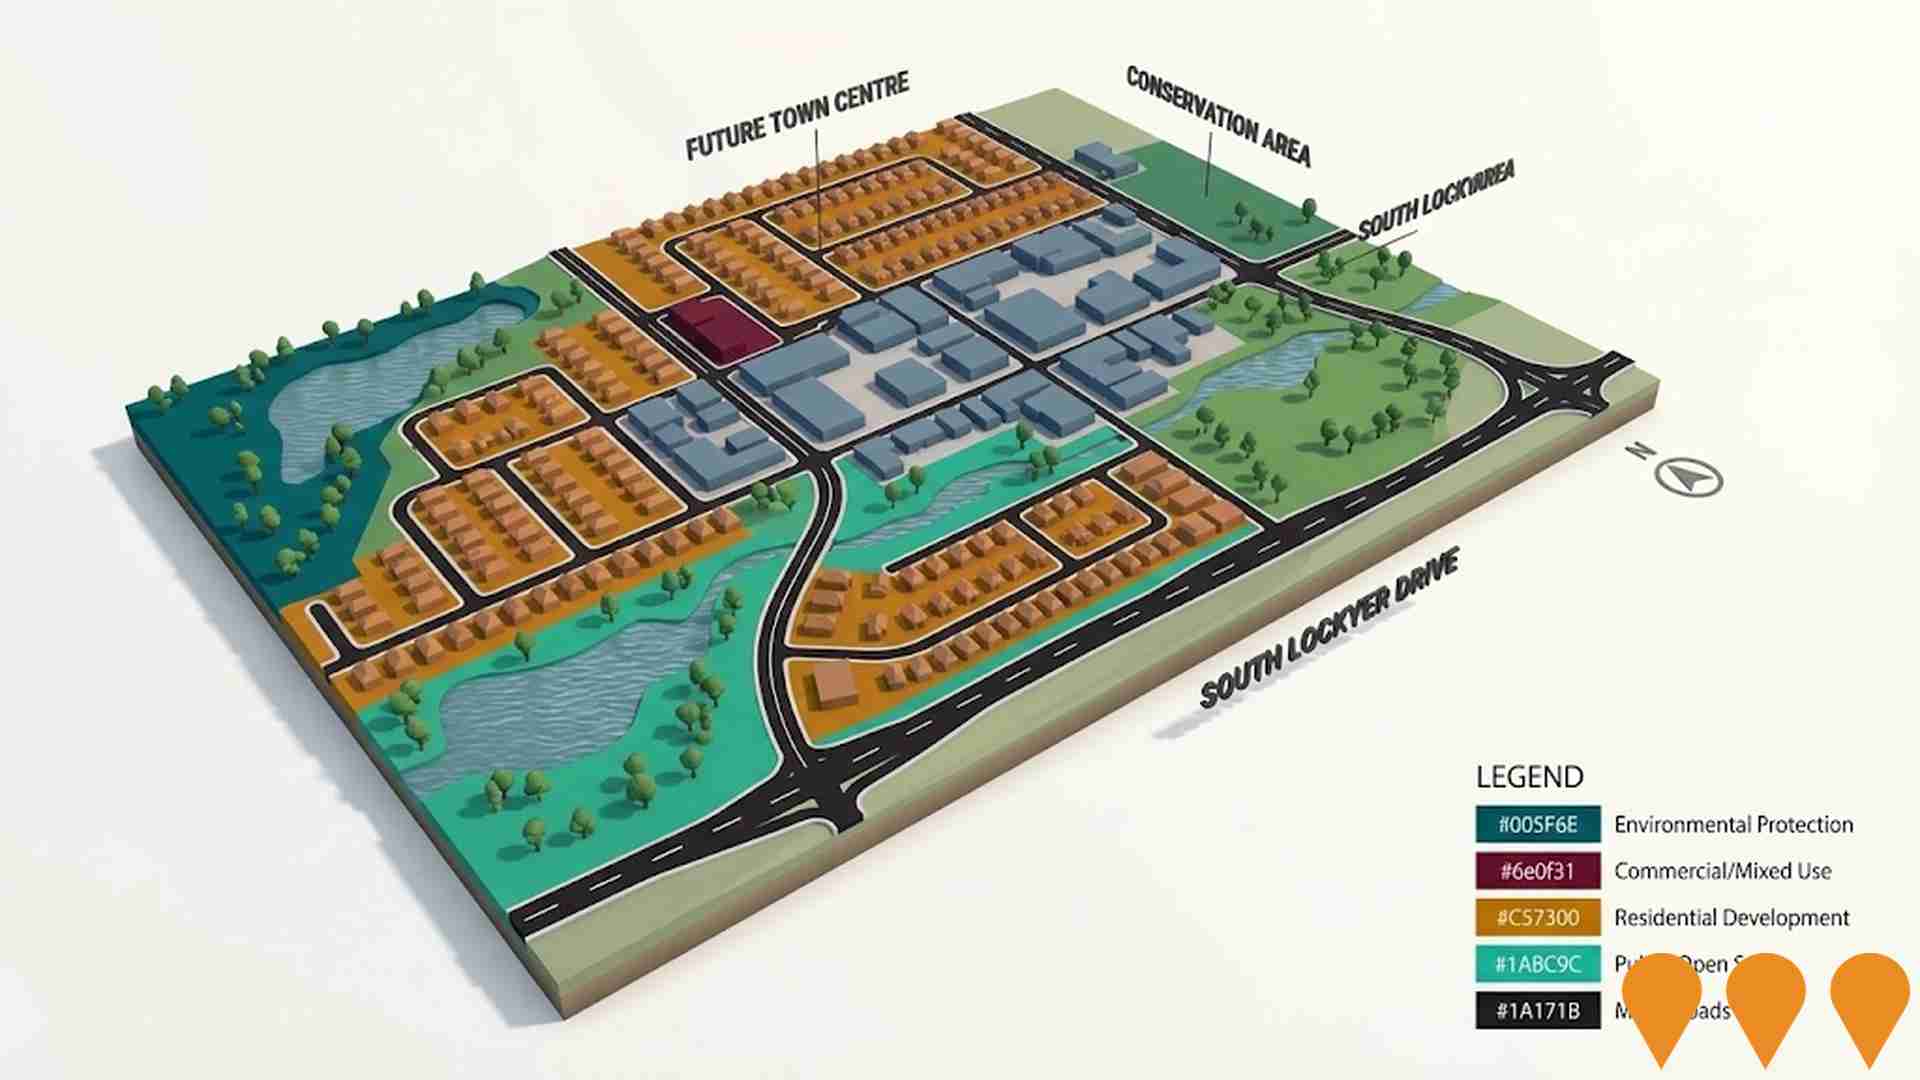
State-backed mixed-use renewal project within the Spencer Park Improvement Special Control Area in Albany, delivering 51 new social, affordable and key worker homes along Hardie Road alongside a new Albany Dental Clinic and office space. The project sits within the Spencer Park Renewal Project, which is progressively upgrading streetscapes, public spaces and housing around the neighbourhood centre, guided by an adopted Local Development Plan to enable higher density mixed-use development close to schools, health services and shops.
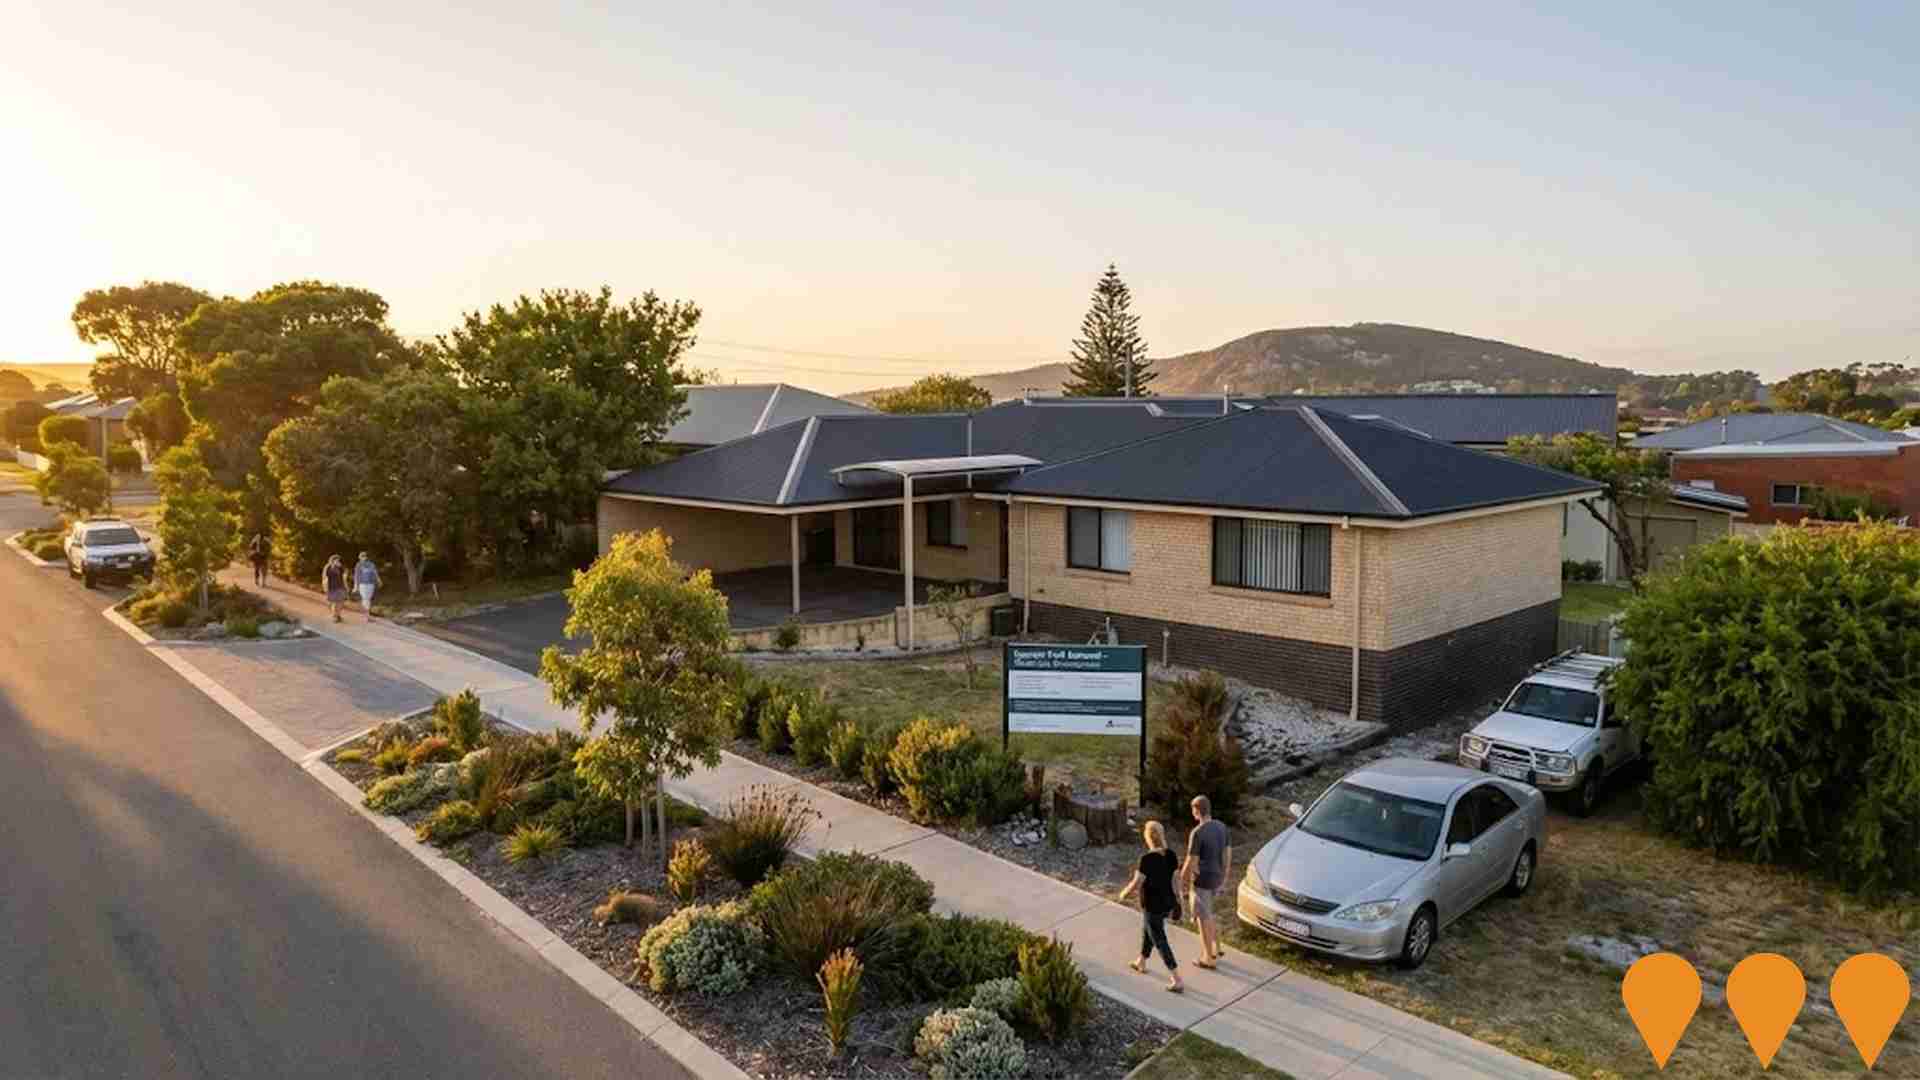
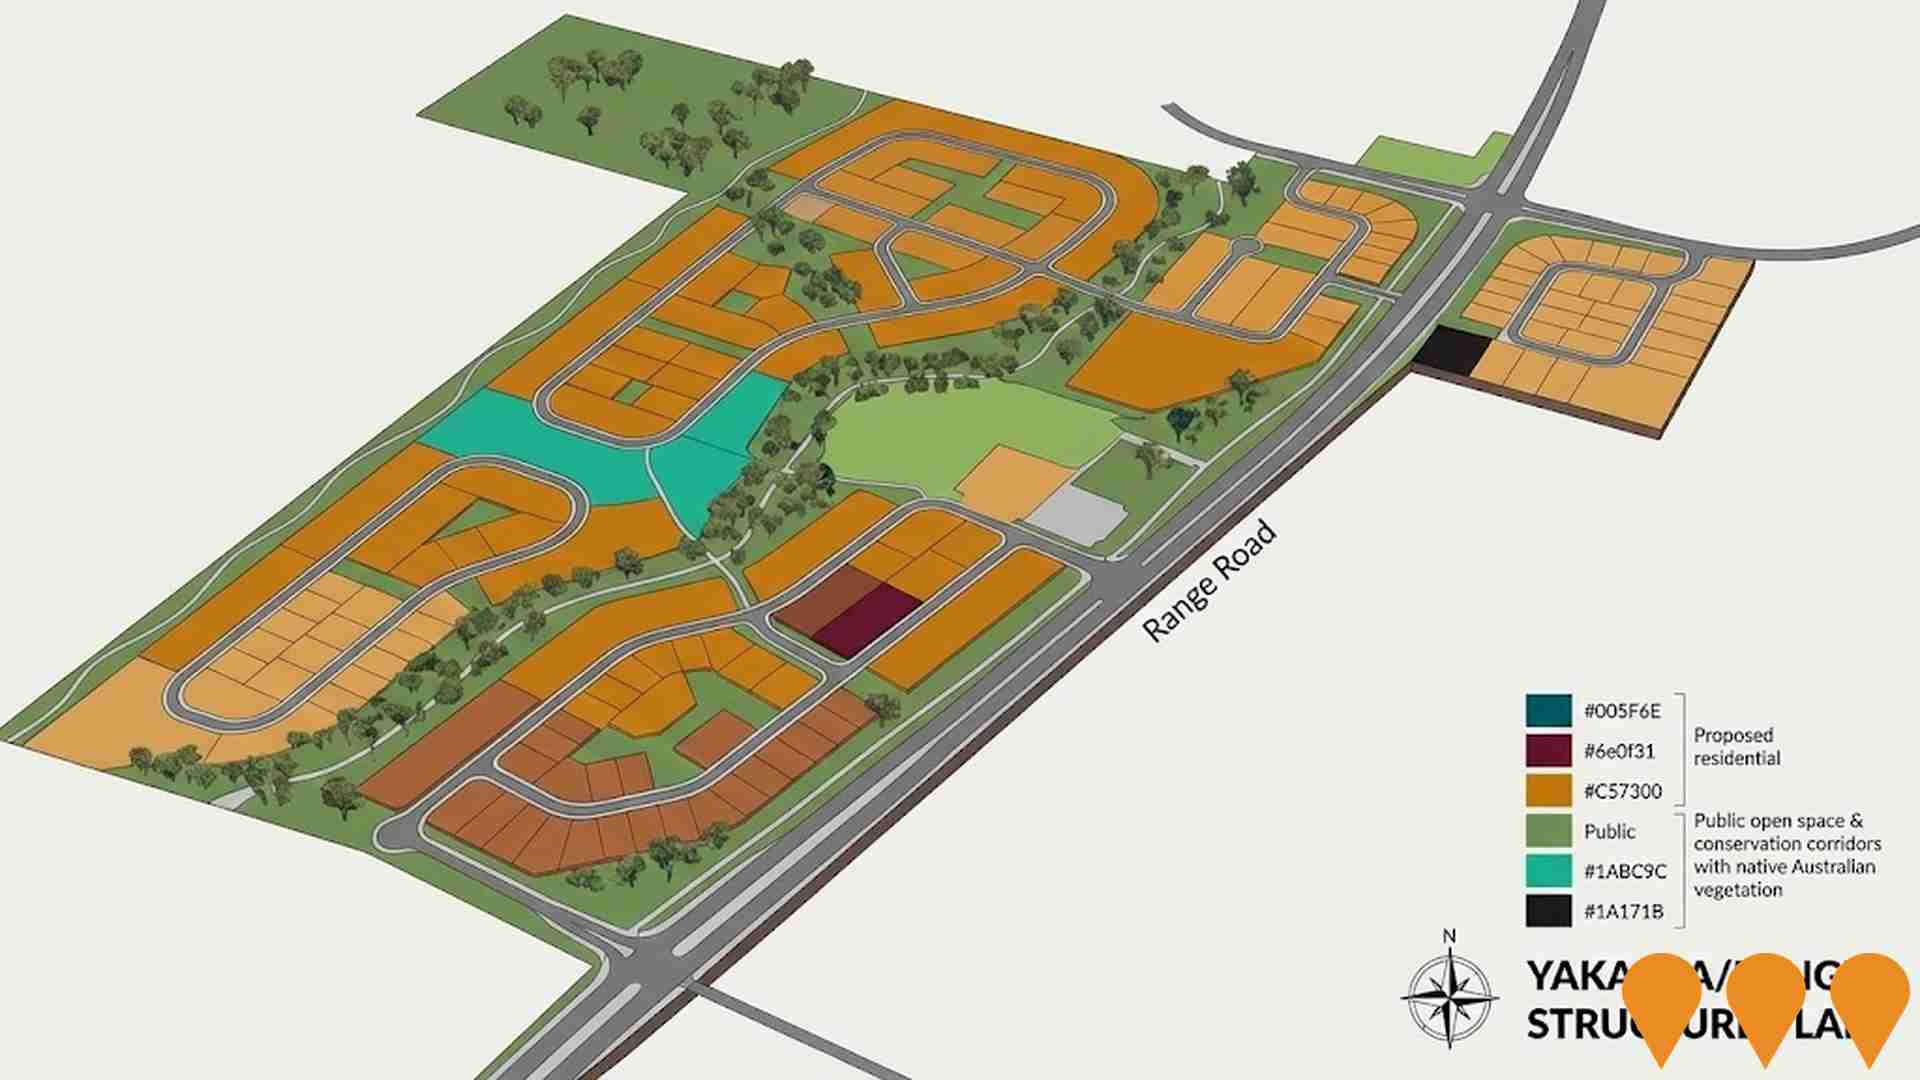
Yakamia/Lange Structure Plan
District structure plan adopted in 2015 and endorsed by the Western Australian Planning Commission in 2016. It guides future urban development, residential areas, public open space, conservation corridors and key roads such as Range Road across the Yakamia and Lange localities north of Albany, and remains in effect pending the broader Albany North District Structure Plan.
Employment
AreaSearch assessment positions Albany ahead of most Australian regions for employment performance
Albany has a skilled workforce with essential services sectors well represented. Its unemployment rate is 2.0%.
As of September 2025, 7663 residents are employed while the unemployment rate is 1.3% lower than Rest of WA's rate of 3.3%. Workforce participation in Albany lags at 53.7%, compared to Rest of WA's 59.4%. Key industries of employment among residents are health care & social assistance, retail trade, and education & training. Albany shows strong specialization in health care & social assistance with an employment share 1.7 times the regional level, while mining is lower at 1.8% versus the regional average of 11.7%.
The worker-resident ratio indicates local employment opportunities above the norm. Between September 2024 and September 2025, Albany's labour force decreased by 4.1% and employment declined by 3.2%, causing the unemployment rate to fall by 0.9 percentage points. This contrasts with Rest of WA where employment rose by 1.4%. National employment forecasts from May-25 suggest growth of 6.6% over five years and 13.7% over ten years. Applying these projections to Albany's employment mix, local employment is expected to increase by 6.6% over five years and 13.9% over ten years.
Frequently Asked Questions - Employment
Income
Income figures position the area below 75% of locations analysed nationally by AreaSearch
AreaSearch's latest postcode level ATO data for financial year 2022 indicates Albany SA2's median income among taxpayers is $47,800, with an average of $60,246. This is below the national average. The Rest of WA has a median income of $57,323 and an average of $71,163. Based on Wage Price Index growth of 14.2% since financial year 2022, current estimates project approximately $54,588 (median) and $68,801 (average) as of September 2025. Census data shows household, family, and personal incomes in Albany fall between the 16th and 30th percentiles nationally. Income distribution reveals 27.9% earning $1,500 - 2,999 weekly, comprising 4,378 residents, similar to regional patterns where 31.1% occupy this range. Housing affordability pressures are severe, with only 84.6% of income remaining, ranking at the 17th percentile.
Frequently Asked Questions - Income
Housing
Albany is characterized by a predominantly suburban housing profile, with a higher proportion of rental properties than the broader region
Albany's dwelling structures, as per the latest Census, comprised 85.3% houses and 14.7% other dwellings. In comparison, Non-Metro WA had 92.1% houses and 8.0% other dwellings. Home ownership in Albany was 39.0%, with mortgaged dwellings at 26.6% and rented ones at 34.4%. The median monthly mortgage repayment in Albany was $1,439, below Non-Metro WA's average of $1,490. Weekly rent figures were $300 in Albany, compared to Non-Metro WA's $280. Nationally, Albany's mortgage repayments were significantly lower at $1,439 than the Australian average of $1,863, and rents were substantially below the national figure of $375.
Frequently Asked Questions - Housing
Household Composition
Albany features high concentrations of lone person households, with a lower-than-average median household size
Family households account for 60.1% of all households, including 19.0% that are couples with children, 29.5% that are couples without children, and 10.6% that are single parent families. Non-family households comprise the remaining 39.9%, with lone person households at 37.2% and group households making up 2.7% of the total. The median household size is 2.1 people, which is smaller than the Rest of WA average of 2.4.
Frequently Asked Questions - Households
Local Schools & Education
Albany shows below-average educational performance compared to national benchmarks, though pockets of achievement exist
Albany's educational qualifications lag regional benchmarks, with 22.4% of residents aged 15 and above holding university degrees compared to the Australian average of 30.4%. This disparity indicates potential for educational development and skill enhancement in Albany. Bachelor degrees are most common at 15.7%, followed by postgraduate qualifications (3.8%) and graduate diplomas (2.9%). Vocational credentials are also prevalent, with 38.0% of residents aged 15 and above holding such qualifications – advanced diplomas at 11.1% and certificates at 26.9%.
A significant portion of the population is actively engaged in formal education, with 24.7% pursuing it. This includes 8.2% in primary education, 8.1% in secondary education, and 2.9% in tertiary education.
Frequently Asked Questions - Education
Schools Detail
Nearby Services & Amenities
Transport
Transport servicing is low compared to other areas nationally based on assessment of service frequency, route connectivity and accessibility
Transport analysis shows 104 active public transport stops in Albany. These stops serve buses on 10 different routes, offering a total of 510 weekly passenger trips. Residents have good access to transport, with an average distance of 214 meters to the nearest stop.
The service runs approximately 72 trips per day across all routes, resulting in about 4 weekly trips per individual stop.
Frequently Asked Questions - Transport
Transport Stops Detail
Health
Health performance in Albany is well below average with prevalence of common health conditions notable across both younger and older age cohorts
Albany faces significant health challenges, with common conditions prevalent across both younger and older age groups. Approximately half (50%) of Albany's total population (~7,768 people) has private health cover, lower than the national average of 55.3%.
The most frequent medical conditions are arthritis (11.0% of residents) and mental health issues (10.0%), with 60.3% reporting no medical ailments, compared to 64.7% in Rest of WA. Albany has a higher proportion of seniors aged 65 and over (25.0%, or 3,920 people), compared to Rest of WA's 21.0%. Despite this, health outcomes among seniors are notably challenging but perform better than the general population in health metrics.
Frequently Asked Questions - Health
Cultural Diversity
In terms of cultural diversity, Albany records figures broadly comparable to the national average, as found in AreaSearch's assessment of a number of language and cultural background related metrics
Albany had a cultural diversity profile roughly matching its wider region's average, with 77.5% of residents born in Australia, 88.6% being citizens, and 92.3% speaking English only at home. Christianity was the predominant religion, comprising 44.6% of Albany's population. Notably, Judaism was slightly overrepresented at 0.1%, compared to the region's 0.1%.
The top three ancestry groups were English (35.0%), Australian (27.6%), and Scottish (7.7%). Some ethnic groups showed notable differences: Dutch were overrepresented at 2.2% in Albany versus 2.3% regionally, Welsh at 0.8% versus 0.7%, and Polish at 0.9% versus 0.7%.
Frequently Asked Questions - Diversity
Age
Albany hosts an older demographic, ranking in the top quartile nationwide
Albany's median age is 48 years, which exceeds Rest of WA's median age of 40 and is considerably older than the national norm of 38. Compared to the Rest of WA average, Albany has a notably higher proportion of people aged 85 and above (4.3% locally) but a lower proportion of those aged 5-14 years old (10.4%). Between 2021 and the present, younger residents have caused the median age to decrease by 1.1 years to 48. Specifically, the proportion of people aged 25 to 34 has grown from 10.5% to 12.6%, while those aged 35 to 44 increased from 9.7% to 11.6%. Conversely, the proportion of people aged 75 to 84 has declined from 9.7% to 8.1%, and those aged 65 to 74 have dropped from 14.0% to 12.6%. Population forecasts for the year 2041 indicate substantial demographic changes in Albany, with the 25 to 34 age group projected to grow by 49%, adding 974 residents to reach a total of 2,957. Conversely, population declines are projected for the cohorts aged 5-14 and 85+.
