Chart Color Schemes
This analysis uses ABS Statistical Areas Level 2 (SA2) boundaries, which can materially differ from Suburbs and Localities (SAL) even when sharing similar names.
SA2 boundaries are defined by the Australian Bureau of Statistics and are designed to represent communities for statistical reporting (e.g., census and ERP).
Suburbs and Localities (SAL) represent commonly-used suburb/locality names (postal-style areas) and may use different geographic boundaries. For comprehensive analysis, consider reviewing both boundary types if available.
est. as @ -- *
ABS ERP | -- people | --
2021 Census | -- people
Sales Activity
Curious about local property values? Filter the chart to assess the volume and appreciation (including resales) trends and regional comparisons, or scroll to the map below view this information at an individual property level.
Find a Recent Sale
Sales Detail
Population
Kew East is positioned among the lower quartile of areas assessed nationally for population growth based on AreaSearch's assessment of recent, and medium term trends
Kew East's population was around 6,905 as of November 2025. This showed an increase of 423 people from the 2021 Census figure of 6,482, indicating a growth rate of approximately 6.5%. The change was inferred from the estimated resident population of 6,784 in June 2024 and the addition of 10 validated new addresses since the Census date. This resulted in a population density ratio of 1,717 persons per square kilometer, higher than the average across national locations assessed by AreaSearch. Kew East's growth rate since the census was within 0.4 percentage points of the SA3 area's rate of 6.9%, indicating competitive growth fundamentals. Overseas migration contributed approximately 93.1% of overall population gains during recent periods, driving primary population growth in the area.
AreaSearch adopted ABS/Geoscience Australia projections for each SA2 area released in 2024 with a base year of 2022. For areas not covered by this data, AreaSearch utilized VIC State Government's Regional/LGA projections released in 2023, adjusting them employing a method of weighted aggregation of population growth from LGA to SA2 levels. Growth rates by age group from these aggregations were applied across all areas for the years 2032 to 2041. Future population trends anticipated lower quartile growth for national statistical areas. Kew East was expected to increase by 56 persons by 2041, based on the latest annual ERP population numbers, reflecting a decline of approximately 1.0% in total over the 17-year period.
Frequently Asked Questions - Population
Development
Residential development activity is lower than average in Kew East according to AreaSearch's national comparison of local real estate markets
Kew East has received approximately 26 dwelling approvals annually over the past five financial years, totalling 133 homes. In FY-2025/26, nine approvals have been recorded to date. The area's population decline has resulted in an adequate housing supply relative to demand, fostering a balanced market with diverse buyer options. New homes are being constructed at an average expected cost of $978,000, indicating a focus on premium properties.
This financial year has seen $9.6 million in commercial approvals, reflecting steady investment activity. Compared to Greater Melbourne, Kew East has about three-quarters the rate of new dwelling approvals per person and ranks among the 62nd percentile nationally. Recent construction comprises 70% standalone homes and 30% medium and high-density housing, offering options across various price points.
With around 245 people per dwelling approval, Kew East exhibits a developing market. Given expected stable or declining population, reduced housing pressure may create buying opportunities in the future.
Frequently Asked Questions - Development
Infrastructure
Kew East has very high levels of nearby infrastructure activity, ranking in the top 20% nationally
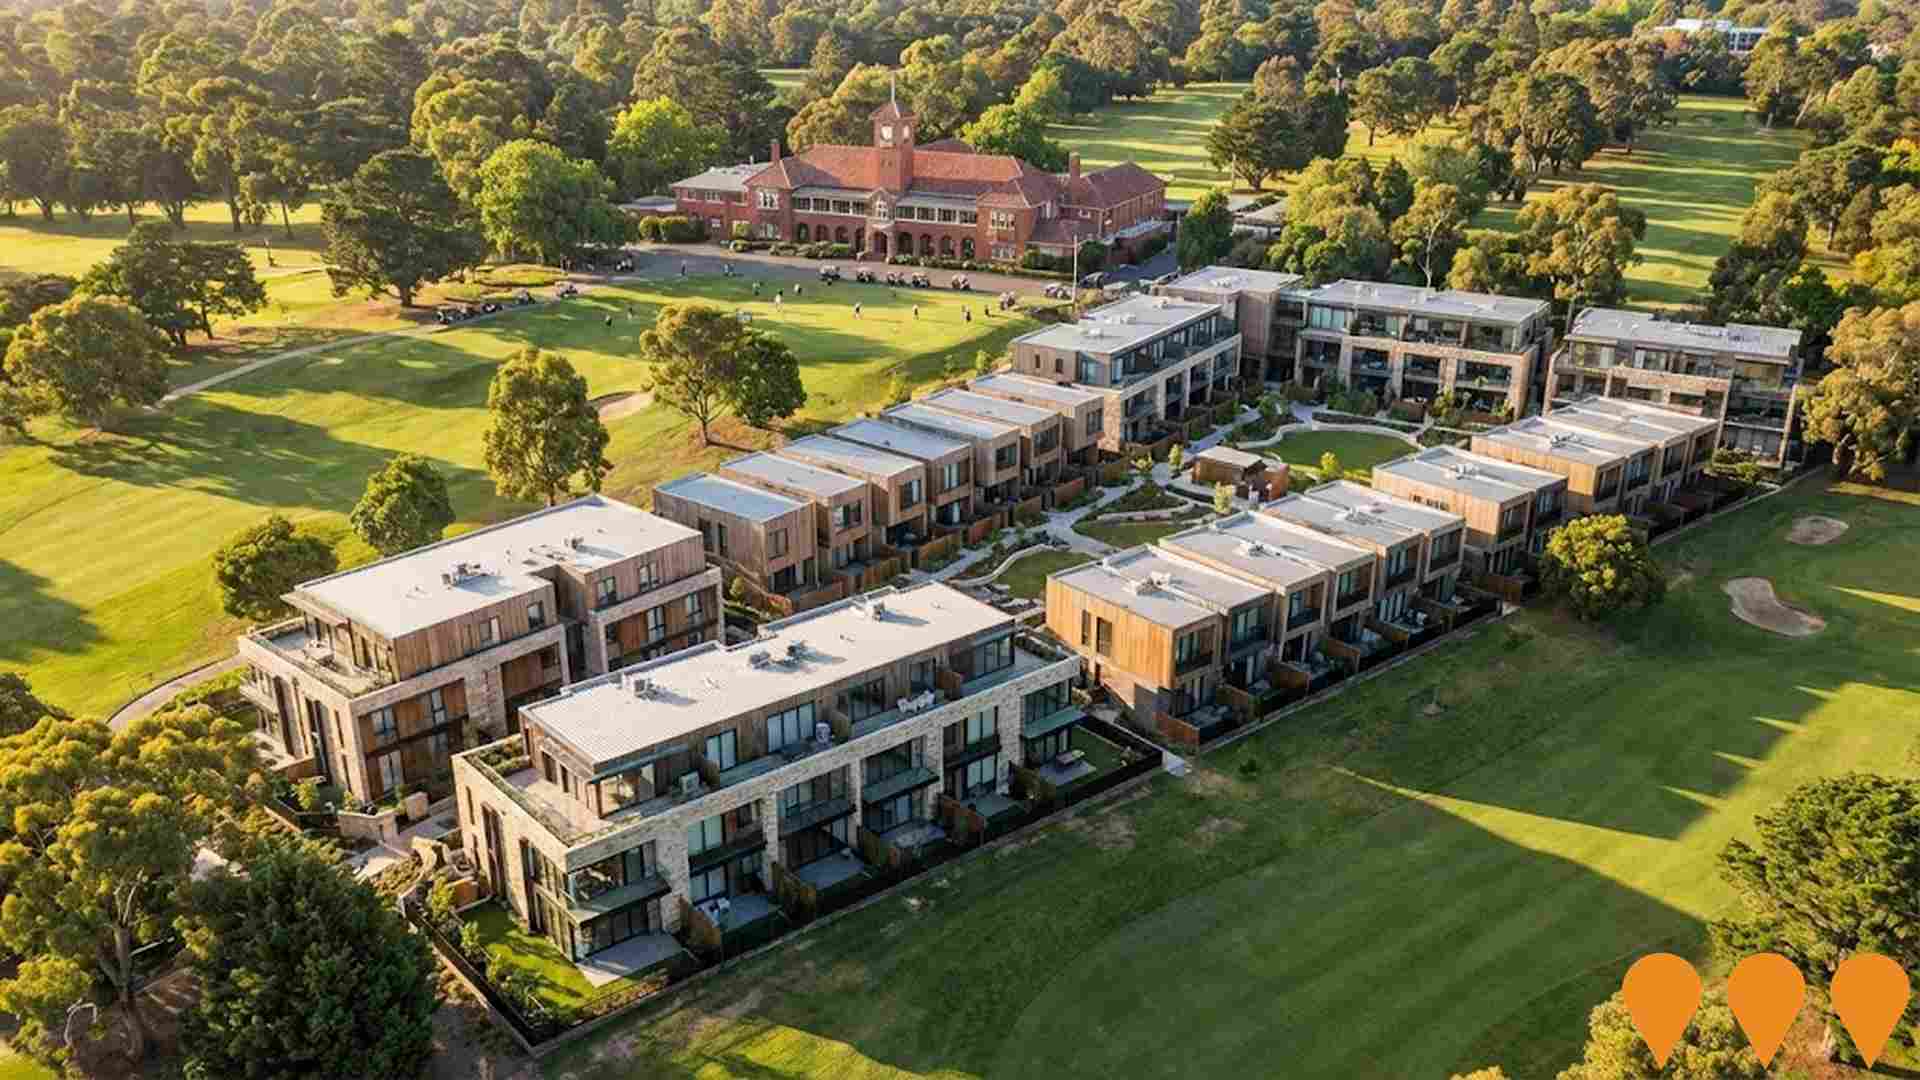
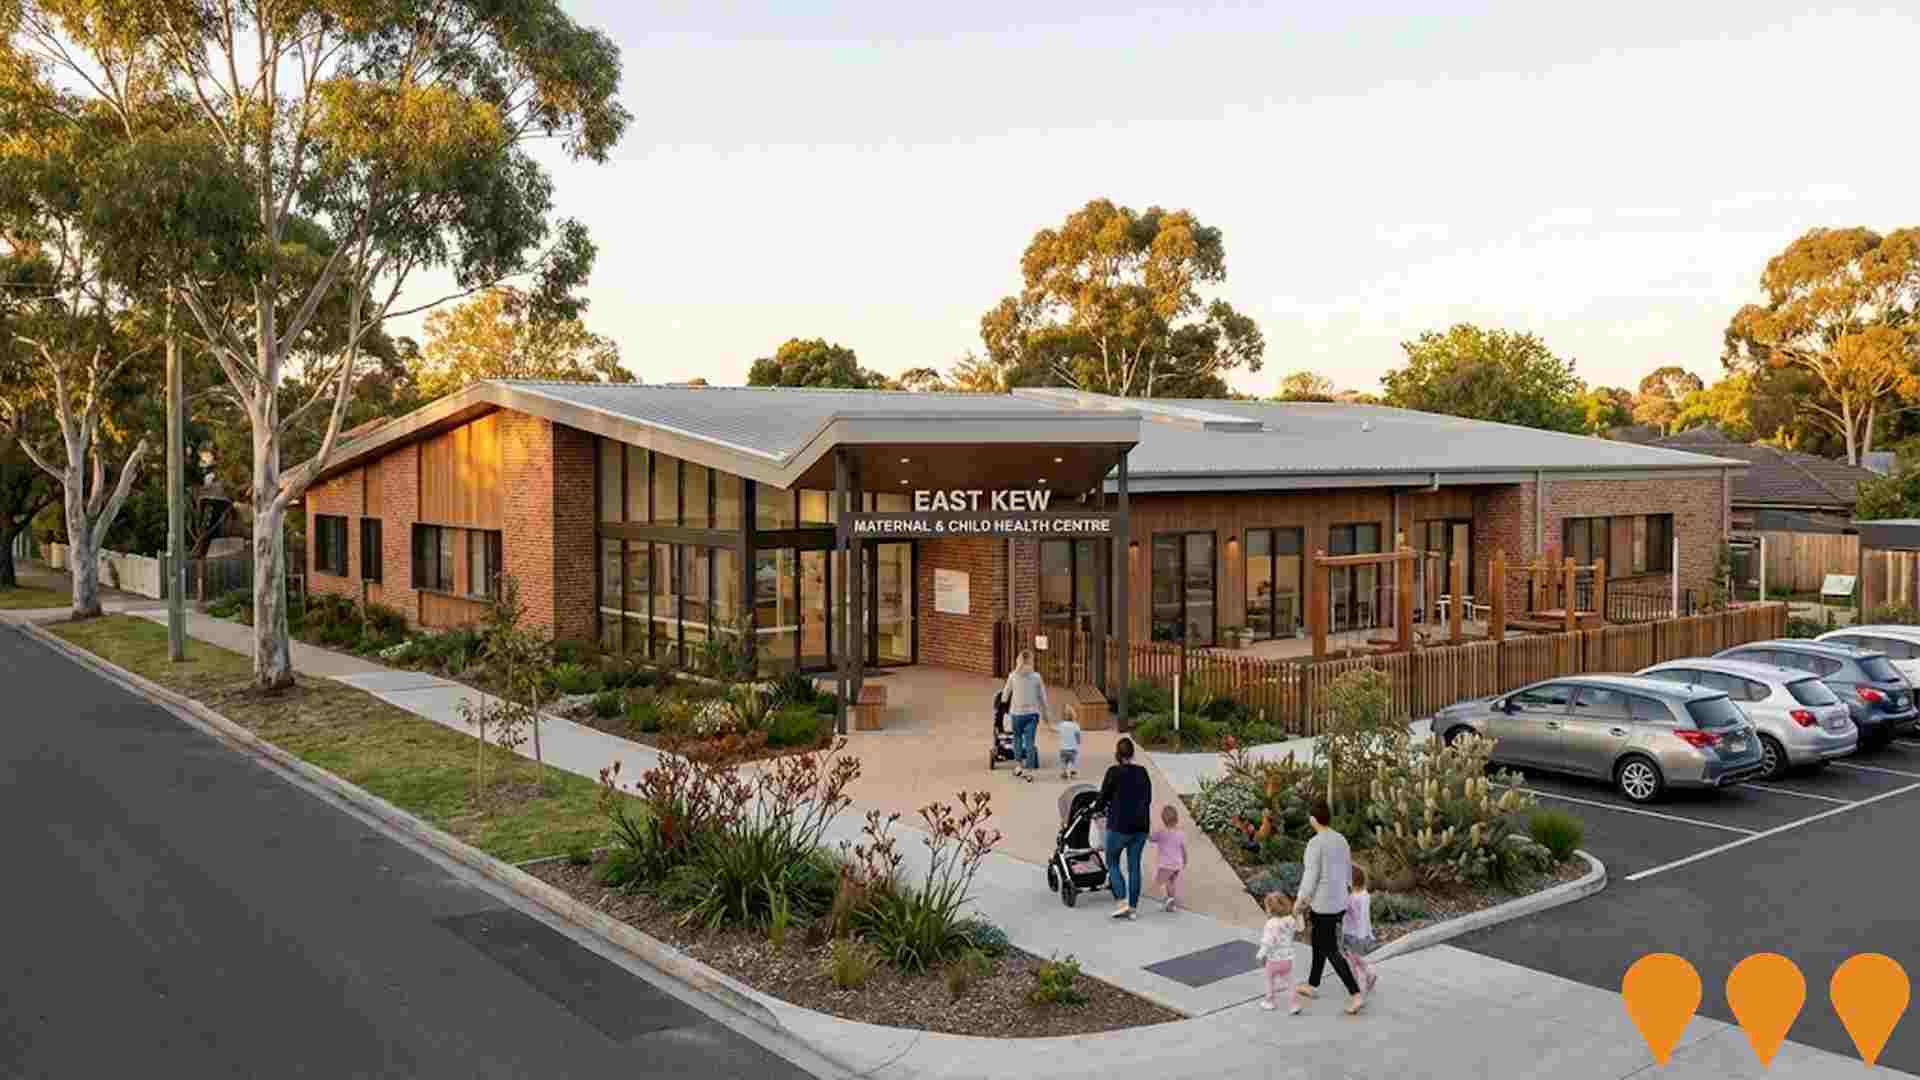
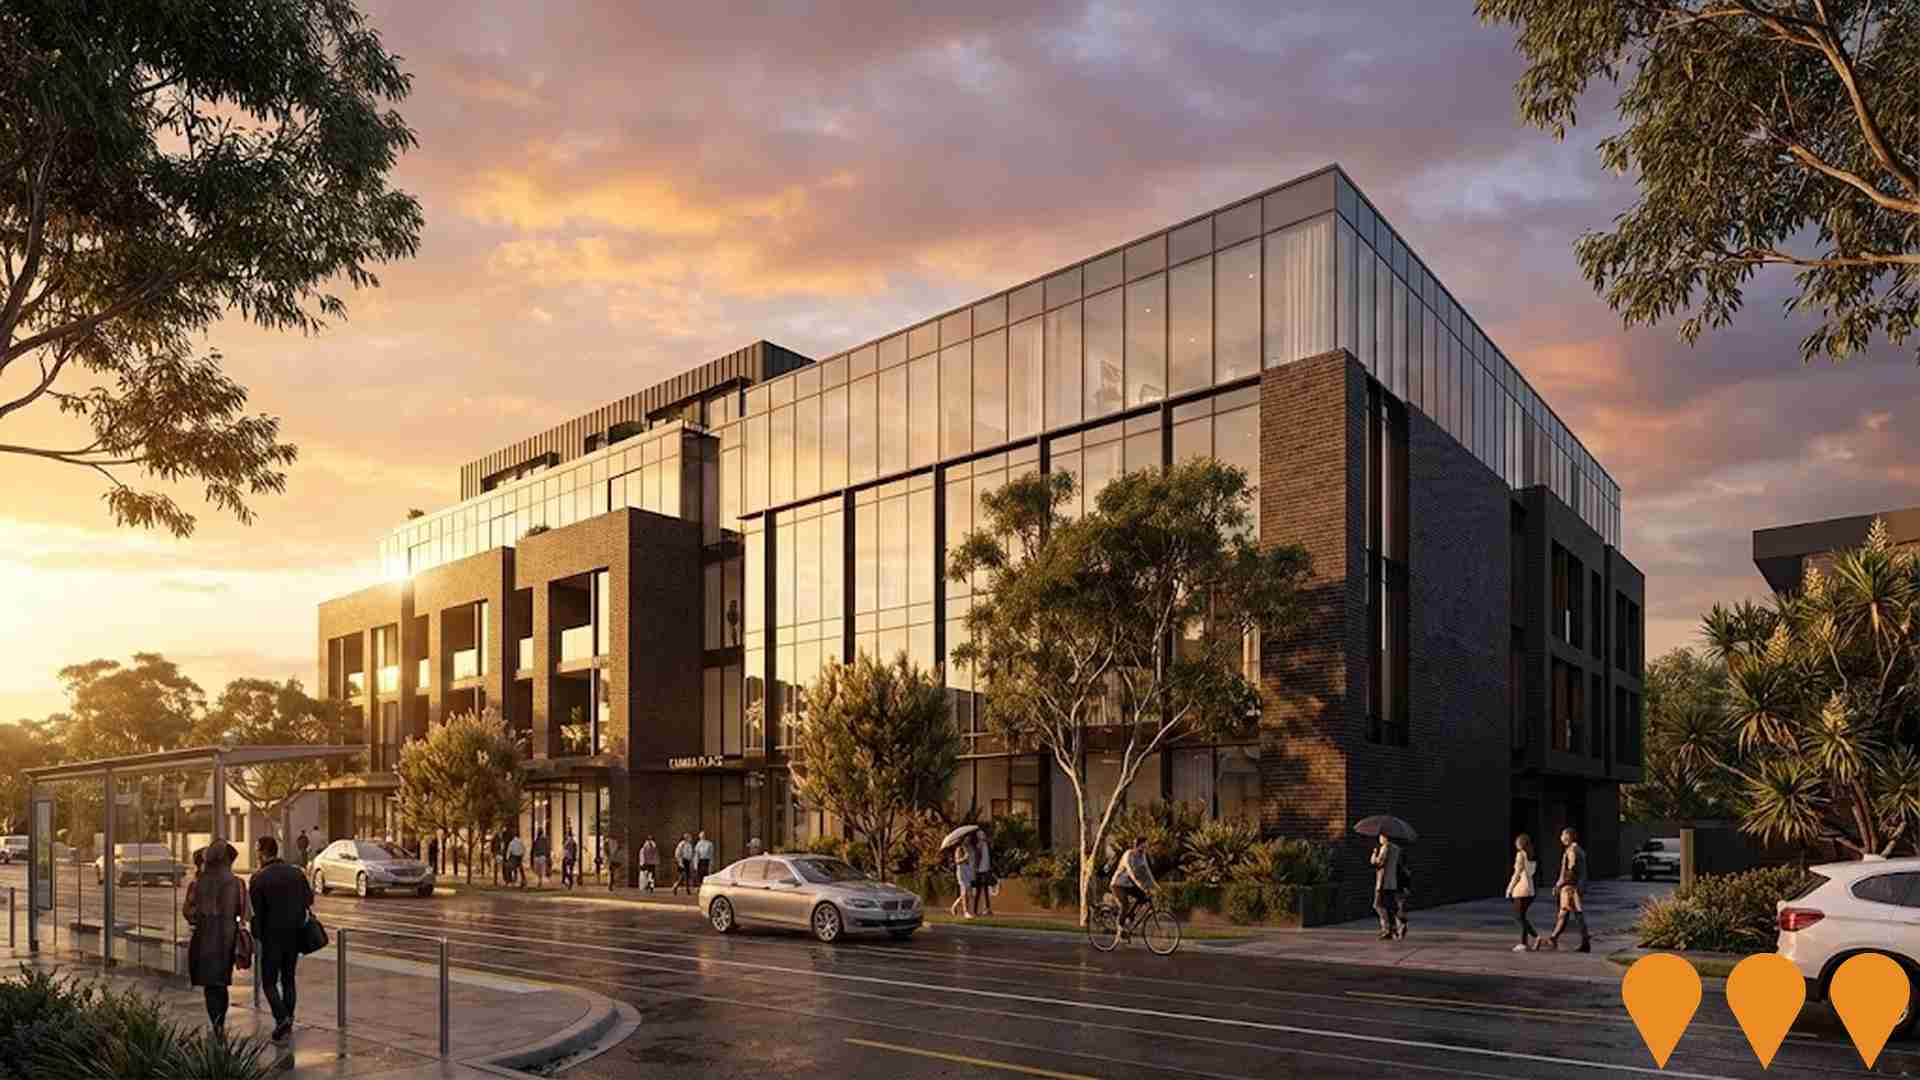
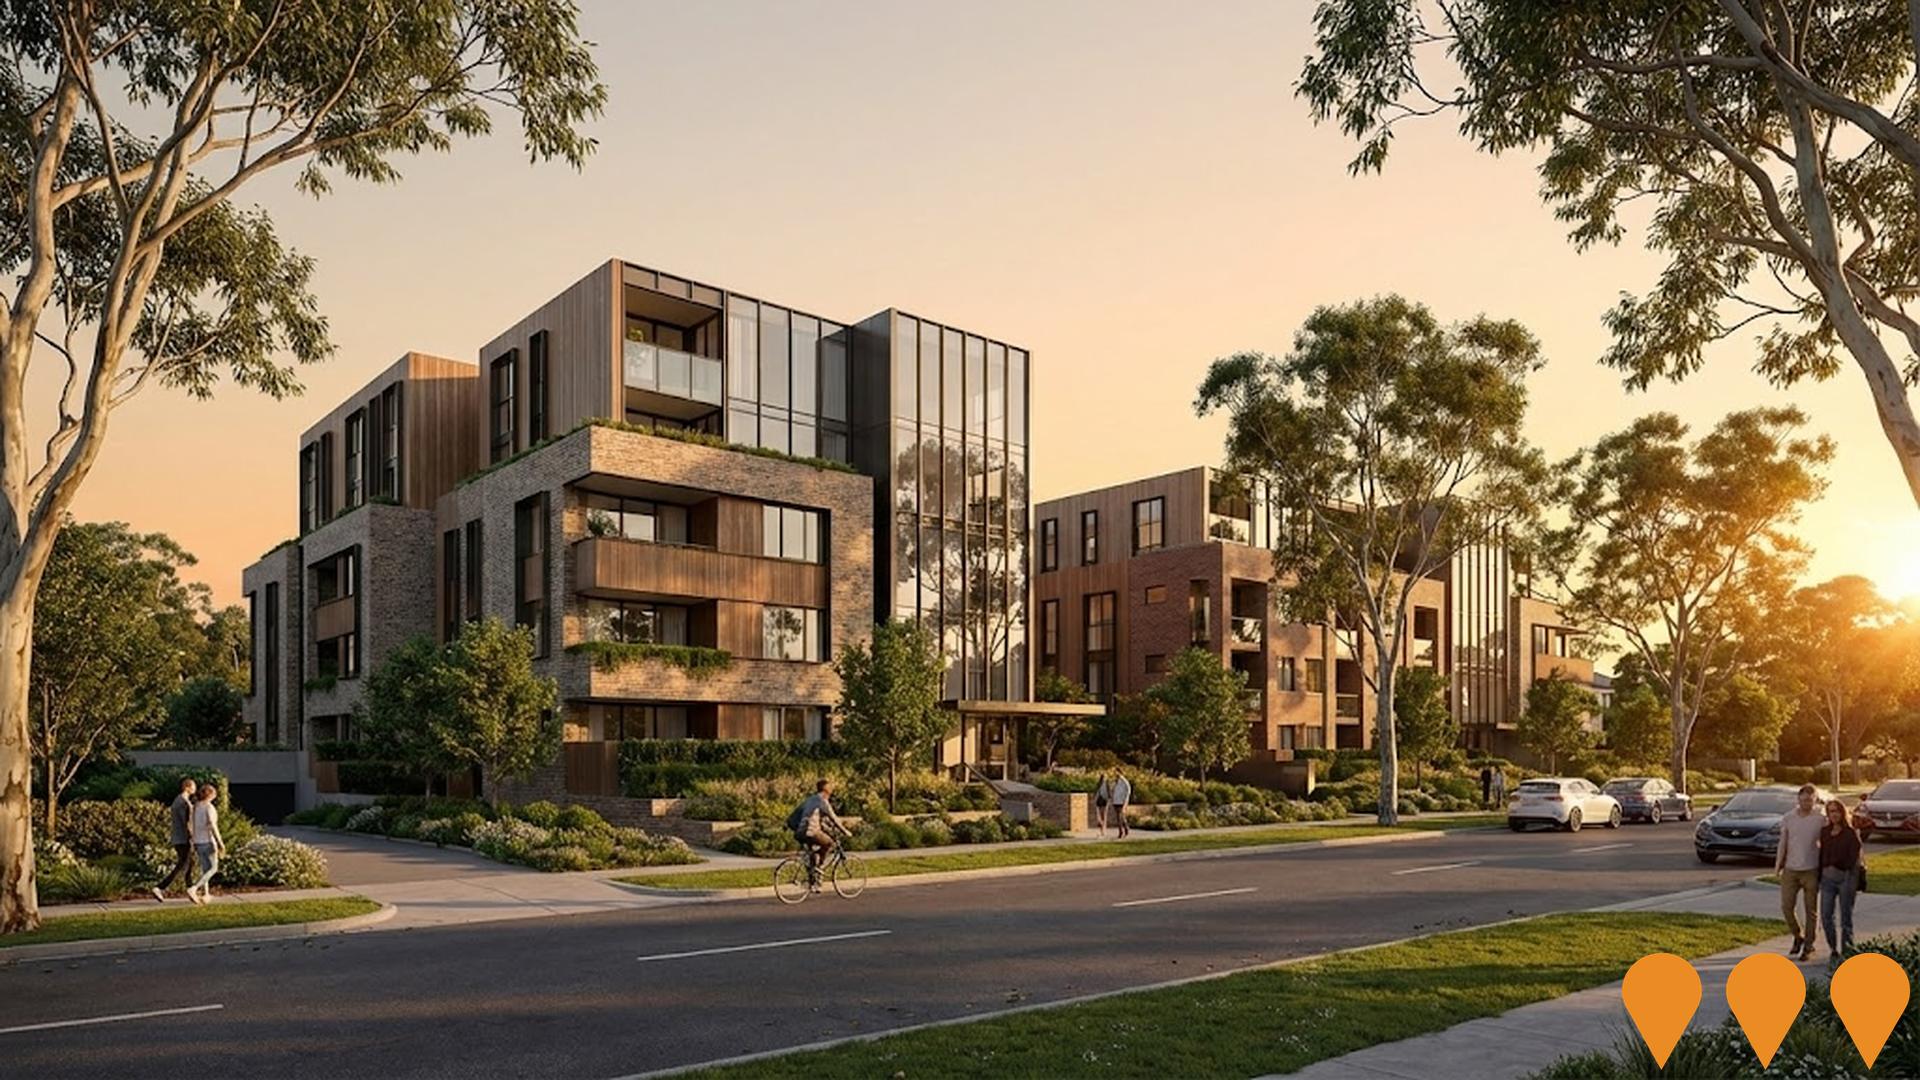
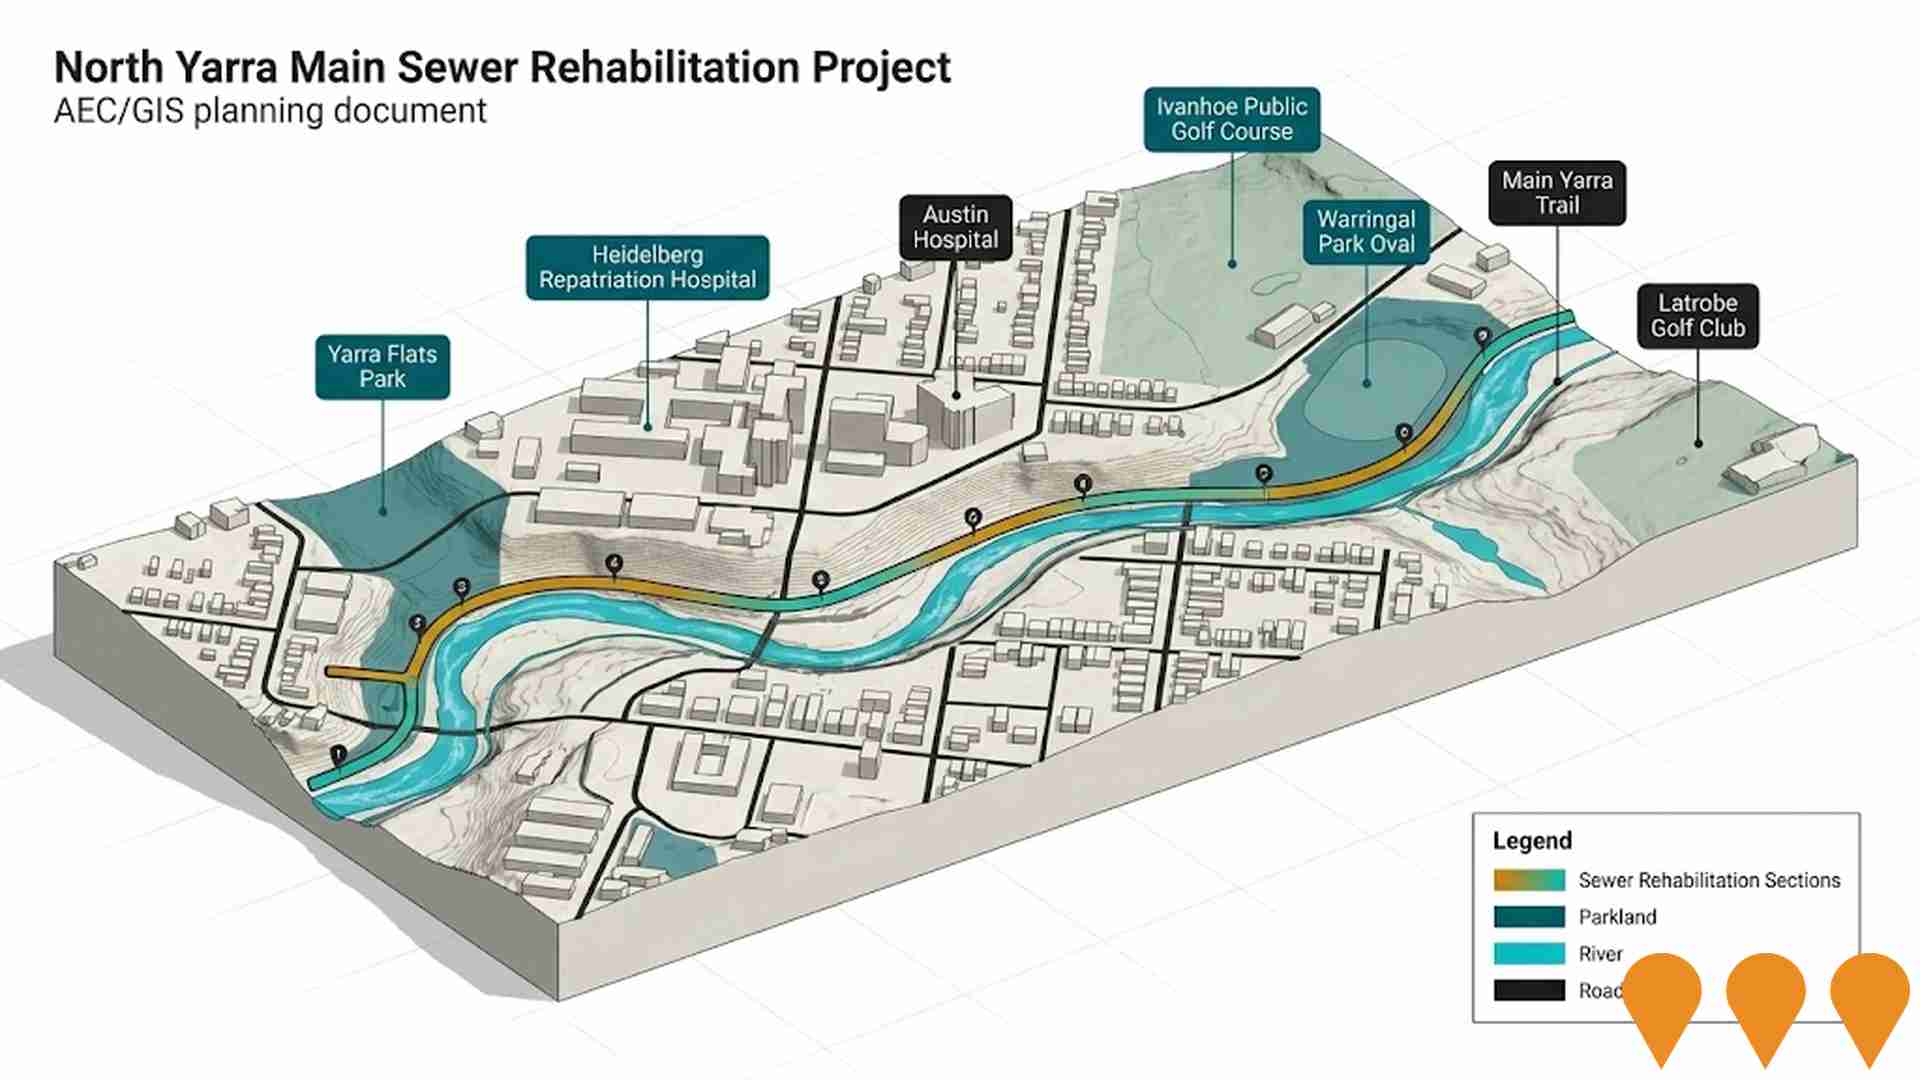
The performance of an area can significantly be influenced by changes to local infrastructure, major projects, and planning initiatives. AreaSearch has identified a total of 7 projects that are likely to impact the area. Notable projects include the Kew Recreation Centre Redevelopment, Harp Village Precinct Redevelopment, East Kew Maternal and Child Health Centre, and North East Link - Eastern Freeway Upgrade (Hoddle Street to Burke Road). The following list details those projects most relevant to the area.
Professional plan users can use the search below to filter and access additional projects.
INFRASTRUCTURE SEARCH
 Denotes AI-based impression for illustrative purposes only, not to be taken as definitive under any circumstances. Please follow links and conduct other investigations from the project's source for actual imagery. Developers and project owners wishing us to use original imagery please Contact Us and we will do so.
Frequently Asked Questions - Infrastructure
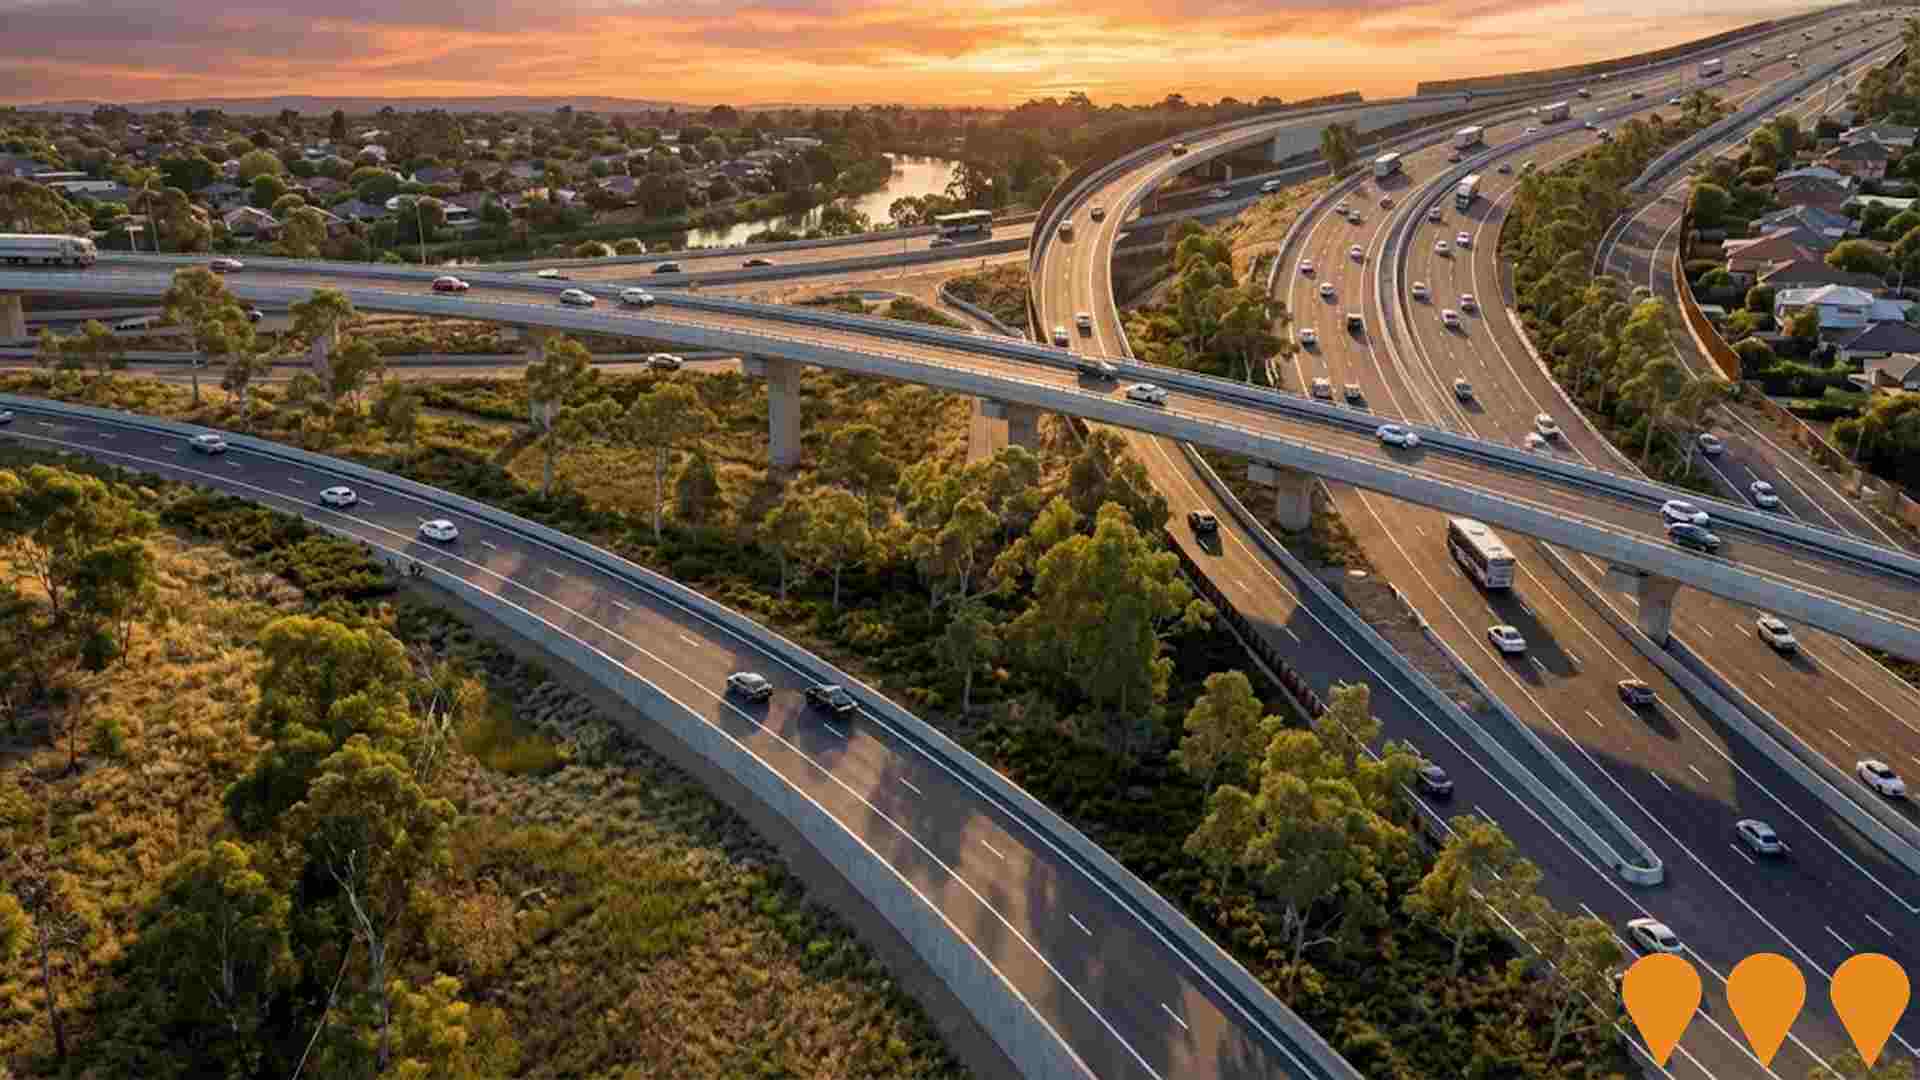
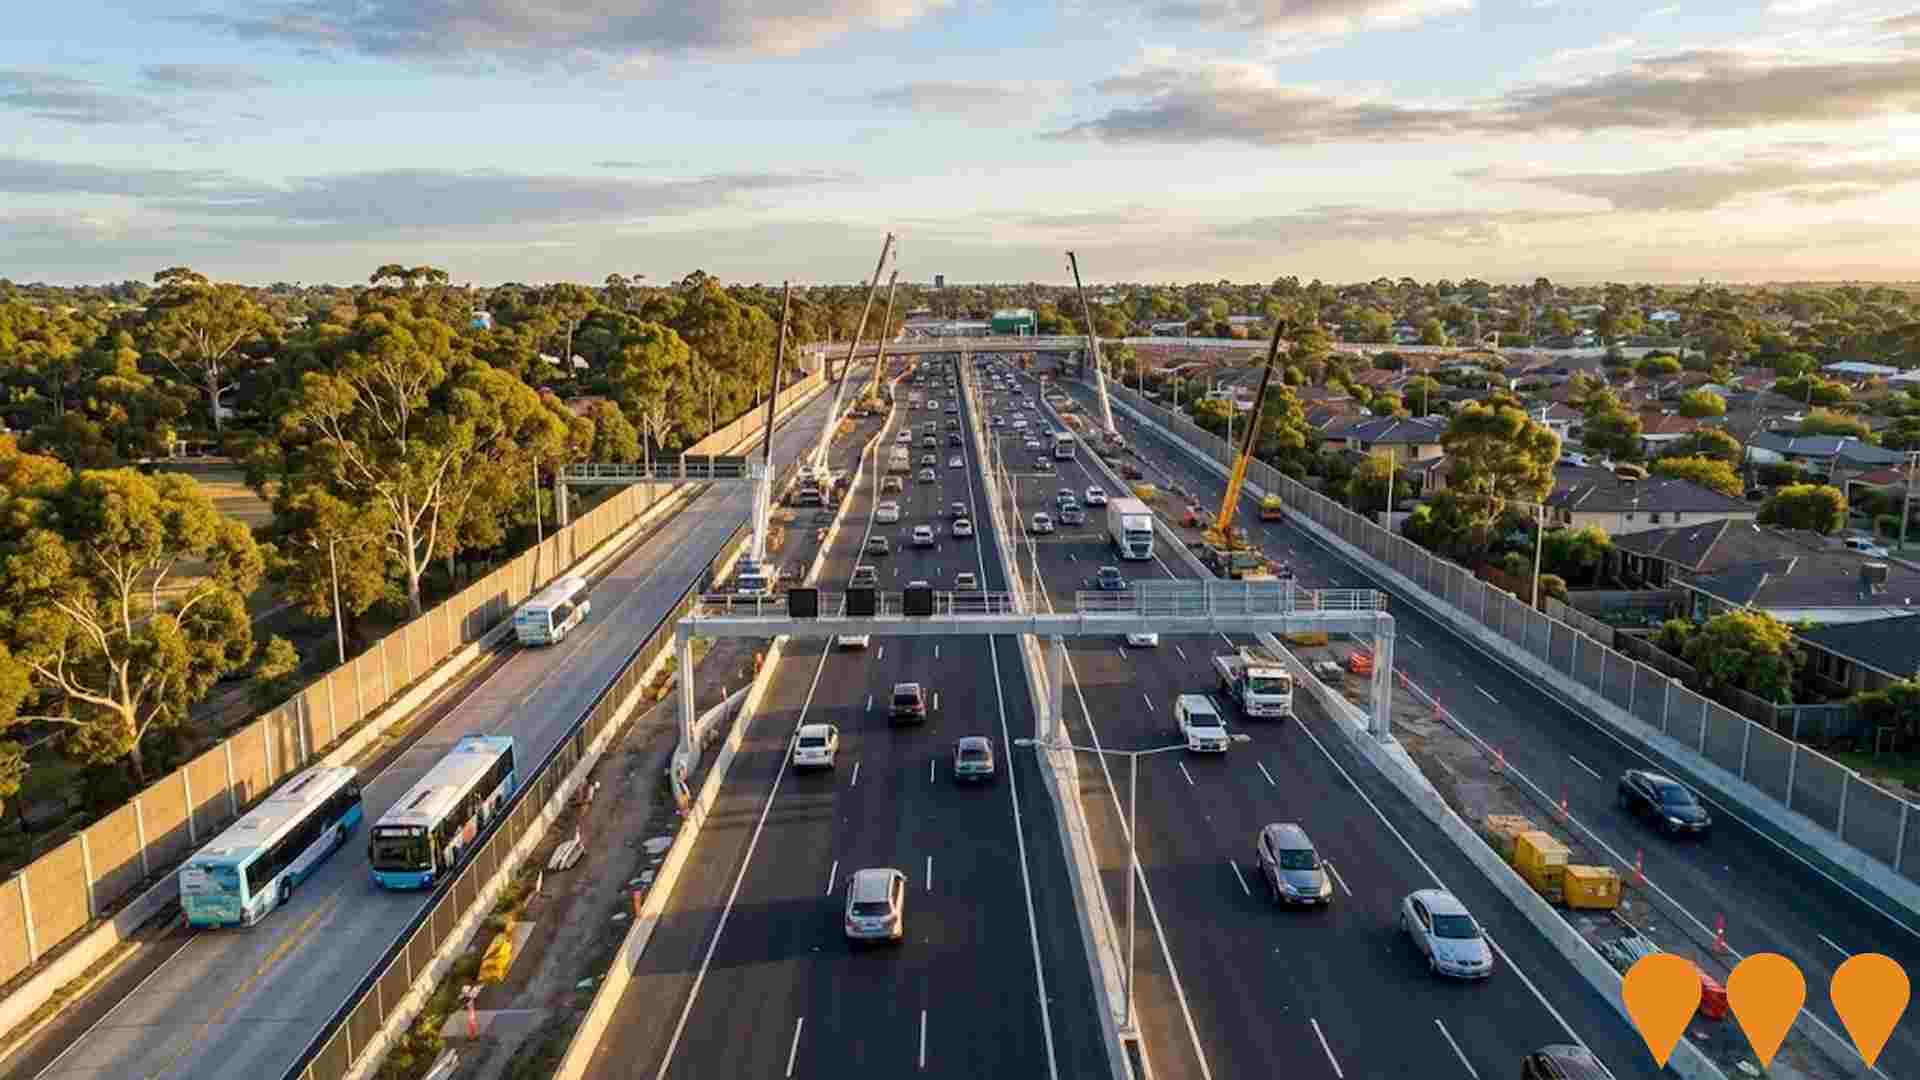
Eastern Freeway Upgrades: Hoddle Street to Burke Road
Upgrade of the Eastern Freeway from Hoddle Street to Burke Road as part of the North East Link Program. The project includes adding one new freeway lane in each direction between Chandler Highway and Burke Road, building the final 6km of the dedicated Eastern Busway, and constructing a new walking and cycling bridge over the Yarra River along with 4.7km of new/upgraded paths. Designs are currently being finalised after public exhibition of the Urban Design and Landscape Plan (UDLP).
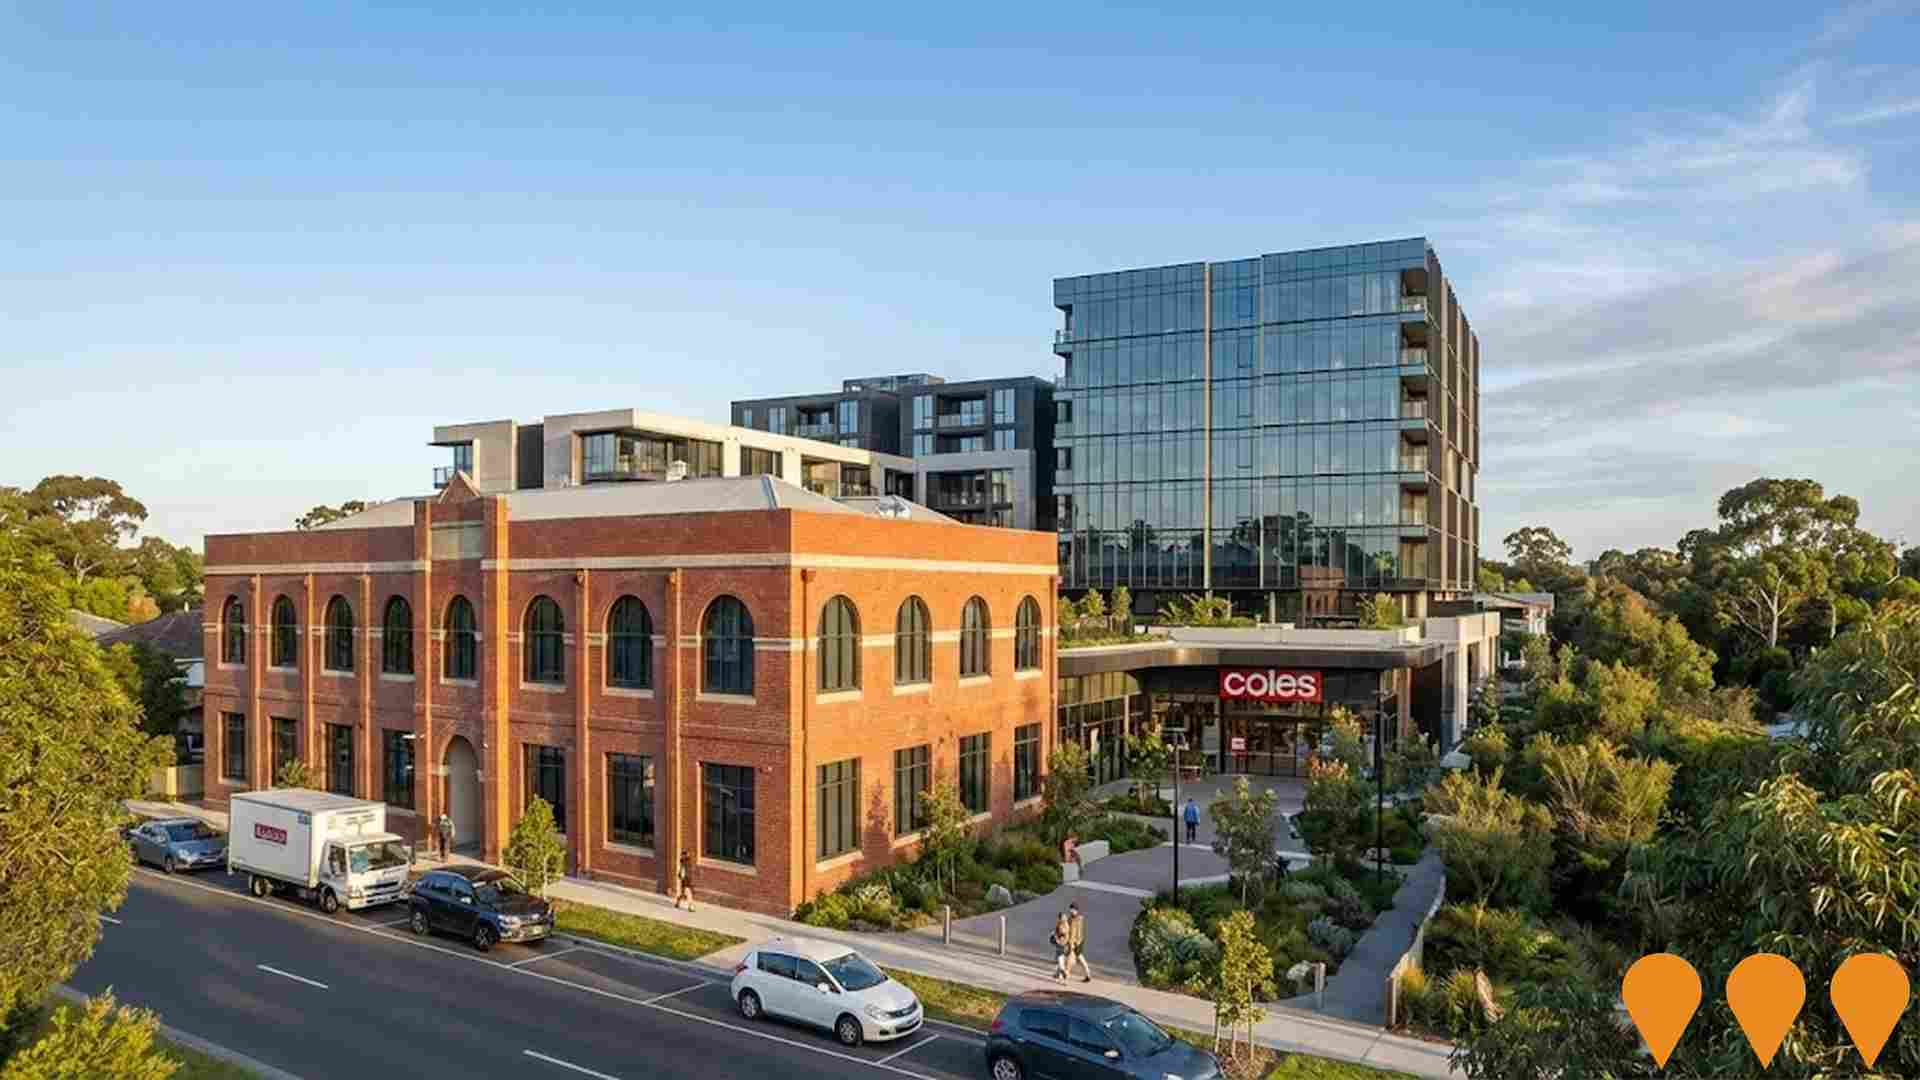
Alphington Village (Time & Place)
Major mixed-use development on former Amcor Paper Mill site featuring 632 build-to-rent apartments, 150 affordable housing units, 25,000sqm retail/commercial space including Coles supermarket, childcare centre, community facilities, and village square. Six towers ranging 5-14 levels with extensive amenities.
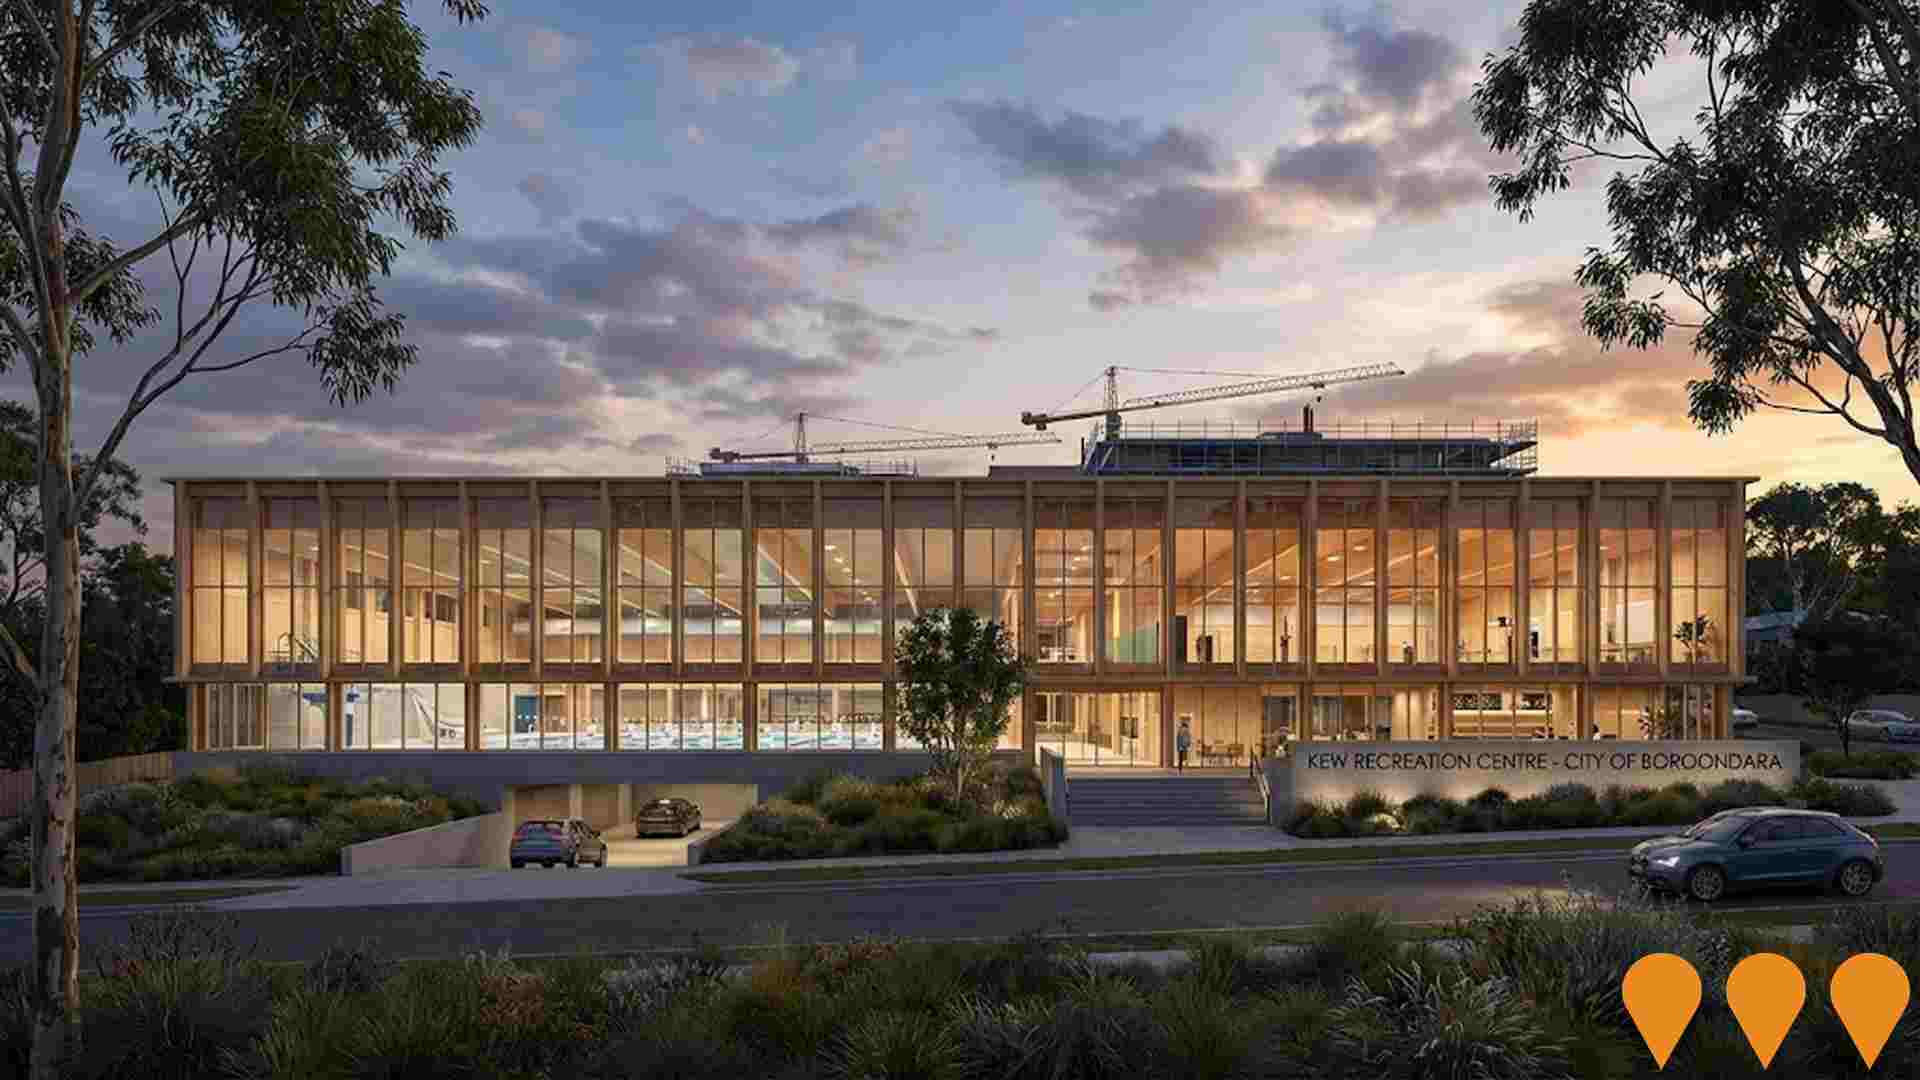
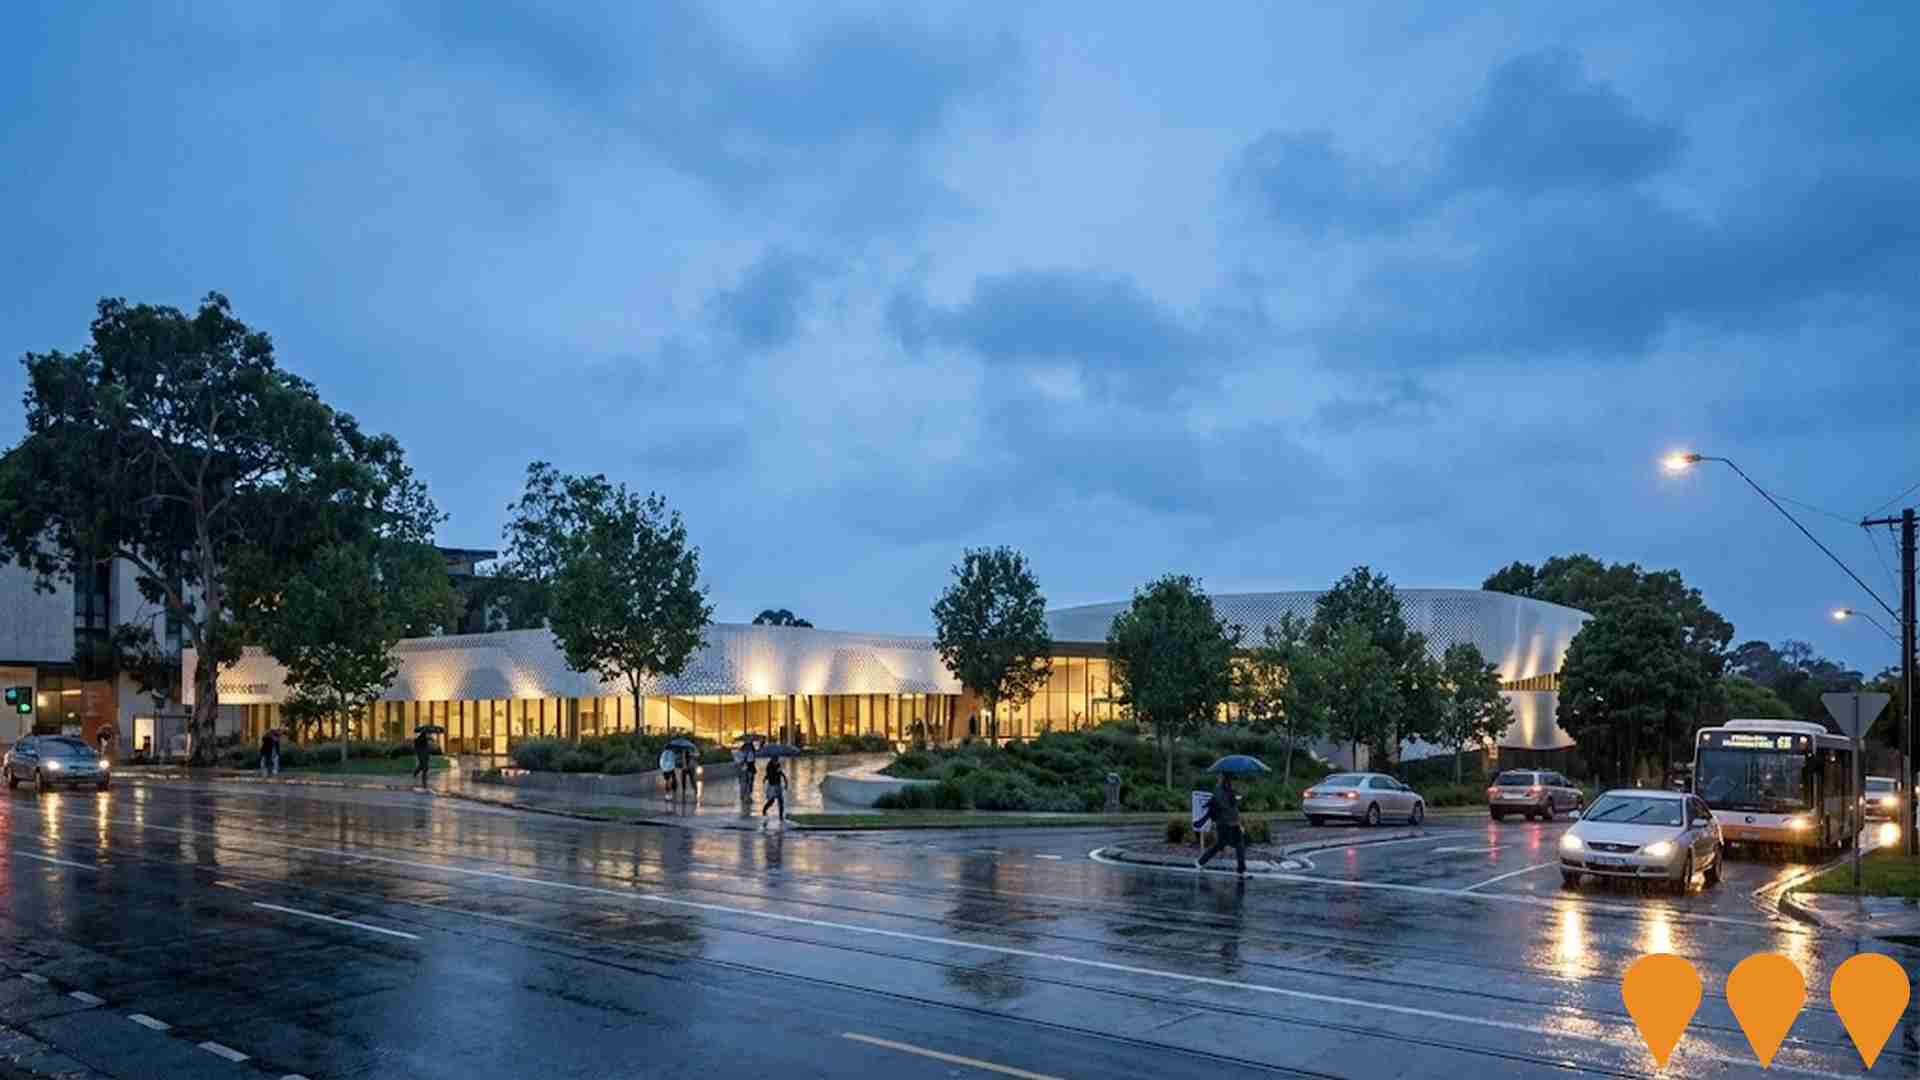
Kew Recreation Centre Redevelopment
Major redevelopment of the Kew Recreation Centre by the City of Boroondara. The new all-electric facility includes a 10-lane 25m pool, warm-water program pool, learn-to-swim pool, spa/sauna/steam room, aqua play area, two multi-purpose sports courts, gym, group fitness rooms, creche, cafe and underground parking. Construction recommenced in 2023 after a roof collapse incident in 2022 and is progressing well, with practical completion expected mid-2026.
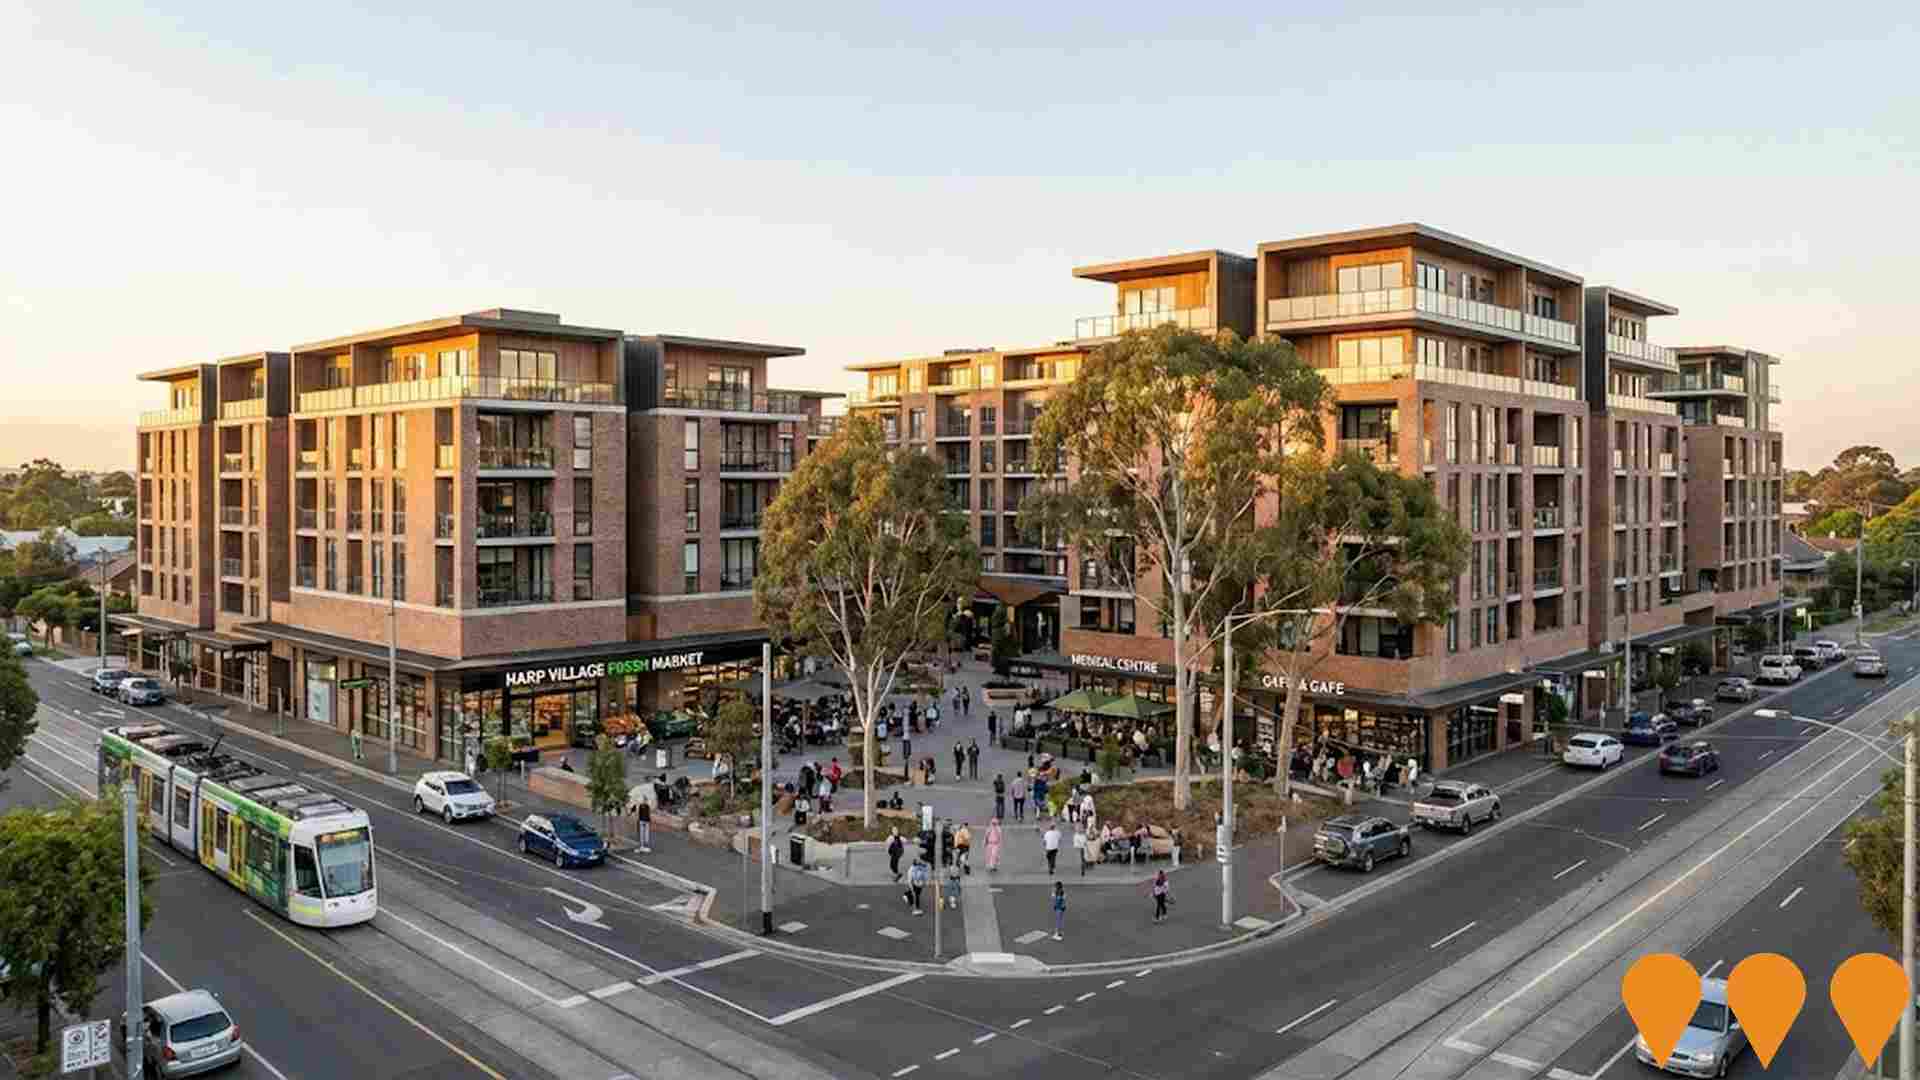
Harp Village Precinct Redevelopment
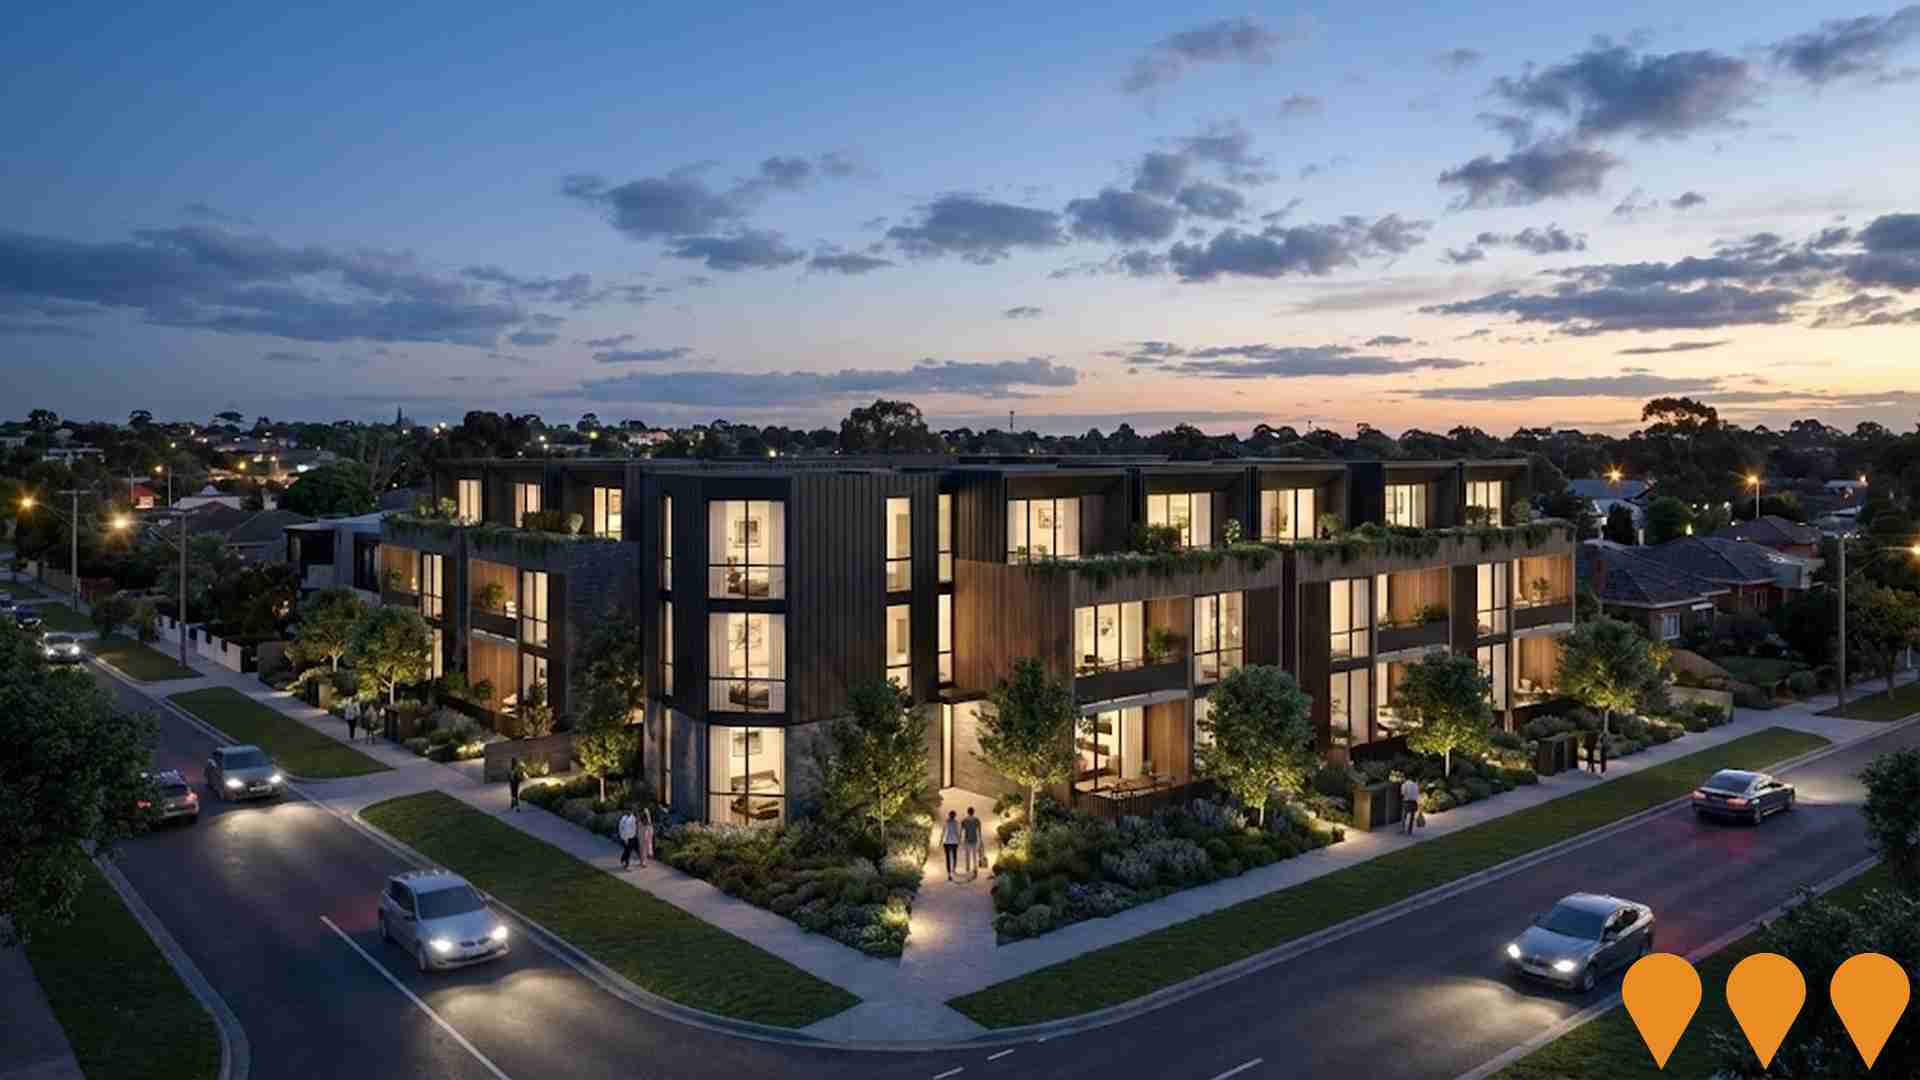
Large-scale mixed-use precinct redevelopment featuring a new town square, supermarket-anchored retail, childcare, medical centre, gym, commercial offices and approximately 400 apartments across multiple buildings.
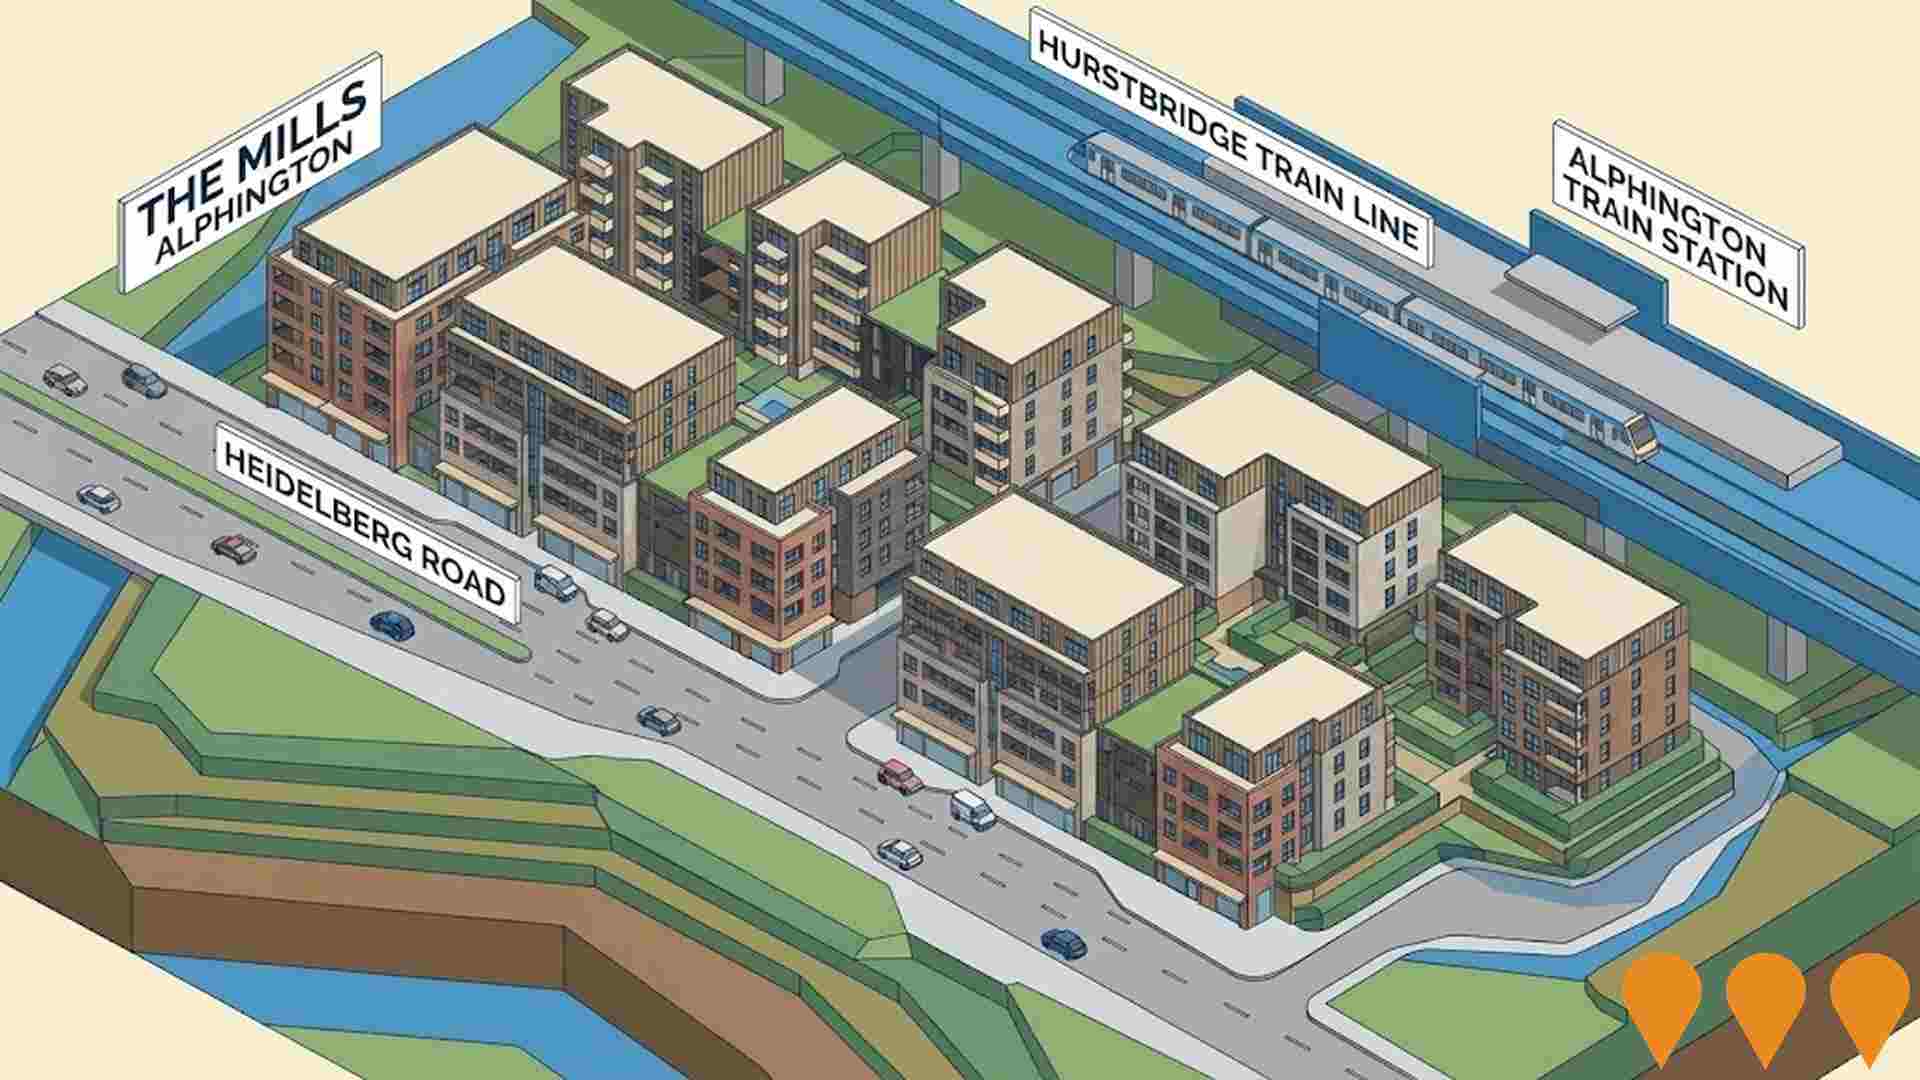
The Mills Alphington
A proposed mixed-use precinct on the former Alphington Paper Mill site featuring up to 1,000 apartments, retail spaces, and public open space, designed by Rothelowman and developed by Cedar Woods.
Kew Recreation Centre Redevelopment
A $36.8 million redevelopment of the Kew Recreation Centre including a new 8-lane 25m indoor pool, learn-to-swim pool, warm water program pool, spa/sauna/steam room, expanded gym, group fitness studios and upgraded change rooms.
North East Link - Eastern Freeway Upgrade (Hoddle Street to Burke Road)
Upgrade of approximately 6 km of the Eastern Freeway between Hoddle Street and Burke Road to add new lanes, managed motorway technology, connections to the Eastern Busway and improved walking and cycling links. Contract for this section has been awarded to the Momentum consortium; major works are scheduled to begin in late 2025, with the broader North East Link program targeting opening in 2028.
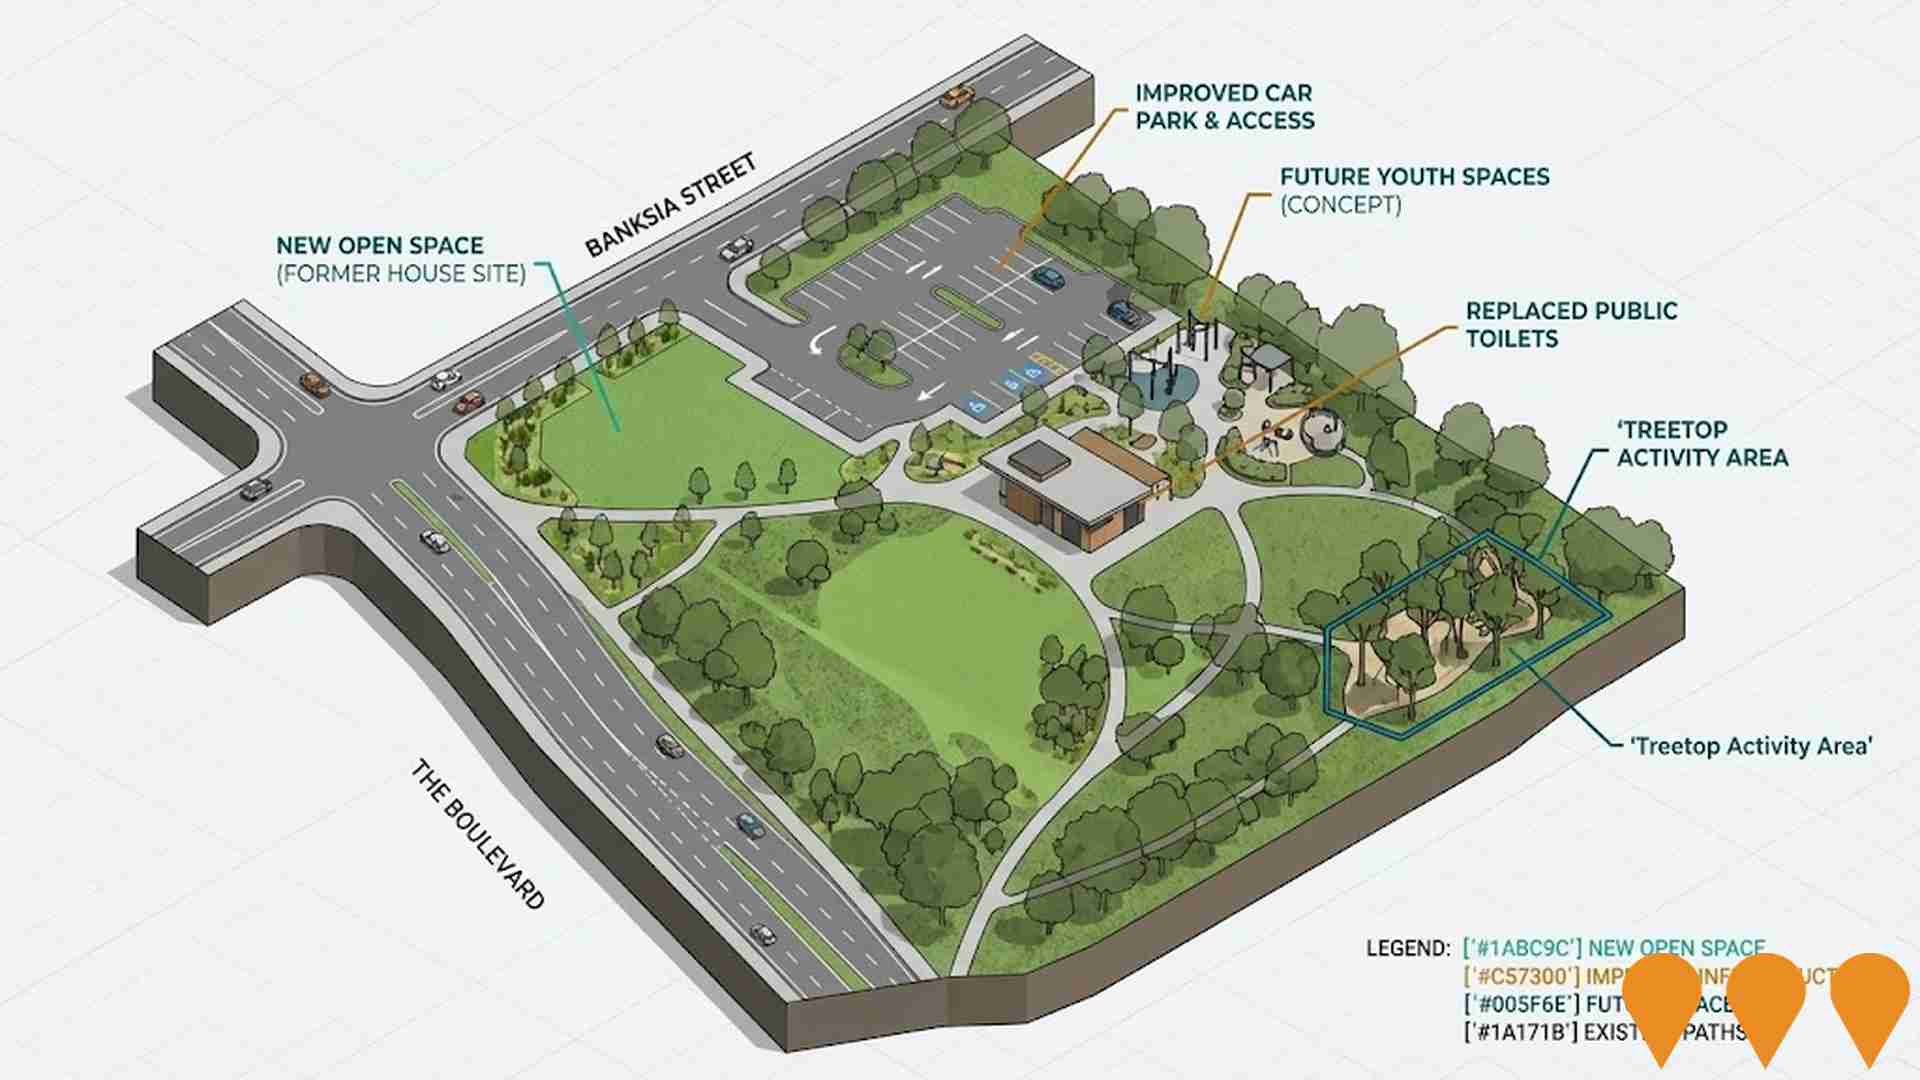
Ivanhoe Park Upgrades
Banyule City Council is progressing staged upgrades to Ivanhoe Park as part of the Ivanhoe Sports Precinct Plan and the Banyule Youth Spaces Implementation Plan. Near-term works include demolishing the former caretaker house and returning the area to open space, improving car park access and accessibility, developing concepts for new outdoor youth spaces, and upgrading general amenity. Over the next five years Council plans to replace the existing public toilets and, subject to Australian Government funding, convert tennis courts to netball courts and upgrade the Croquet Club.
Employment
Employment conditions in Kew East demonstrate strong performance, ranking among the top 35% of areas assessed nationally
Kew East has a highly educated workforce with strong representation in professional services. Its unemployment rate was 2.8% in the past year, lower than Greater Melbourne's 4.7%.
Employment growth was estimated at 3.0% over the same period. As of September 2025, 3,936 residents were employed, with an unemployment rate of 1.9% below Greater Melbourne's rate. Workforce participation was 66.1%, compared to Greater Melbourne's 64.1%. Key industries for employment among residents are health care & social assistance, professional & technical, and education & training.
The area specializes in professional & technical jobs, with an employment share 1.5 times the regional level. Manufacturing representation is lower at 3.8% versus the regional average of 7.2%. Many residents commute elsewhere for work based on Census data analysis. Between September 2024 and September 2025, employment levels increased by 3.0%, labour force grew by 2.6%, reducing the unemployment rate by 0.3 percentage points. In comparison, Greater Melbourne recorded similar employment growth but a slight increase in unemployment. State-level data to 25-Nov-25 shows Victoria's employment grew by 1.13% year-on-year, with an unemployment rate of 4.7%, slightly higher than the national rate of 4.3%. National employment forecasts from May-25 project a 6.6% increase over five years and 13.7% over ten years. Applying these projections to Kew East's employment mix suggests local employment should increase by 7.4% over five years and 14.9% over ten years, though this is a simplified extrapolation for illustrative purposes only.
Frequently Asked Questions - Employment
Income
Income metrics indicate excellent economic conditions, with the area achieving higher performance than 75% of national locations assessed by AreaSearch
The median taxpayer income in Kew East SA2 was $61,086 and the average was $112,026 according to postcode level ATO data aggregated by AreaSearch for the financial year 2022. This places it in the top percentile nationally compared to Greater Melbourne's median income of $54,892 and average income of $73,761. By September 2025, estimated incomes would be approximately $68,514 (median) and $125,648 (average), based on a 12.16% growth in wages since the financial year 2022. In Kew East, household, family, and personal incomes ranked between the 82nd and 90th percentiles nationally according to the 2021 Census figures. The income distribution showed that 32.1% of individuals earned $4000 or more, differing from the broader area where earnings between $1500 and $2999 dominated at 32.8%. Economic strength was evident with 43.2% of households earning high weekly incomes exceeding $3000, supporting elevated consumer spending. Housing accounted for 14.0% of income, while residents ranked in the 90th percentile for disposable income. The area's SEIFA income ranking placed it in the 10th decile.
Frequently Asked Questions - Income
Housing
Kew East displays a diverse mix of dwelling types, with above-average rates of outright home ownership
Dwelling structure in Kew East, as evaluated at the latest Census, comprised 65.9% houses and 34.1% other dwellings (semi-detached, apartments, 'other' dwellings). This compares to Melbourne metro's 55.5% houses and 44.5% other dwellings. Home ownership in Kew East was at 41.8%, with the remainder of dwellings either mortgaged (34.1%) or rented (24.1%). The median monthly mortgage repayment in the area was $3,000, aligning with Melbourne metro's average. The median weekly rent figure was recorded at $466, compared to Melbourne metro's $3,000 and $451 respectively. Nationally, Kew East's mortgage repayments were significantly higher than the Australian average of $1,863, while rents were substantially above the national figure of $375.
Frequently Asked Questions - Housing
Household Composition
Kew East features high concentrations of group households, with a higher-than-average median household size
Family households constitute 75.9 percent of all households, consisting of 40.1 percent couples with children, 23.5 percent couples without children, and 11.1 percent single parent families. Non-family households account for the remaining 24.1 percent, with lone person households at 19.7 percent and group households comprising 4.5 percent of the total. The median household size is 2.7 people, which is larger than the Greater Melbourne average of 2.5.
Frequently Asked Questions - Households
Local Schools & Education
Educational achievement in Kew East places it within the top 10% nationally, reflecting strong academic performance and high qualification levels across the community
Educational attainment in Kew East is notable, with 53.4% of residents aged 15+ holding university qualifications, compared to national (30.4%) and Victorian state (33.4%) averages. Bachelor degrees are the most common at 33.2%, followed by postgraduate qualifications (14.9%) and graduate diplomas (5.3%). Vocational pathways account for 18.0% of qualifications, with advanced diplomas at 9.1% and certificates at 8.9%. Educational participation is high, with 32.2% of residents currently enrolled in formal education.
This includes 9.5% in secondary education, 9.4% in primary education, and 8.5% pursuing tertiary education.
Frequently Asked Questions - Education
Schools Detail
Nearby Services & Amenities
Transport
Transport servicing is high compared to other areas nationally based on assessment of service frequency, route connectivity and accessibility
Transport analysis shows 41 active stops operating in Kew East, serving a mix of lightrail and bus services. These stops are served by 13 individual routes, collectively providing 3879 weekly passenger trips. Transport accessibility is rated excellent, with residents typically located 182 meters from the nearest stop.
Service frequency averages 554 trips per day across all routes, equating to approximately 94 weekly trips per stop.
Frequently Asked Questions - Transport
Transport Stops Detail
Health
Kew East's residents boast exceedingly positive health performance metrics with very low prevalence of common health conditions across all age groups
Health outcomes data shows excellent results in Kew East, with very low prevalence of common health conditions across all age groups. Approximately 76% of the total population (5,261 people) has private health cover, significantly higher than the national average of 55.3%.
The most prevalent medical conditions are asthma and mental health issues, affecting 6.9% and 6.2% of residents respectively. A majority, 74.5%, report being completely free from medical ailments, slightly higher than Greater Melbourne's 73.8%. Kew East has an elderly population, with 18.7% (1,290 people) aged 65 and over. Health outcomes among seniors are notably strong, closely mirroring the general population's health profile.
Frequently Asked Questions - Health
Cultural Diversity
The level of cultural diversity witnessed in Kew East was found to be above average when compared nationally for a number of language and cultural background related metrics
Kew East's population showed high cultural diversity, with 28.7% born overseas and 27.8% speaking a language other than English at home. Christianity was the predominant religion, making up 49.9%. Judaism, however, was more prevalent in Kew East at 0.9%, compared to Greater Melbourne's 0.9%.
The top three ancestry groups were English (20.2%), Australian (17.9%), and Chinese (9.8%). Notably, Greeks were overrepresented at 5.6% versus the regional average of 3.4%, Hungarians at 0.5% versus 0.3%, and Italians at 8.2% versus 4.8%.
Frequently Asked Questions - Diversity
Age
Kew East's population is slightly older than the national pattern
Kew East's median age is 41 years, which is significantly higher than Greater Melbourne's average of 37 years and slightly older than Australia's median of 38 years. Compared to Greater Melbourne, Kew East has a notably higher proportion of residents aged 55-64 (13.3% vs. the local average) and a lower proportion of residents aged 25-34 (10.9%). According to the 2021 Census, the population aged 15-24 increased from 13.8% to 15.3%, while the 5-14 age group declined from 13.4% to 12.1%. The 0-4 age group also decreased from 4.6% to 3.5%. By 2041, demographic modeling projects significant changes in Kew East's age profile. The 85+ cohort is expected to grow by 67%, adding 143 residents to reach 356. Residents aged 65 and older are anticipated to represent 77% of the population growth. Conversely, population declines are projected for the 0-4 and 35-44 age cohorts.
