Chart Color Schemes
This analysis uses ABS Statistical Areas Level 2 (SA2) boundaries, which can materially differ from Suburbs and Localities (SAL) even when sharing similar names.
SA2 boundaries are defined by the Australian Bureau of Statistics and are designed to represent communities for statistical reporting (e.g., census and ERP).
Suburbs and Localities (SAL) represent commonly-used suburb/locality names (postal-style areas) and may use different geographic boundaries. For comprehensive analysis, consider reviewing both boundary types if available.
est. as @ -- *
ABS ERP | -- people | --
2021 Census | -- people
Sales Activity
Curious about local property values? Filter the chart to assess the volume and appreciation (including resales) trends and regional comparisons, or scroll to the map below view this information at an individual property level.
Find a Recent Sale
Sales Detail
Population
An assessment of population growth drivers in Hendra reveals an overall ranking slightly below national averages considering recent, and medium term trends
Hendra's population is around 5,180 as of November 2025. This reflects an increase from 4,949 people reported in the 2021 Census, representing a growth of 231 people (4.7%). The change is inferred from ABS data showing an estimated resident population of 5,178 in June 2024 and an additional 21 validated new addresses since the Census date. This results in a population density ratio of 1,925 persons per square kilometer, higher than the average across national locations assessed by AreaSearch. Natural growth contributed approximately 57.1% of overall population gains during recent periods.
AreaSearch adopts ABS/Geoscience Australia projections for each SA2 area, released in 2024 with a base year of 2022. For areas not covered or years post-2032, Queensland State Government's SA2 area projections are used, based on 2021 data and released in 2023. However, these state projections do not provide age category splits, so AreaSearch applies proportional growth weightings in line with ABS Greater Capital Region projections for each age cohort, released in 2023 using 2022 data. Looking ahead, demographic trends indicate a projected decline in overall population by 137 persons to 2041. However, specific age cohorts are expected to grow, notably the 75 to 84 age group with an anticipated increase of 142 people.
Frequently Asked Questions - Population
Development
Residential development activity is lower than average in Hendra according to AreaSearch's national comparison of local real estate markets
Hendra has averaged approximately 19 new dwelling approvals annually over the past five financial years, totalling 98 homes. As of FY26, 9 approvals have been recorded. On average, 1.9 people moved to the area per dwelling built between FY21 and FY25, indicating balanced supply and demand with stable market conditions. However, this figure has increased to 4.8 people per dwelling over the past two financial years, suggesting growing popularity and potential supply constraints in the area. New properties are constructed at an average expected construction cost value of $626,000, reflecting developers' focus on the premium market with high-end developments.
This year, Hendra has recorded $24.9 million in commercial development approvals, demonstrating moderate levels of commercial development compared to Greater Brisbane. While Hendra has around half the rate of new dwelling approvals per person and ranks among the 47th percentile nationally for buyer options, it experiences stronger demand for established homes due to limited new construction. All new constructions in Hendra have been detached dwellings, maintaining its suburban identity with a concentration of family homes suited to buyers seeking space.
Interestingly, developers are building more traditional houses than the current mix suggests at Census, indicating continued strong demand for family homes despite density pressures. With approximately 345 people per approval, Hendra indicates a mature market that may experience less housing pressure in the future given stable or declining population forecasts, creating favourable conditions for buyers.
Frequently Asked Questions - Development
Infrastructure
Hendra has very high levels of nearby infrastructure activity, ranking in the top 20% nationally
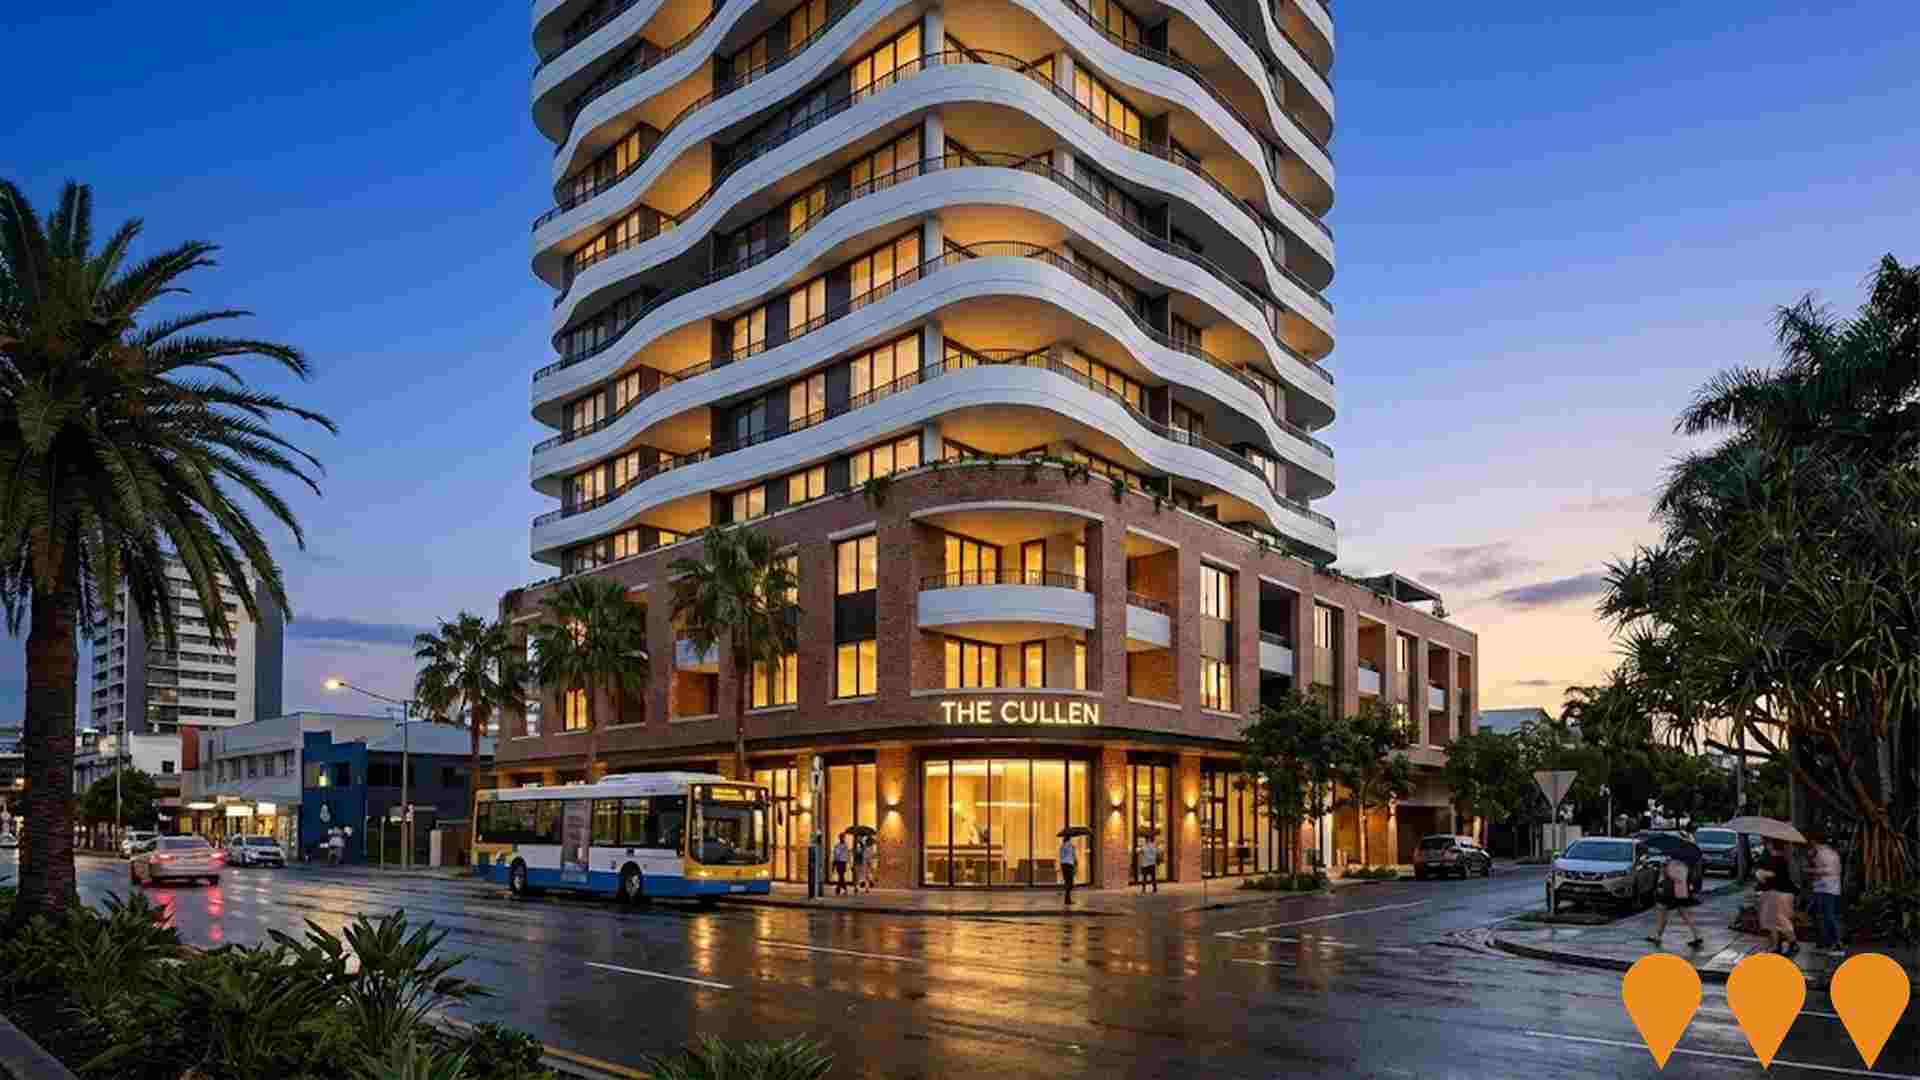
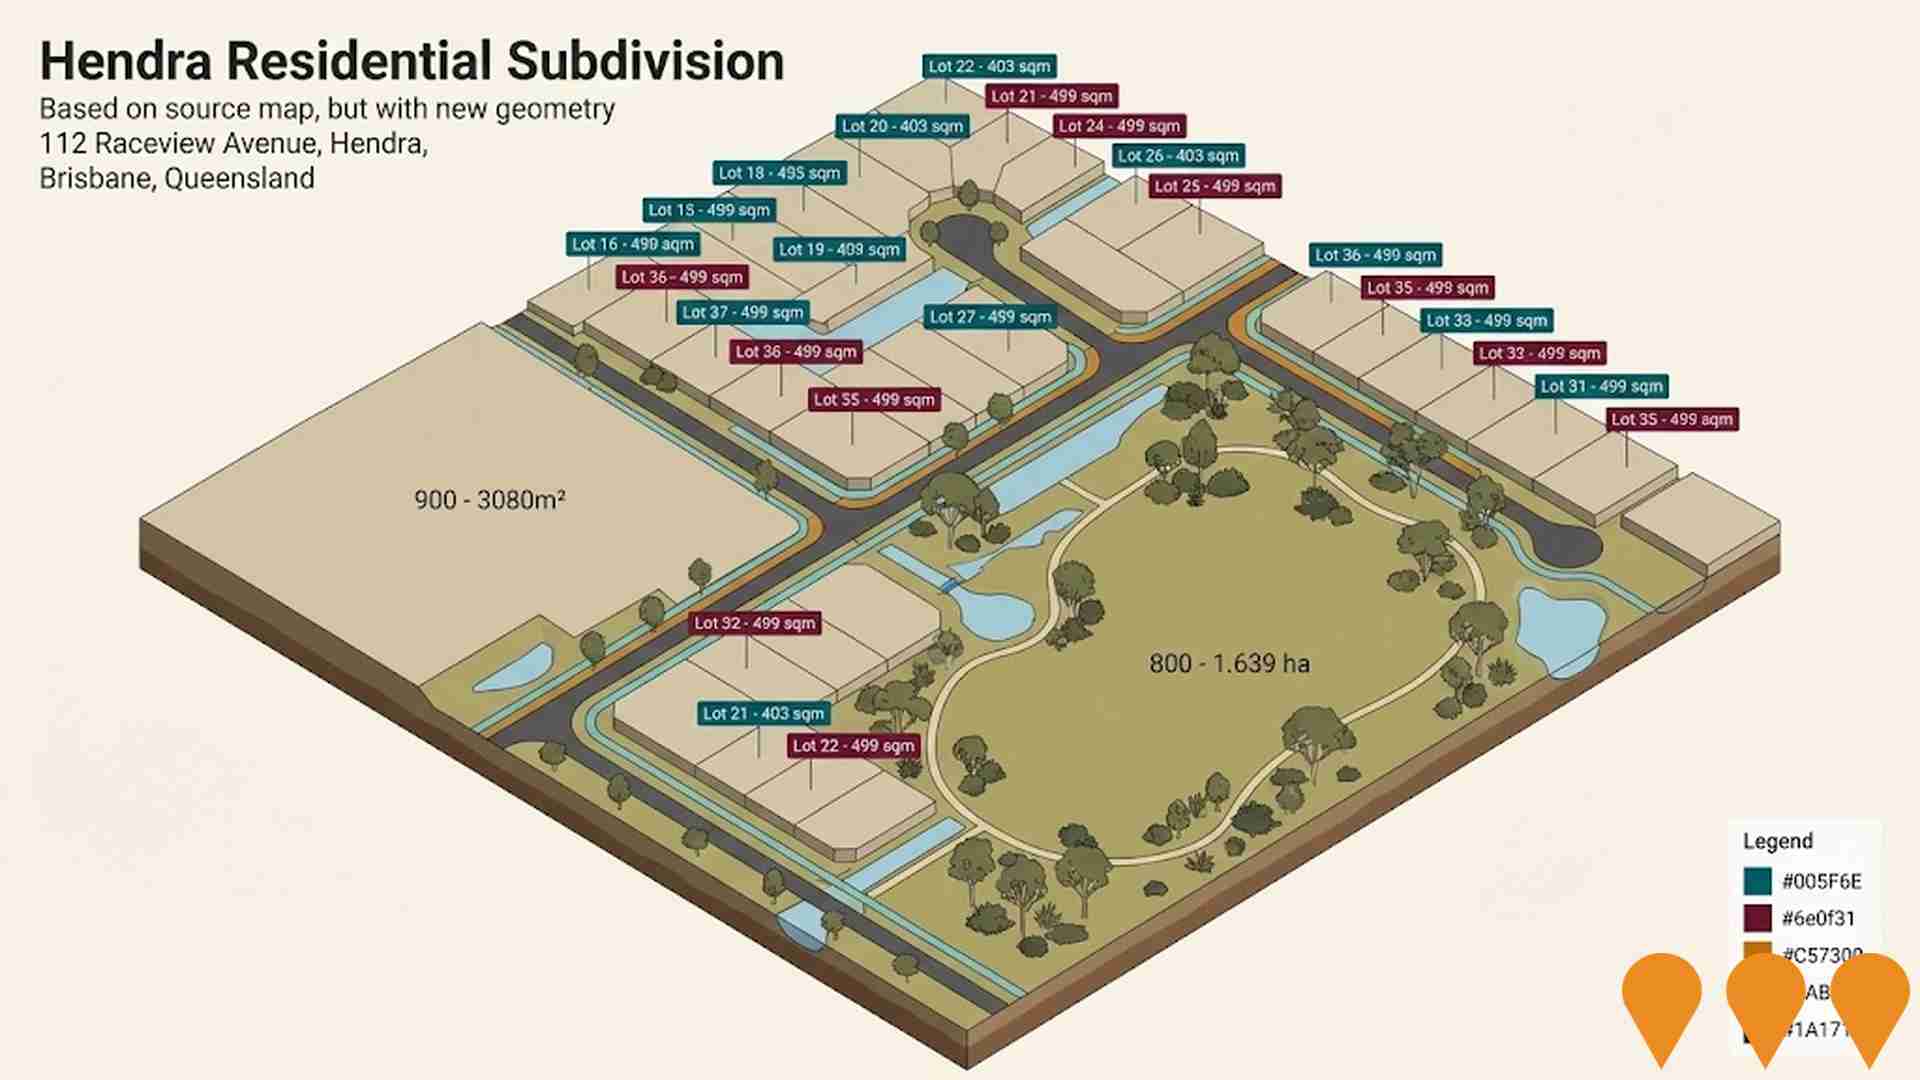
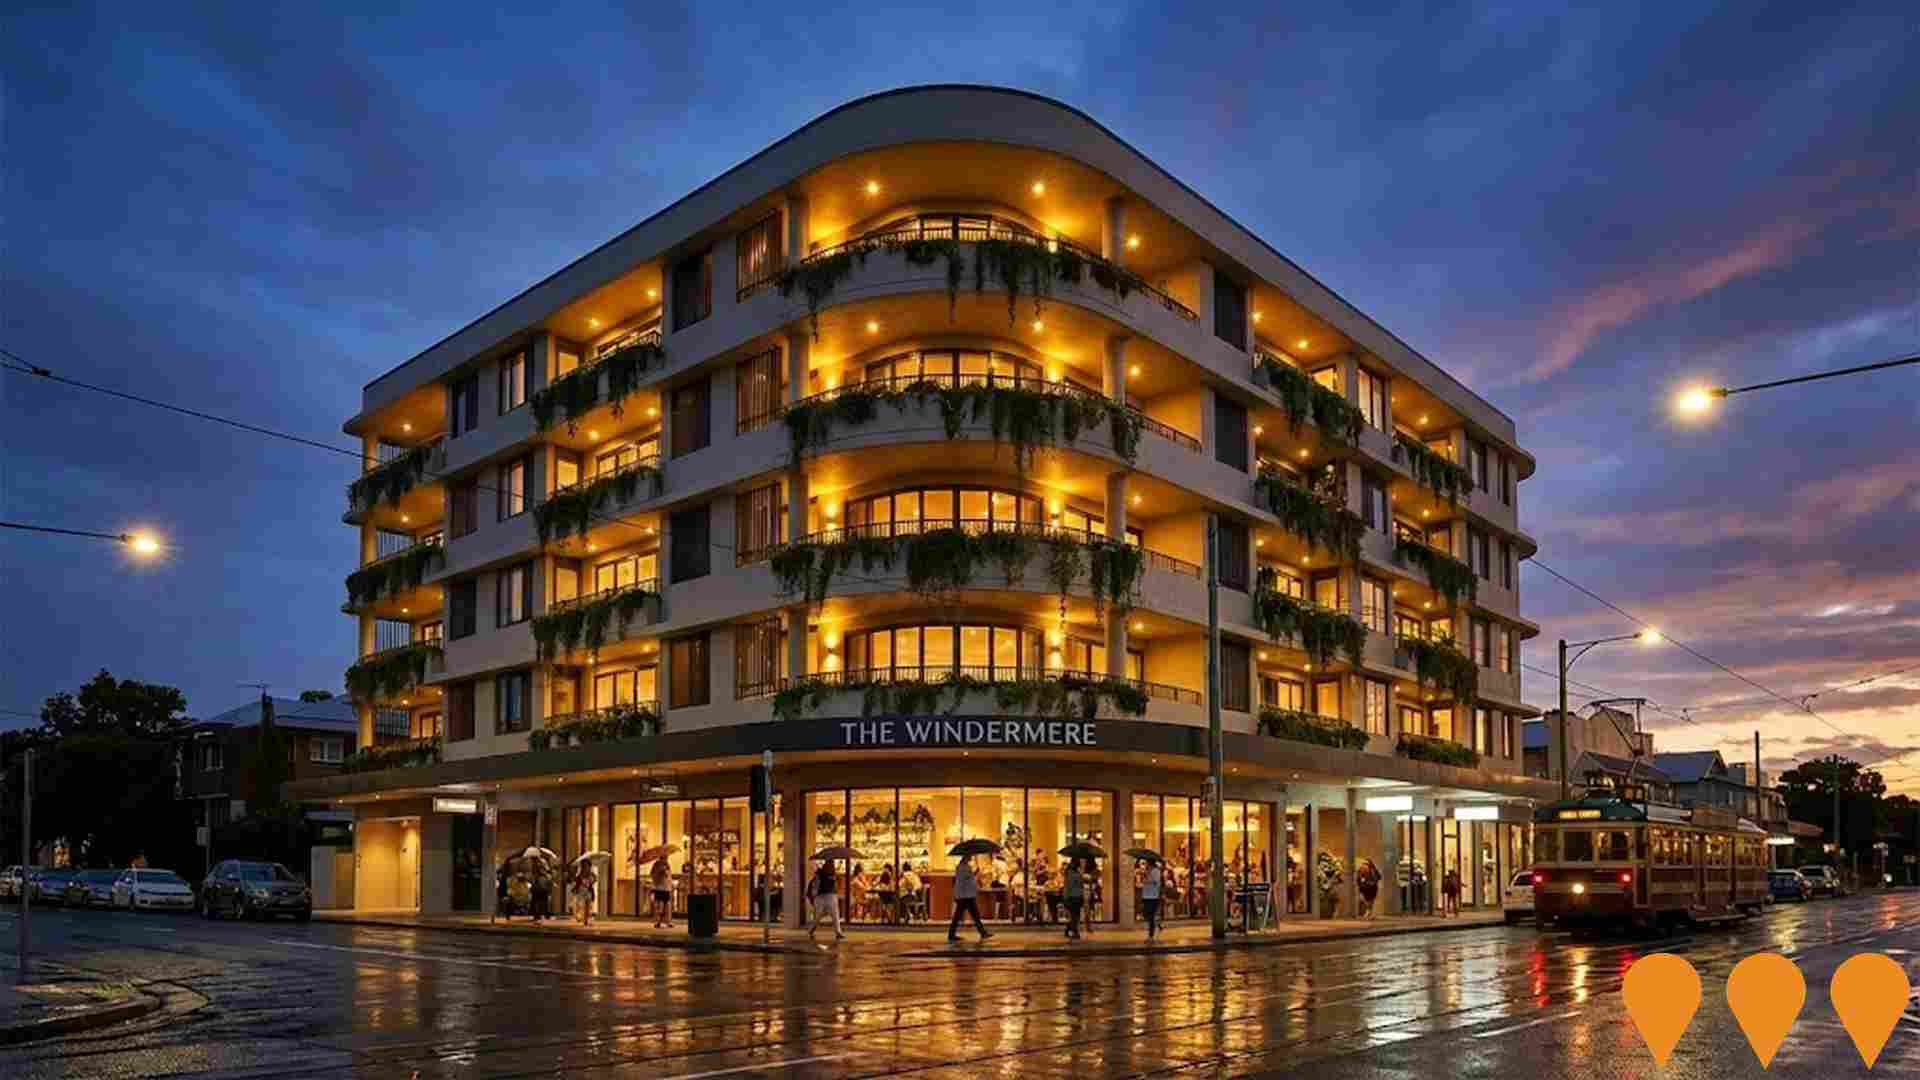
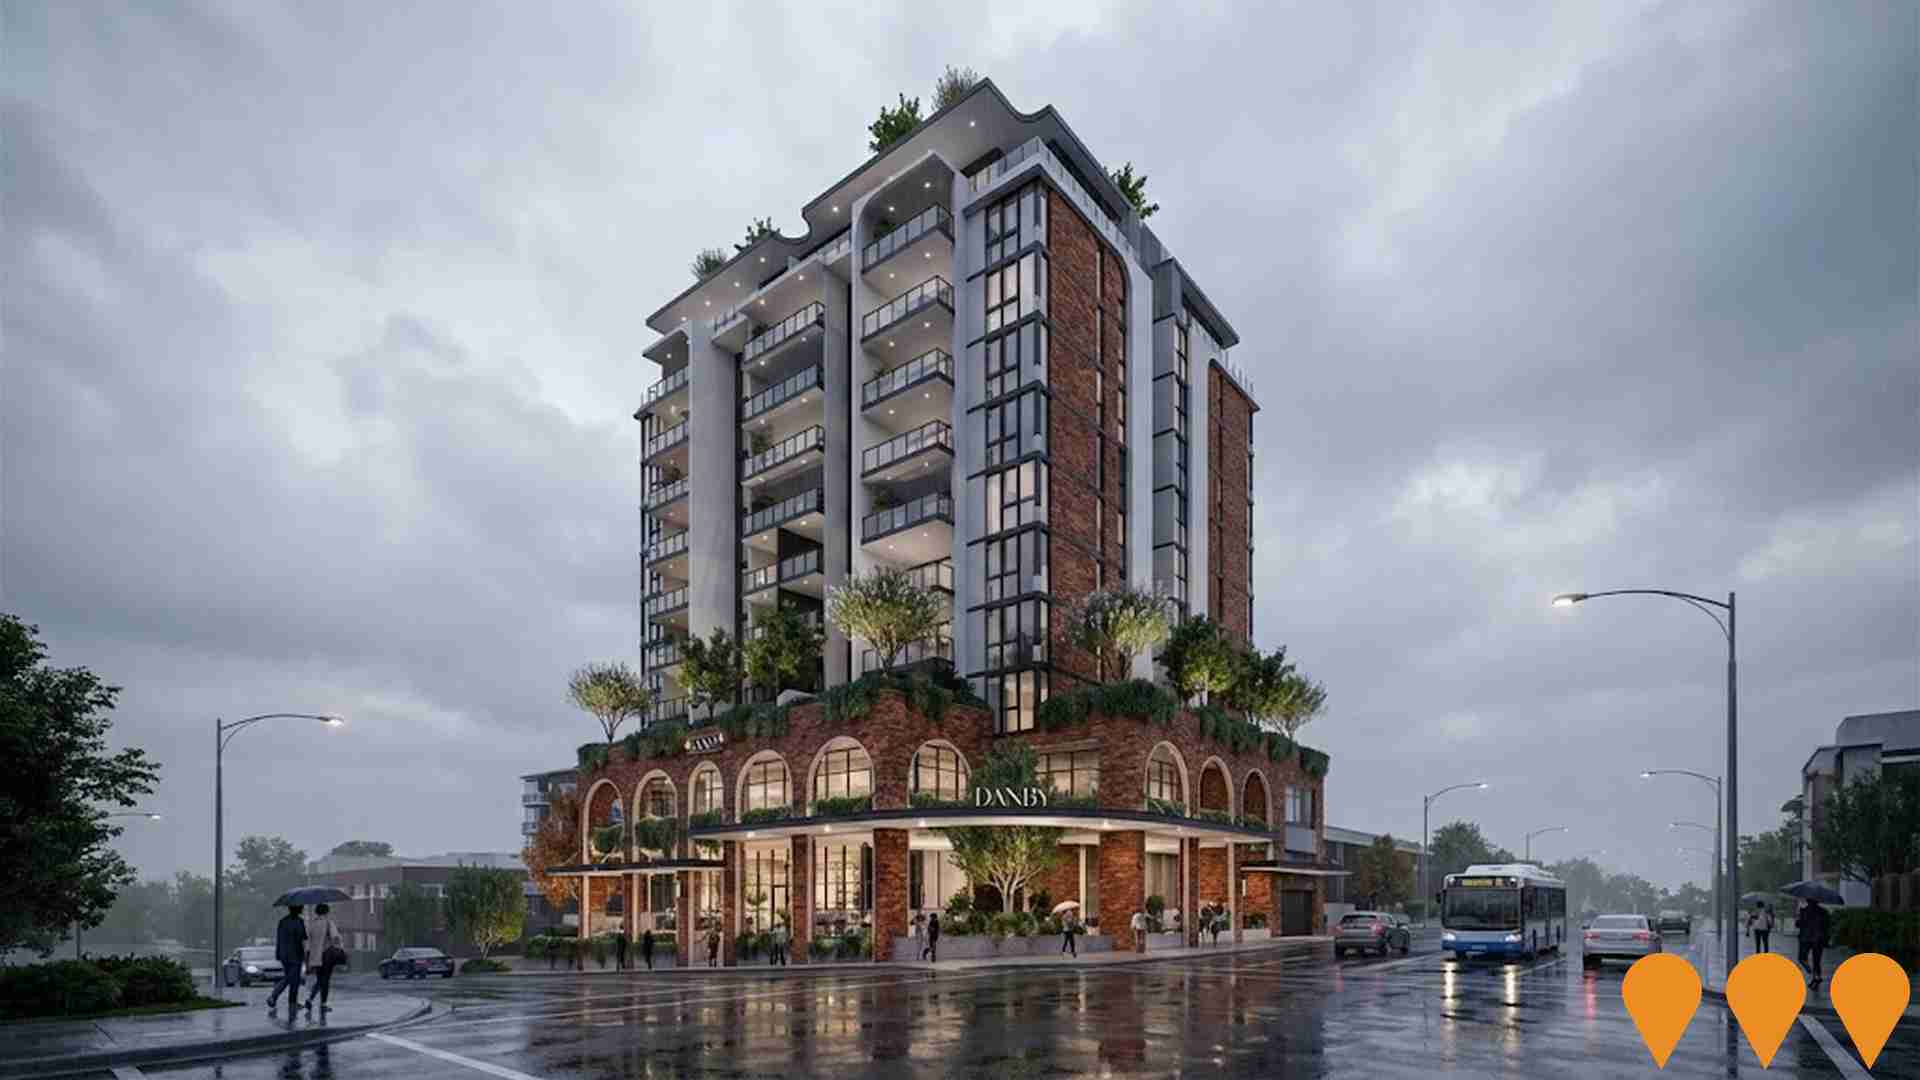
Changes to local infrastructure significantly influence an area's performance. AreaSearch identified 12 projects that could impact the area. Key projects include Mirvac's Oriel Park Masterplan, Clayfield Development Aggregate, The Windermere, and Hendra Residential Subdivision. Below is a list detailing those likely most relevant.
Professional plan users can use the search below to filter and access additional projects.
INFRASTRUCTURE SEARCH
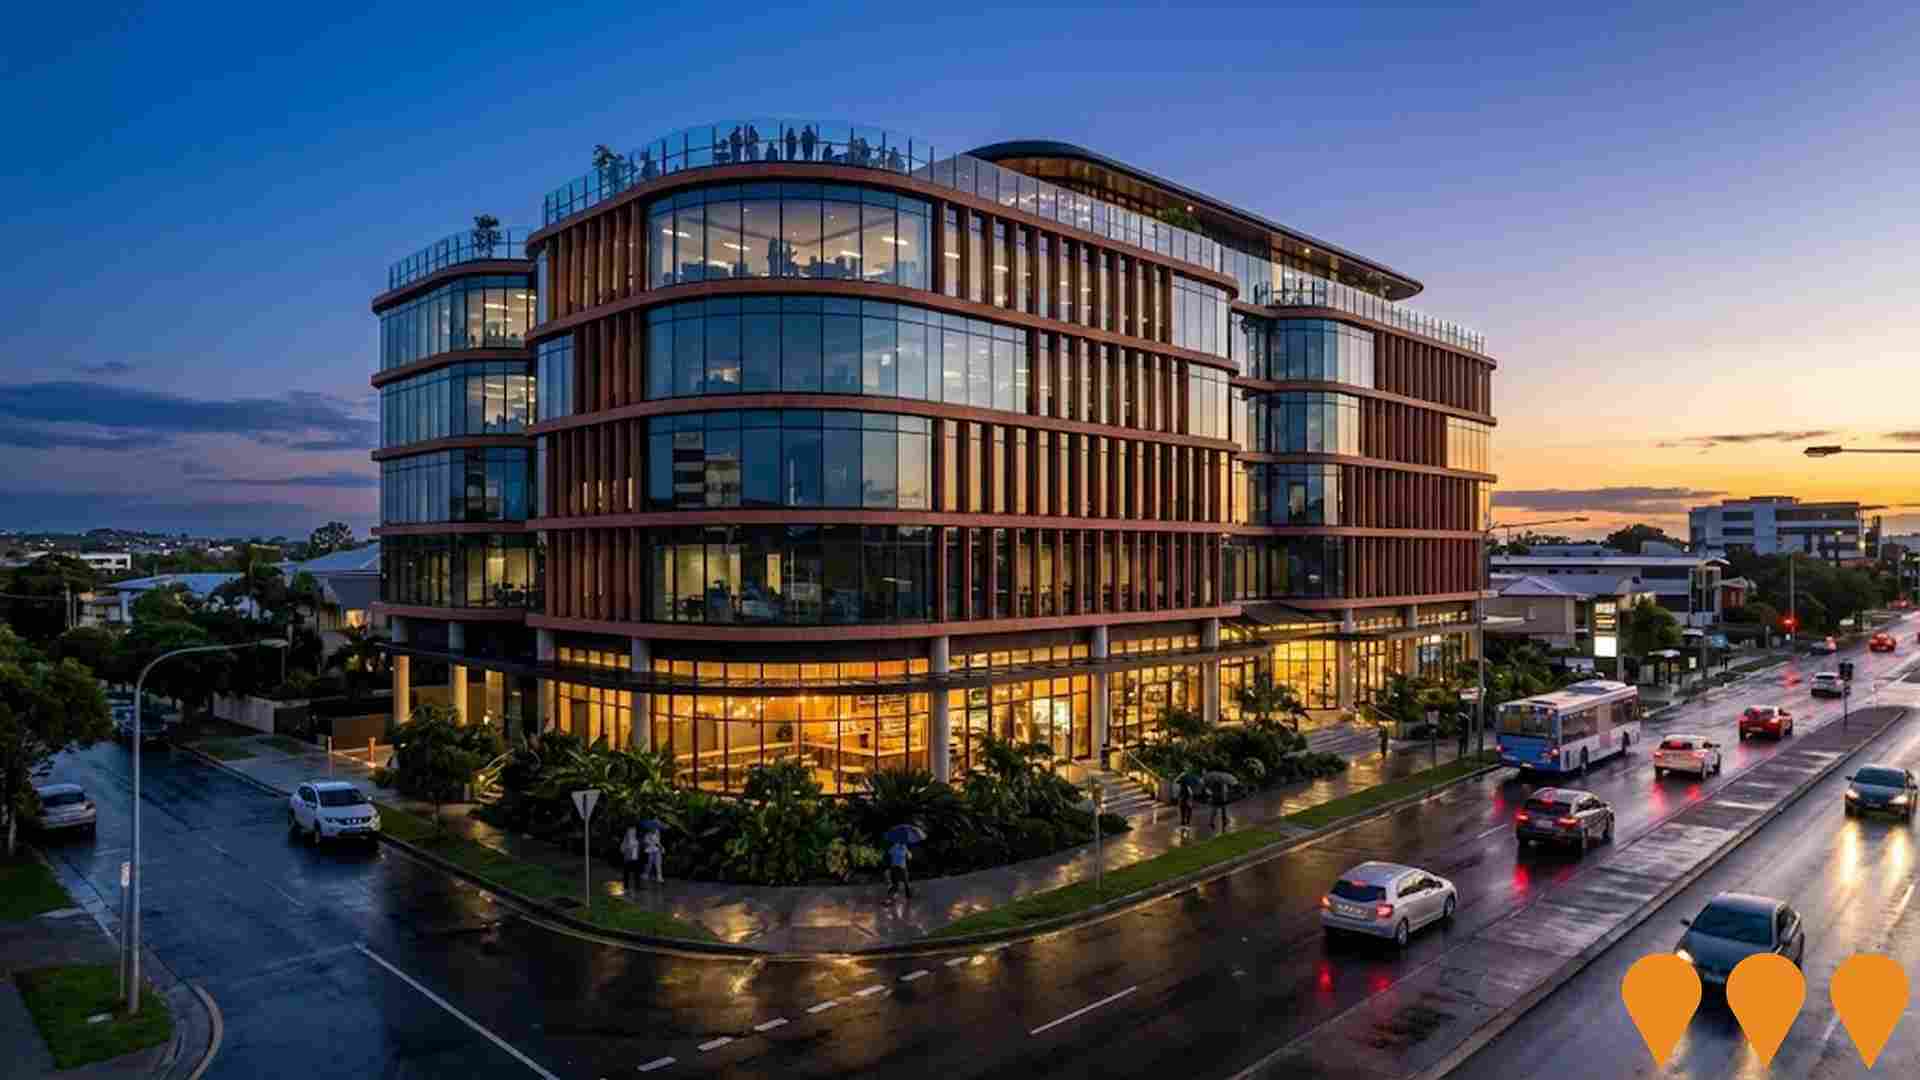
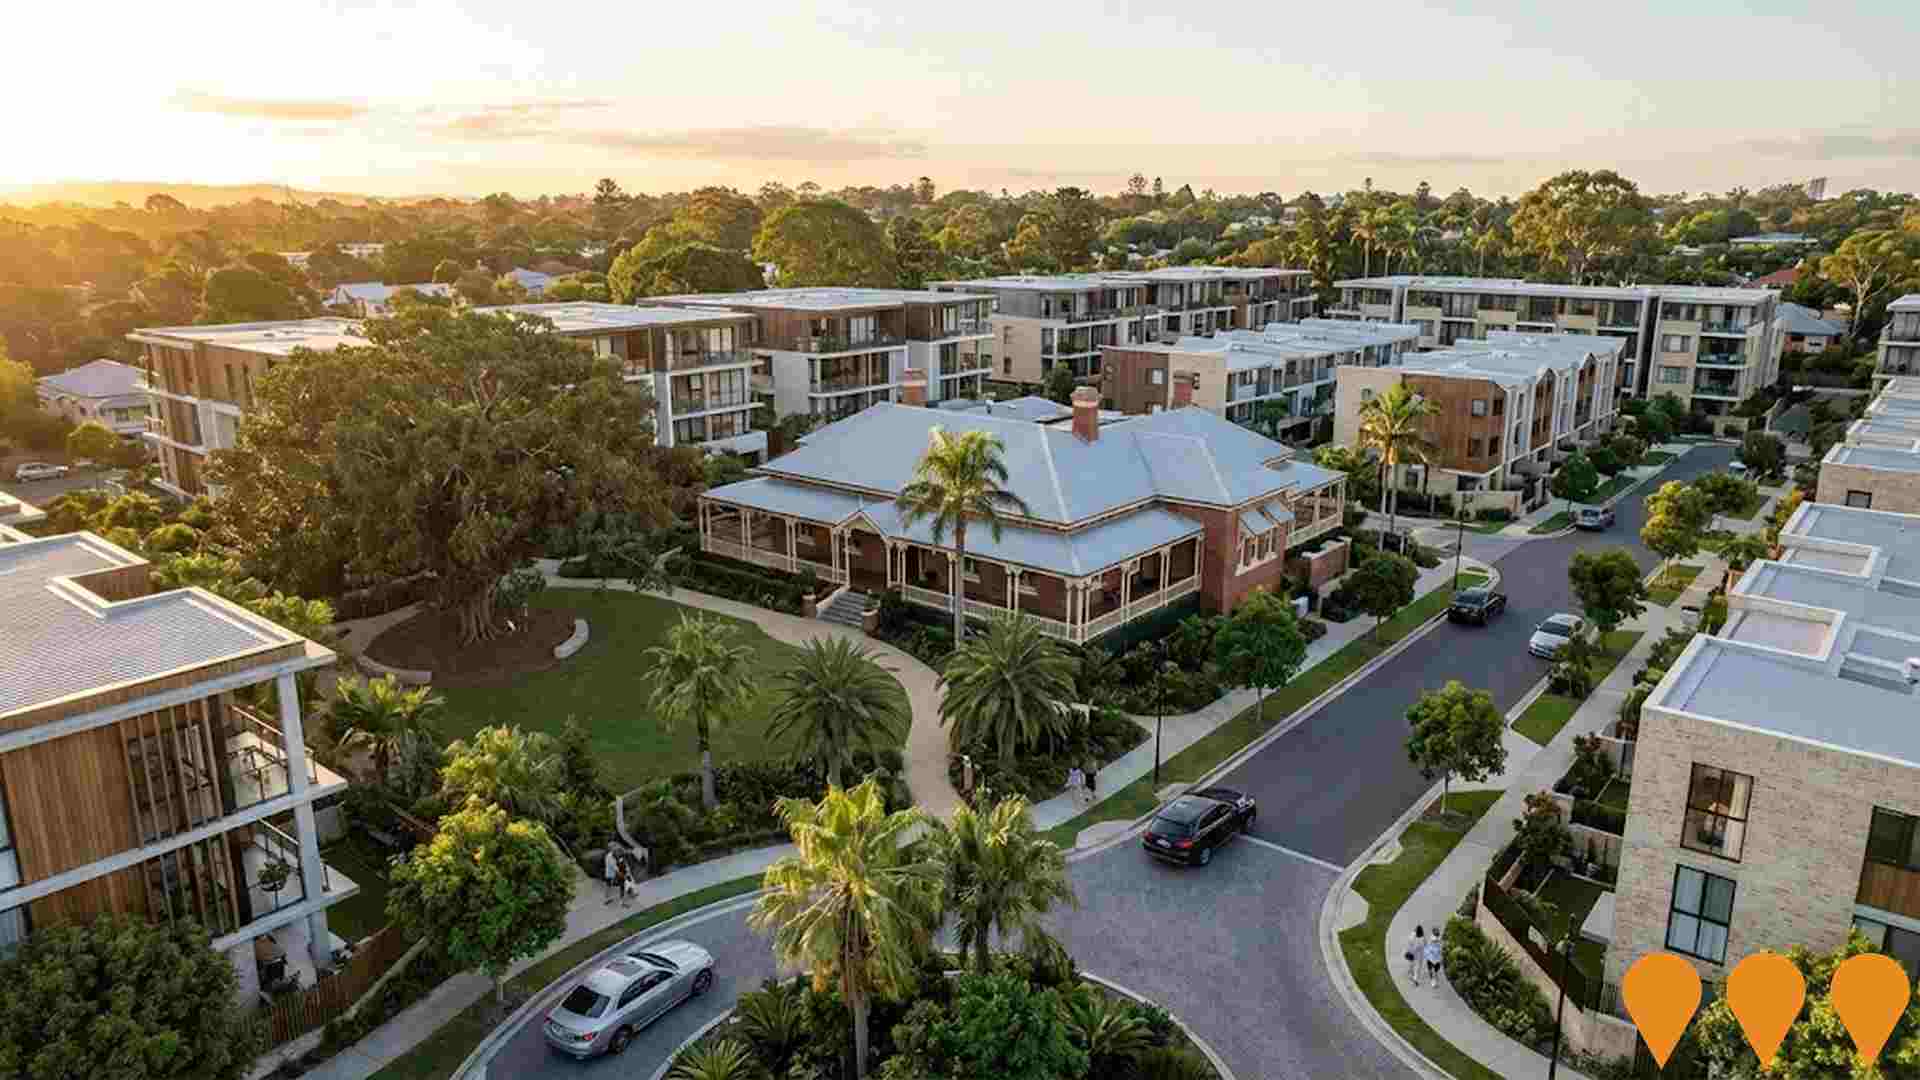
 Denotes AI-based impression for illustrative purposes only, not to be taken as definitive under any circumstances. Please follow links and conduct other investigations from the project's source for actual imagery. Developers and project owners wishing us to use original imagery please Contact Us and we will do so.
Frequently Asked Questions - Infrastructure
Northshore Hamilton Urban Development Area
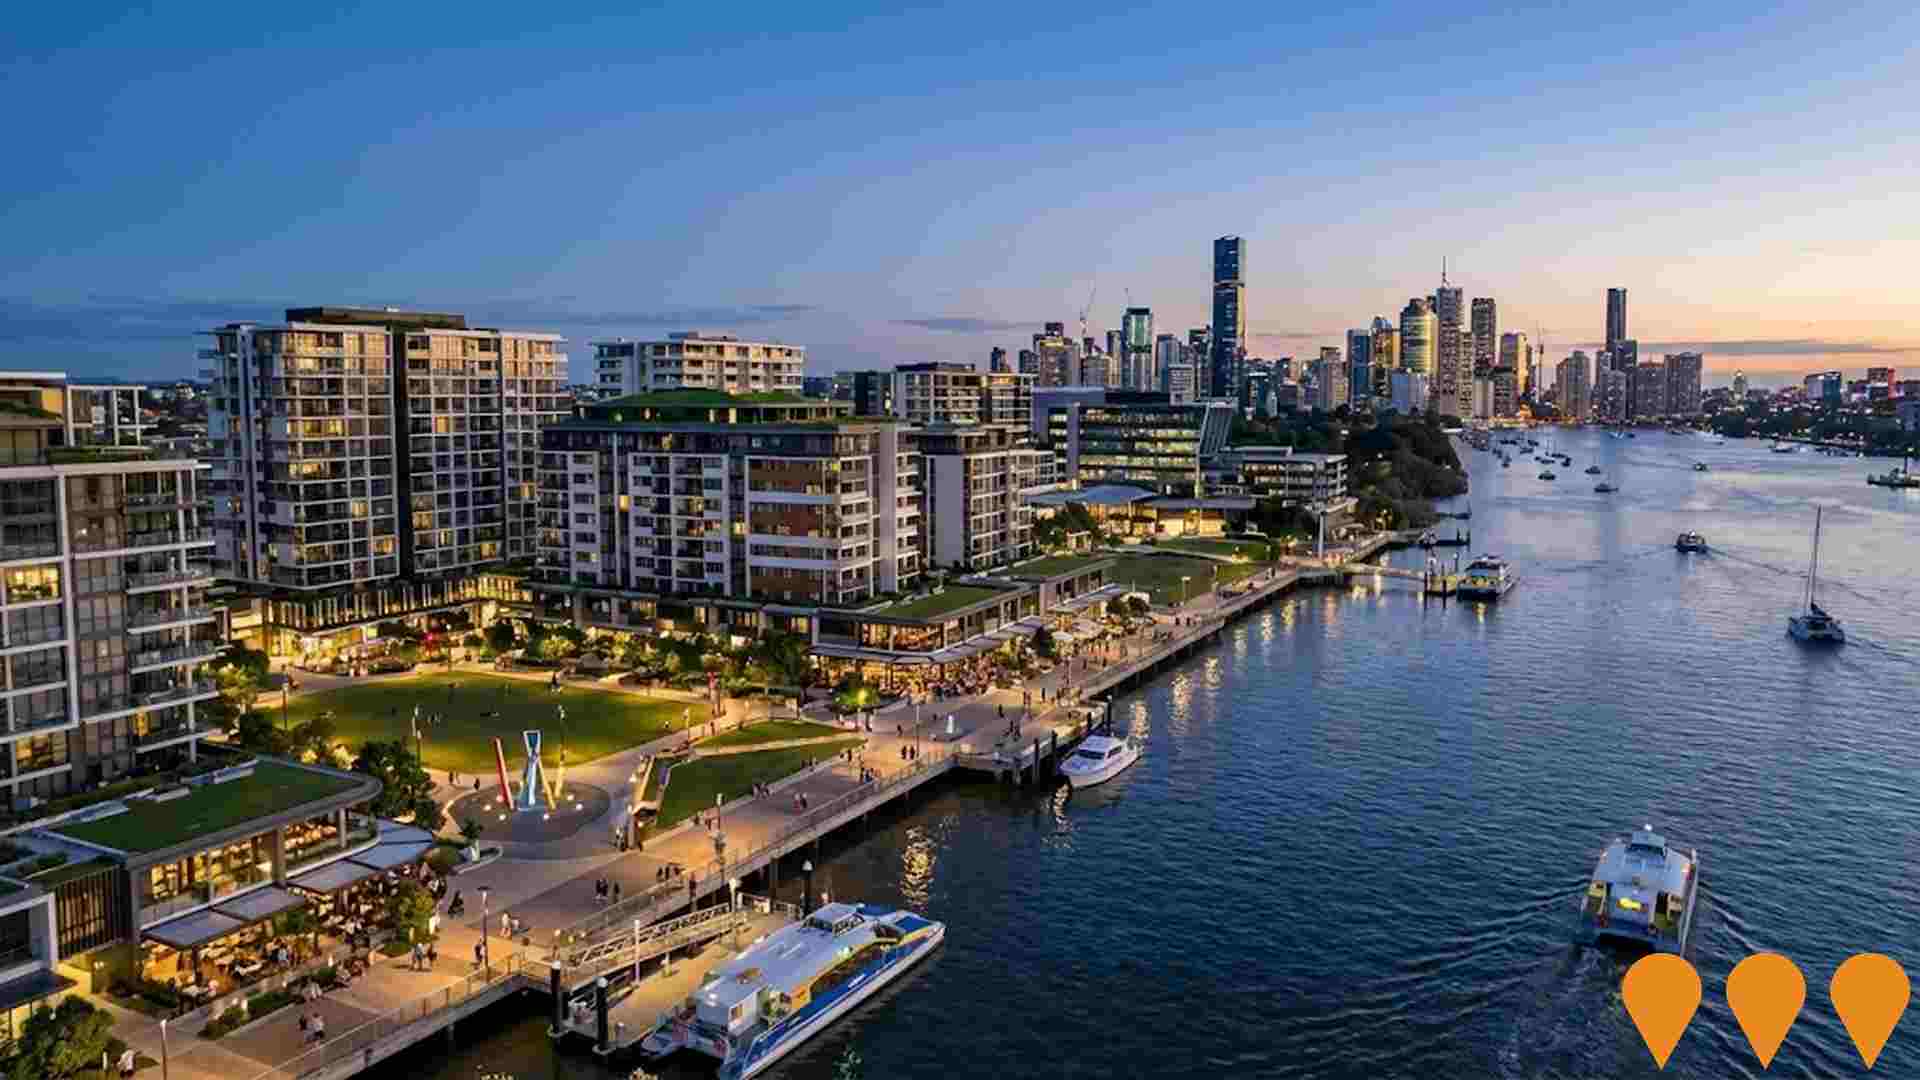
Queensland's largest waterfront urban renewal project spanning 304 hectares. Currently under construction as the Brisbane 2032 Olympic and Paralympic Athletes Village (14,200 beds). Post-Games legacy will deliver up to 20,000 new homes over 20+ years, mixed-use precincts, ferry terminals, riverwalk, parks, retail, commercial and innovation hubs.

Northshore Hamilton Priority Development Area (Northshore Brisbane)
Queensland's largest urban renewal project covering 304 hectares along 2.5km of Brisbane River waterfront in Hamilton. Led by Economic Development Queensland (EDQ), the Northshore Hamilton PDA is delivering a mixed-use precinct with capacity for up to 14,000 dwellings, 5,000 jobs, new public parks, riverwalk extensions and major transport upgrades. Construction is active on multiple fronts including Northshore Street renewal, riverfront public realm and early residential and commercial buildings.
Eagle Farm Racecourse Master Plan Redevelopment
A long-term master plan for the Brisbane Racing Club's Eagle Farm and Doomben racecourses including new residential precincts, hotel, entertainment facilities, and public domain upgrades directly within Ascot.

Clayfield Villagio Shopping Centre Revitalisation
Approved neighbourhood shopping centre redevelopment and revitalisation featuring demolition of existing single-storey building fronting Sandgate Road and construction of new 1,659sqm three-storey signature building with rooftop deck and pedestrian bridge. Project includes renovation of retained Junction Road building, internal arcade with alfresco dining areas, improved vehicular circulation with new Sandgate Road access, and addition of 50 car parking spaces bringing total to 93 spaces. The design integrates retail, office, food and dining tenancies in an expanded sustainable neighbourhood centre with enhanced landscaping and pedestrian connections.

Platinum at Hamilton (formerly Icon)
Three-tower mixed-use development (formerly Icon, now Platinum) by Wentworth Equities with DA approval for up to 433 apartments across towers up to 30 storeys. Tower 1 has final approval (153 units), Towers 2-3 have preliminary approval. Originally $650M project redesigned to $700M. Project redesigned by Fuse Architecture with subtropical feel and sky garden features. Located on 7,637sqm site within Brisbane 2032 Olympic precinct.

Clayfield Development Aggregate
Comprehensive development program encompassing multiple residential subdivision projects and infrastructure improvements throughout Clayfield. Includes residential developments with townhouses, apartments and single dwellings maintaining suburban character while increasing density, alongside road upgrades, park improvements, and community facility enhancements. Development provides 100+ new housing opportunities across various project sites while supporting infrastructure upgrades to accommodate growth.

Brookfield BTR - 11-23 MacArthur Avenue
Brookfield's first Australian build-to-rent project featuring dual 23-storey towers with 560 purpose-built rental apartments designed by Fender Katsalidis. Part of Brookfield's $400 million investment and $1.3 billion Portside Wharf precinct expansion. Features concierge, resort-style amenities, co-working spaces, targeting 4 Star Green Star rating with sustainable design and 100% electric, fossil fuel-free operations.

Oriel Park Masterplan (Mirvac)
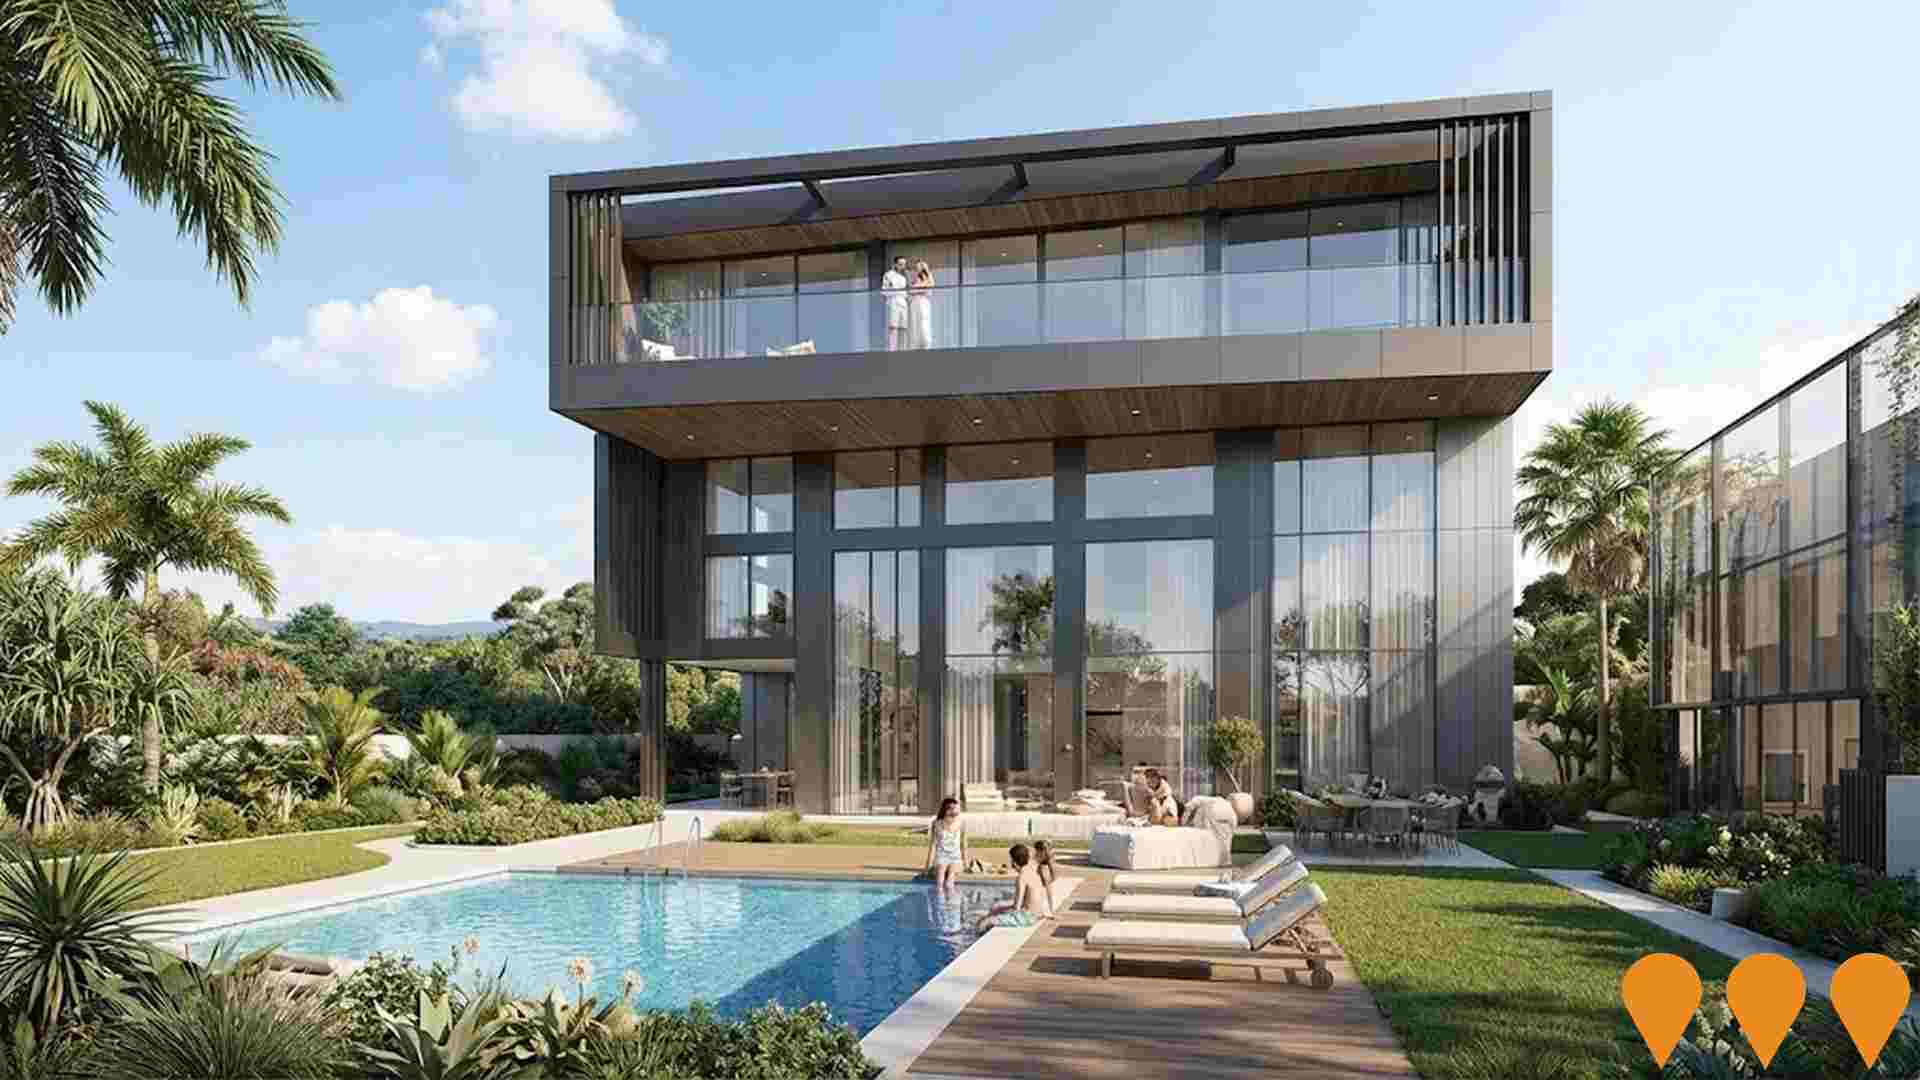
Mirvac's luxury master-planned residential community in the heart of Ascot featuring low-rise apartments, townhouses and a restored heritage clubhouse with over 300 residences in total.
Employment
AreaSearch analysis reveals Hendra significantly outperforming the majority of regions assessed nationwide
Hendra has an educated workforce with professional services well represented. The unemployment rate was 2.6% in the past year, with estimated employment growth of 0.8%.
As of September 2025, 2,981 residents were employed, with an unemployment rate of 1.4%, below Greater Brisbane's 4.0%. Workforce participation was 70.4%, higher than Greater Brisbane's 64.5%. Key industries for employment among residents are professional & technical, health care & social assistance, and retail trade. Hendra specializes in professional & technical services with an employment share of 1.6 times the regional level, while health care & social assistance has limited presence at 13.9% compared to 16.1% regionally.
The worker-to-resident ratio was 0.8 at the Census, indicating local employment opportunities above average. In the year ending September 2025, employment increased by 0.8%, labour force by 0.6%, and unemployment fell by 0.2 percentage points. Greater Brisbane recorded higher growth rates during this period. State-level data to 25-Nov-25 shows Queensland employment contracted by 0.01% with an unemployment rate of 4.2%. National employment forecasts from May-25 project national employment growth of 6.6% over five years and 13.7% over ten years, but industry-specific projections suggest Hendra's employment should increase by 7.0% over five years and 14.2% over ten years.
Frequently Asked Questions - Employment
Income
The economic profile demonstrates exceptional strength, placing the area among the top 10% nationally based on comprehensive AreaSearch income analysis
The latest postcode level ATO data for financial year 2022 shows Hendra SA2 has exceptionally high incomes nationally. The median income is $67,411, while the average income stands at $116,555. This contrasts with Greater Brisbane's median income of $55,645 and average income of $70,520. Based on Wage Price Index growth of 13.99% since financial year 2022, current estimates for Hendra would be approximately $76,842 (median) and $132,861 (average) as of September 2025. According to the 2021 Census, incomes in Hendra rank highly nationally, with household, family, and personal incomes between the 91st and 97th percentiles. Income distribution shows 37.2% of residents earn $4000 or more, differing from regional patterns where the dominant range is $1,500 - 2,999 at 33.3%. Economic strength in Hendra is evident with 50.3% of households earning high weekly incomes exceeding $3,000, supporting elevated consumer spending. Housing accounts for 13.9% of income, and residents rank within the 96th percentile for disposable income. The area's SEIFA income ranking places it in the 10th decile.
Frequently Asked Questions - Income
Housing
Hendra is characterized by a predominantly suburban housing profile, with above-average rates of outright home ownership
Hendra's dwelling structure, as per the latest Census, consisted of 80.9% houses and 19.0% other dwellings (semi-detached, apartments, 'other' dwellings), compared to Brisbane metro's 36.5% houses and 63.6% other dwellings. Home ownership in Hendra stood at 32.9%, with mortgaged dwellings at 43.5% and rented ones at 23.5%. The median monthly mortgage repayment was $2,900, exceeding the Brisbane metro average of $2,167. The median weekly rent in Hendra was $550, higher than Brisbane metro's $410. Nationally, Hendra's mortgage repayments were significantly higher than the Australian average of $1,863, while rents were substantially above the national figure of $375.
Frequently Asked Questions - Housing
Household Composition
Hendra has a typical household mix, with a higher-than-average median household size
Family households constitute 76.9% of all households, including 40.6% couples with children, 24.9% couples without children, and 10.2% single parent families. Non-family households account for the remaining 23.1%, with lone person households at 20.6% and group households comprising 2.3%. The median household size is 2.7 people, which is larger than the Greater Brisbane average of 2.2.
Frequently Asked Questions - Households
Local Schools & Education
Hendra shows strong educational performance, ranking in the upper quartile nationally when assessed across multiple qualification and achievement indicators
Hendra has a notably high level of educational attainment, with 44.4% of its residents aged 15 years and above holding university qualifications as of the latest data point. This figure exceeds the state benchmark of 25.7% for Queensland and the national average of 30.4%. The area's strong educational background is highlighted by the prevalence of Bachelor degrees, held by 30.5% of residents in this age group, followed by postgraduate qualifications (9.5%) and graduate diplomas (4.4%). Vocational credentials are also prominent, with 25.5% of Hendra's residents aged 15 years and above possessing them - advanced diplomas account for 11.7%, while certificates make up 13.8%.
Educational participation is notably high in the area, with 30.7% of residents currently enrolled in formal education programs. This includes 9.8% in primary education, 8.6% in secondary education, and 7.2% pursuing tertiary education.
Frequently Asked Questions - Education
Schools Detail
Nearby Services & Amenities
Transport
Transport servicing is good compared to other areas nationally based on assessment of service frequency, route connectivity and accessibility
Public transport analysis reveals 37 active transport stops operating within Hendra. These comprise a mix of train and bus services. They are serviced by 25 individual routes, collectively providing 1,711 weekly passenger trips.
Transport accessibility is rated as excellent, with residents typically located 181 meters from the nearest transport stop. Service frequency averages 244 trips per day across all routes, equating to approximately 46 weekly trips per individual stop.
Frequently Asked Questions - Transport
Transport Stops Detail
Health
Hendra's residents boast exceedingly positive health performance metrics with very low prevalence of common health conditions across all age groups
Hendra shows excellent health outcomes with low prevalence of common conditions across all ages. Private health cover is high at approximately 79% (4,087 people), compared to 71.3% in Greater Brisbane and a national average of 55.3%. The most prevalent conditions are asthma (6.7%) and mental health issues (6.2%).
75.7% report no medical ailments, compared to 73.7% in Greater Brisbane. Hendra has 15.6% residents aged 65 and over (807 people), higher than the 12.2% in Greater Brisbane. Senior health outcomes align with the general population's profile.
Frequently Asked Questions - Health
Cultural Diversity
In terms of cultural diversity, Hendra records figures broadly comparable to the national average, as found in AreaSearch's assessment of a number of language and cultural background related metrics
Hendra's cultural diversity aligns with the broader regional average: 80.2% were born in Australia, 90.0% are citizens, and 90.3% speak English exclusively at home. Christianity is the predominant religion in Hendra at 63.9%, compared to 45.9% across Greater Brisbane. The top three ancestral groups based on parents' country of birth are English (28.6%), Australian (22.5%), and Irish (12.6%).
Notably, Scottish ancestry is higher in Hendra at 9.3% than the regional average of 8.7%. French and South African ancestries also show slight increases: French at 0.7% versus 0.7%, and South African at 0.6% versus 0.5%.
Frequently Asked Questions - Diversity
Age
Hendra's population aligns closely with national norms in age terms
The median age in Hendra is 39 years, which exceeds Greater Brisbane's average of 36 years and is close to Australia's median age of 38 years. Compared to Greater Brisbane, Hendra has a higher proportion of residents aged 55-64 (12.8%) but fewer residents aged 25-34 (7.6%). Between the 2021 Census and now, the 5-14 age group has increased from 13.4% to 14.7%, while the 25-34 age group has decreased from 10.0% to 7.6% and the 45-54 age group has dropped from 15.3% to 14.2%. By 2041, Hendra's age composition is expected to shift notably. The 75-84 age group is projected to grow by 44%, reaching 404 people from 280. Those aged 65 and above are expected to comprise 73% of the population growth. Conversely, population declines are projected for the 15-24 and 0-4 age groups.
