Chart Color Schemes
This analysis uses ABS Statistical Areas Level 2 (SA2) boundaries, which can materially differ from Suburbs and Localities (SAL) even when sharing similar names.
SA2 boundaries are defined by the Australian Bureau of Statistics and are designed to represent communities for statistical reporting (e.g., census and ERP).
Suburbs and Localities (SAL) represent commonly-used suburb/locality names (postal-style areas) and may use different geographic boundaries. For comprehensive analysis, consider reviewing both boundary types if available.
est. as @ -- *
ABS ERP | -- people | --
2021 Census | -- people
Sales Activity
Curious about local property values? Filter the chart to assess the volume and appreciation (including resales) trends and regional comparisons, or scroll to the map below view this information at an individual property level.
Find a Recent Sale
Sales Detail
Population
Population growth drivers in Helena Valley - Koongamia are strong compared to national averages based on AreaSearch's ranking of recent, and medium to long-term trends
Helena Valley - Koongamia's population was around 6,484 as of Nov 2025. This showed an increase of 704 people from the 2021 Census figure of 5,780, representing a 12.2% growth. The change was inferred from ABS' estimated resident population of 6,471 in June 2024 and additional 78 validated new addresses since the Census date. This resulted in a population density ratio of 733 persons per square kilometer, comparable to averages seen across locations assessed by AreaSearch. The area's growth exceeded the national average (8.9%) and was primarily driven by interstate migration contributing approximately 38.3% of overall population gains. AreaSearch adopted ABS/Geoscience Australia projections for each SA2 area released in 2024, with a base year of 2022.
For areas not covered, growth rates by age cohort from the ABS' Greater Capital Region projections (released in 2023) were used. Projecting forward based on demographic trends, an above median population growth is expected for the area, with a projected increase of 1,162 persons to 2041, reflecting a total gain of 17.7% over the 17 years.
Frequently Asked Questions - Population
Development
AreaSearch assessment of residential development activity positions Helena Valley - Koongamia among the top 25% of areas assessed nationwide
Helena Valley - Koongamia has seen approximately 58 new homes approved each year over the past five financial years, totalling 293 homes. In the current financial year FY-26, 26 approvals have been recorded to date. Over these five years, an average of 2.4 new residents per dwelling has been observed, indicating solid demand for housing in the area. The average expected construction cost value of new homes is $239,000, which aligns with broader regional development trends.
This financial year has also seen $1.4 million in commercial development approvals, suggesting a predominantly residential focus. Compared to Greater Perth, Helena Valley - Koongamia shows 113.0% higher new home approvals per person, offering greater choice for buyers. All recent development has been detached houses, maintaining the area's traditional low density character and appealing to those seeking family homes with space. The location currently has approximately 102 people per dwelling approval, indicating an expanding market.
According to AreaSearch quarterly estimates, Helena Valley - Koongamia is forecasted to gain 1,149 residents by 2041. With current construction levels, housing supply should adequately meet demand, creating favourable conditions for buyers and potentially enabling growth that exceeds current forecasts.
Frequently Asked Questions - Development
Infrastructure
Helena Valley - Koongamia has emerging levels of nearby infrastructure activity, ranking in the 23rdth percentile nationally
Changes to local infrastructure significantly impact an area's performance. AreaSearch has identified nine projects likely affecting this region. Notable ones are The Hales, Forrestfield / High Wycombe Industrial Area, Midland Health Campus Redevelopment (St John of God Midland Public & Private Hospitals Expansion), and Lot 912 Bushmead Residential Development. Below is a list detailing those most relevant.
Professional plan users can use the search below to filter and access additional projects.
INFRASTRUCTURE SEARCH
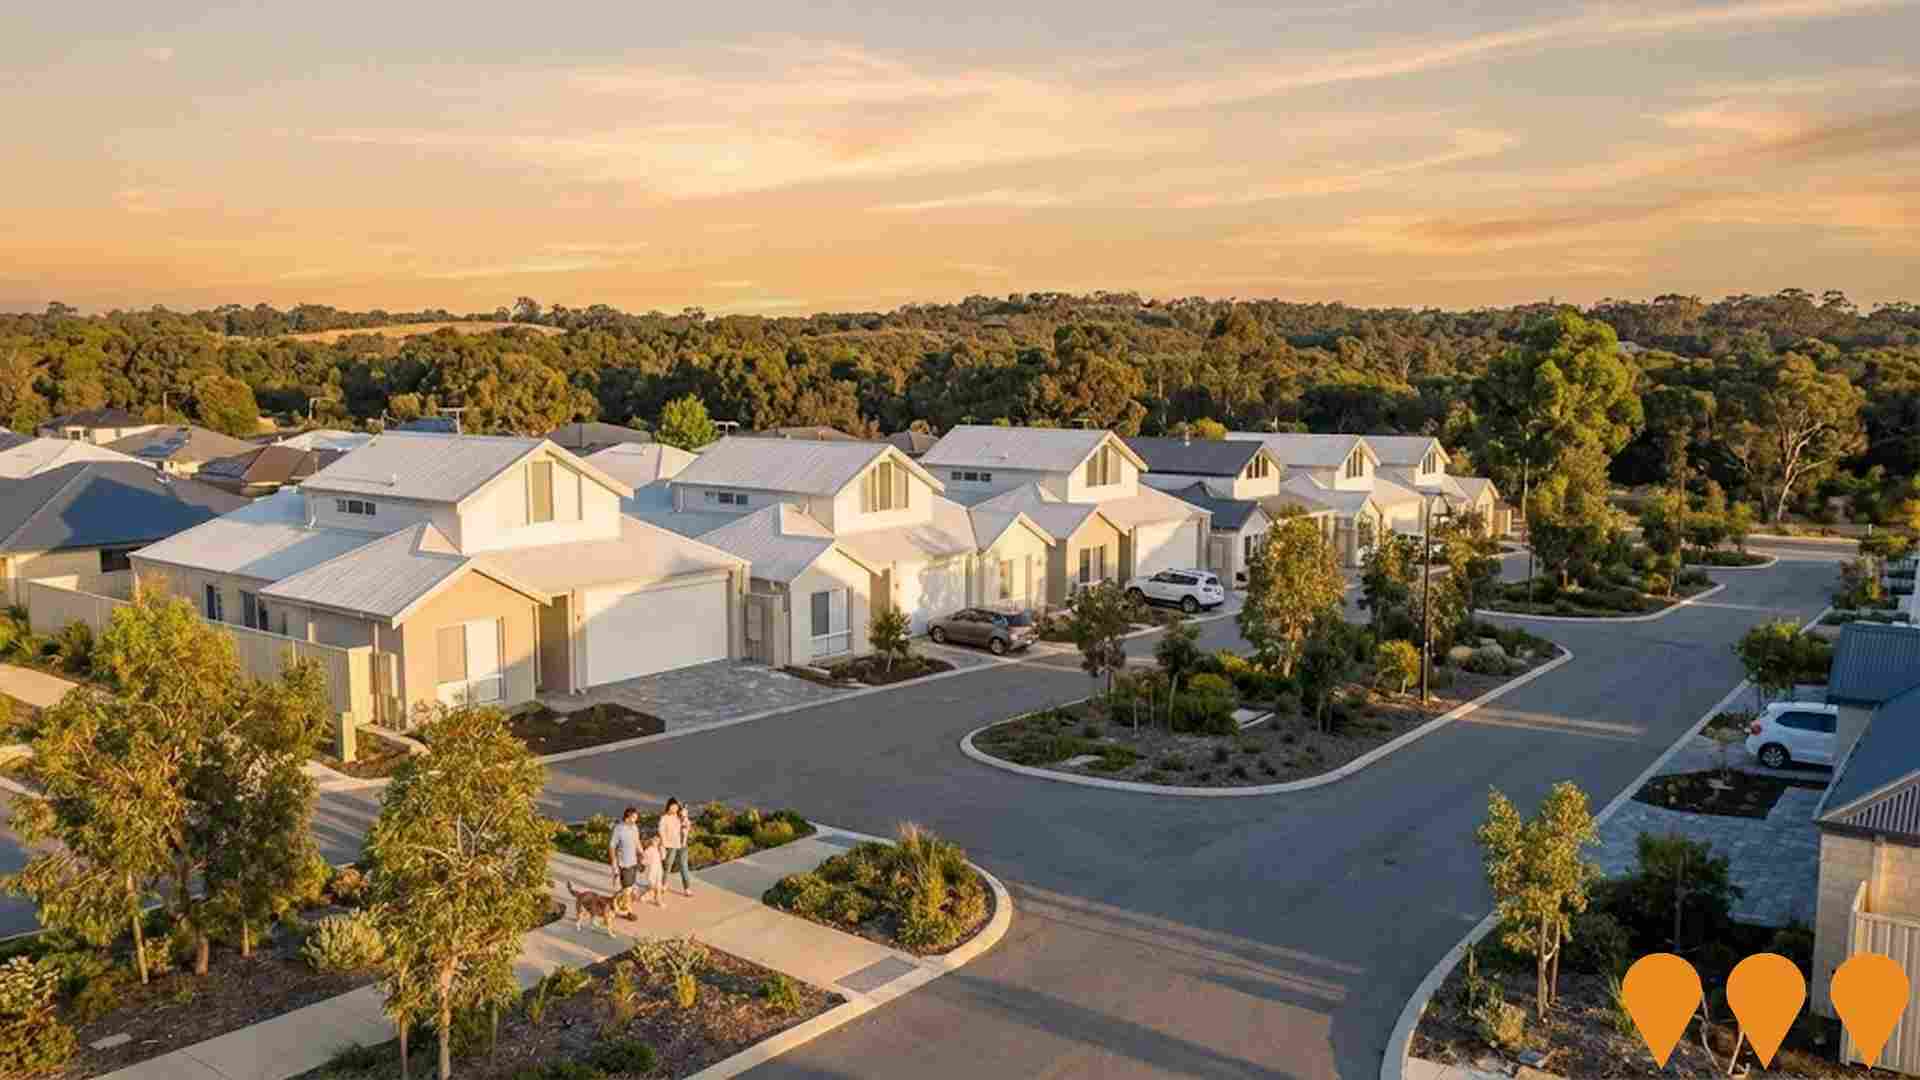
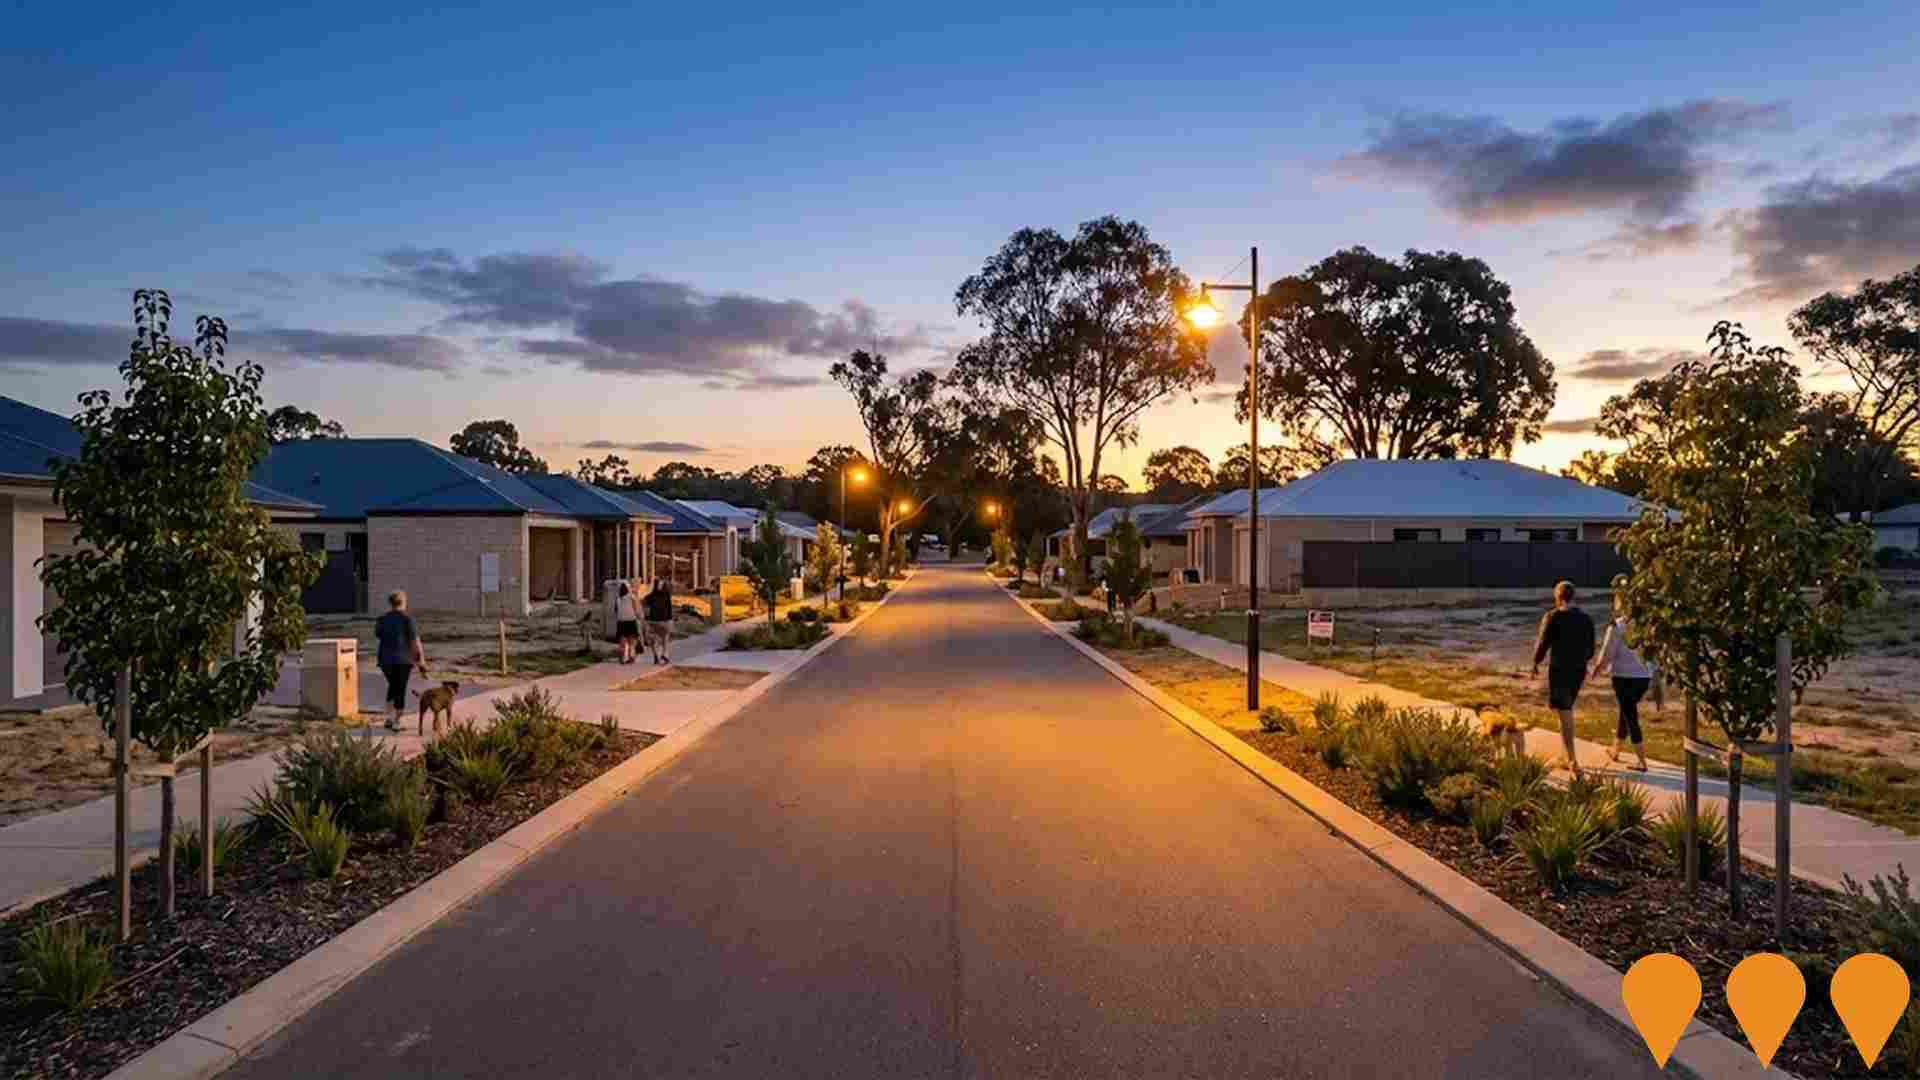
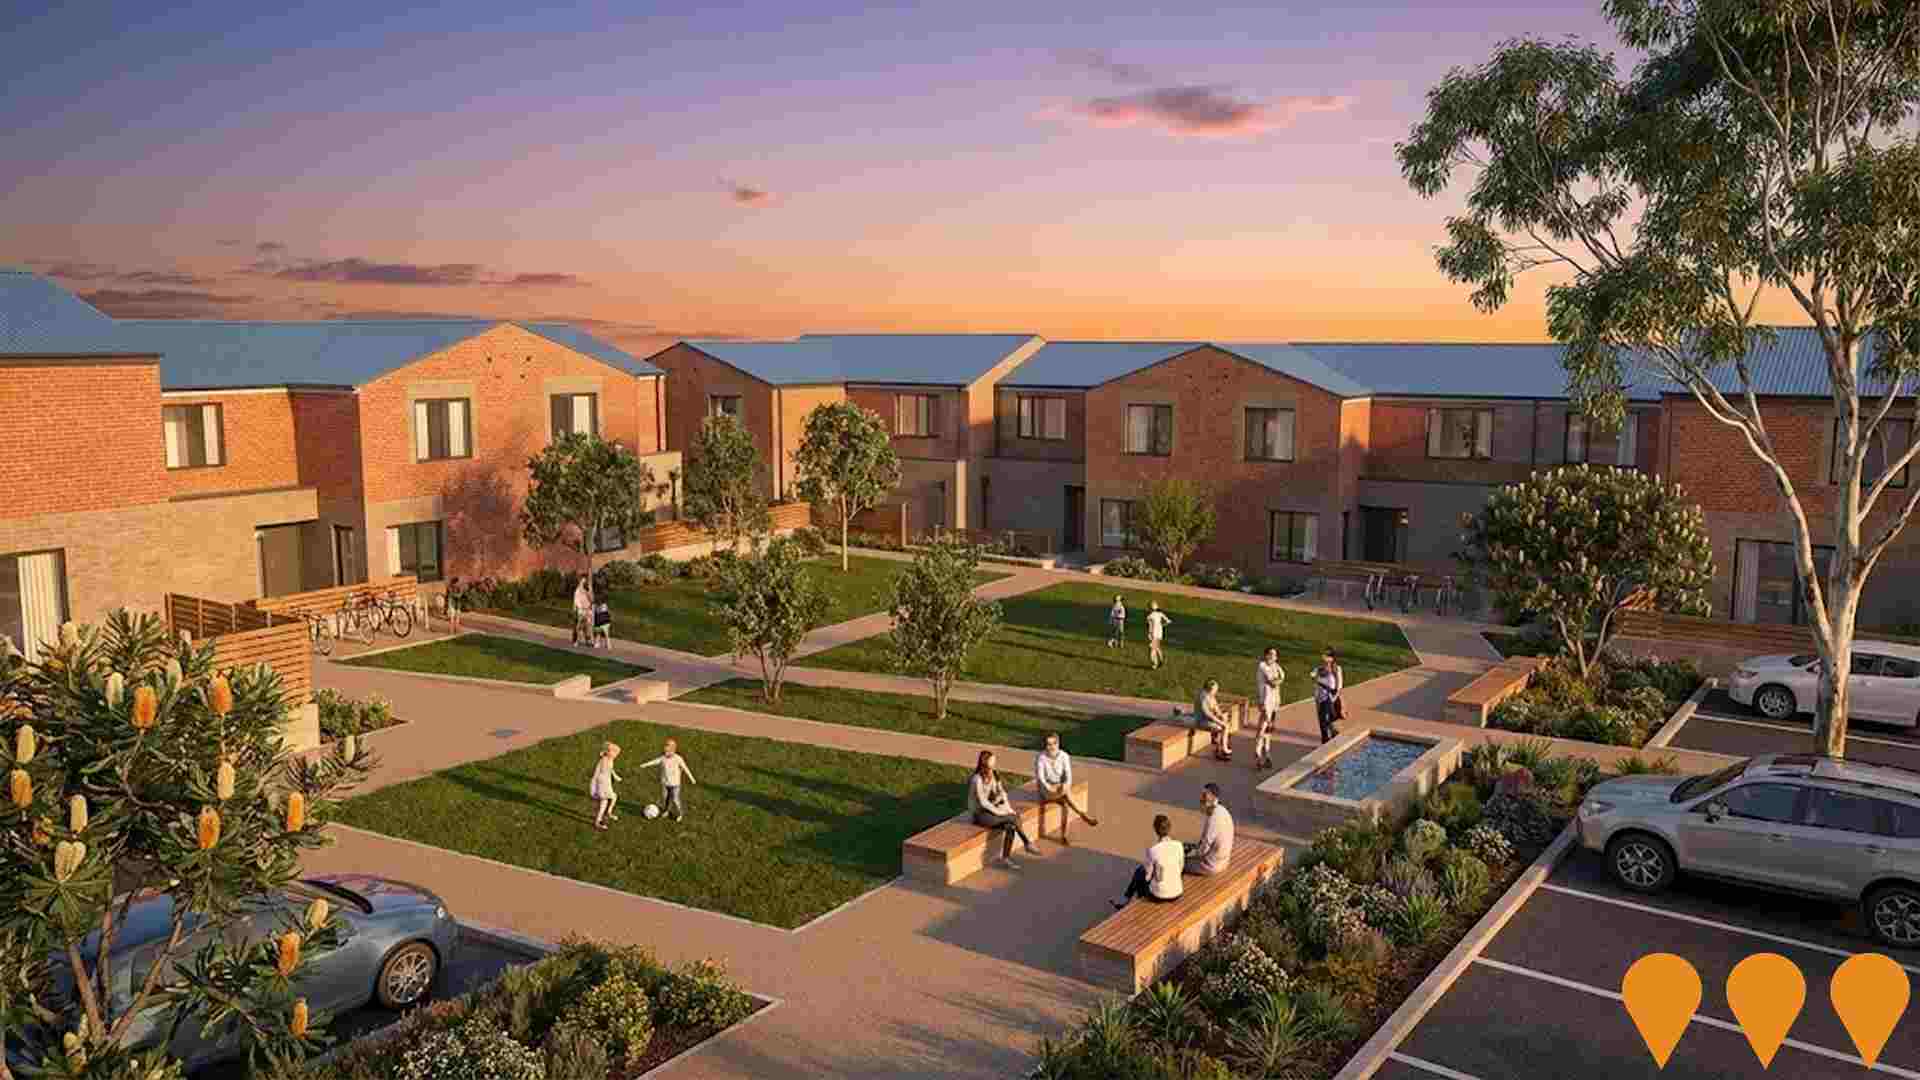
 Denotes AI-based impression for illustrative purposes only, not to be taken as definitive under any circumstances. Please follow links and conduct other investigations from the project's source for actual imagery. Developers and project owners wishing us to use original imagery please Contact Us and we will do so.
Frequently Asked Questions - Infrastructure
METRONET High Wycombe Station & Transit Oriented Development
High Wycombe Station opened in 2022 as part of the Airport Line (formerly Forrestfield-Airport Link). The surrounding 62-hectare METRONET East Redevelopment Area is now progressing as a transit-oriented precinct. The High Wycombe Structure Plan was approved by the Western Australian Planning Commission in September 2025, enabling up to 1,050 dwellings plus retail, commercial and community uses. DevelopmentWA is preparing to commence precinct enabling works and land sales in 2026.

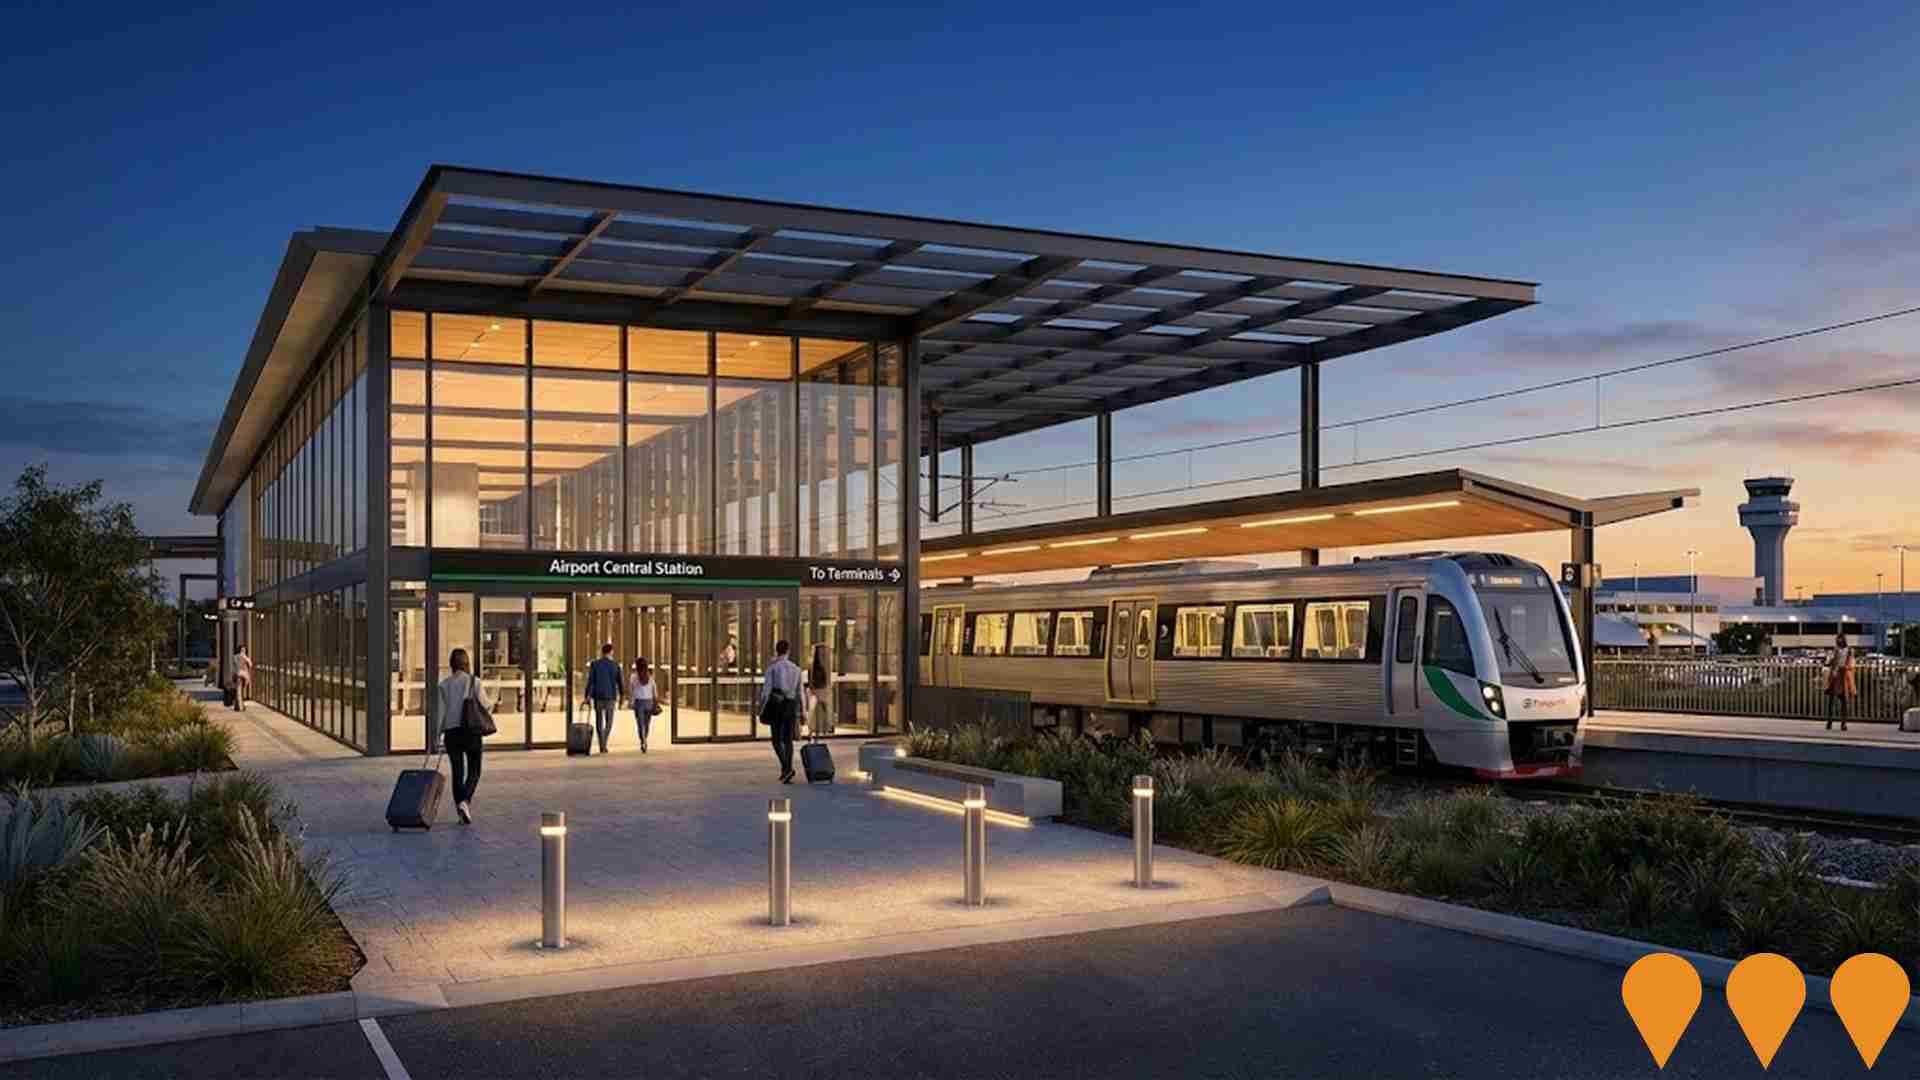
Forrestfield-Airport Link (Airport Line)
The Forrestfield-Airport Link is an 8.5 km METRONET rail project connecting the Midland Line at Bayswater to High Wycombe via twin bored tunnels under the Swan River and Perth Airport, with three new stations at Redcliffe, Airport Central and High Wycombe. The 1.86 billion AUD project opened as the Airport Line on 9 October 2022 and now provides a frequent suburban rail service linking Perths eastern suburbs and the airport to the CBD, improving travel times and reducing road congestion.
Midland Health Campus Redevelopment (St John of God Midland Public & Private Hospitals Expansion)
Major expansion of the St John of God Midland Public Hospital including new mental health inpatient unit, additional operating theatres, expanded emergency department and cancer centre.

Costco Perth Airport
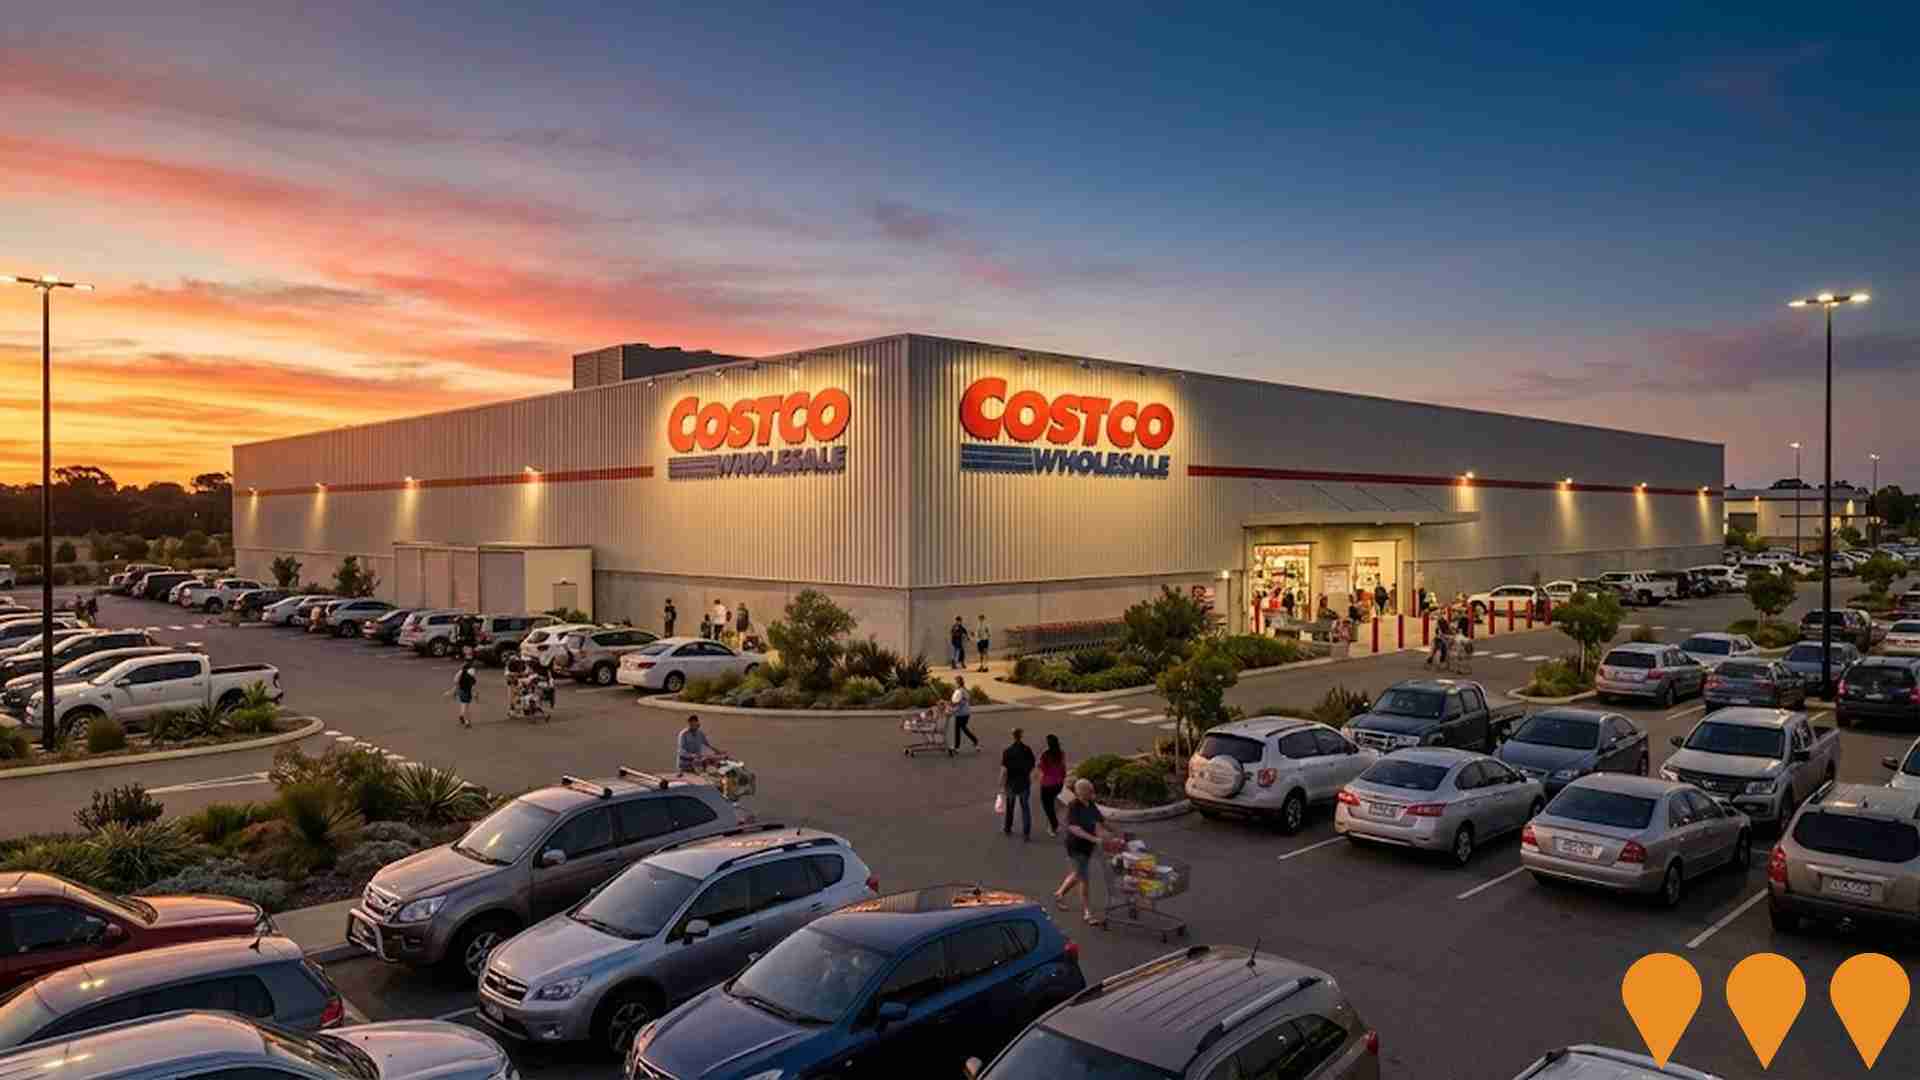
Western Australia's first Costco warehouse store, a $55 million membership-based retail facility constructed by Georgiou Group. The 14,000m2 warehouse includes optical centre, hearing aid centre, tyre centre, food court and petrol station. Part of Airport West Retail Park alongside DFO Perth. Opened in 2020, offering bulk retail goods at wholesale prices to members and creating 275 retail jobs.
Midland Redevelopment Scheme - Central Precinct (Stage 2)
Major mixed-use urban renewal precinct surrounding the new Midland Station, delivering new commercial office space, retail, hospitality, residential apartments and public realm upgrades as part of the broader METRONET East redevelopment.

Hazelmere Interchange
A 33 hectare industrial and logistics estate across multiple sites near Perth Airport, with custom built warehouses and RAV7 access. Majority of the precinct is developed and occupied by tenants including CouriersPlease, CEVA, Toll Group, Weir Minerals and Lindsay Transport, with the final 7,000sqm warehouse at 190 Adelaide Street offered for pre lease and additional workshop space at 7 Talbot Road targeted for early to mid 2026.

Forrestfield / High Wycombe Industrial Area
Industrial redevelopment precinct facilitating light industrial, logistics and transport uses with shared infrastructure upgrades funded via a Development Contribution Plan (DCP). The area is being developed under the Industrial Development zone in line with the adopted Local Structure Plan and Design Guidelines.

Tonkin Highway Corridor - Roe Highway to Kelvin Road
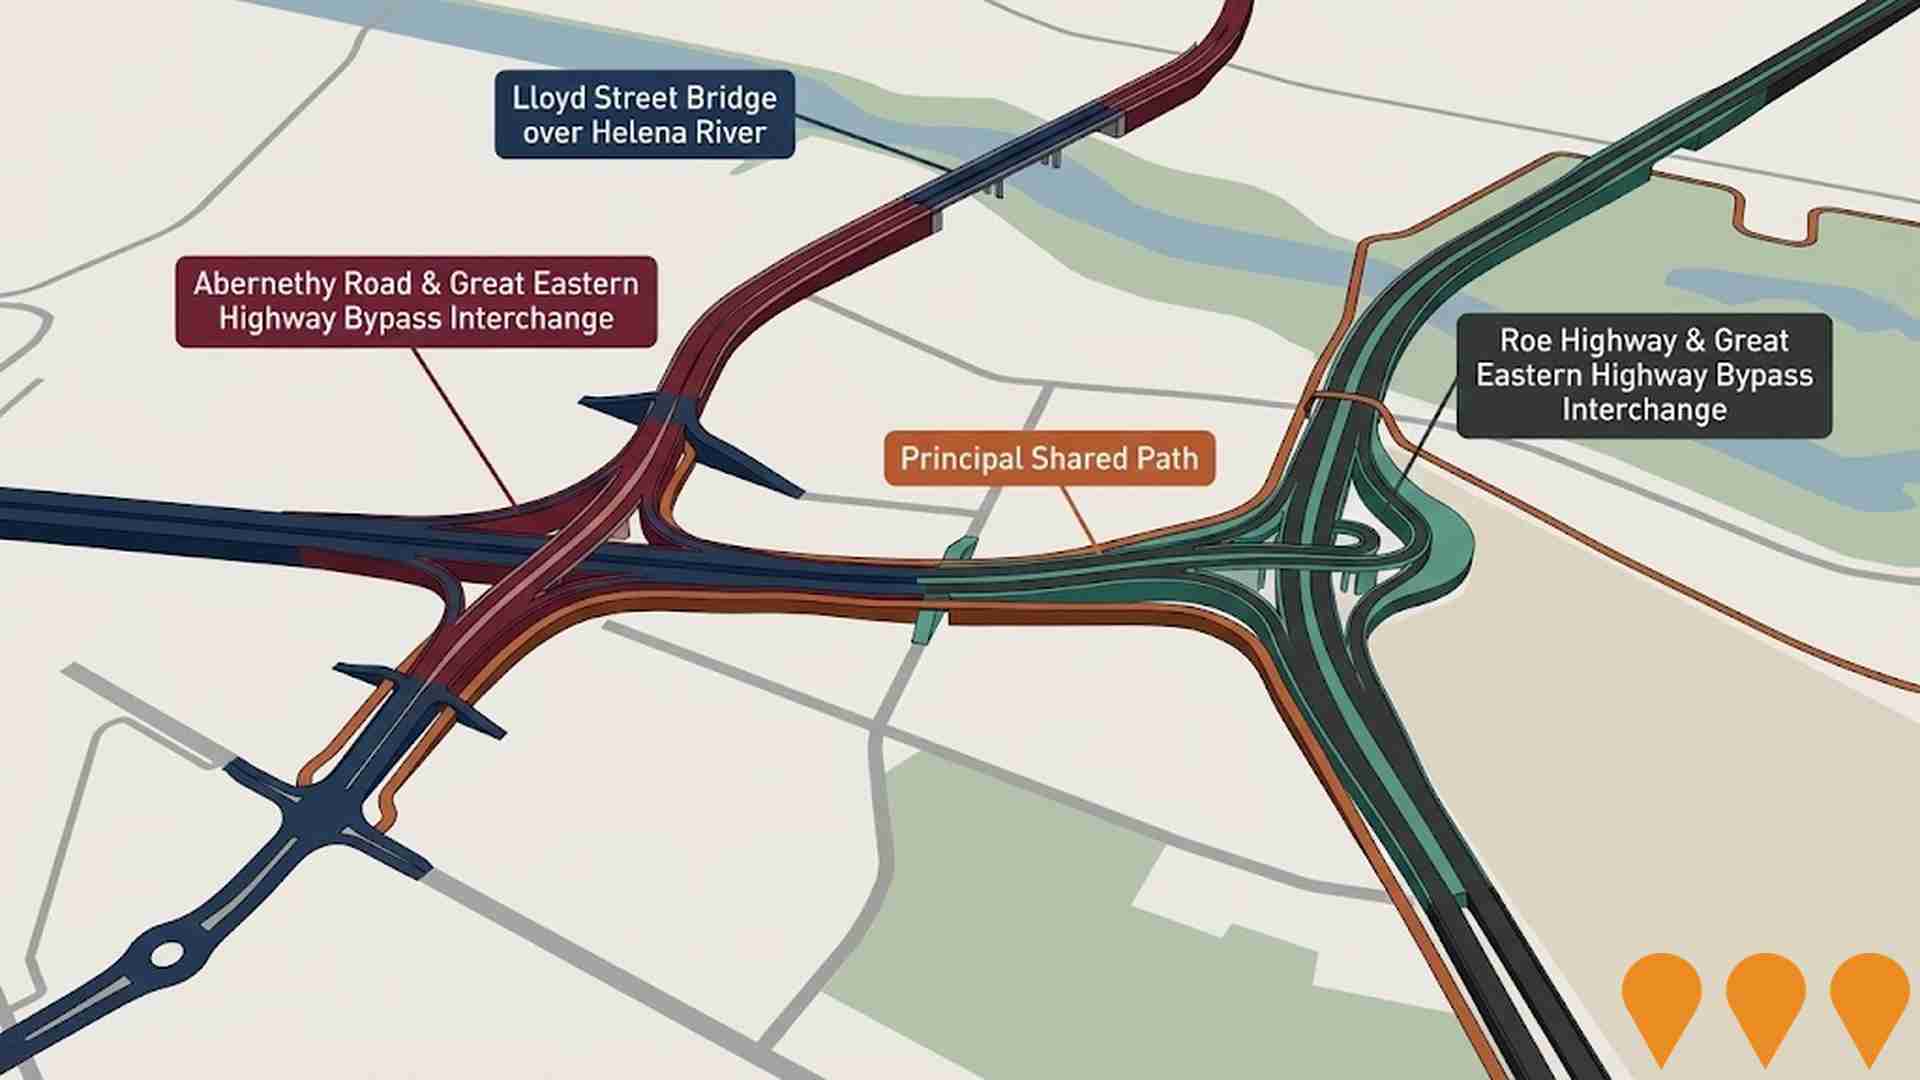
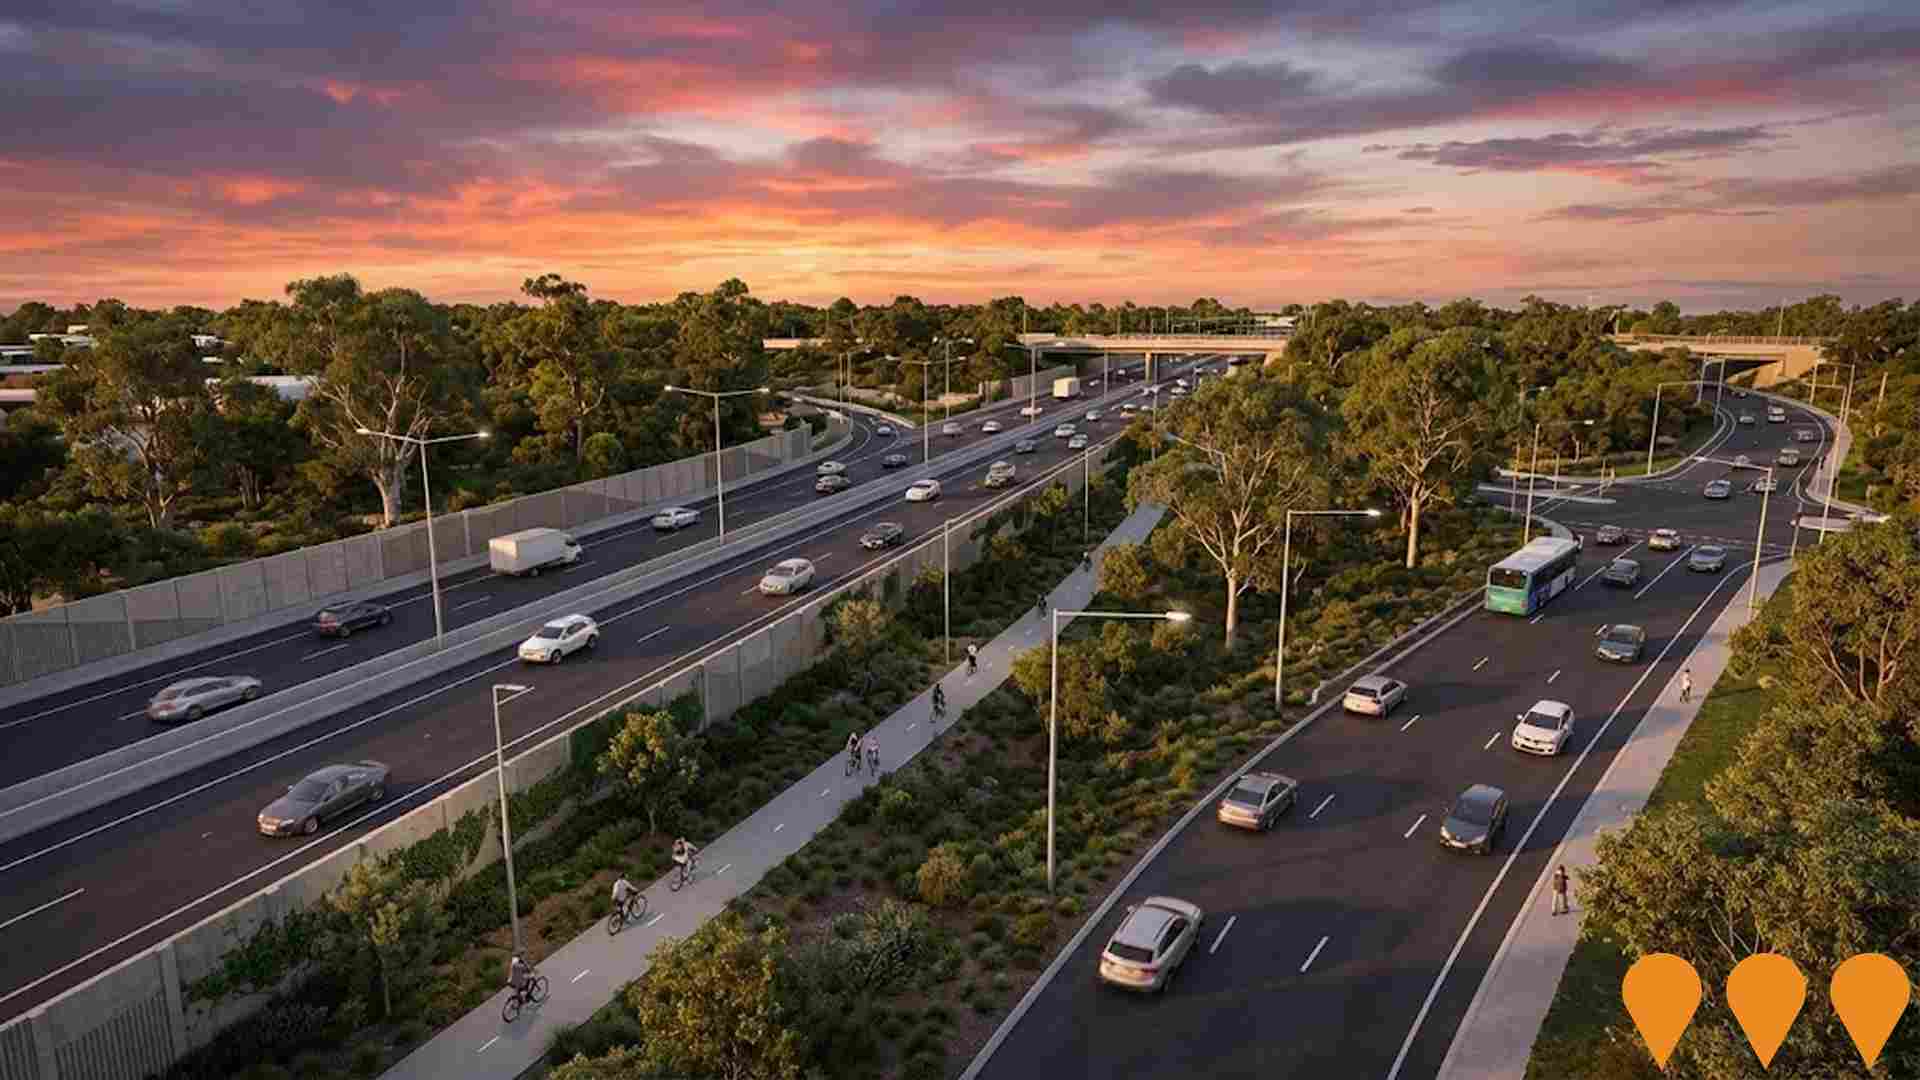
A $366 million project to upgrade Tonkin Highway between Roe Highway and Kelvin Road, delivering grade separated interchanges at Hale Road, Welshpool Road East and Kelvin Road, additional highway lanes, a new Principal Shared Path for pedestrians and cyclists, noise walls, lighting and landscaping. The project is being delivered in two packages, with the first (Hale Road to Welshpool Road East) now in procurement and construction targeted to commence in late 2025, and the Kelvin Road interchange to follow under a separate contract, subject to approvals.
Employment
Employment performance in Helena Valley - Koongamia exceeds national averages across key labour market indicators
Helena Valley - Koongamia has a skilled workforce with manufacturing and industrial sectors well-represented. As of September 2025, its unemployment rate is 3.1%, with an estimated employment growth of 2.0% over the past year.
There are 3,618 residents in work, with an unemployment rate of 0.8% below Greater Perth's rate of 4.0%. Workforce participation is similar to Greater Perth's 65.2%. The dominant employment sectors include health care & social assistance, retail trade, and construction. Mining has a particularly strong presence, with an employment share 1.3 times the regional level.
Health care & social assistance has limited presence at 11.7% compared to the regional rate of 14.8%. Employment opportunities locally appear limited, as indicated by Census data. From September 2024 to September 2025, employment levels increased by 2.0%, and labour force increased by 2.2%, causing unemployment to rise by 0.2 percentage points. In comparison, Greater Perth recorded employment growth of 2.9% and unemployment rose marginally. State-level data as of 25-Nov-25 shows WA employment contracted by 0.27%, with the state unemployment rate at 4.6%. National employment forecasts from May-25 suggest that national employment should expand by 6.6% over five years and 13.7% over ten years. Applying these projections to Helena Valley - Koongamia's employment mix suggests local employment should increase by 5.9% over five years and 12.6% over ten years, though this is a simplified extrapolation for illustrative purposes.
Frequently Asked Questions - Employment
Income
The area exhibits notably strong income performance, ranking higher than 70% of areas assessed nationally through AreaSearch analysis
The Helena Valley - Koongamia SA2 had very high national income levels according to latest ATO data aggregated by AreaSearch for financial year 2022. Its median income among taxpayers was $59,853 and average income stood at $72,973, compared to Greater Perth's figures of $58,380 and $78,020 respectively. Based on Wage Price Index growth of 14.2% since financial year 2022, current estimates would be approximately $68,352 (median) and $83,335 (average) as of September 2025. Census data shows household, family and personal incomes in Helena Valley - Koongamia cluster around the 55th percentile nationally. Income brackets indicate the $1,500 - 2,999 earnings band captures 28.0% of the community (1,815 individuals), consistent with broader trends across the metropolitan region showing 32.0% in the same category. After housing, 85.8% of income remains for other expenses and the area's SEIFA income ranking places it in the 6th decile.
Frequently Asked Questions - Income
Housing
Helena Valley - Koongamia is characterized by a predominantly suburban housing profile, with a higher proportion of rental properties than the broader region
Helena Valley - Koongamia's dwelling structures, as per the latest Census, consisted of 94.8% houses and 5.3% other dwellings (semi-detached, apartments, 'other' dwellings). This is similar to Perth metro's composition of 94.8% houses and 5.1% other dwellings. Home ownership in Helena Valley - Koongamia stood at 37.2%, with mortgaged dwellings at 47.3% and rented dwellings at 15.5%. The median monthly mortgage repayment was $1,973, higher than Perth metro's average of $1,950. The median weekly rent was $315, lower than Perth metro's $330. Nationally, Helena Valley - Koongamia's median monthly mortgage repayments were above the Australian average of $1,863, while rents were substantially below the national figure of $375.
Frequently Asked Questions - Housing
Household Composition
Helena Valley - Koongamia has a typical household mix, with a fairly typical median household size
Family households constitute 73.4% of all households, including 32.8% couples with children, 29.8% couples without children, and 10.0% single parent families. Non-family households comprise the remaining 26.6%, with lone person households at 24.1% and group households making up 2.4%. The median household size is 2.6 people, which aligns with the Greater Perth average.
Frequently Asked Questions - Households
Local Schools & Education
Educational outcomes in Helena Valley - Koongamia fall within the lower quartile nationally, indicating opportunities for improvement in qualification attainment
The area's university qualification rate is 20.1%, significantly lower than the Australian average of 30.4%. Bachelor degrees are most common (13.9%), followed by postgraduate qualifications (3.3%) and graduate diplomas (2.9%). Vocational credentials are prevalent, with 40.9% of residents aged 15+ holding them, including advanced diplomas (11.6%) and certificates (29.3%). Educational participation is high, with 25.6% currently enrolled in formal education, comprising 9.7% in primary, 6.7% in secondary, and 4.0% in tertiary education.
Educational participation is notably high, with 25.6% of residents currently enrolled in formal education. This includes 9.7% in primary education, 6.7% in secondary education, and 4.0% pursuing tertiary education.
Frequently Asked Questions - Education
Schools Detail
Nearby Services & Amenities
Transport
Transport servicing is low compared to other areas nationally based on assessment of service frequency, route connectivity and accessibility
Helena Valley - Koongamia has 39 active public transport stops. These are served by buses operating along two routes, offering a total of 226 weekly passenger trips. Residents enjoy good transport accessibility, with an average distance of 273 meters to the nearest stop.
Service frequency is 32 trips per day across all routes, translating to roughly five weekly trips per stop.
Frequently Asked Questions - Transport
Transport Stops Detail
Health
Health performance in Helena Valley - Koongamia is lower than average with common health conditions somewhat prevalent across both younger and older age cohorts
Helena Valley - Koongamia faces significant health challenges with common health conditions somewhat prevalent across both younger and older age cohorts.
The rate of private health cover is very high, at approximately 56% of the total population (~3,631 people). The most common medical conditions in the area are arthritis and mental health issues, impacting 8.6 and 8.2% of residents respectively. However, 67.4% of residents declare themselves completely clear of medical ailments, compared to 67.2% across Greater Perth. The area has 23.9% of residents aged 65 and over (1,549 people), which is higher than the 21.2% in Greater Perth.
Frequently Asked Questions - Health
Cultural Diversity
Helena Valley - Koongamia ranks below the Australian average when compared to other local markets across a number of language and cultural background related metrics
Helena Valley-Koongamia has a cultural diversity below average, with 76.7% of its population born in Australia, 90.1% being citizens, and 93.5% speaking English only at home. Christianity is the main religion, comprising 48.1%. Judaism is slightly overrepresented at 0.1%, compared to Greater Perth's 0.1%.
The top three ancestry groups are English (34.2%), Australian (27.0%), and Scottish (8.0%). Notably, Welsh (0.8%) is marginally overrepresented compared to the regional average of 0.9%, while Dutch (1.8%) and New Zealand (0.9%) have similar representation to Greater Perth's averages.
Frequently Asked Questions - Diversity
Age
Helena Valley - Koongamia's population is slightly older than the national pattern
Helena Valley - Koongamia's median age is 41 years, which is significantly higher than Greater Perth's average of 37 years and slightly older than Australia's median of 38 years. Comparing it with Greater Perth, the 75-84 age group is notably over-represented at 9.1% locally while the 25-34 year-olds are under-represented at 11.6%. According to the 2021 Census, the 75-84 age group grew from 7.1% to 9.1%, and the 85+ cohort increased from 1.5% to 2.8%. Conversely, the 45-54 cohort declined from 12.4% to 9.9%, and the 25-34 group dropped from 12.7% to 11.6%. By 2041, demographic modeling suggests Helena Valley - Koongamia's age profile will change significantly. The 75-84 cohort is projected to grow by 85%, adding 498 residents to reach 1,087. Residents aged 65 and older are expected to represent 83% of the population growth. Meanwhile, population declines are anticipated for the 5-14 and 0-4 age cohorts.

