Chart Color Schemes
This analysis uses ABS Statistical Areas Level 2 (SA2) boundaries, which can materially differ from Suburbs and Localities (SAL) even when sharing similar names.
SA2 boundaries are defined by the Australian Bureau of Statistics and are designed to represent communities for statistical reporting (e.g., census and ERP).
Suburbs and Localities (SAL) represent commonly-used suburb/locality names (postal-style areas) and may use different geographic boundaries. For comprehensive analysis, consider reviewing both boundary types if available.
est. as @ -- *
ABS ERP | -- people | --
2021 Census | -- people
Sales Activity
Curious about local property values? Filter the chart to assess the volume and appreciation (including resales) trends and regional comparisons, or scroll to the map below view this information at an individual property level.
Find a Recent Sale
Sales Detail
Population
Glen Forrest - Darlington is positioned among the lower quartile of areas assessed nationally for population growth based on AreaSearch's assessment of recent, and medium term trends
Glen Forrest - Darlington's population is approximately 7,721 as of November 2025. Between the 2021 Census and this date, there has been an increase of 498 people, representing a growth rate of 6.9%. The 2021 Census reported a population of 7,223. This change is inferred from the estimated resident population of 7,697 in June 2024 and an additional 11 validated new addresses since the Census date. The current population density is around 136 persons per square kilometer. Overseas migration contributed approximately 61.2% of overall population gains during recent periods.
AreaSearch's projections for Glen Forrest - Darlington are based on ABS/Geoscience Australia data released in 2024, with a base year of 2022. For areas not covered by this data and to estimate growth post-2032, AreaSearch uses growth rates by age cohort provided by the ABS in its latest Greater Capital Region projections (released in 2023, based on 2022 data). By 2041, Glen Forrest - Darlington's population is expected to increase by approximately 327 persons, reflecting a total increase of 3.9% over the 17-year period.
Frequently Asked Questions - Population
Development
Residential development activity is lower than average in Glen Forrest - Darlington according to AreaSearch's national comparison of local real estate markets
Glen Forrest - Darlington has recorded approximately eight residential properties granted approval each year over the past five financial years, totalling forty homes. As of FY26, two approvals have been recorded to date. On average, 8.7 people have moved to the area annually for each dwelling built between FY21 and FY25, indicating significant demand outpacing supply, which typically influences prices upwards and intensifies competition among buyers. The average construction cost of new homes is $410,000, suggesting developers target the premium market segment with higher-end properties.
This financial year has seen $3.0 million in commercial approvals registered, reflecting the area's primarily residential nature. Compared to Greater Perth, Glen Forrest - Darlington records notably lower building activity, 76.0% below the regional average per person, which usually reinforces demand and pricing for existing dwellings. This is also below national averages, possibly due to planning constraints or the area's maturity. Recent development has been exclusively detached dwellings, maintaining the area's low density nature and attracting space-seeking buyers. The estimated population count of 1743 people per dwelling approval reflects its quiet development environment.
AreaSearch's latest quarterly estimate forecasts Glen Forrest - Darlington will gain 303 residents by 2041. Building activity appears to be keeping pace with growth projections, though heightened competition may arise as the population grows.
Frequently Asked Questions - Development
Infrastructure
Glen Forrest - Darlington has limited levels of nearby infrastructure activity, ranking in the 10thth percentile nationally
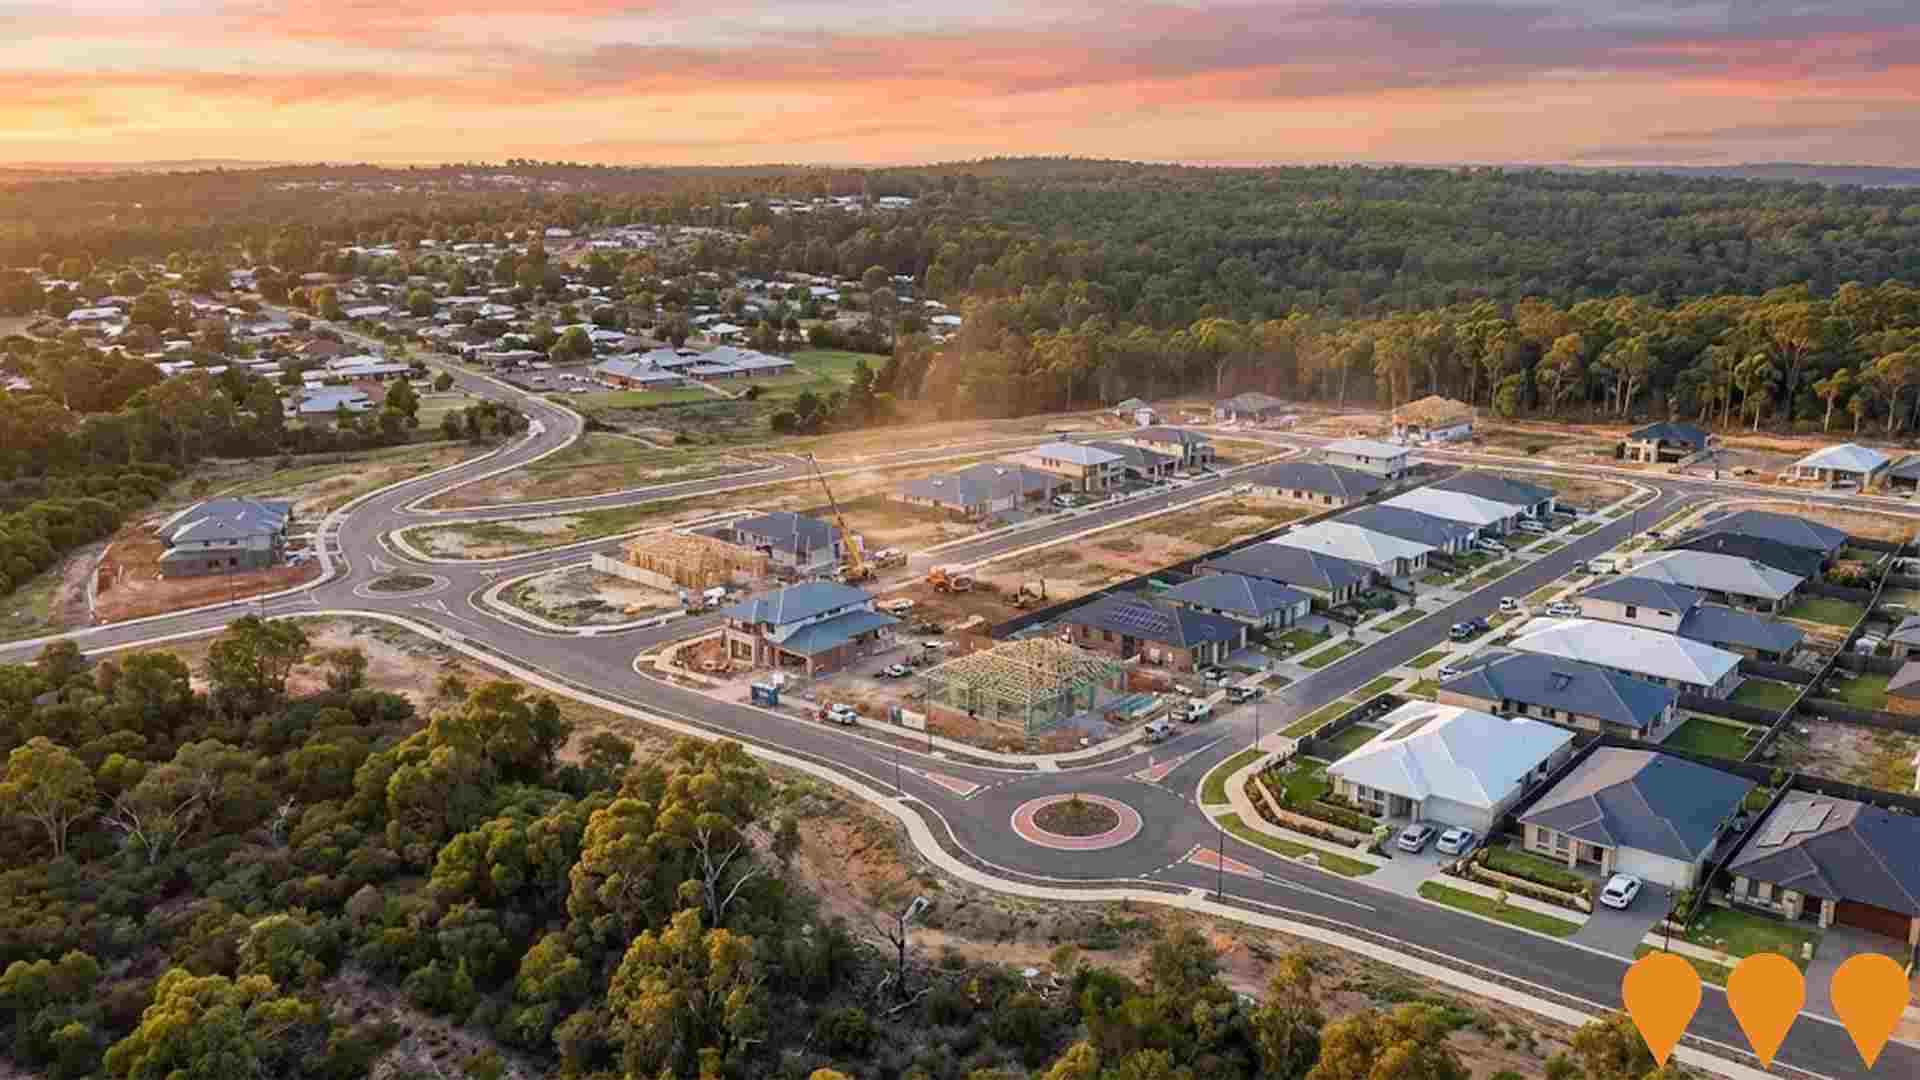
Changes to local infrastructure significantly impact an area's performance. AreaSearch has identified three projects likely to affect this region. Notable projects include The Vines Swan View, Swan View Rise, Altrove Swan View, and City of Swan Water and Wastewater Upgrades. Below is a list detailing those most relevant.
Professional plan users can use the search below to filter and access additional projects.
INFRASTRUCTURE SEARCH
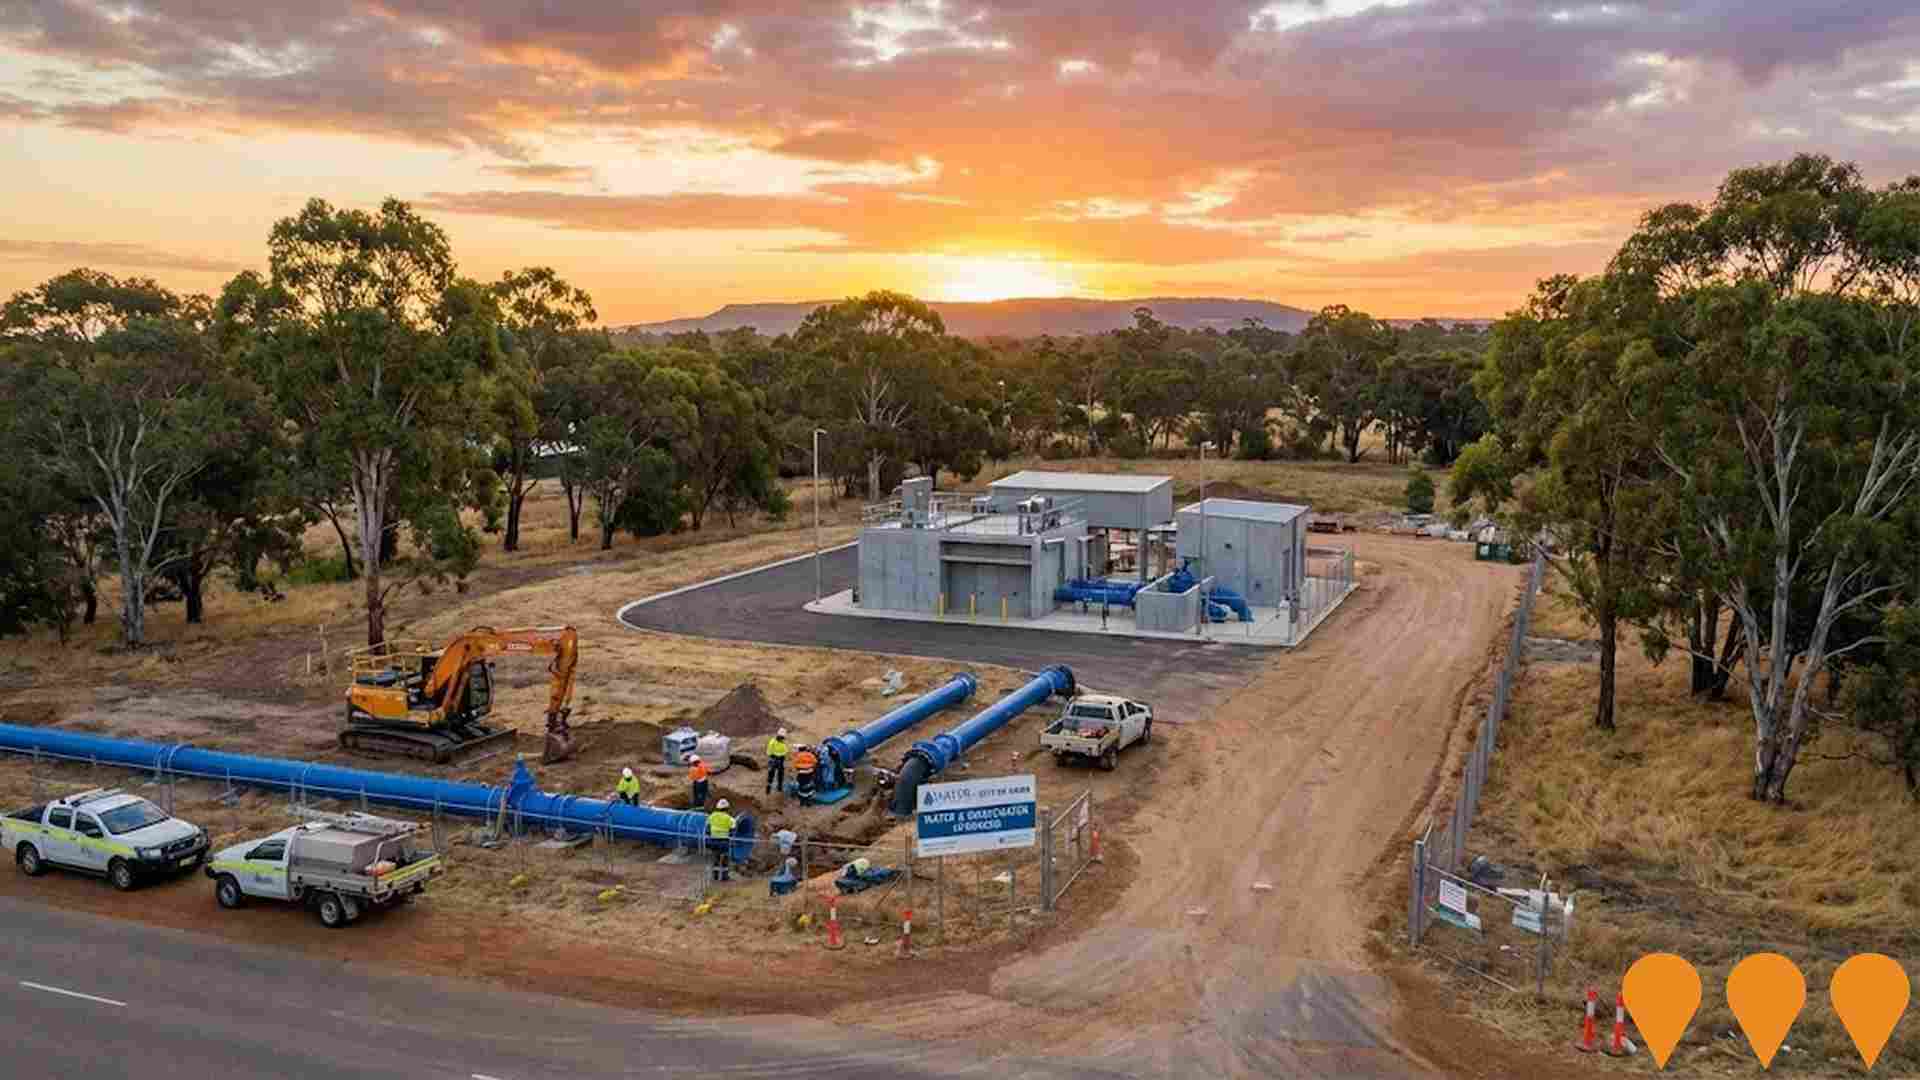
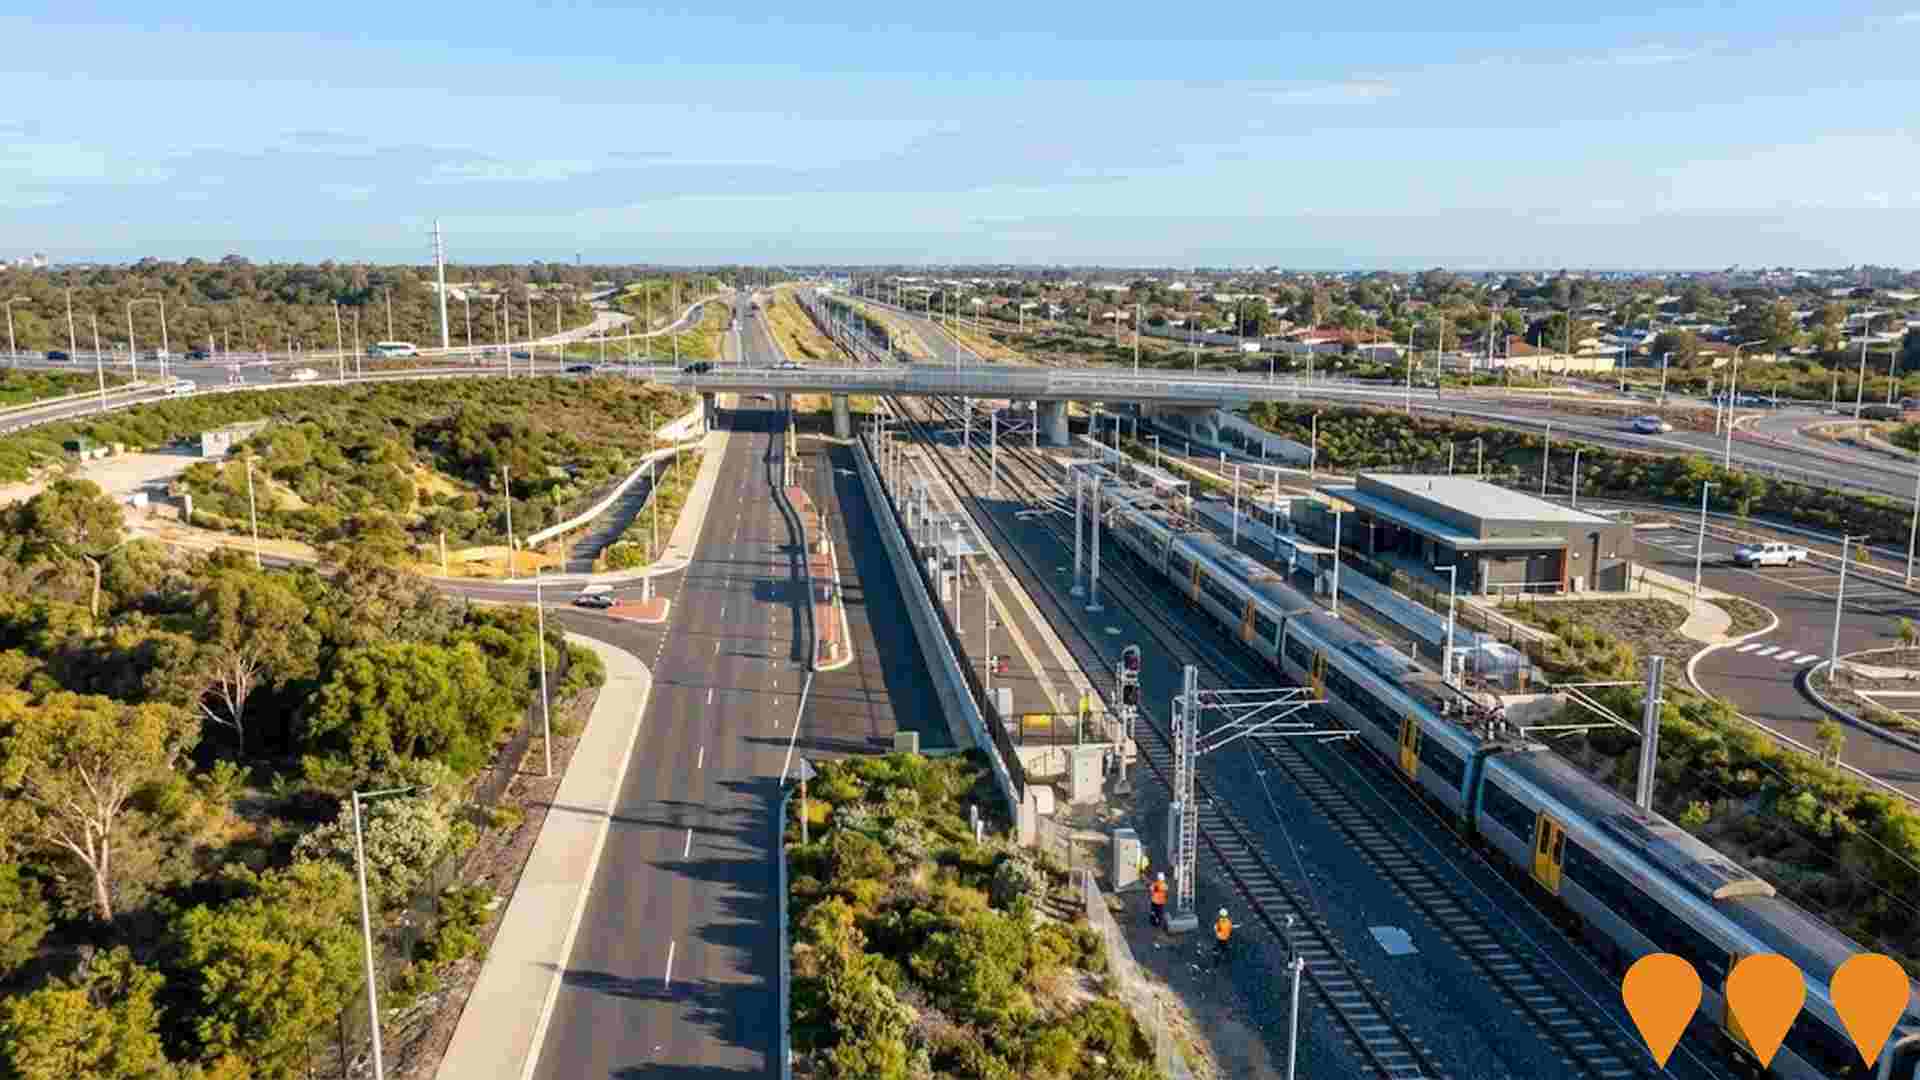
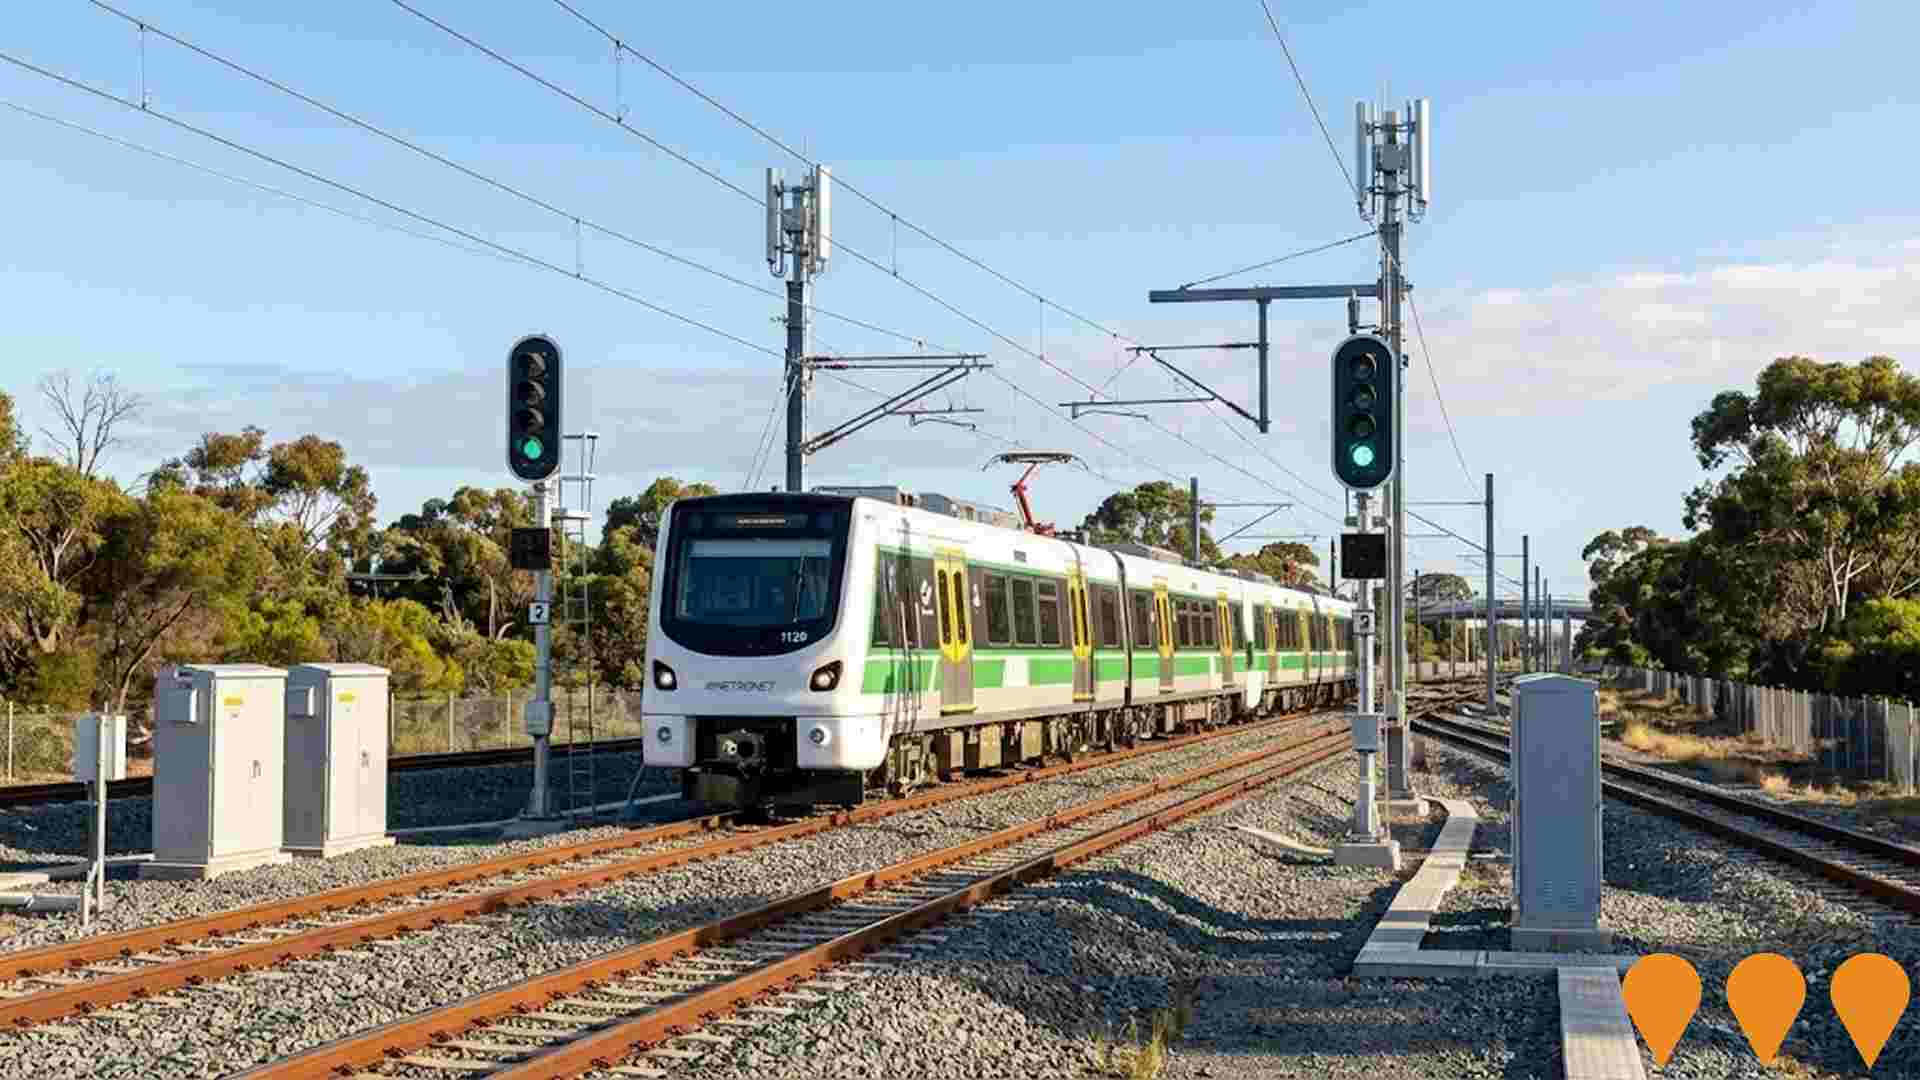
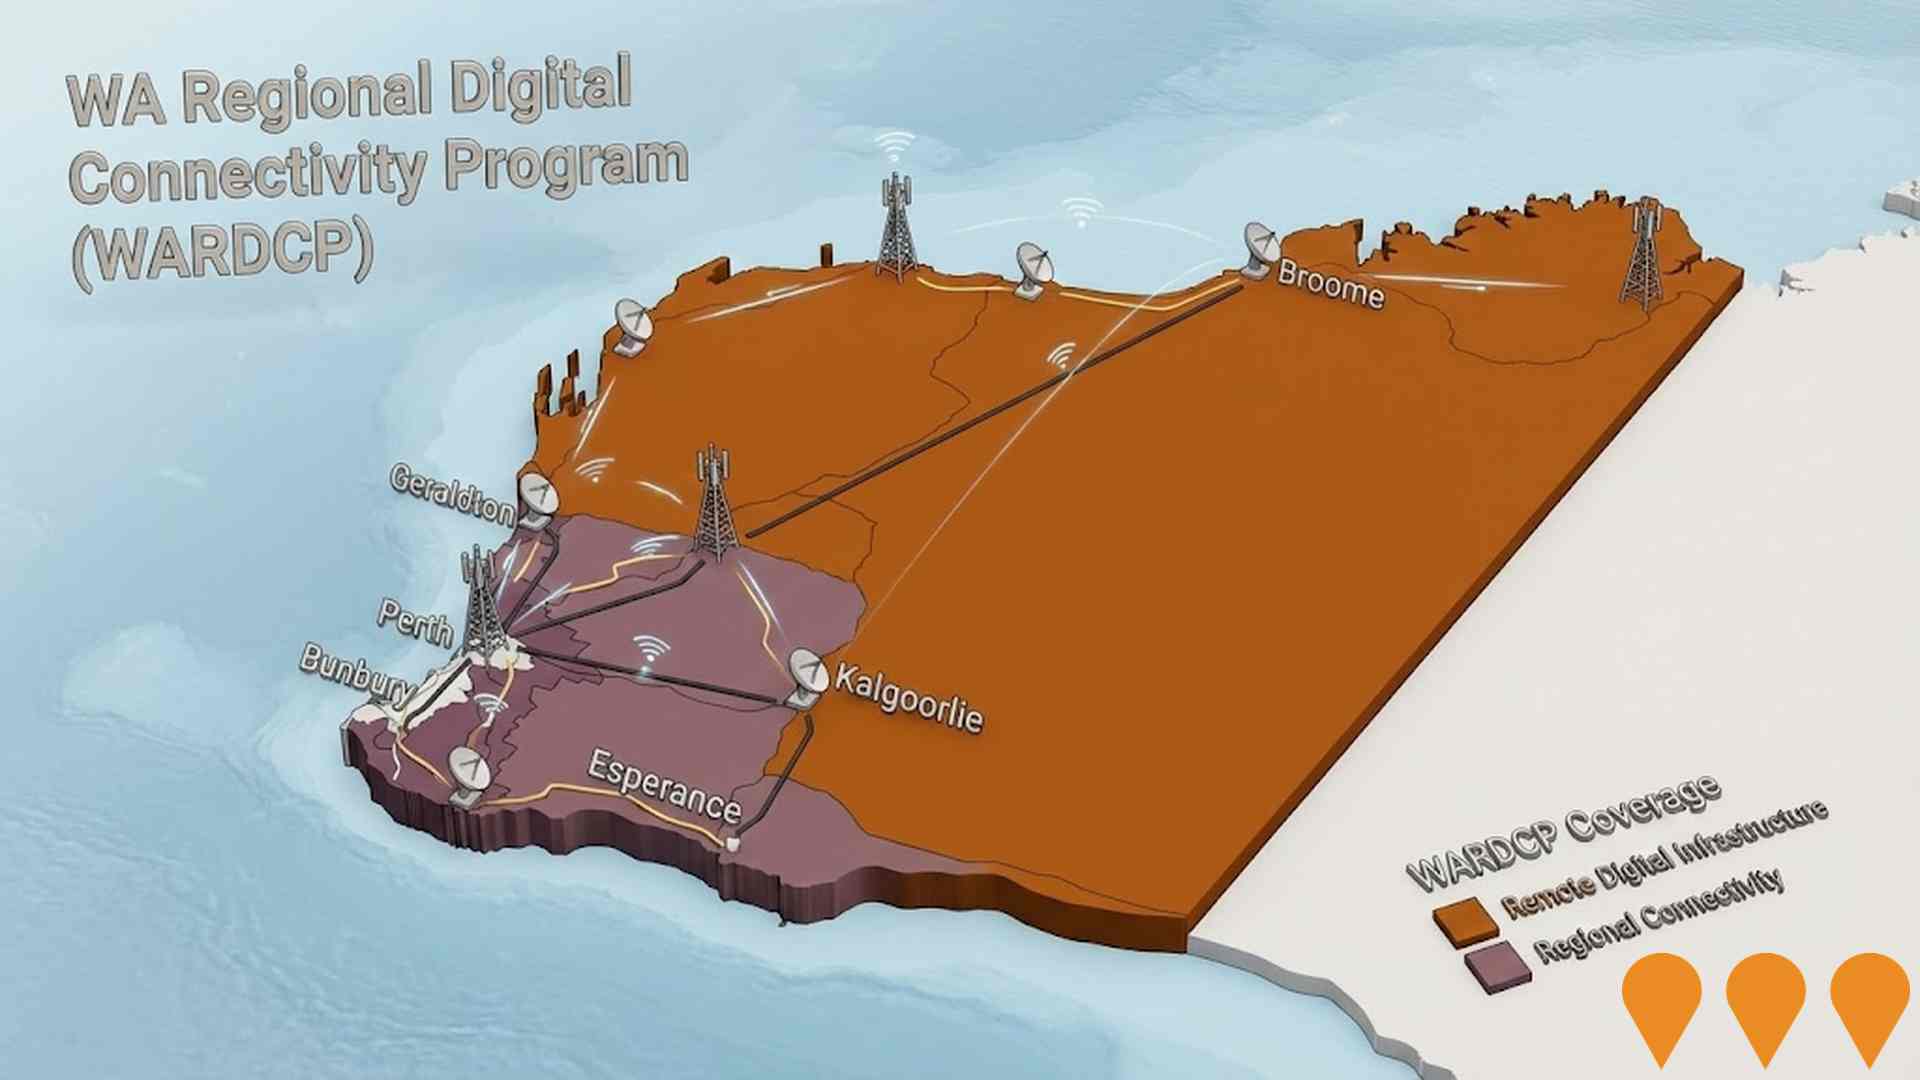
 Denotes AI-based impression for illustrative purposes only, not to be taken as definitive under any circumstances. Please follow links and conduct other investigations from the project's source for actual imagery. Developers and project owners wishing us to use original imagery please Contact Us and we will do so.
Frequently Asked Questions - Infrastructure
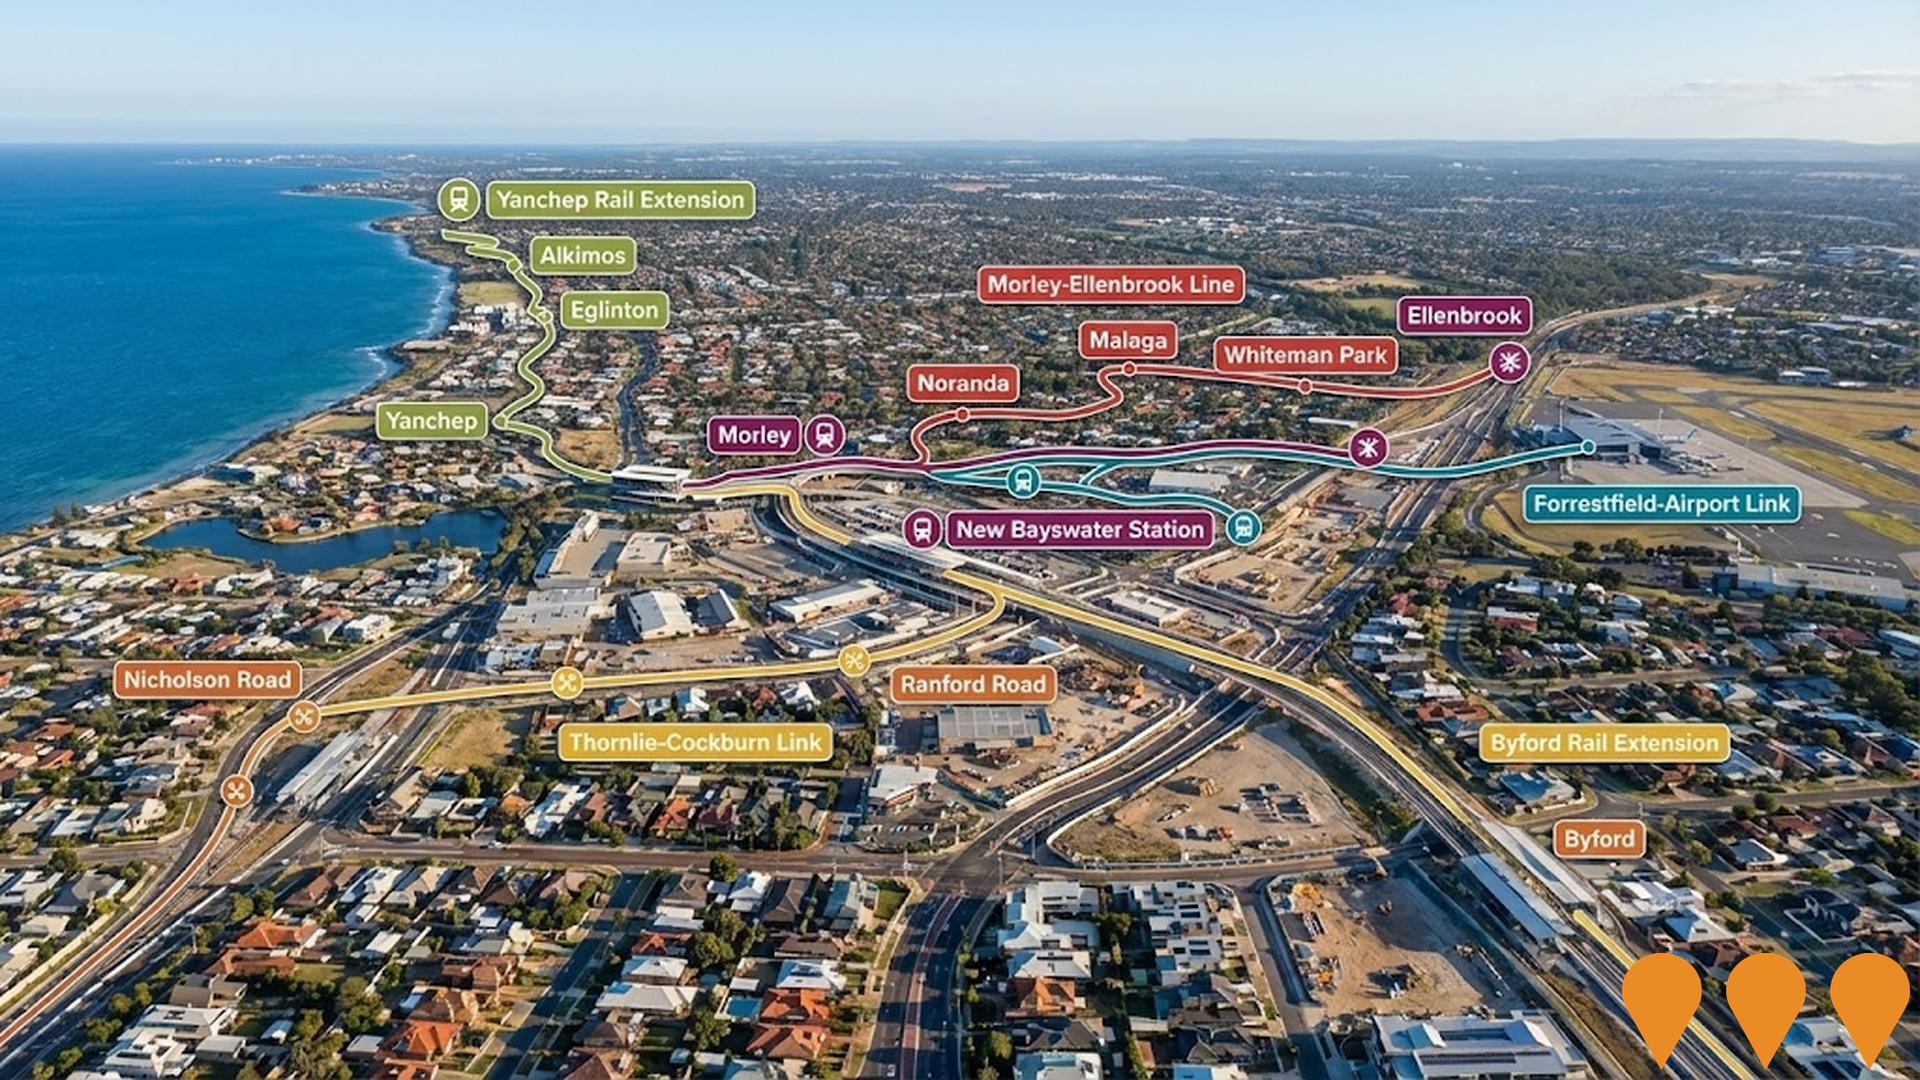
METRONET
METRONET is Western Australia's largest-ever public transport infrastructure program, delivering over 72 kilometres of new passenger rail and 23 new stations across the Perth metropolitan area. As of December 2025, multiple stages are complete or nearing completion: Yanchep Rail Extension (opened July 2024), Morley-Ellenbrook Line (opened December 2024), Thornlie-Cockburn Link (opened June 2025), and Byford Rail Extension (opened October 2025). Remaining projects including the Airport Line upgrades, Victoria Park-Canning Level Crossing Removal (six crossings removed by late 2025), Circle Route Bus Priority, and final stages of the Ellenbrook Line are under active construction, with the overall program on track for substantial completion by 2027-2028. The program also includes 246 locally built C-series railcars, high-capacity signalling, and extensive station precinct activation.
City of Swan Water and Wastewater Upgrades
Major water and wastewater infrastructure upgrades across the City of Swan to support continued population growth in Perths north-eastern corridor. Works include new and upgraded water mains, wastewater pressure mains, pump stations and storage tanks to improve supply reliability and capacity.
METRONET High Capacity Signalling Project
City wide upgrade of Perth's urban rail signalling and train control systems to a communications based train control automatic train control system across about 500 km of the Transperth network, increasing capacity by up to 40 percent and supporting more frequent, reliable METRONET passenger services. Works include new in cab signalling, trackside equipment, integration with the Public Transport Operations Control Centre and digital radio, delivered progressively over about a decade.
METRONET High Capacity Signalling Program
The High Capacity Signalling Project will upgrade the existing signalling and control systems to an integrated communications-based train control system, making better use of the existing rail network by allowing more trains to run more often. The project aims to increase network capacity by 40 percent, provide energy-saving benefits, enhance cybersecurity, and future-proof the network for growth.
WA Regional Digital Connectivity Program (WARDCP)
Statewide co-investment program delivering new and upgraded mobile, fixed wireless and broadband infrastructure to improve reliability, coverage and performance for regional and remote Western Australia. Current workstreams include the Regional Telecommunications Project, State Agriculture Telecommunications Infrastructure Fund, and the WA Regional Digital Connectivity Program (WARDCP).
Altrove Swan View
Altrove Swan View is a completed master planned residential estate by Satterley in the Perth Hills, delivering around 400 house and land lots with local parks, walking trails and convenient access to the Swan View town centre and nearby services.
EastLink WA
Whole-of-corridor upgrade to deliver a safer and more efficient route between Perth and Northam, combining upgrades to Reid and Roe Highways with the Perth-Adelaide National Highway (Orange Route) concept from Roe Highway to Gidgegannup and on to Northam. Planning and development for the corridor has been completed, including an Ultimate Design Concept to 2051 and identification of future land requirements. Construction funding is currently committed for associated Reid Highway interchanges (Altone Road and Daviot/Drumpellier Drive, 2025-2027) and a future Henley Brook Avenue interchange; the broader EastLink WA mainline remains subject to business case and future funding decisions.
The Vines Swan View
The Vines Swan View is a boutique house and land estate by LWP Property Group, delivering about 120 residential lots on an elevated site off Marlborough Road in Swan View with views across the Swan Valley and Perth Hills. Civil works and home construction are underway, with lots being released and built out progressively through to around 2026.

Employment
AreaSearch analysis of employment trends sees Glen Forrest - Darlington performing better than 90% of local markets assessed across Australia
Glen Forrest - Darlington has a well-educated workforce. Key sectors include education & training, health care & social assistance, professional & technical services.
As of September 2025, unemployment rate is 1.6%, with estimated employment growth of 1.8% over the past year. There are 4,462 residents in work, and unemployment rate is 2.4% below Greater Perth's rate of 4.0%. Workforce participation is on par with Greater Perth's 65.2%. The area has notable concentration in education & training, at 1.5 times the regional average.
Conversely, accommodation & food services show lower representation at 4.5%, compared to the regional average of 6.8%. Employment opportunities locally appear limited based on Census data analysis. Between September 2024 and September 2025, employment levels increased by 1.8% while labour force grew by 2.0%, causing unemployment rate to rise by 0.1 percentage points. Greater Perth recorded higher employment growth of 2.9%. State-level data as of 25-Nov-25 shows WA employment contracted by 0.27%, with state unemployment rate at 4.6% compared to the national rate of 4.3%. National employment forecasts from May-25 project a 6.6% increase over five years and 13.7% over ten years. Applying these projections to Glen Forrest - Darlington's employment mix, local employment is estimated to increase by 6.3% over five years and 13.4% over ten years.
Frequently Asked Questions - Employment
Income
Income metrics indicate excellent economic conditions, with the area achieving higher performance than 75% of national locations assessed by AreaSearch
Glen Forrest - Darlington SA2 had an extremely high national income level according to latest ATO data aggregated by AreaSearch for financial year 2022. Its median income among taxpayers was $60,112 and average income stood at $85,665, compared to Greater Perth's figures of $58,380 and $78,020 respectively. As of September 2025, estimated current incomes would be approximately $68,648 (median) and $97,829 (average), based on Wage Price Index growth of 14.2% since financial year 2022. According to 2021 Census figures, household, family and personal incomes in Glen Forrest - Darlington ranked highly nationally, between the 69th and 82nd percentiles. Income distribution data showed that the $1,500 - 2,999 bracket dominated with 29.8% of residents (2,300 people), mirroring regional levels where 32.0% occupied this bracket. Glen Forrest - Darlington demonstrated considerable affluence with 36.0% earning over $3,000 per week, supporting premium retail and service offerings. After housing costs, residents retained 88.5% of income, reflecting strong purchasing power. The area's SEIFA income ranking placed it in the 8th decile.
Frequently Asked Questions - Income
Housing
Glen Forrest - Darlington is characterized by a predominantly suburban housing profile, with above-average rates of outright home ownership
In Glen Forrest - Darlington, as per the latest Census, 98.7% of dwellings were houses, with the remaining 1.3% being semi-detached, apartments, or other types. This is higher than Perth metro's house percentage of 94.8%. Home ownership in Glen Forrest - Darlington stood at 42.4%, with mortgaged properties at 51.3% and rented dwellings at 6.2%. The median monthly mortgage repayment was $2,015, higher than Perth metro's average of $1,950. The median weekly rent in Glen Forrest - Darlington was $400, compared to Perth metro's $330. Nationally, Glen Forrest - Darlington's mortgage repayments were above the Australian average of $1,863, and rents exceeded the national figure of $375.
Frequently Asked Questions - Housing
Household Composition
Glen Forrest - Darlington features high concentrations of family households, with a higher-than-average median household size
Family households constitute 81.6% of all households, including 39.4% couples with children, 32.6% couples without children, and 8.6% single parent families. Non-family households comprise the remaining 18.4%, with lone person households at 17.0% and group households making up 1.6%. The median household size is 2.7 people, which is larger than the Greater Perth average of 2.6.
Frequently Asked Questions - Households
Local Schools & Education
Educational achievement in Glen Forrest - Darlington places it within the top 10% nationally, reflecting strong academic performance and high qualification levels across the community
Educational attainment in Glen Forrest - Darlington shows a significant advantage with 37.3% of residents aged 15 and above holding university qualifications compared to the broader SA3 area at 21.3% and the SA4 region at 24.3%. Bachelor degrees are most prevalent at 24.3%, followed by postgraduate qualifications (8.3%) and graduate diplomas (4.7%). Vocational credentials are also prominent, with 34.0% of residents aged 15 and above holding such qualifications – advanced diplomas accounting for 13.0% and certificates for 21.0%. Educational participation is notably high in the area, with 29.5% of residents currently enrolled in formal education.
This includes 10.1% in primary education, 9.1% in secondary education, and 4.9% pursuing tertiary education.
Frequently Asked Questions - Education
Schools Detail
Nearby Services & Amenities
Transport
Transport servicing is low compared to other areas nationally based on assessment of service frequency, route connectivity and accessibility
Glen Forrest - Darlington has 84 active public transport stops. These are all bus stops. Four routes service these stops, offering a total of 378 weekly passenger trips.
Transport accessibility is moderate, with residents located an average of 450 meters from the nearest stop. Buses run approximately 54 times per day across all routes, translating to about four weekly trips per individual stop.
Frequently Asked Questions - Transport
Transport Stops Detail
Health
The level of general health in Glen Forrest - Darlington is notably higher than the national average with both young and old age cohorts seeing low prevalence of common health conditions
Glen Forrest - Darlington exhibits superior health outcomes, with both younger and older age groups showing low prevalence of common health conditions. Approximately 63% of its total population (4,887 people) has private health cover, higher than Greater Perth's 56.3%, and the national average of 55.3%. The most prevalent medical conditions in the area are arthritis and mental health issues, affecting 8.6% and 8.4% of residents respectively.
Notably, 70.1% of residents report no medical ailments, compared to 67.2% across Greater Perth. The area has a higher proportion of seniors aged 65 and over at 22.4% (1,733 people), compared to Greater Perth's 21.2%. Health outcomes among seniors in Glen Forrest - Darlington are particularly strong, outperforming the general population in health metrics.
Frequently Asked Questions - Health
Cultural Diversity
In terms of cultural diversity, Glen Forrest - Darlington records figures broadly comparable to the national average, as found in AreaSearch's assessment of a number of language and cultural background related metrics
Glen Forrest-Darlington's population is predominantly Australian-born, with 71.8%. Citizenship stands at 90.9%, and English-only speakers account for 94.4%. Christianity is the dominant religion, practiced by 39.0% of residents.
Judaism, however, is more prevalent in Glen Forrest-Darlington than Greater Perth, representing 0.4% versus 0.1%. The top three parental ancestry groups are English (35.7%), Australian (25.6%), and Scottish (8.1%). Notable ethnic group disparities include Welsh (1.1%, compared to regional 0.9%), Dutch (2.5%, compared to regional 2.0%), and Polish (1.1%, compared to regional 0.8%).
Frequently Asked Questions - Diversity
Age
Glen Forrest - Darlington hosts a notably older demographic compared to the national average
The median age in Glen Forrest - Darlington is 45 years, which is significantly higher than Greater Perth's average of 37 years and Australia's national average of 38 years. Compared to Greater Perth, Glen Forrest - Darlington has a higher proportion of residents aged 55-64 (15.4%) but fewer residents aged 25-34 (6.3%). According to the 2021 Census, the 75-84 age group increased from 6.5% to 8.2% of the population, while the 45-54 age cohort decreased from 15.6% to 14.3%. By 2041, demographic projections indicate significant shifts in Glen Forrest - Darlington's age structure. The 75-84 age group is projected to grow by 47%, reaching 931 people from 632. Notably, the combined 65+ age groups will account for 92% of total population growth, reflecting the area's aging demographic profile. In contrast, both the 25-34 and 0-4 age groups are projected to decrease in number.
