Chart Color Schemes
This analysis uses ABS Statistical Areas Level 2 (SA2) boundaries, which can materially differ from Suburbs and Localities (SAL) even when sharing similar names.
SA2 boundaries are defined by the Australian Bureau of Statistics and are designed to represent communities for statistical reporting (e.g., census and ERP).
Suburbs and Localities (SAL) represent commonly-used suburb/locality names (postal-style areas) and may use different geographic boundaries. For comprehensive analysis, consider reviewing both boundary types if available.
est. as @ -- *
ABS ERP | -- people | --
2021 Census | -- people
Sales Activity
Curious about local property values? Filter the chart to assess the volume and appreciation (including resales) trends and regional comparisons, or scroll to the map below view this information at an individual property level.
Find a Recent Sale
Sales Detail
Population
Population growth drivers in Mulgrave are slightly above average based on AreaSearch's ranking of recent, and medium term trends
Mulgrave's population is approximately 21,303 as of November 2025. This figure represents an increase of 1,414 people since the 2021 Census, which reported a population of 19,889. The growth is inferred from ABS estimated resident population data of 20,981 in June 2024 and validated new addresses since the Census date. This results in a population density of 1,987 persons per square kilometer, higher than the national average assessed by AreaSearch. Mulgrave's 7.1% growth rate since the census is within 1.8 percentage points of the national average of 8.9%, indicating strong growth fundamentals. Overseas migration contributed approximately 91.2% of overall population gains recently.
AreaSearch uses ABS/Geoscience Australia projections released in 2024, with a base year of 2022 for each SA2 area. For areas not covered by this data, AreaSearch employs VIC State Government's Regional/LGA projections from 2023, adjusted using weighted aggregation methods. Growth rates by age group are applied across all areas for years 2032 to 2041. Future population dynamics project above median growth, with Mulgrave expected to expand by 4,788 persons by 2041 based on latest annual ERP population numbers, reflecting a total gain of 21.0% over the 17 years.
Frequently Asked Questions - Population
Development
Recent residential development output has been above average within Mulgrave when compared nationally
Mulgrave recorded approximately 128 residential properties granted approval annually. Over the past five financial years, from FY-21 to FY-25644 homes were approved, with an additional 34 approved in FY-26 so far. The average number of people moving to the area per dwelling built over these years was 0.5.
New construction has been matching or outpacing demand, providing more options for buyers and enabling population growth that may exceed current expectations. The average expected construction cost value of new properties is $375,000. This financial year has seen $187.2 million in commercial approvals, indicating strong commercial development momentum. Compared to Greater Melbourne, Mulgrave has slightly more development, 18.0% above the regional average per person over the five-year period, maintaining good buyer choice while supporting existing property values. New building activity shows 36.0% detached dwellings and 64.0% medium and high-density housing.
This focus on higher-density living creates more affordable entry points, suiting downsizers, investors, and first-home buyers. This represents a notable shift from the area's existing housing composition of 83.0% houses, indicating decreasing availability of developable sites and reflecting changing lifestyles and the need for more diverse, affordable housing options. Mulgrave reflects a transitioning market with around 219 people per approval. Looking ahead, Mulgrave is expected to grow by 4,466 residents through to 2041, according to the latest AreaSearch quarterly estimate. Building activity is keeping pace with growth projections, though buyers may experience heightened competition as the population grows.
Frequently Asked Questions - Development
Infrastructure
Mulgrave has moderate levels of nearby infrastructure activity, ranking in the 45thth percentile nationally
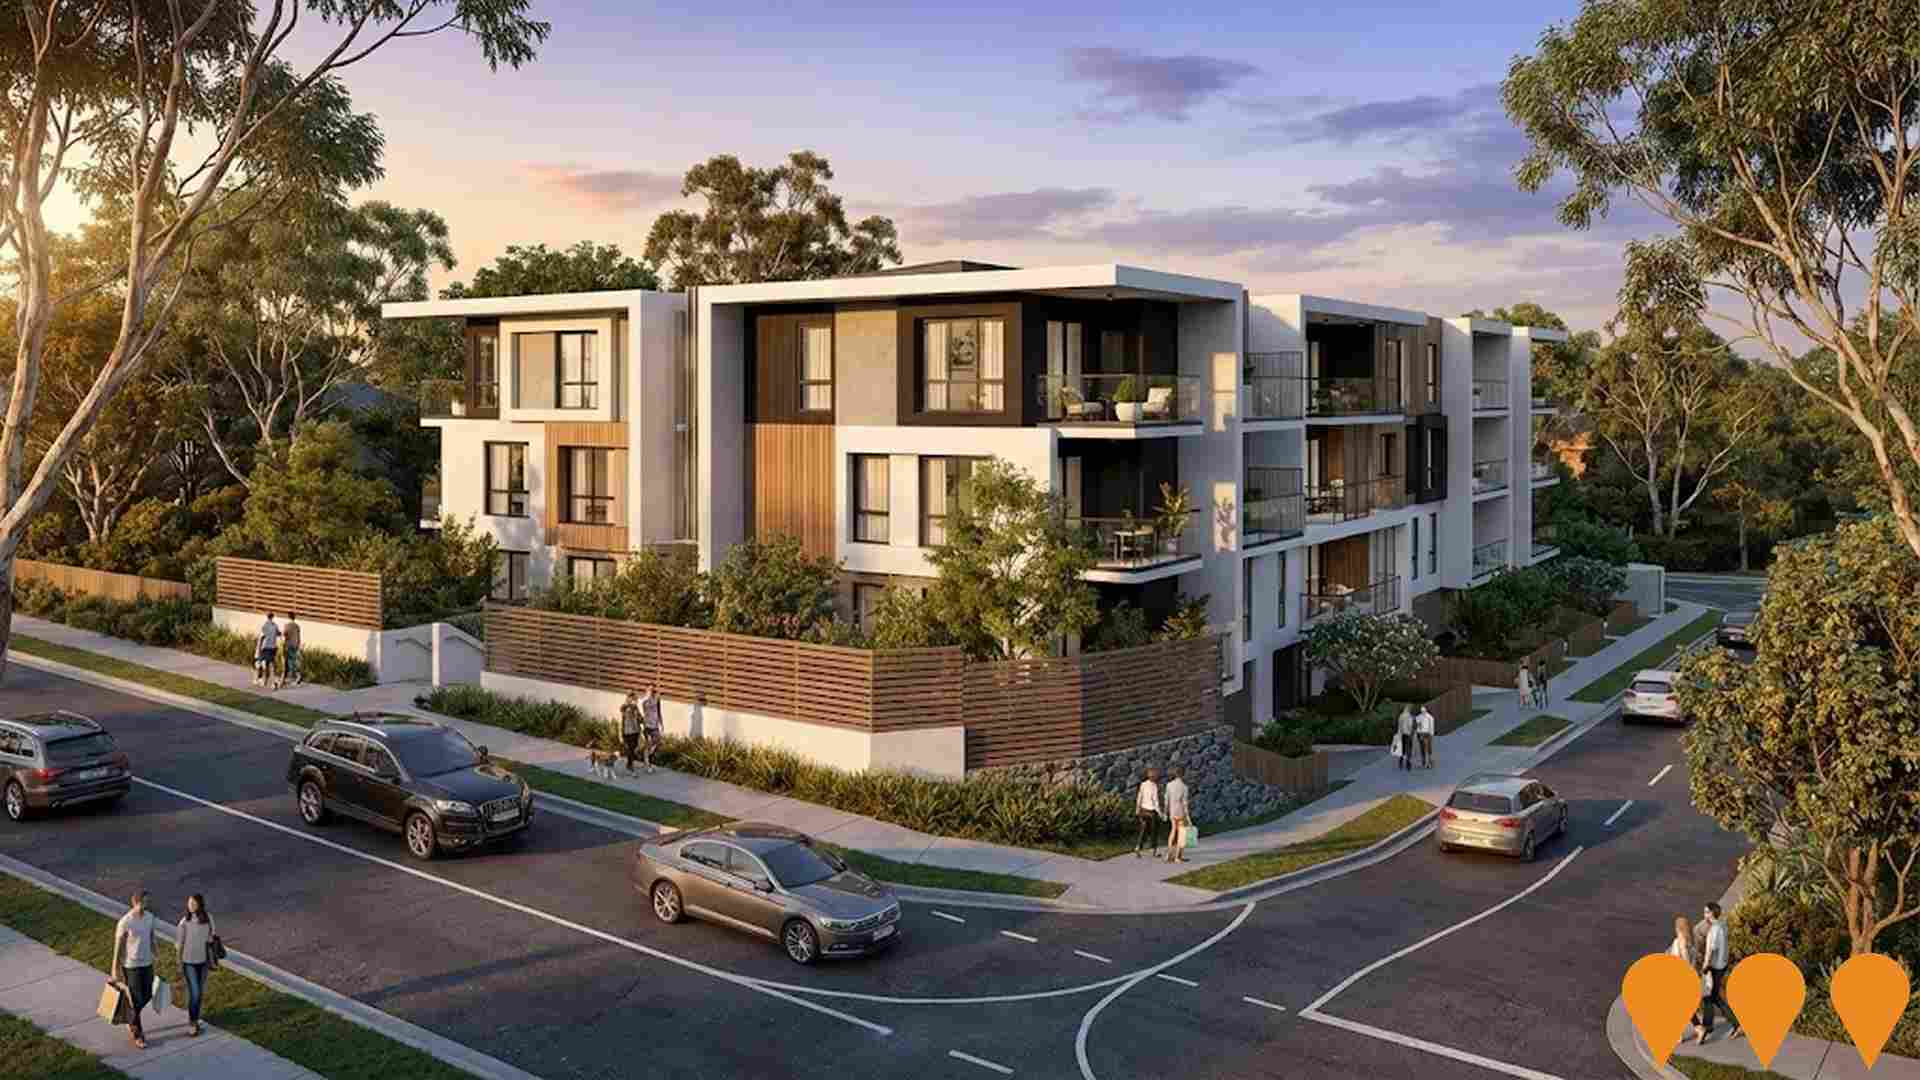
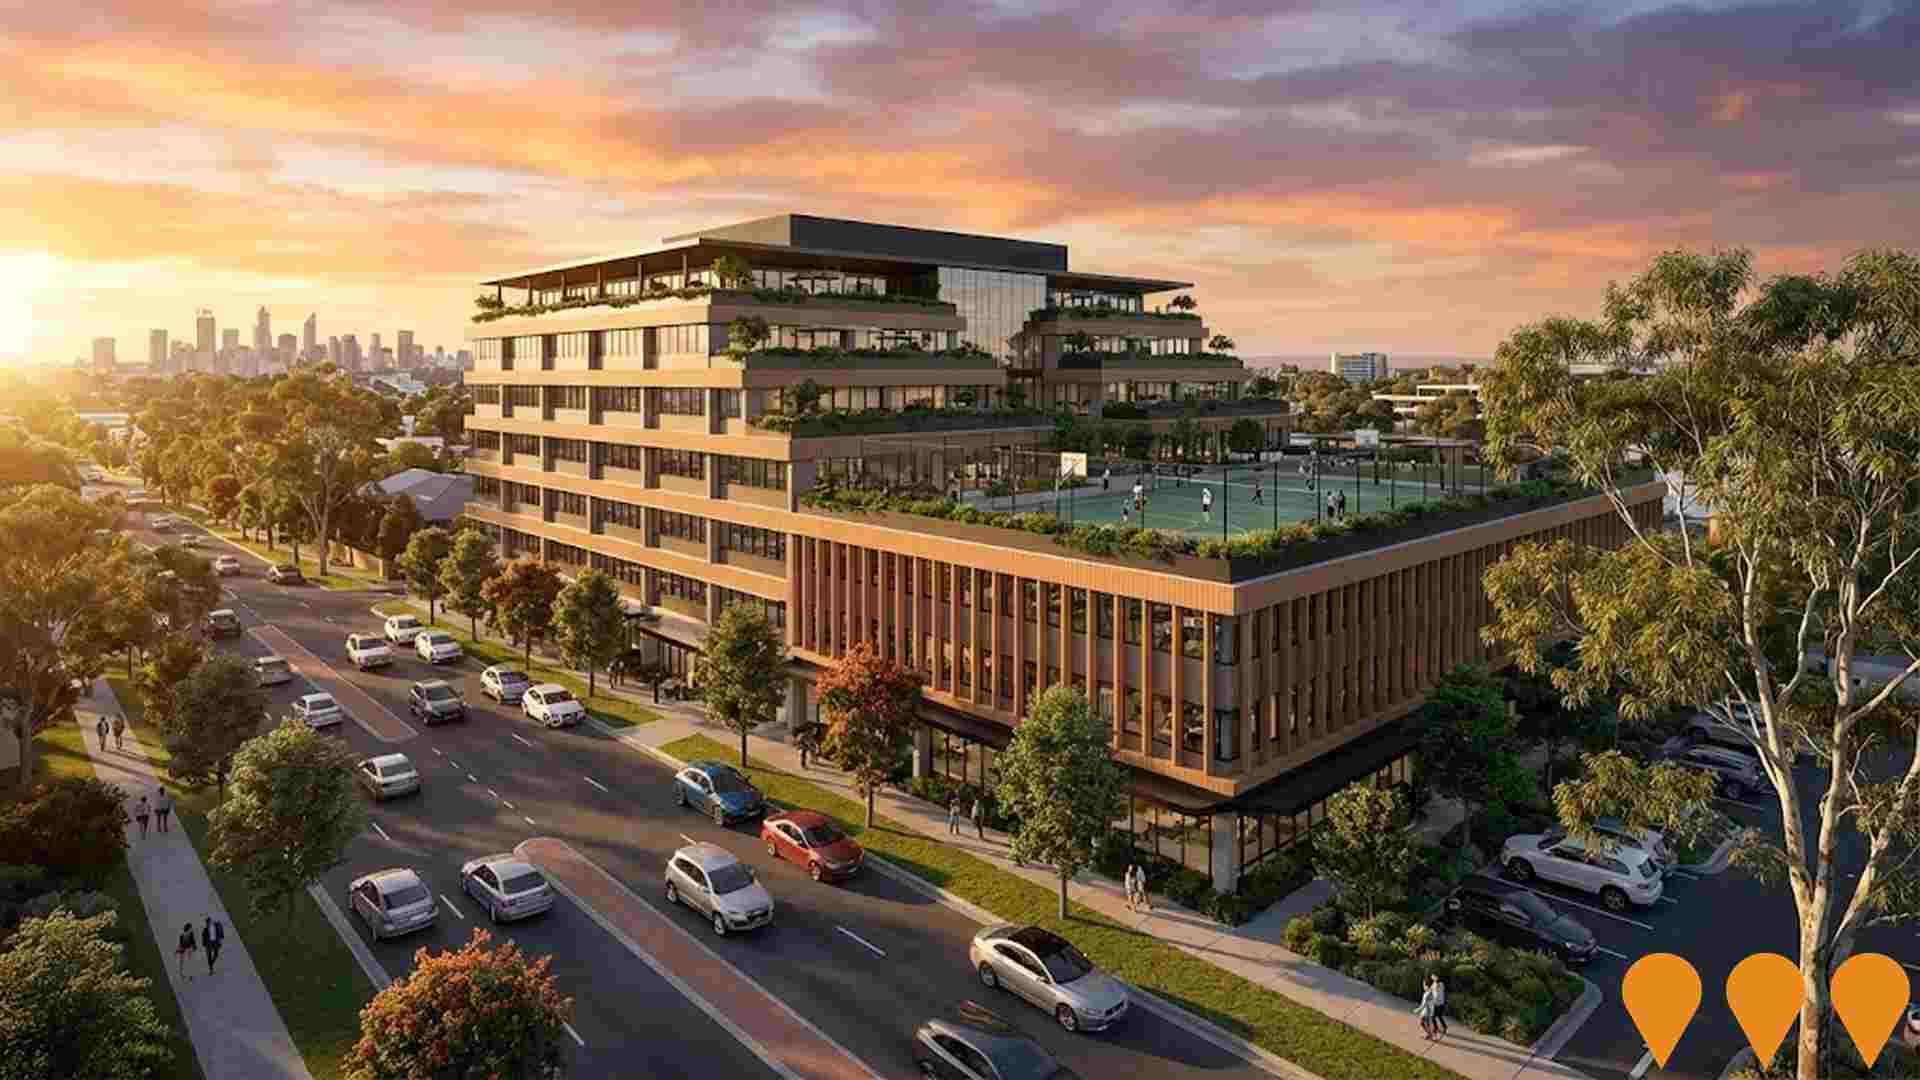
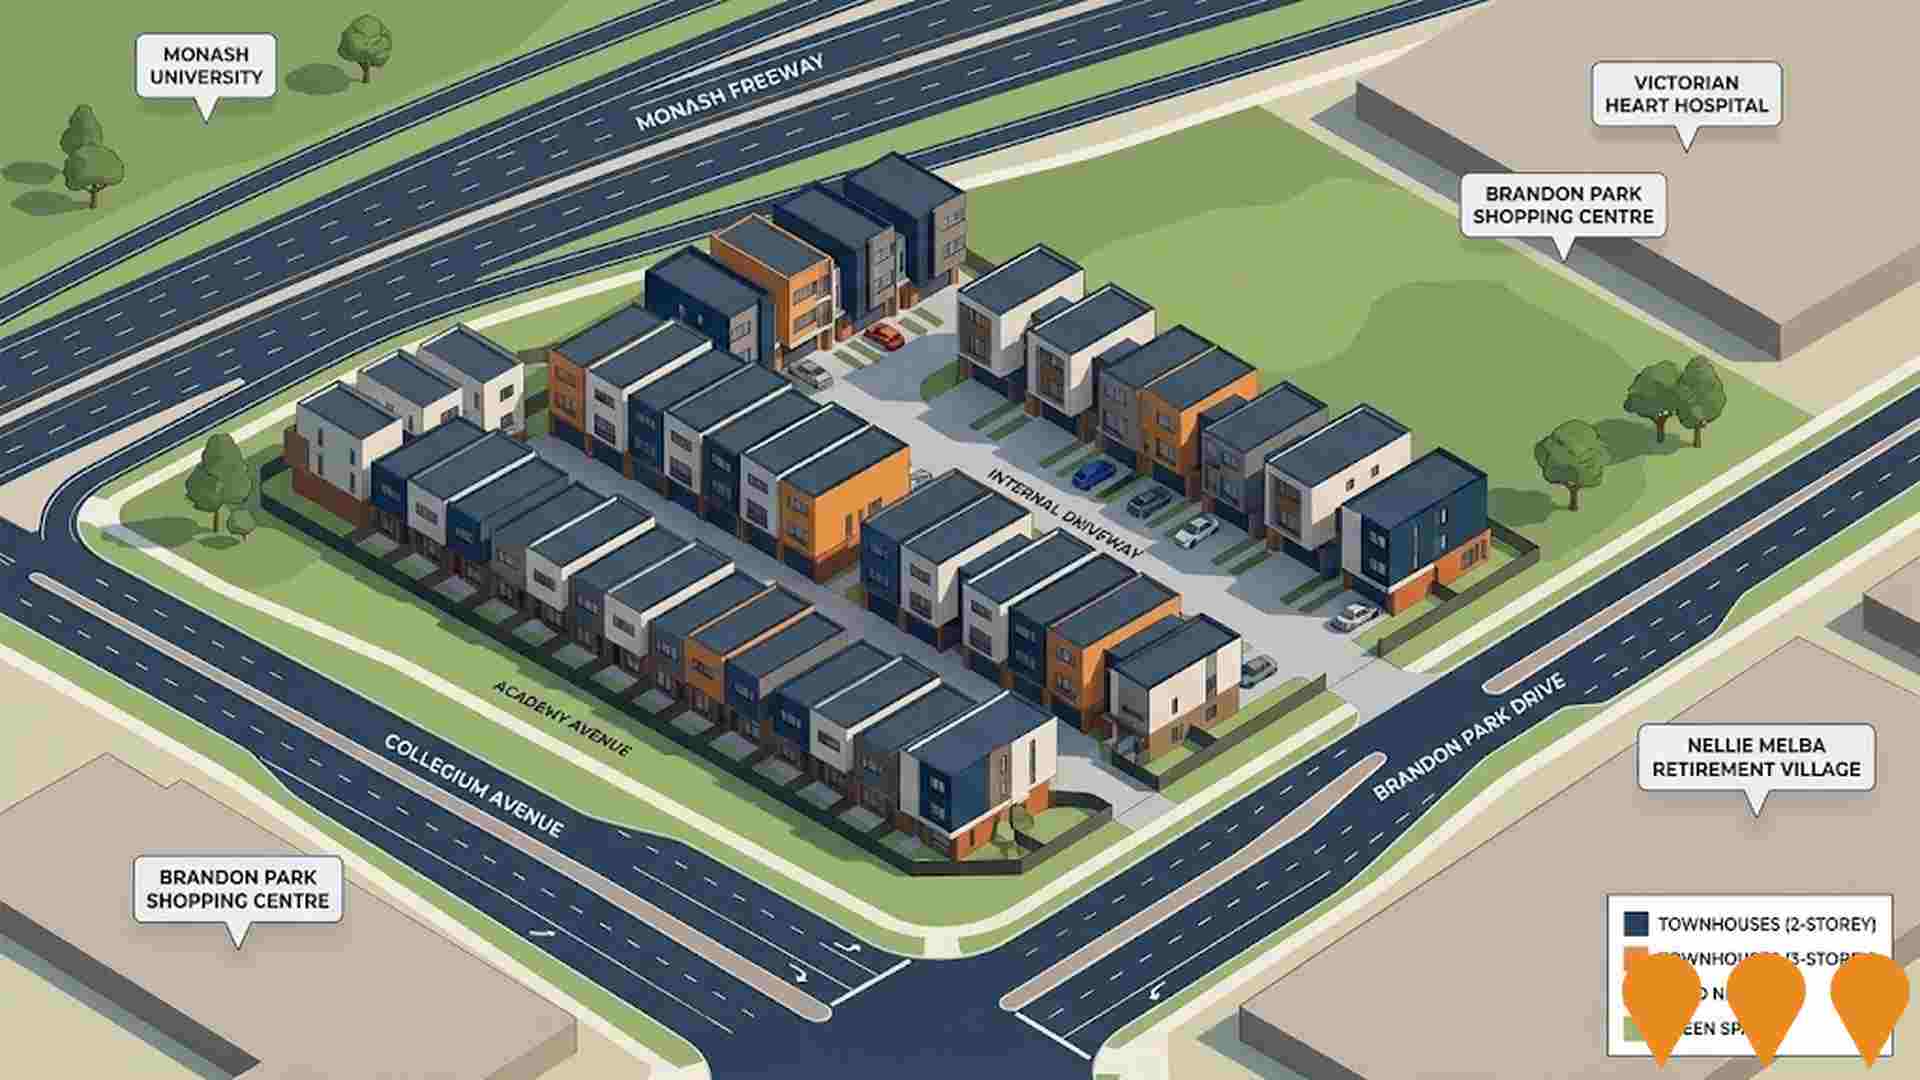
Changes to local infrastructure significantly influence an area's performance. AreaSearch has identified a total of 14 projects likely to impact the area. Notable ones include HomeCo Brandon Park Redevelopment, Nexus Corporate Park, Collegium Avenue Townhouses, and 855-869 Ferntree Gully Road Townhouses. The following list details those most relevant.
Professional plan users can use the search below to filter and access additional projects.
INFRASTRUCTURE SEARCH
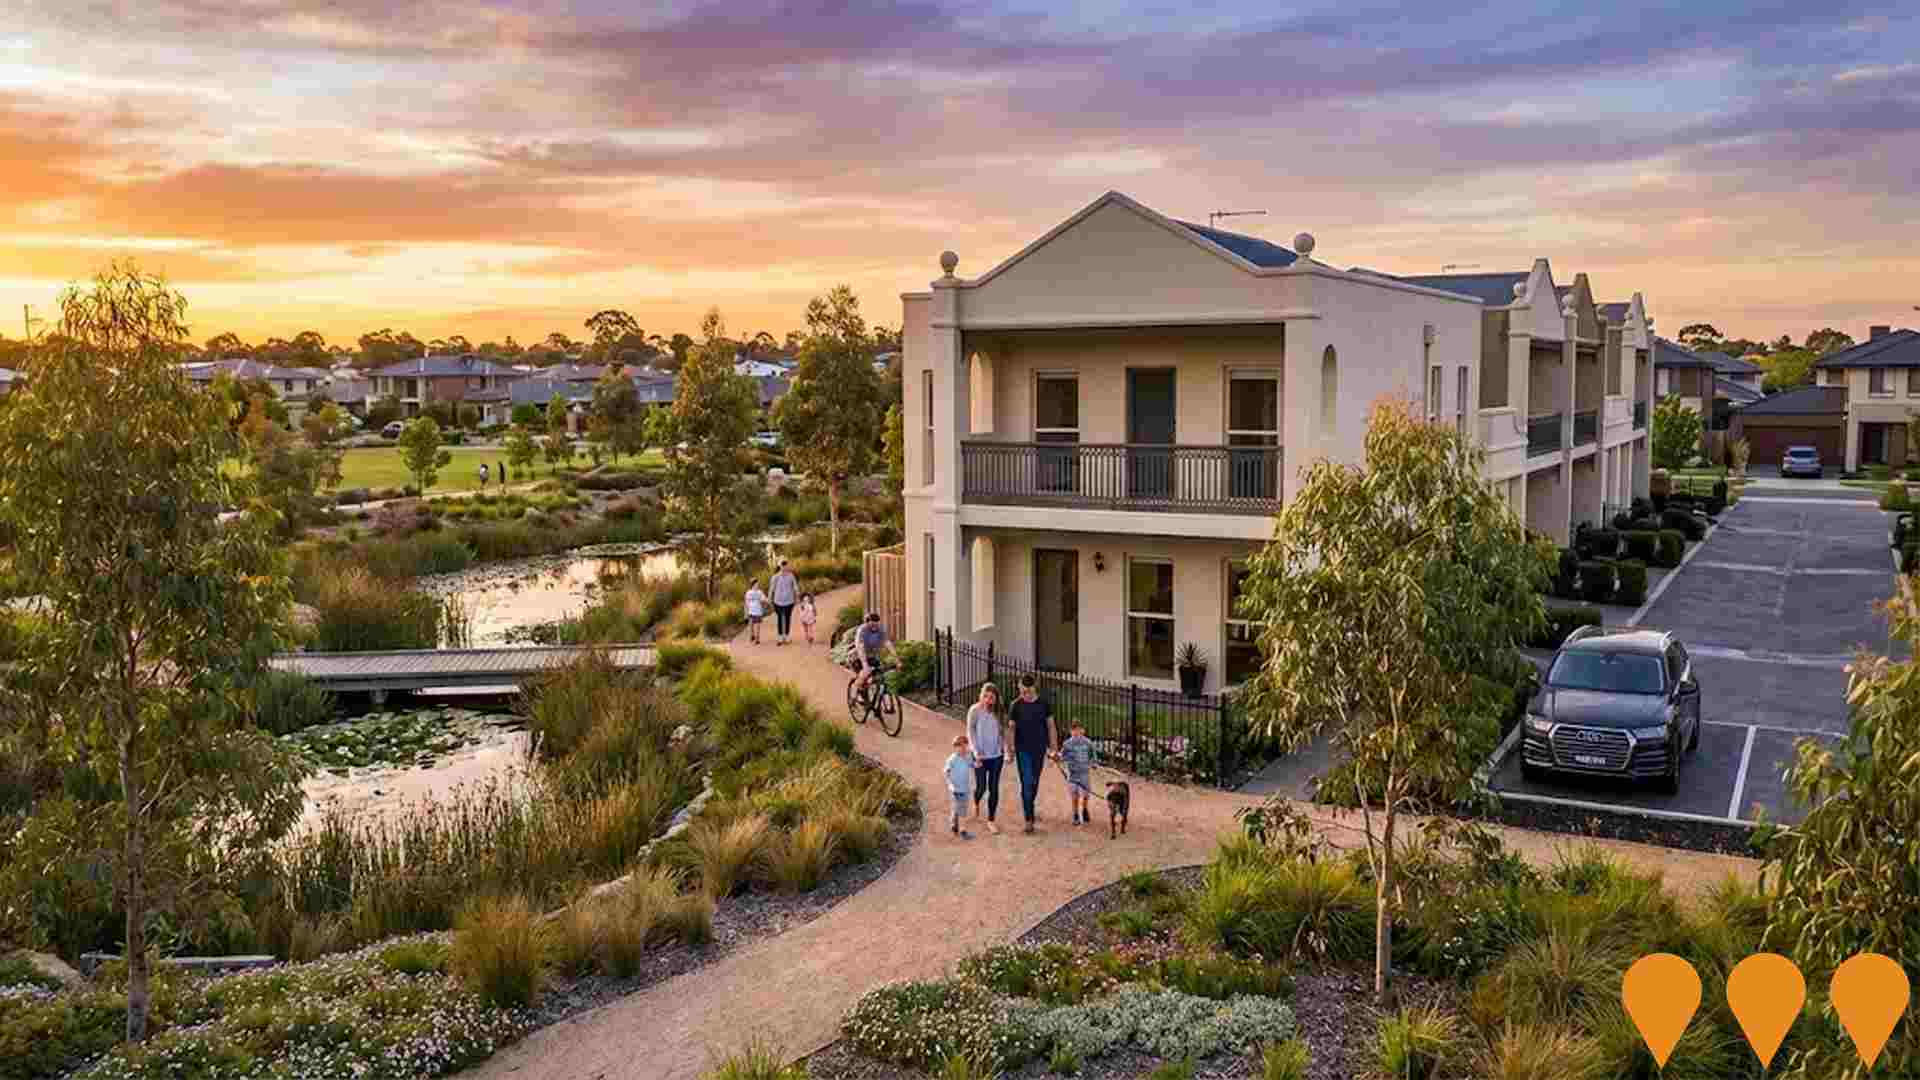
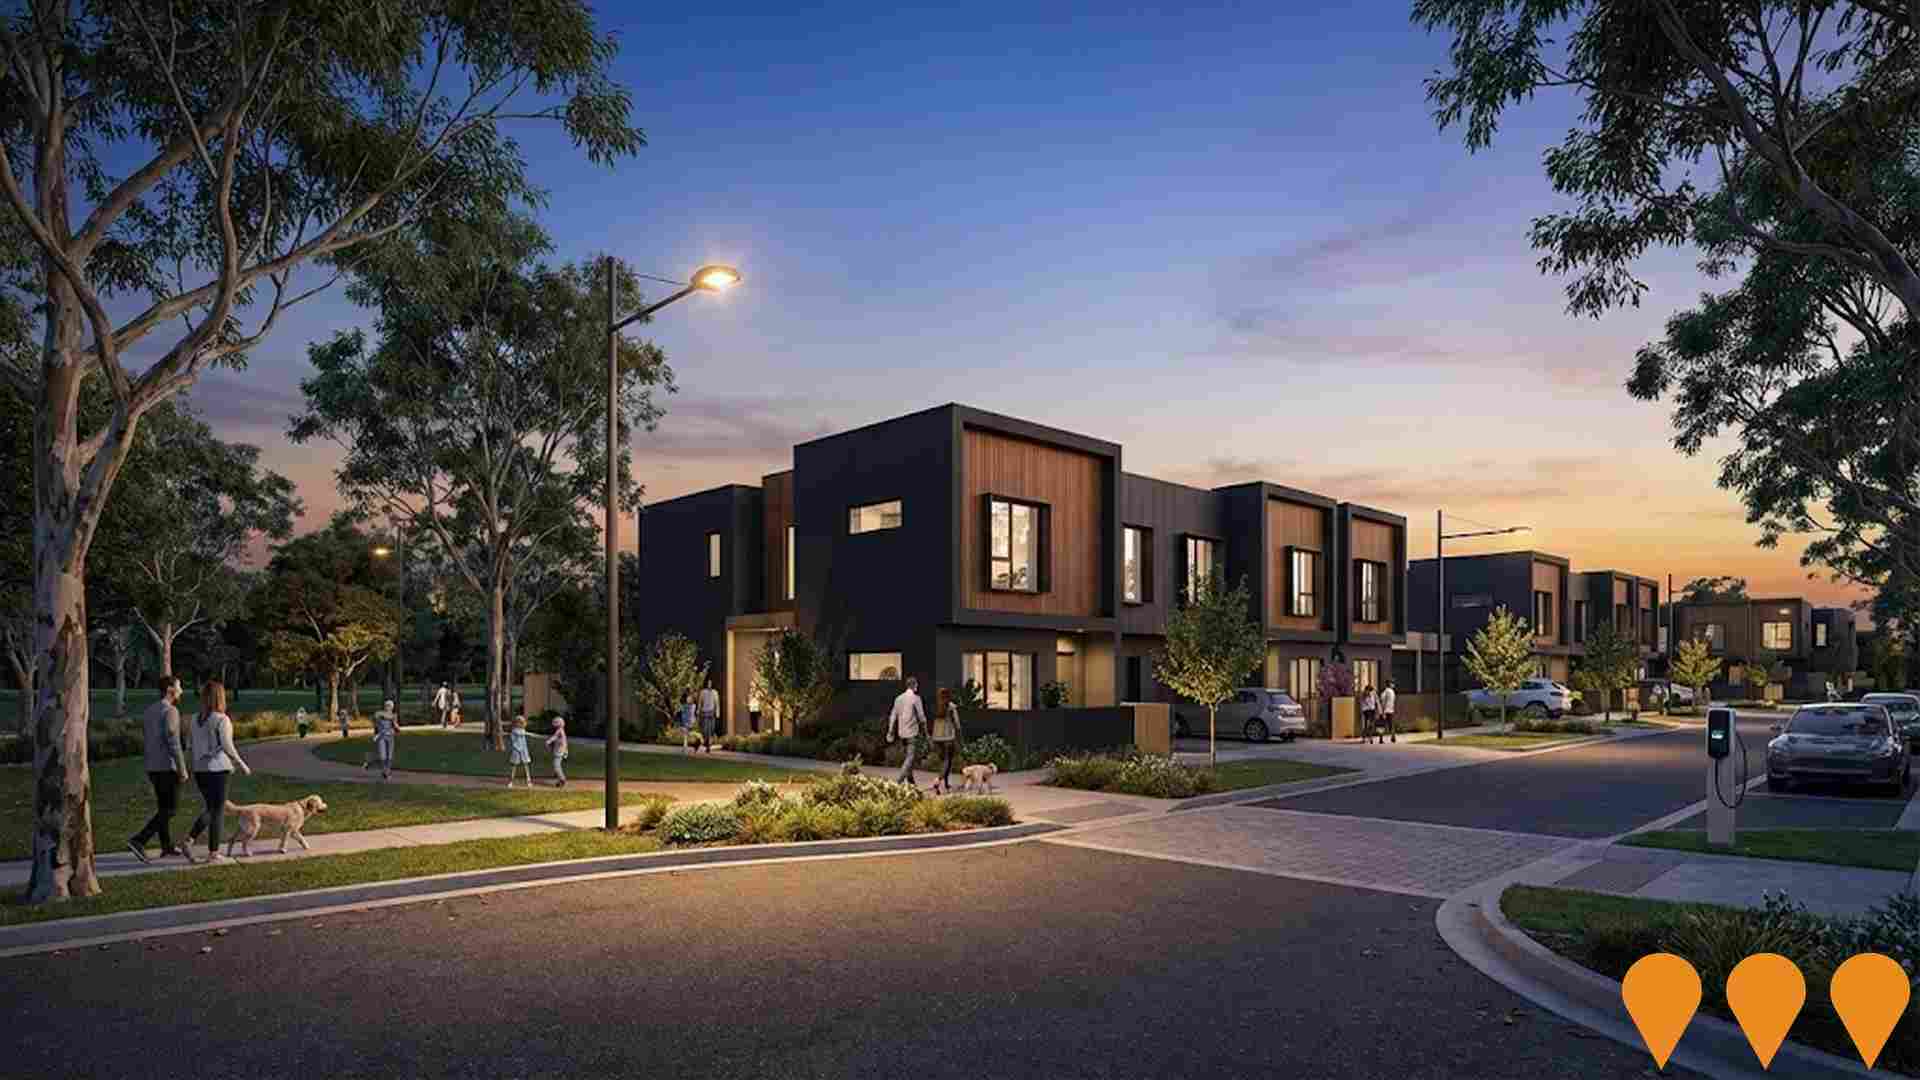
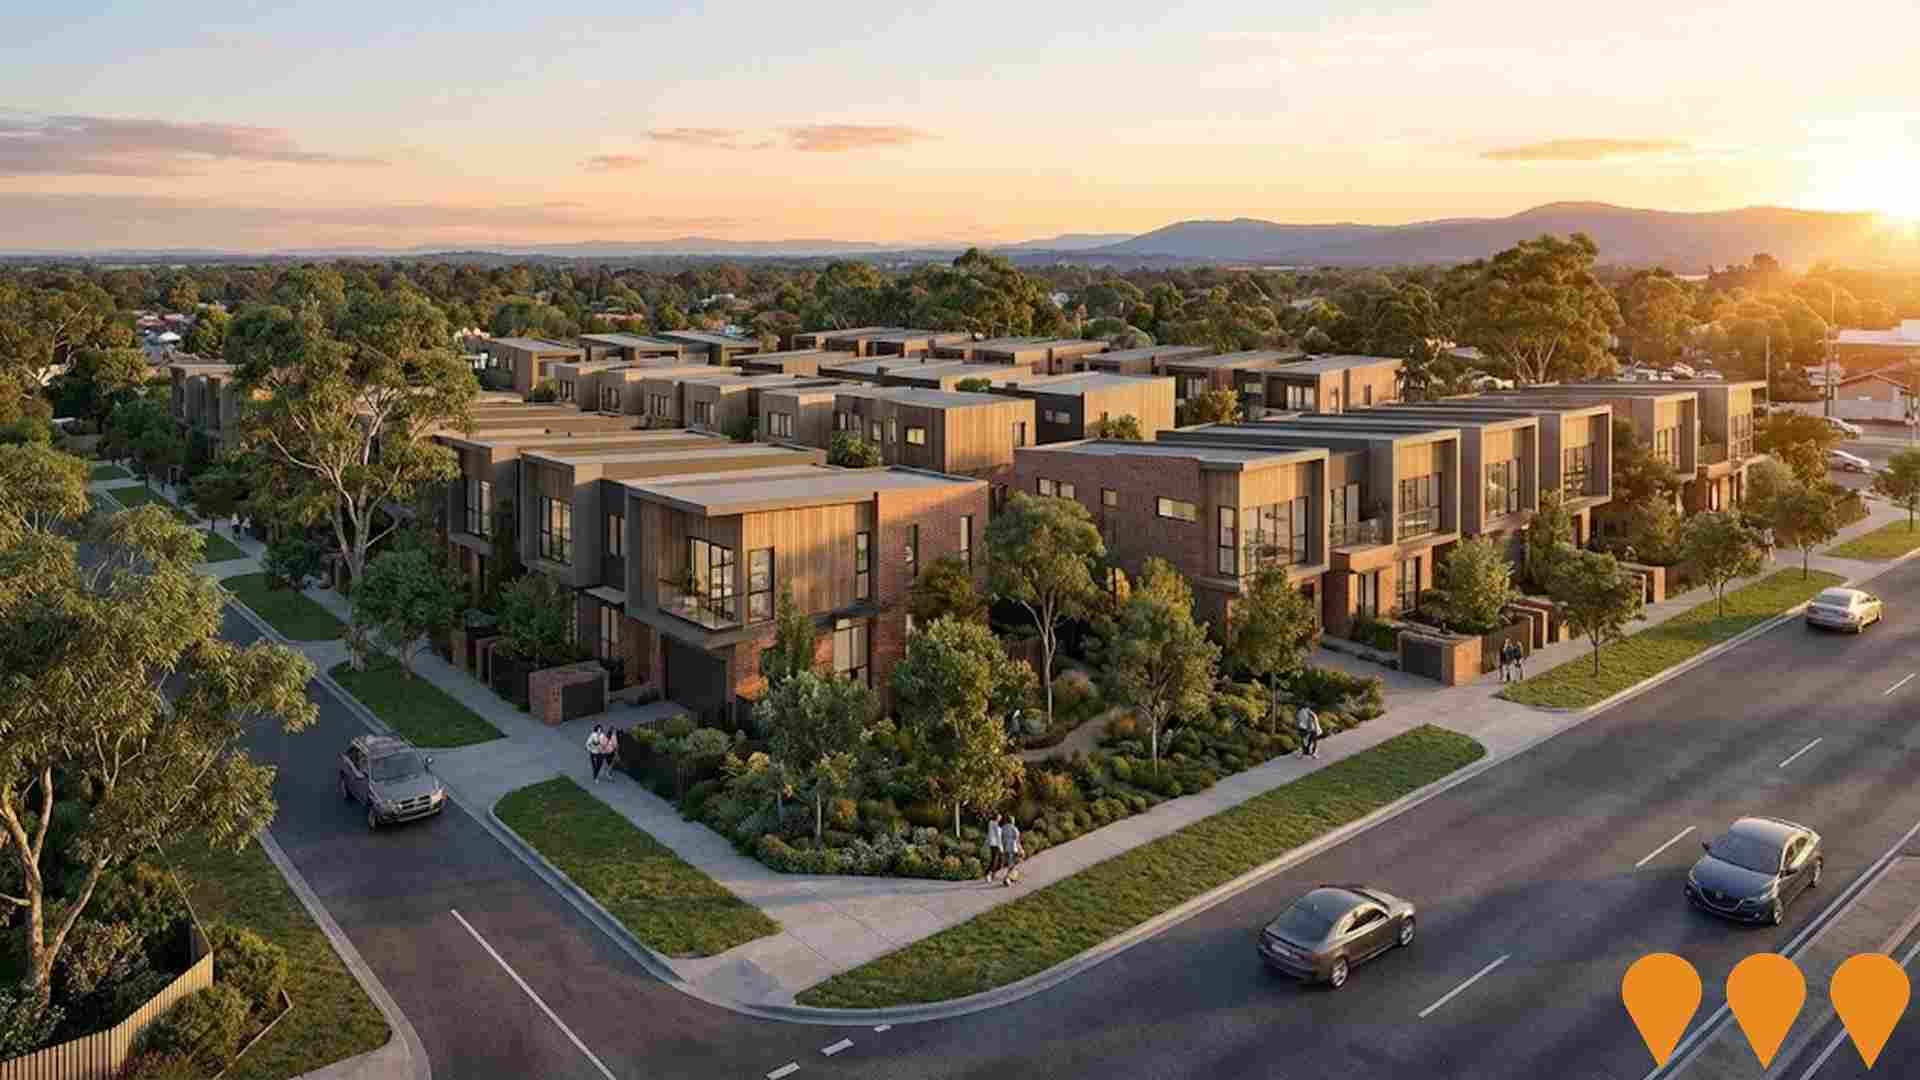
 Denotes AI-based impression for illustrative purposes only, not to be taken as definitive under any circumstances. Please follow links and conduct other investigations from the project's source for actual imagery. Developers and project owners wishing us to use original imagery please Contact Us and we will do so.
Frequently Asked Questions - Infrastructure
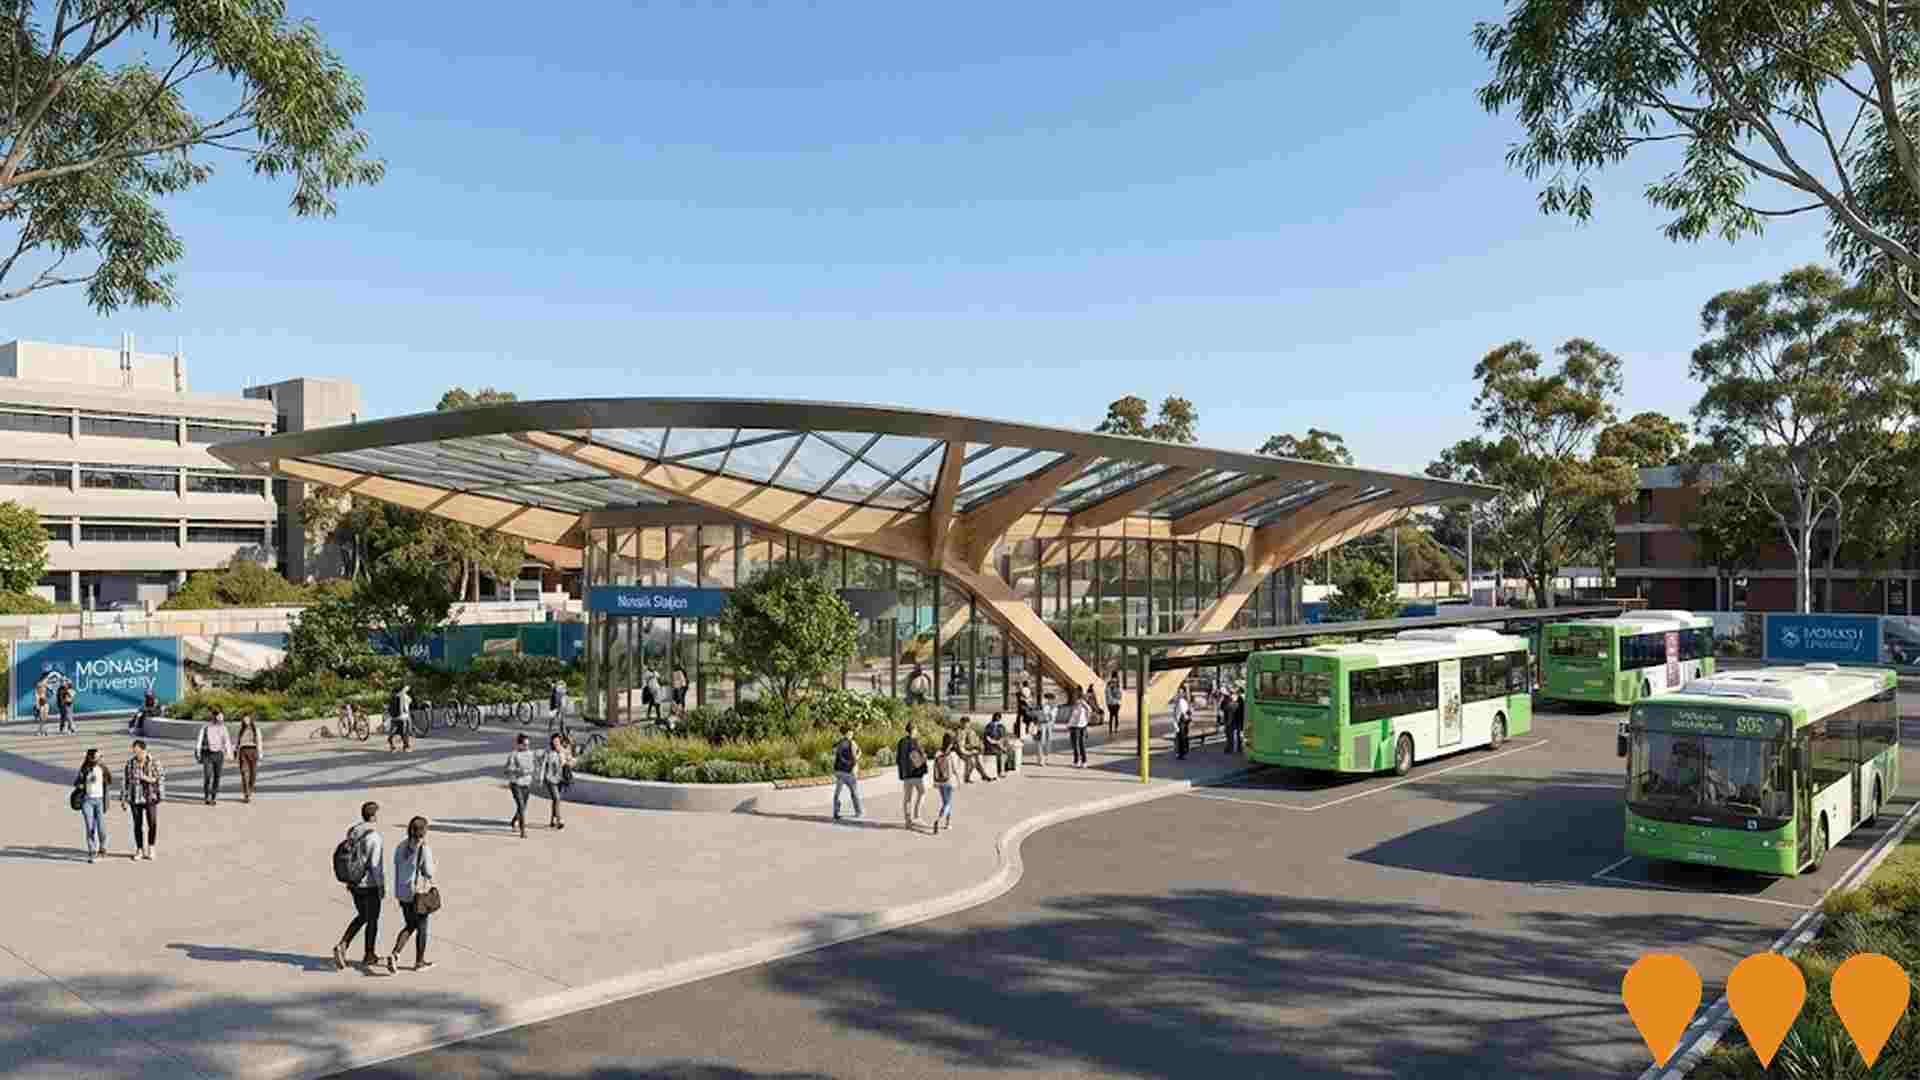
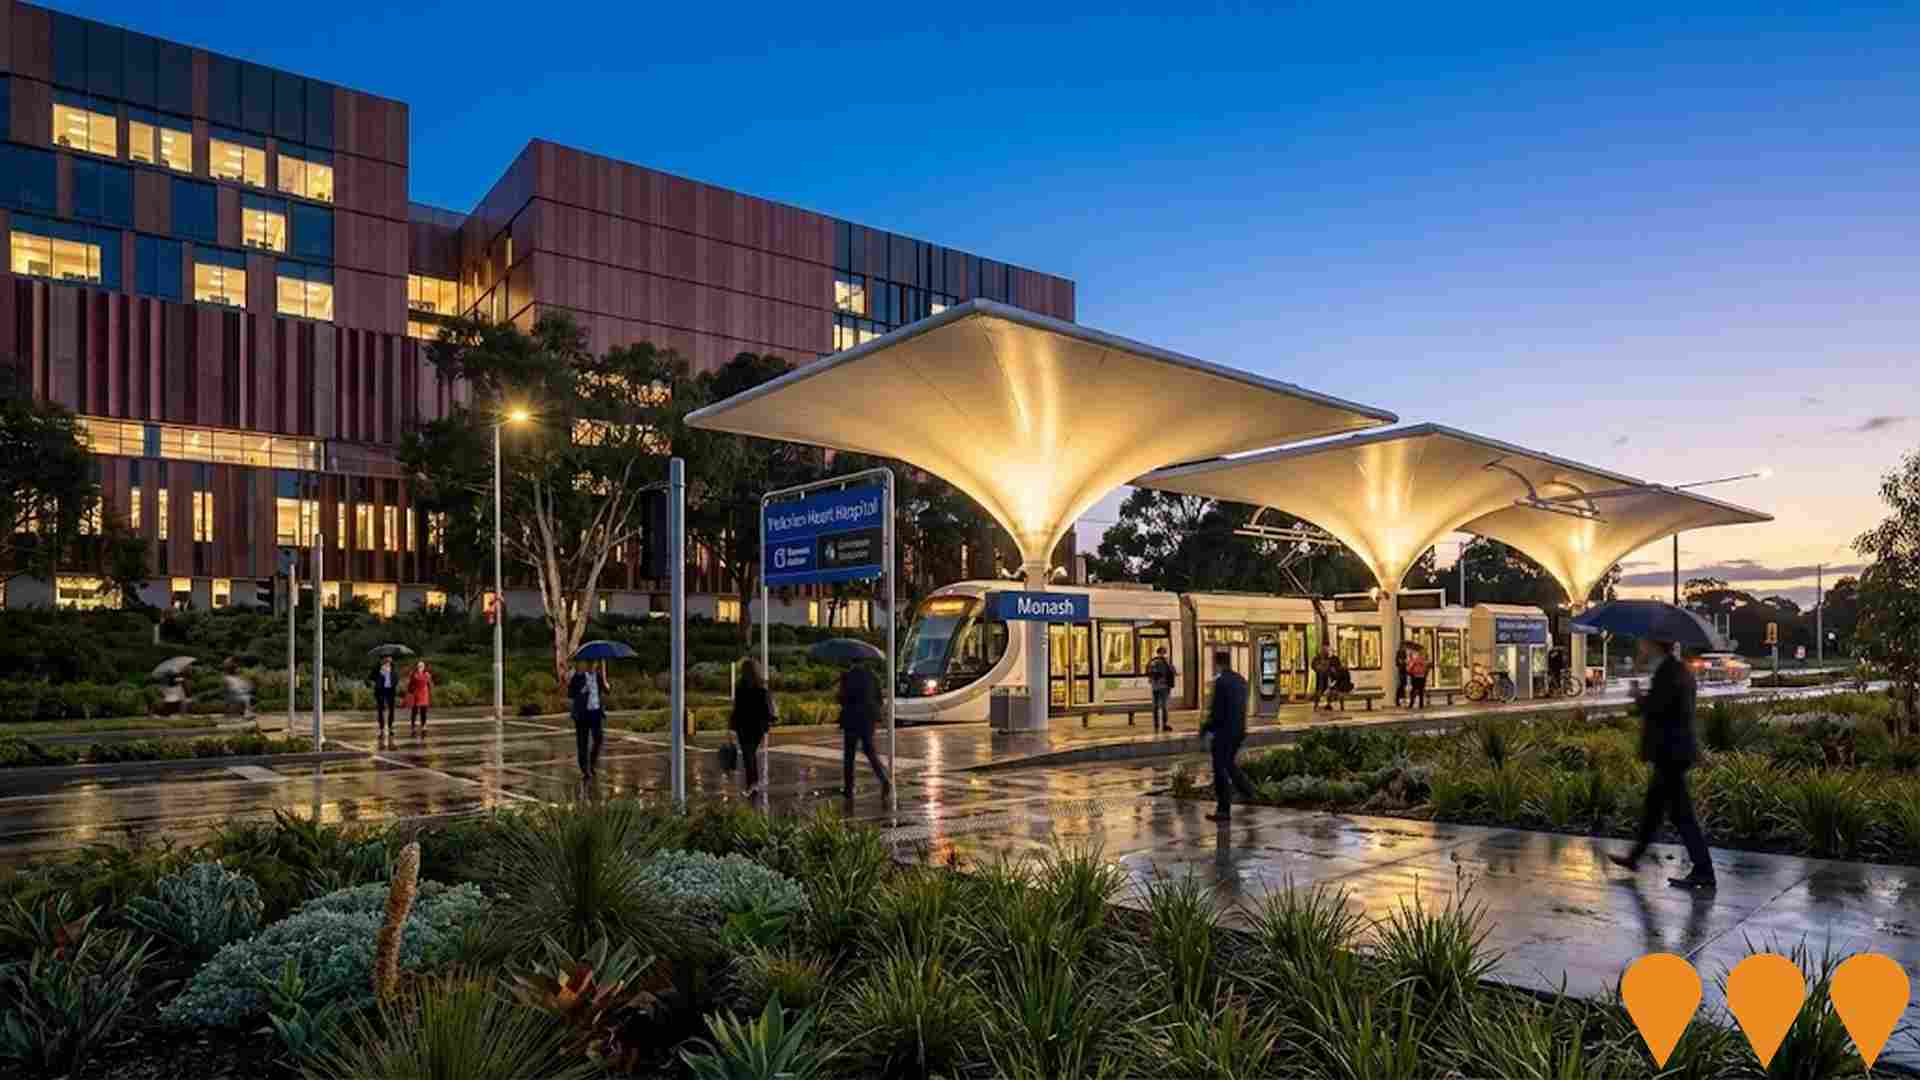
Suburban Rail Loop East - Monash Station
Underground twin-platform station forming part of Suburban Rail Loop East (Cheltenham to Box Hill). Located beneath Monash University Clayton campus with two entrances: northern entrance on Wellington Road with integrated bus interchange, and southern entrance directly into the university. Includes bicycle facilities, retail opportunities, and new pedestrian/cycle links. Early works completed, major construction commenced 2024, tunnelling from 2026, station due to open 2035.
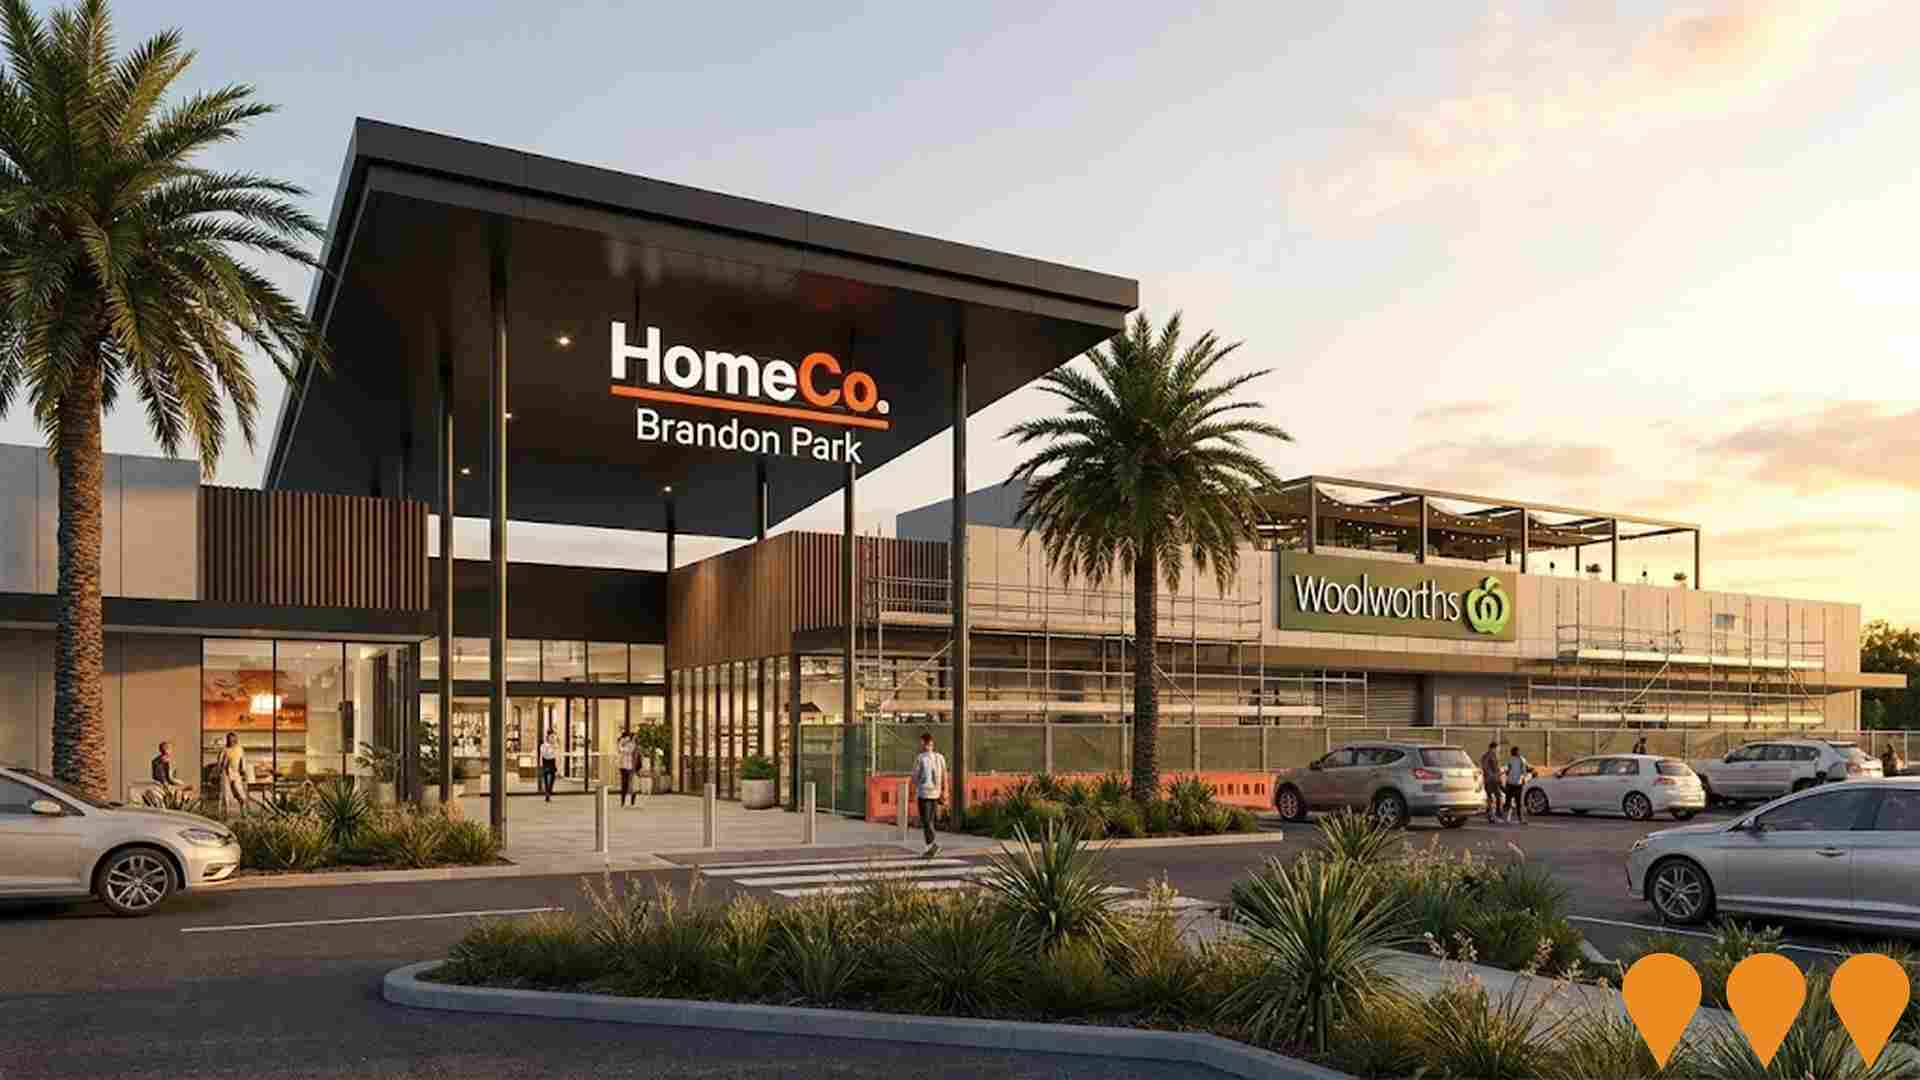
HomeCo. Brandon Park Redevelopment
HomeCo. Brandon Park is undergoing a major multi-stage redevelopment to transform the existing sub-regional shopping centre into a modern daily-needs retail and community destination. Works commenced in June 2025 and include a new full-line Woolworths supermarket, rooftop retail and dining precinct, relocated and expanded Chemist Warehouse, new travelators, upgraded mall linkages between Coles and ALDI, additional specialty stores and improved customer amenities.
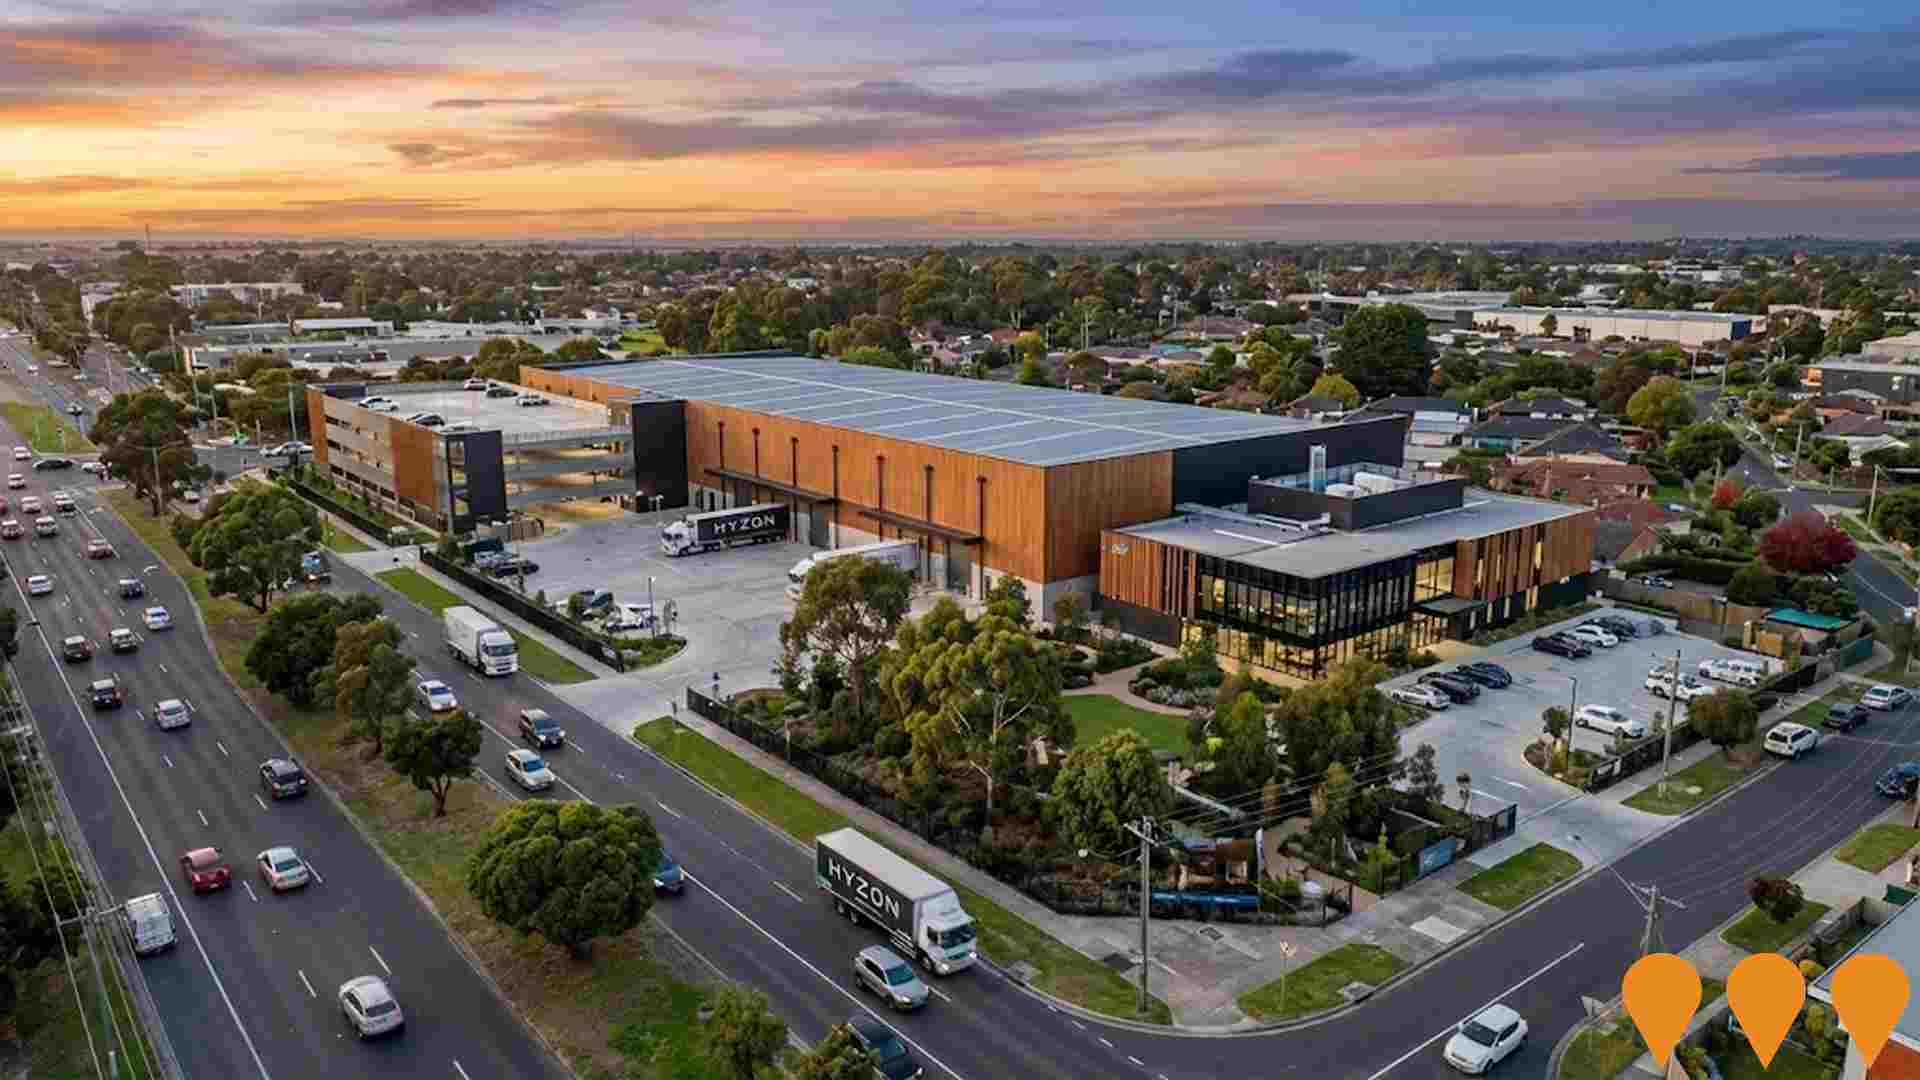
RACV Noble Park Redevelopment
Multi-stage redevelopment of RACV's Noble Park facility featuring a new 10,000+ sqm warehouse with 730 sqm two-level office, multi-storey car park, 1,100 sqm courtyard garden renewal, and purpose-built hydrogen vehicle manufacturing facility for Hyzon Motors. The project transforms an existing RACV site into a modern industrial and manufacturing hub supporting clean energy initiatives.
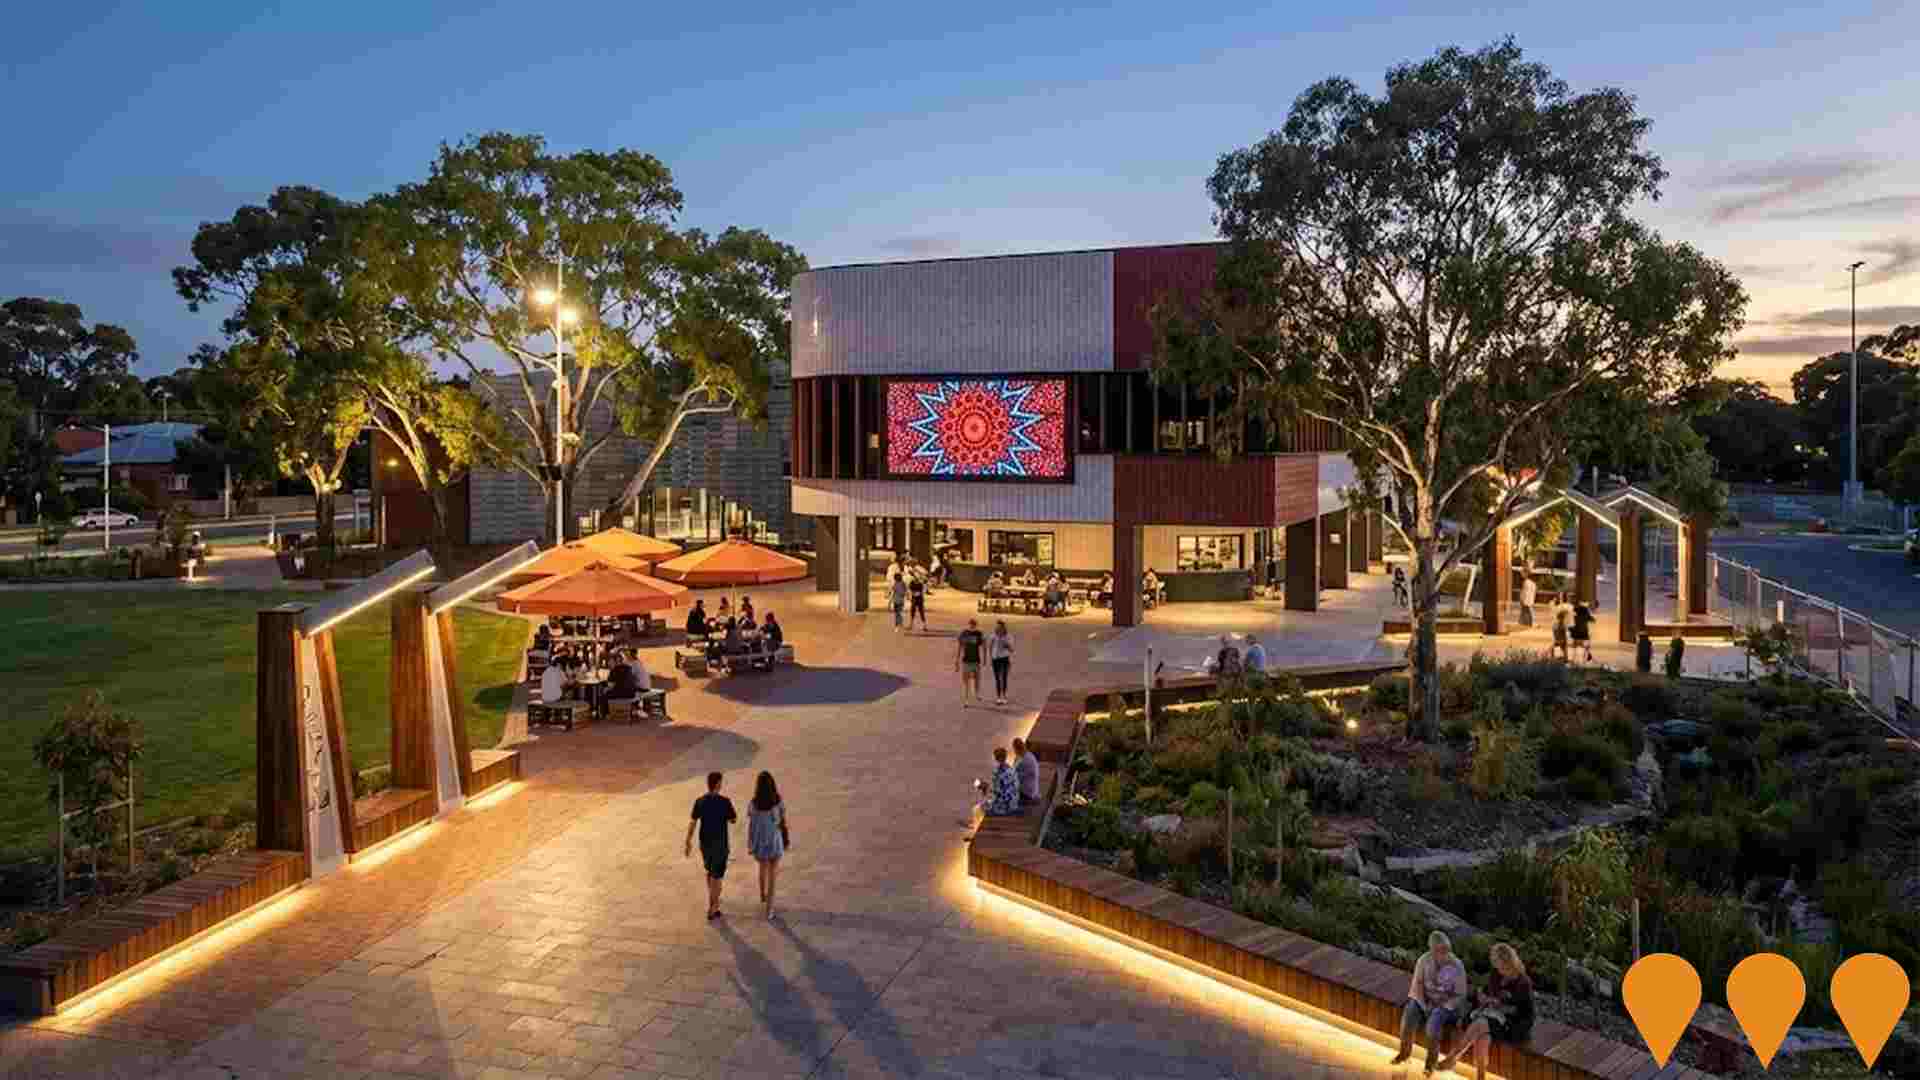
Revitalising Springvale
Council-led urban renewal program for the Springvale Activity Centre. Current focus is completing and enhancing Springvale Boulevard (Springvale Road between Balmoral Ave and Windsor Ave) with upgraded footpaths, lighting, seating, greenery, gateway thresholds and public art, plus improvements to Multicultural Place under the Springvale Revitalisation Action Plan (SRAP).
Rowville Rail/Light Rail Project
Proposed rail connection from Huntingdale Station to Rowville along Wellington Road corridor. Part of long-term public transport strategy for Melbourne's outer east, addressing transport needs of growing population.
Liege Avenue Childcare Centre
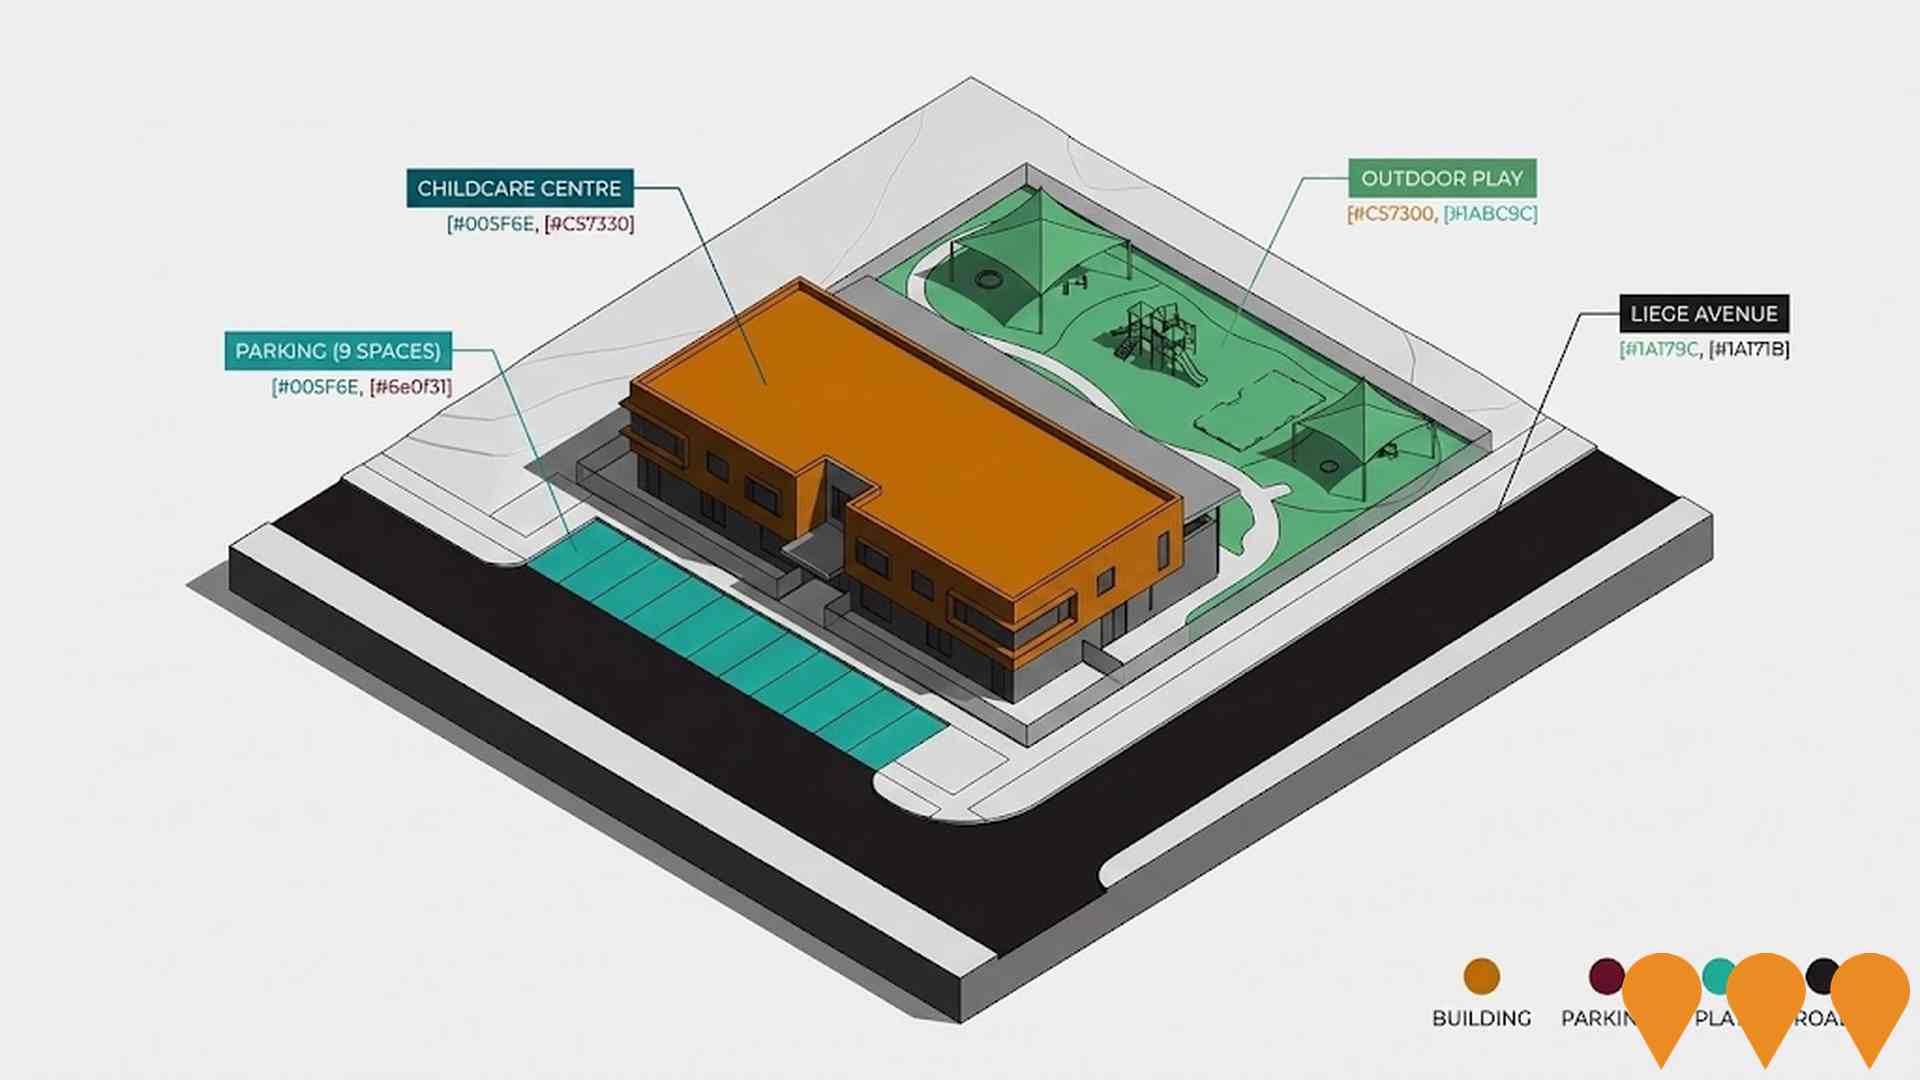
Two-storey childcare centre with three children's rooms, staff room, kitchen, reception, toilets, laundry, outdoor play space, and 9 parking spaces. The current site with a three-bedroom residential building will be demolished to make way for the new childcare centre.
Floret Townhouses
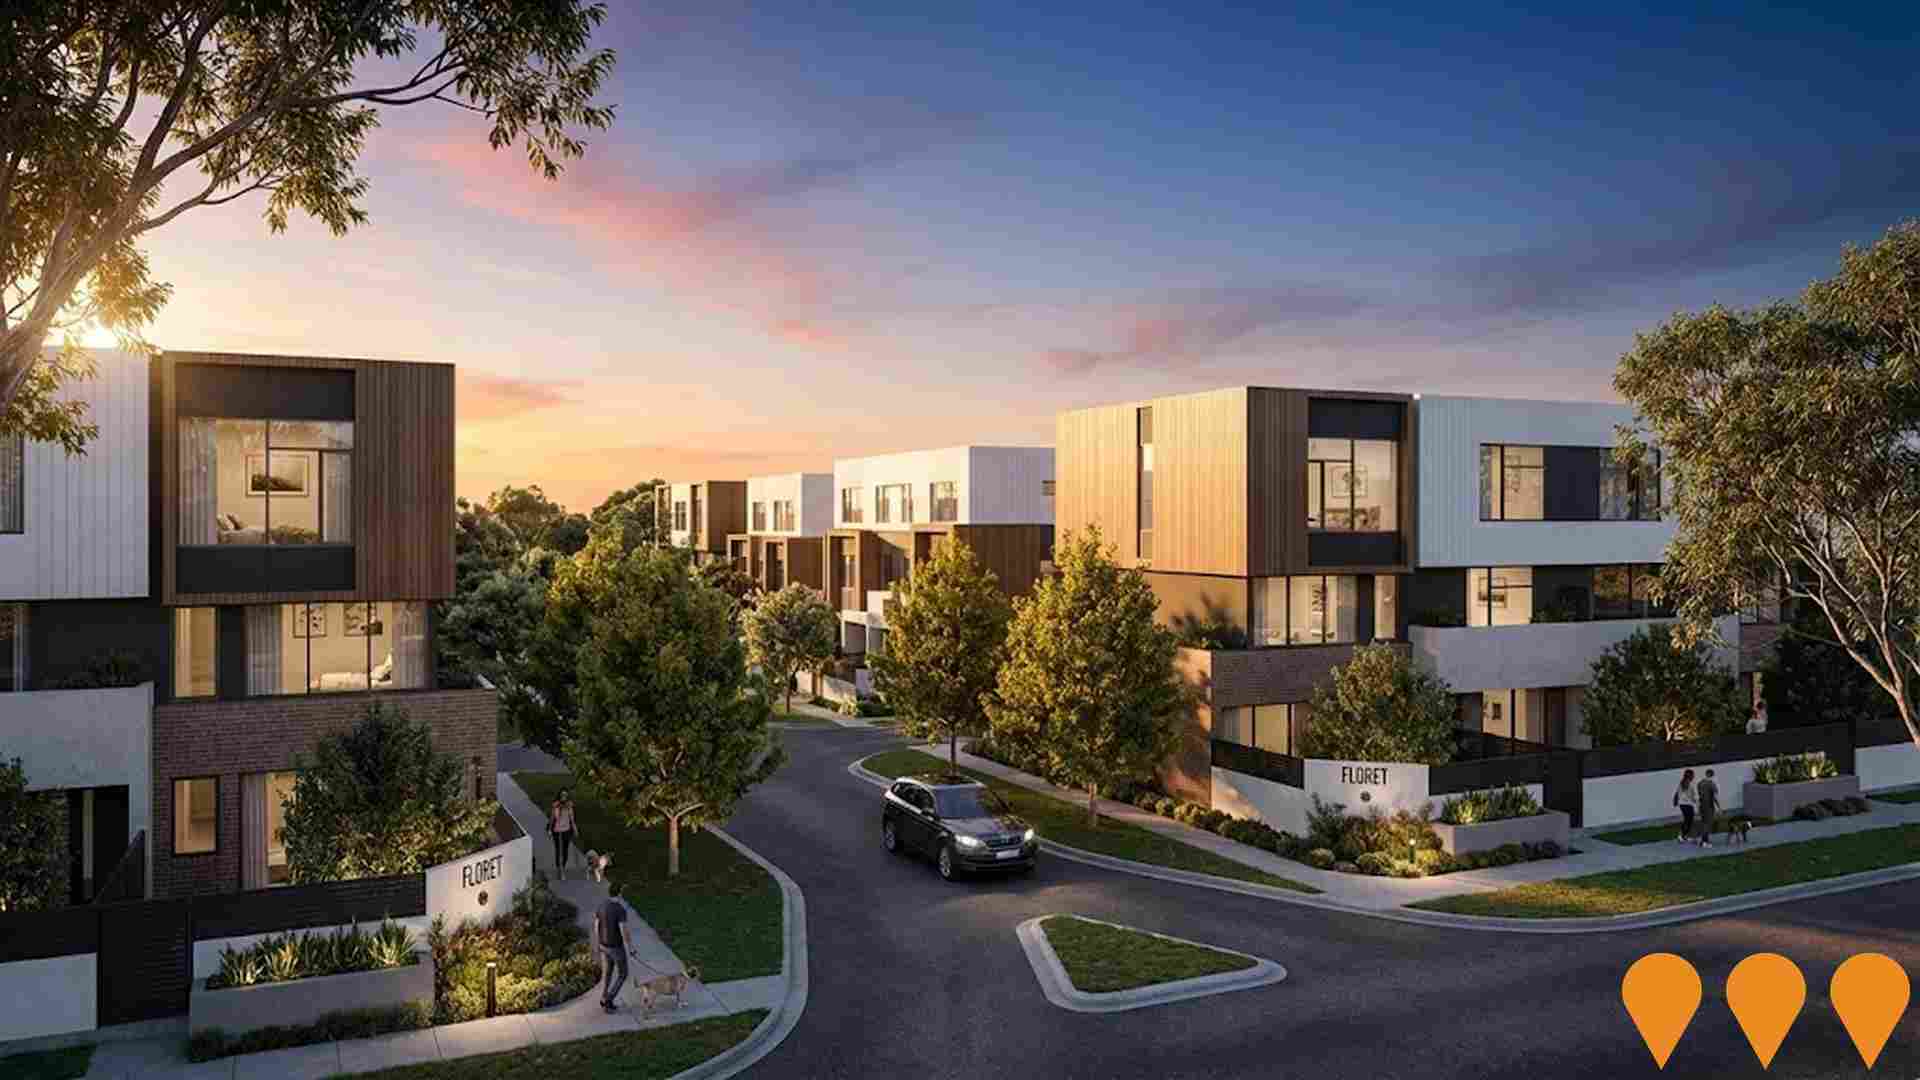
A vibrant community of 77 architecturally designed 3 and 4 bedroom premium townhouses by Rothelowman located in Glen Waverley. Completed in April 2025, the development features over 1000 sqm of central parkland with children's playground, barbecue areas, and fitness facilities. Designed by award-winning architects Rothelowman and landscape architects ASPECT Studios, the townhouses offer flexible open floor plans, premium finishes, and are positioned near Brandon Park Shopping Centre, The Glen Shopping Centre, and excellent schools including proximity to Monash University.
Stamford Park Redevelopment
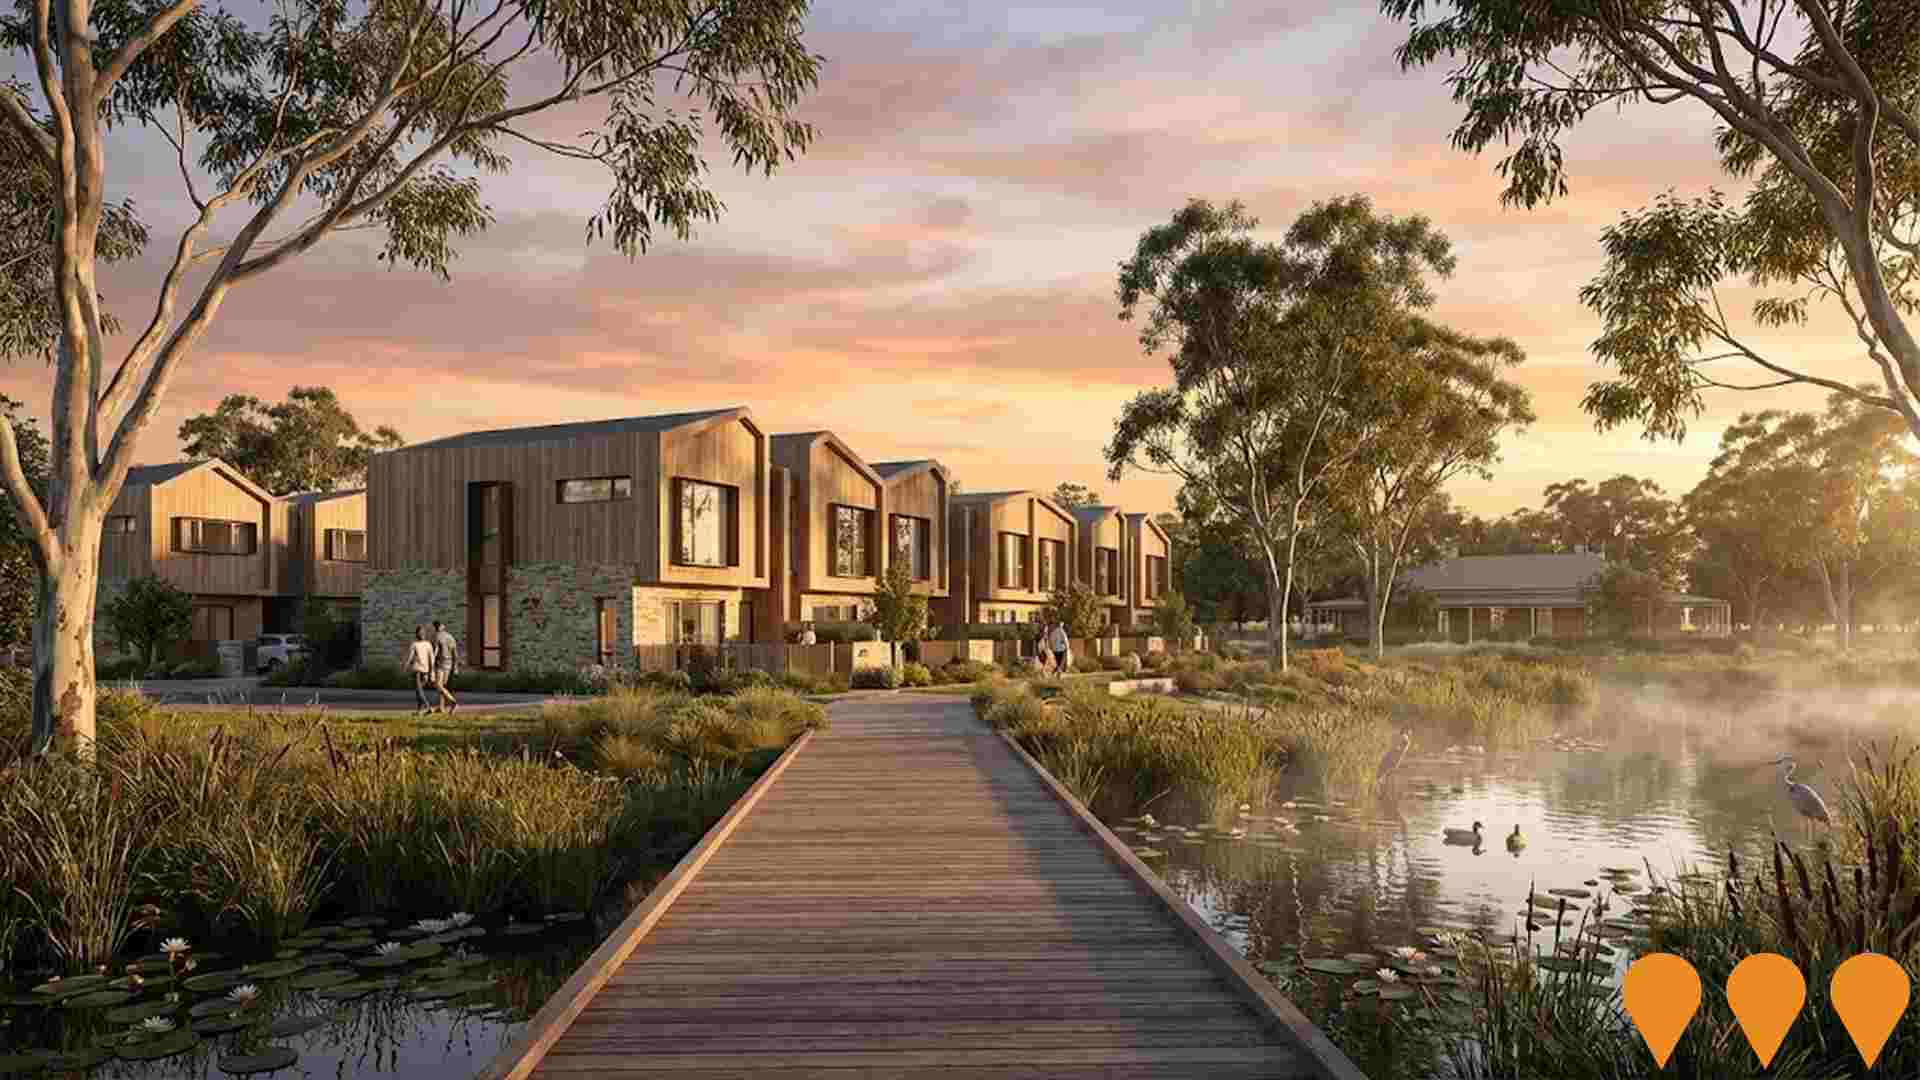
6.5ha development including around 190 dwellings with 6-Star Green Star Community rating. Focus on sustainable design, environmental restoration, and community amenities. Integrates with existing parkland and wetlands.
Employment
Mulgrave ranks among the top 25% of areas assessed nationally for overall employment performance
Mulgrave has a well-educated workforce with strong representation in professional services. The unemployment rate is 2.6%, lower than the Greater Melbourne average of 4.7%.
Over the past year, employment growth was estimated at 4.6%. As of September 2025, there are 11,402 residents employed, with an unemployment rate of 2.1% and workforce participation at 61.0%, compared to Greater Melbourne's 64.1%. The leading employment industries in Mulgrave are health care & social assistance, retail trade, and professional & technical services. The area has a particularly strong specialization in manufacturing, with an employment share 1.3 times the regional level.
However, construction is under-represented at 8.4% compared to Greater Melbourne's 9.7%. Mulgrave functions as an employment hub with 1.2 workers for every resident. During the year to September 2025, employment levels increased by 4.6% and labour force grew by 4.8%, causing the unemployment rate to rise by 0.1 percentage points. In comparison, Greater Melbourne recorded employment growth of 3.0%, labour force growth of 3.3%, with unemployment rising by 0.3 percentage points. State-level data as of 25-Nov shows Victoria's employment grew by 1.13% year-on-year, adding 41,950 jobs, with the state unemployment rate at 4.7%. Nationally, employment growth was 0.14%, and the unemployment rate was 4.3%. Jobs and Skills Australia's national employment forecasts from May-25 indicate that employment should increase by 6.5% over five years and 13.5% over ten years in Mulgrave, based on a simple weighting extrapolation of industry-specific projections against the local employment mix.
Frequently Asked Questions - Employment
Income
The economic profile demonstrates above-average performance, with income metrics exceeding national benchmarks based on AreaSearch comparative assessment
AreaSearch's latest postcode level ATO data for financial year 2022 shows that income in Mulgrave SA2 is above the national average. The median income is $52,100 and the average income stands at $66,919. This contrasts with Greater Melbourne's figures of a median income of $54,892 and an average income of $73,761. Based on Wage Price Index growth of 12.16% since financial year 2022, current estimates would be approximately $58,435 (median) and $75,056 (average) as of September 2025. According to the 2021 Census, household income ranks at the 60th percentile ($1,913 weekly), while personal income sits at the 37th percentile. The largest segment of income distribution comprises 32.8% earning $1,500 - 2,999 weekly (6,987 residents), mirroring the surrounding region where 32.8% occupy this bracket. High housing costs consume 15.1% of income, but strong earnings place disposable income at the 61st percentile. The area's SEIFA income ranking places it in the 7th decile.
Frequently Asked Questions - Income
Housing
Mulgrave is characterized by a predominantly suburban housing profile, with above-average rates of outright home ownership
Mulgrave's dwelling structure at the latest Census comprised 83.2% houses and 16.9% other dwellings (semi-detached, apartments, 'other' dwellings). In comparison, Melbourne metro had 69.6% houses and 30.3% other dwellings. Home ownership in Mulgrave was at 39.2%, similar to Melbourne metro's level. Mortgaged dwellings were 37.9% and rented dwellings were 22.9%. The median monthly mortgage repayment in Mulgrave was $2,167, lower than Melbourne metro's average of $2,383. The median weekly rent figure for Mulgrave was $430, compared to Melbourne metro's $440. Nationally, Mulgrave's mortgage repayments were higher at $1,863 and rents were substantially above the national figure of $375.
Frequently Asked Questions - Housing
Household Composition
Mulgrave features high concentrations of family households, with a higher-than-average median household size
Family households account for 78.9% of all households, including 40.5% couples with children, 25.9% couples without children, and 11.1% single parent families. Non-family households constitute the remaining 21.1%, with lone person households at 17.6% and group households comprising 3.5%. The median household size is 2.8 people, which is larger than the Greater Melbourne average of 2.7.
Frequently Asked Questions - Households
Local Schools & Education
The educational profile of Mulgrave exceeds national averages, with above-average qualification levels and academic performance metrics
Mulgrave's residents aged 15+ have 36.4% university degrees, compared to SA3 area's 45.8%. This indicates potential for educational development. Bachelor degrees are most common at 23.4%, followed by postgraduate qualifications (10.0%) and graduate diplomas (3.0%). Vocational credentials are held by 26.1% of residents, with advanced diplomas at 11.1% and certificates at 15.0%.
Educational participation is high, with 28.9% currently enrolled in formal education: primary (9.3%), secondary (7.3%), tertiary (6.3%).
Frequently Asked Questions - Education
Schools Detail
Nearby Services & Amenities
Transport
Transport servicing is high compared to other areas nationally based on assessment of service frequency, route connectivity and accessibility
Mulgrave has 110 active public transport stops, all of which are bus stops. There are 39 different routes serving these stops, together facilitating 7,672 weekly passenger trips. Residents have good access to transport, with an average distance of 201 meters to the nearest stop.
The service frequency is 1,096 trips per day across all routes, which amounts to approximately 69 weekly trips per individual stop.
Frequently Asked Questions - Transport
Transport Stops Detail
Health
The level of general health in Mulgrave is notably higher than the national average with both young and old age cohorts seeing low prevalence of common health conditions
Mulgrave demonstrates above-average health outcomes, with both young and old age cohorts experiencing low prevalence of common health conditions. The rate of private health cover is approximately 52%, which is higher than the average SA2 area (~11,162 people).
This compares to a rate of 54.4% across Greater Melbourne. The most common medical conditions in Mulgrave are arthritis and asthma, impacting 6.5% and 6.3% of residents respectively. A total of 74.3% of residents declared themselves completely clear of medical ailments, compared to 75.3% across Greater Melbourne. Mulgrave has 18.9% of residents aged 65 and over (4,034 people), which is higher than the 17.5% in Greater Melbourne. Health outcomes among seniors are particularly strong, broadly in line with the general population's health profile.
Frequently Asked Questions - Health
Cultural Diversity
Mulgrave is among the most culturally diverse areas in the country based on AreaSearch assessment of a range of language and cultural background related metrics
Mulgrave has a high level of cultural diversity, with 48.0% of its population born overseas and 53.2% speaking a language other than English at home. Christianity is the predominant religion in Mulgrave, accounting for 52.4% of the population. Buddhism is notably overrepresented in Mulgrave compared to Greater Melbourne, with 8.1% versus 7.9%.
The top three ancestry groups are Other (16.8%), Chinese (14.2%) and Australian (12.7%). Some ethnic groups have significant representation in Mulgrave: Greek at 7.9% (regional average is 5.6%), Sri Lankan at 2.6% (versus 2.1%) and Hungarian at 0.5% (compared to 0.3%).
Frequently Asked Questions - Diversity
Age
Mulgrave's population is slightly older than the national pattern
Mulgrave has a median age of 40, which is slightly higher than Greater Melbourne's figure of 37 and Australia's national average of 38 years. Notably, the 75-84 age group makes up 7.3% of Mulgrave's population, compared to the Greater Melbourne average, indicating an over-representation of this cohort. Conversely, individuals aged 25-34 are under-represented in Mulgrave, making up only 13.0% of the population. Between 2021 and present, the proportion of residents aged 15-24 has increased from 11.0% to 13.1%, while the percentage of those aged 65-74 has decreased from 9.9% to 8.8%. By 2041, demographic projections suggest significant shifts in Mulgrave's age profile. The 45-54 age cohort is expected to expand by 851 people (31%), growing from 2,773 to 3,625 individuals. Meanwhile, the 0-4 age group is projected to grow modestly by 5% (50 people).
