Chart Color Schemes
est. as @ -- *
ABS ERP | -- people | --
2021 Census | -- people
Sales Activity
Curious about local property values? Filter the chart to assess the volume and appreciation (including resales) trends and regional comparisons, or scroll to the map below view this information at an individual property level.
Find a Recent Sale
Sales Detail
Population
An assessment of population growth drivers in Derwent Valley reveals an overall ranking slightly below national averages considering recent, and medium term trends
Derwent Valley's population, as of August 2025, is approximately 3,503. This figure represents an increase of 179 people since the 2021 Census, which recorded a population of 3,324. The growth was inferred from ABS estimates: Derwent Valley had an estimated resident population of 3,475 in June 2024 and gained 64 new addresses validated after the Census date. This results in a population density of approximately 2.7 persons per square kilometer. Derwent Valley's population grew by 5.4% between the 2021 Census and August 2025, outperforming both the state average (4.5%) and non-metro areas during this period. Interstate migration contributed around 50% of overall population gains in recent periods, though all factors including overseas migration and natural growth were positive contributors to growth.
AreaSearch uses ABS/Geoscience Australia projections for each SA2 area, released in 2024 with a base year of 2022. For areas not covered by this data or post-2032 growth by age group, Tasmania State Government's Regional/LGA projections are adopted, released in 2022 with a base year of 2021 and adjusted using weighted aggregation from LGA to SA2 levels. Projected demographic shifts indicate an overall population decline of 164 persons by 2041, but growth is expected within specific age cohorts, notably the 75-84 age group projected to grow by 87 people over this period.
Frequently Asked Questions - Population
Development
AreaSearch analysis of residential development drivers sees Derwent Valley recording a relatively average level of approval activity when compared to local markets analysed countrywide
Derwent Valley has experienced approximately 9 dwelling approvals per year over the past five financial years, totalling 47 homes. No approvals have been recorded so far in FY26. On average, 2.9 people moved to the area per new home constructed between FY21 and FY25. The average construction cost of these homes was $463,000.
In FY26, commercial development approvals totalling $12.0 million have been recorded. Compared to Rest of Tas., Derwent Valley has roughly half the building activity per person, placing it in the 52nd percentile nationally. All new construction has consisted of detached houses, preserving the area's low density nature. There are an estimated 363 people per dwelling approval in the area.
Population projections indicate stability or decline, suggesting reduced housing demand pressures.
Frequently Asked Questions - Development
Infrastructure
Derwent Valley has limited levels of nearby infrastructure activity, ranking in the 19thth percentile nationally
Influence on an area's performance is significantly impacted by changes to local infrastructure, major projects, and planning initiatives. AreaSearch has identified 14 such projects likely to affect the area. Notable ones include Incat Boyer Ferry Manufacturing Facility, The Agrarian Kitchen Expansion, Derwent Valley Health and Wellbeing Hub, and New Norfolk Distillery Expansion. Below is a list of those most relevant.
Professional plan users can use the search below to filter and access additional projects.
INFRASTRUCTURE SEARCH
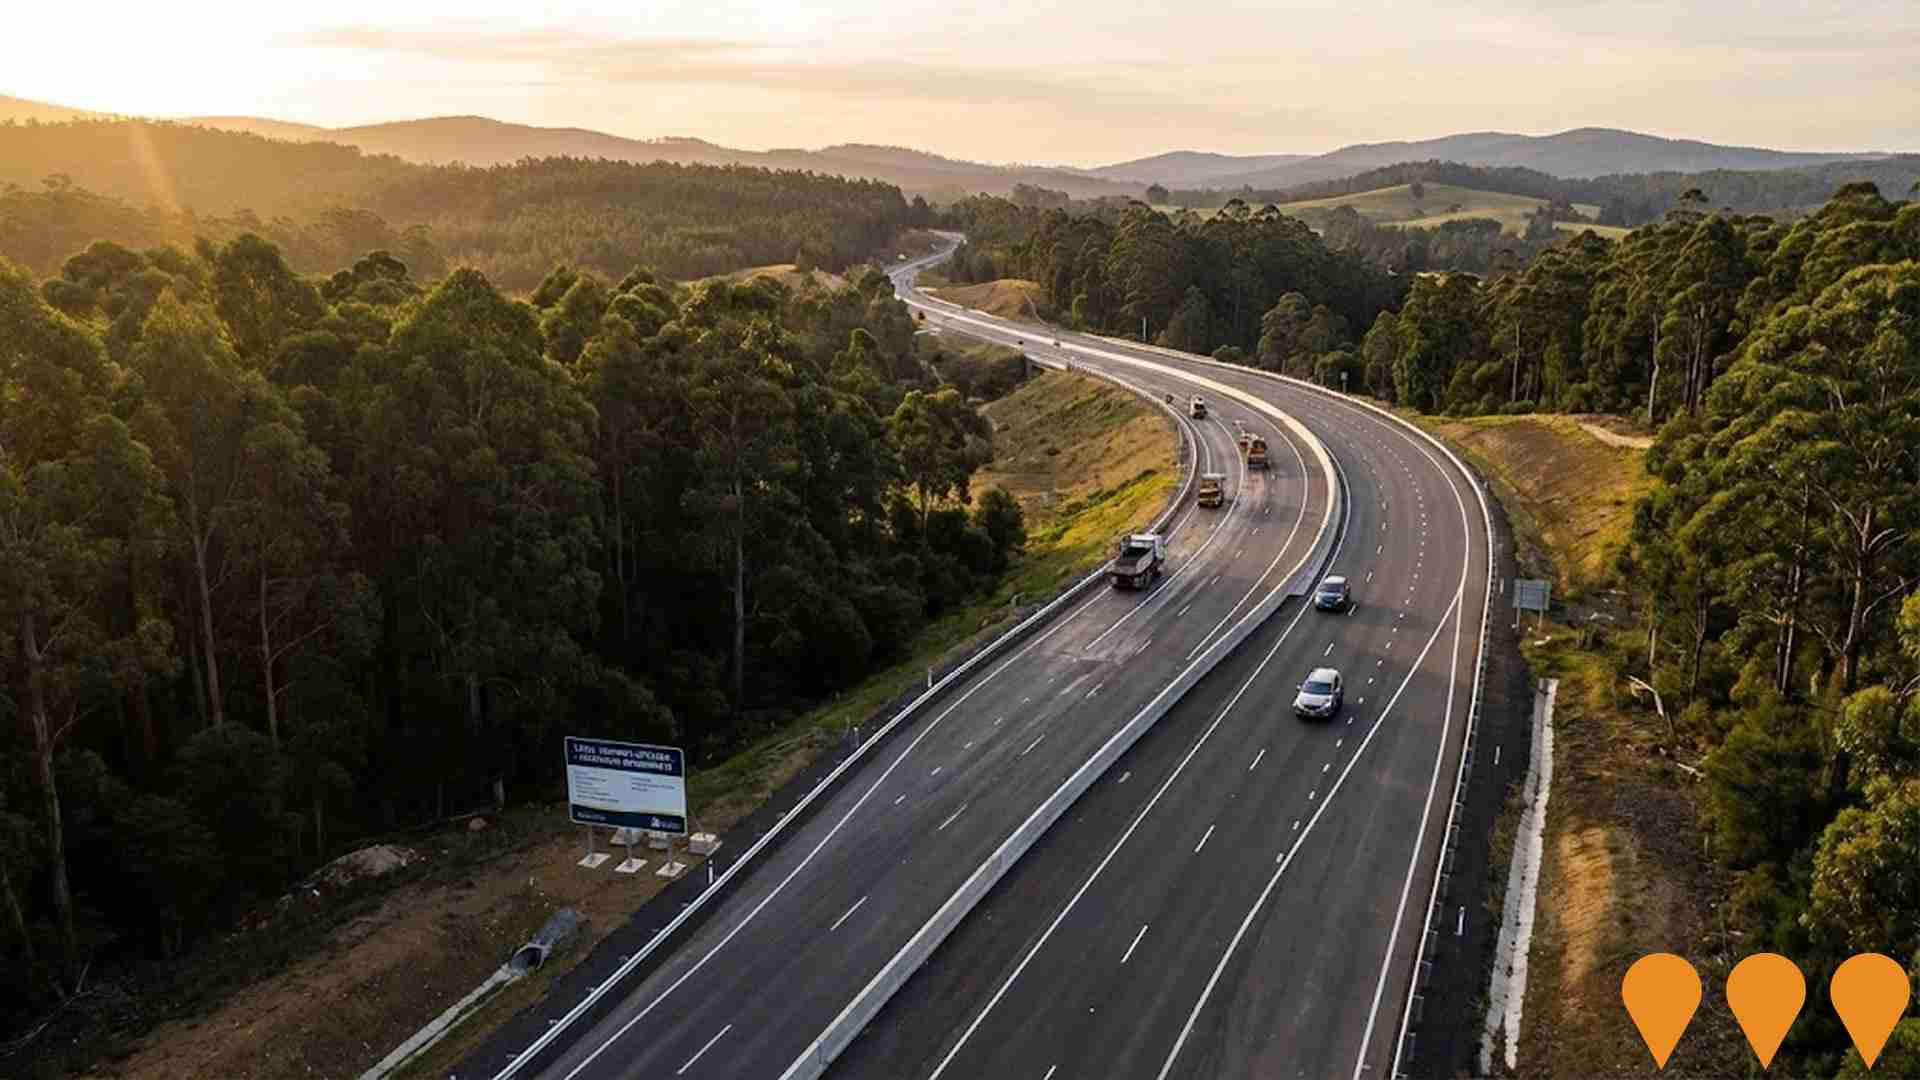
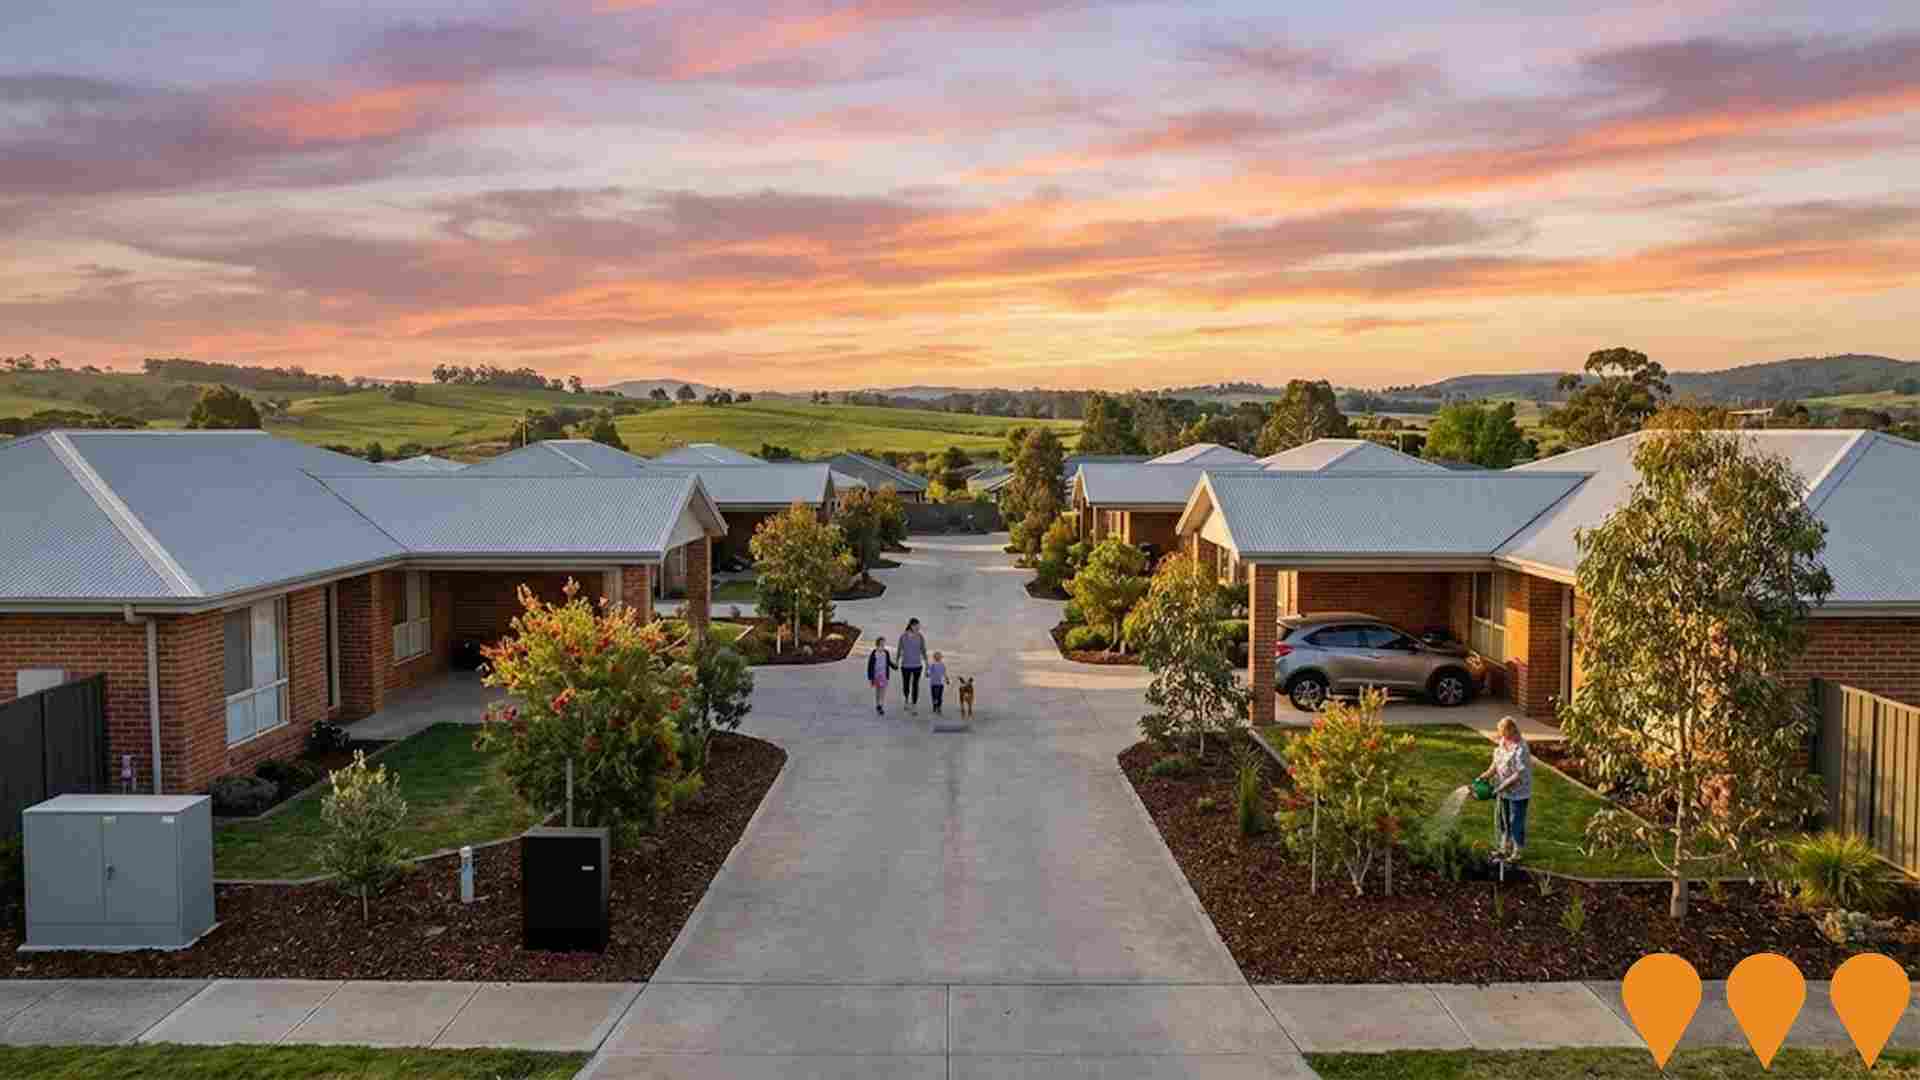
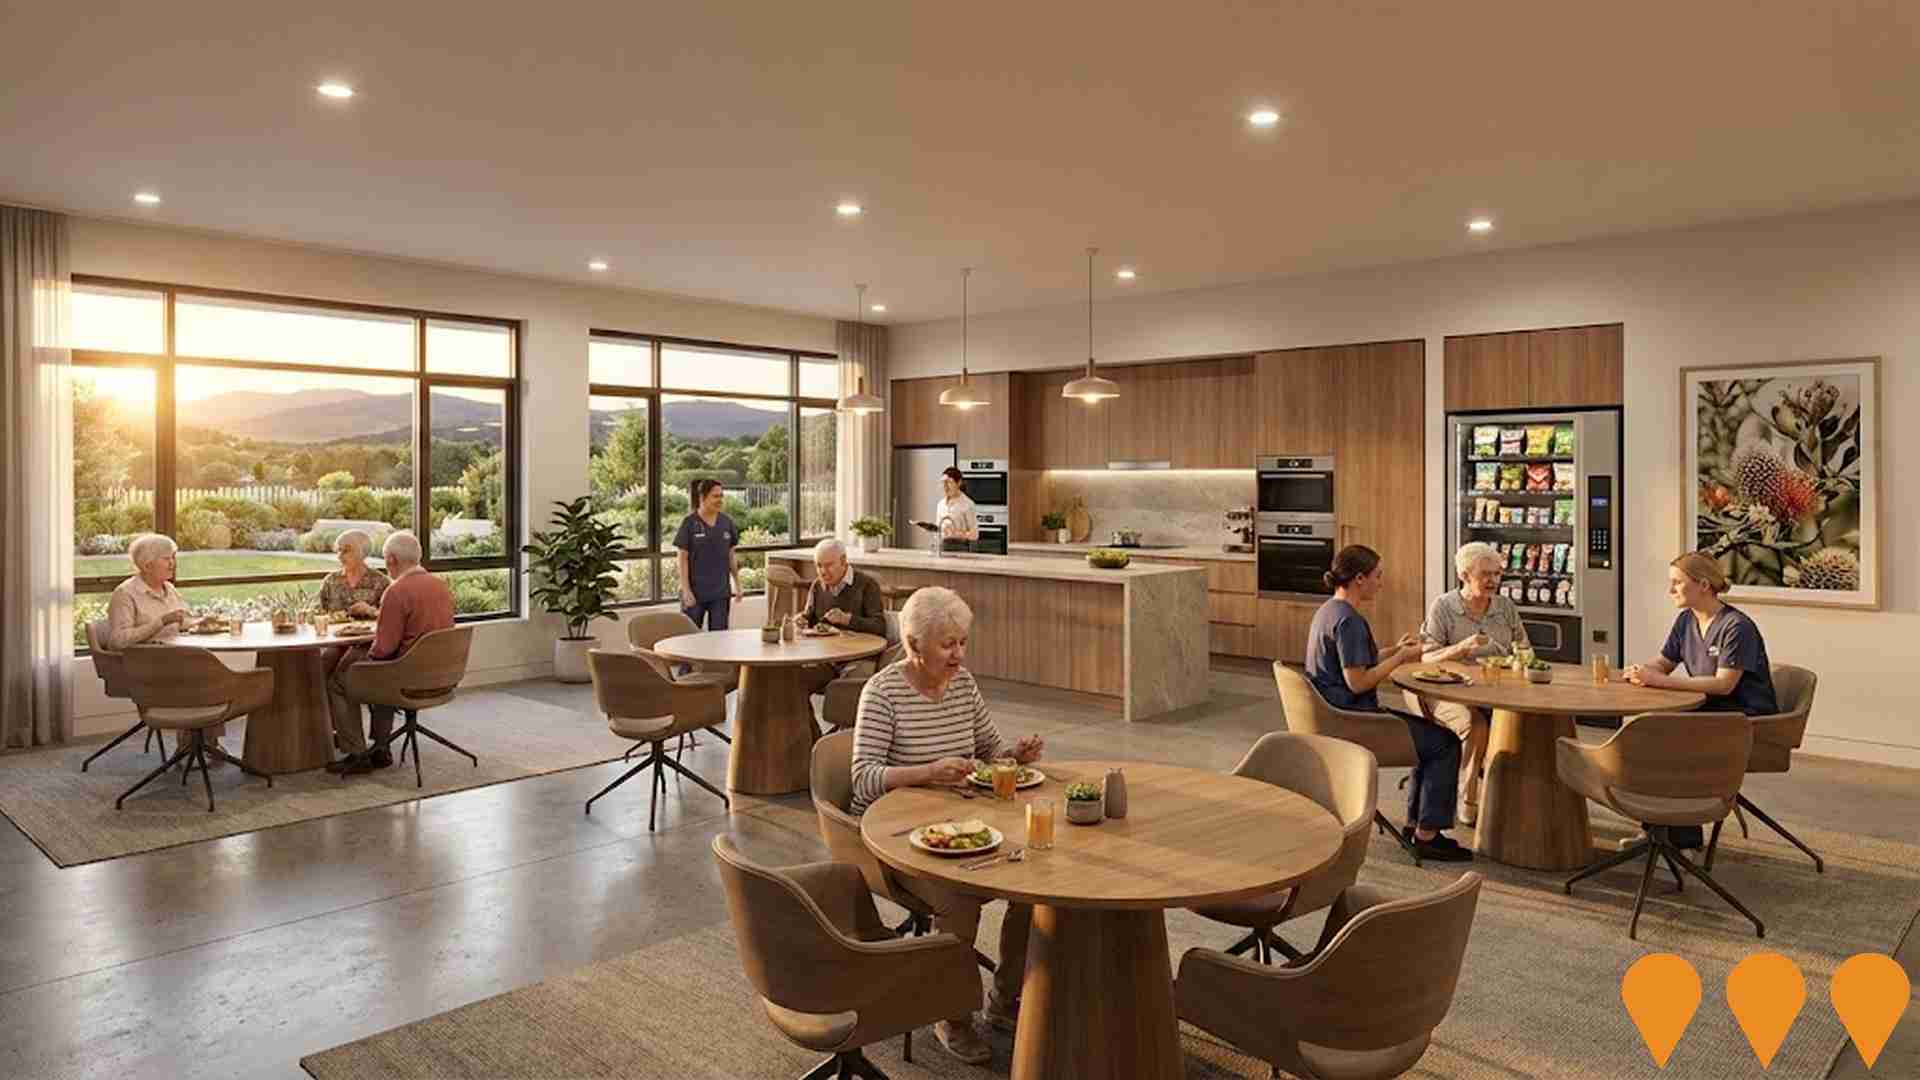
 Denotes AI-based impression for illustrative purposes only, not to be taken as definitive under any circumstances. Please follow links and conduct other investigations from the project's source for actual imagery. Developers and project owners wishing us to use original imagery please Contact Us and we will do so.
Frequently Asked Questions - Infrastructure
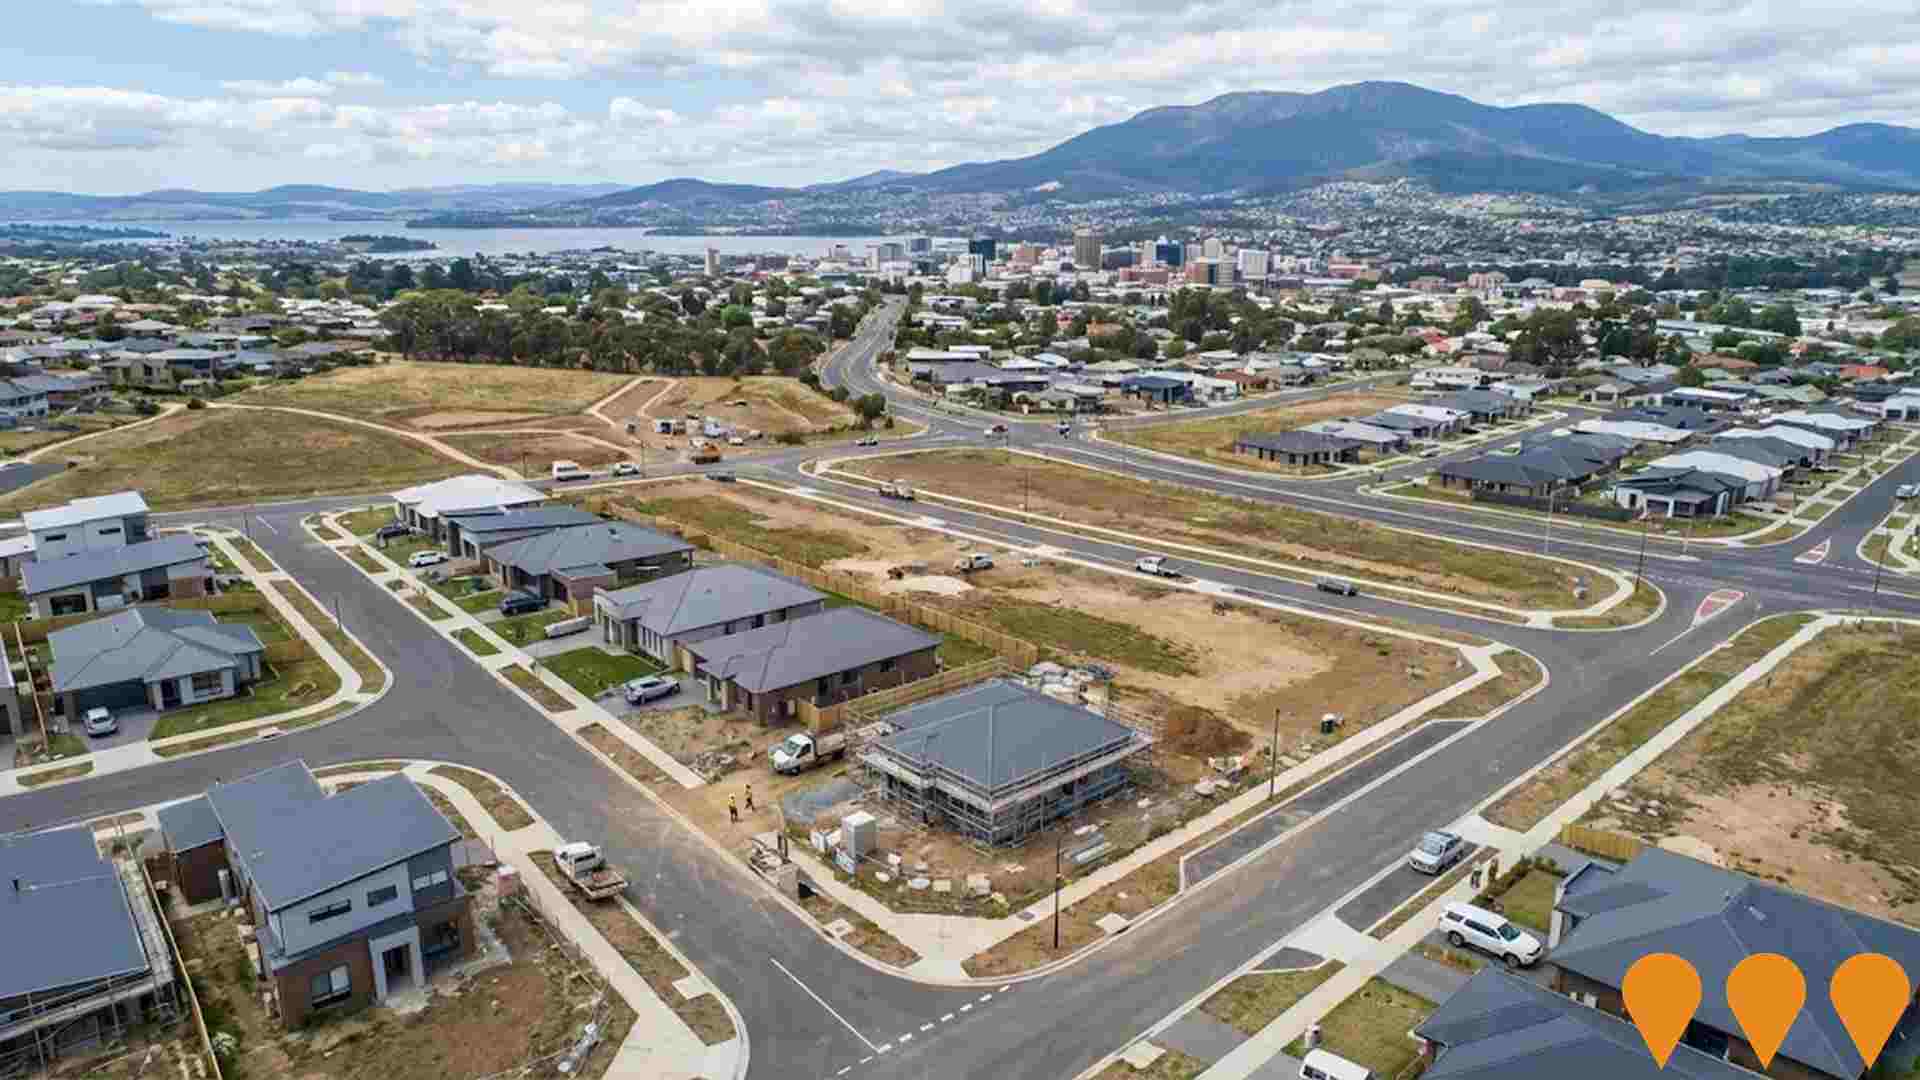
Greater Hobart Urban Growth Boundary Extension
Tasmanian Government initiative to extend the Greater Hobart urban growth boundary by 615 hectares across Brighton, Clarence, Glenorchy, Hobart, Kingborough and Sorell local government areas. Enables release of land for approximately 10,000 new homes over the next 15-20 years to address acute housing supply shortage. Approved by Parliament in November 2024 via the Land Use Planning and Approvals Amendment (Major Projects) Act 2024.
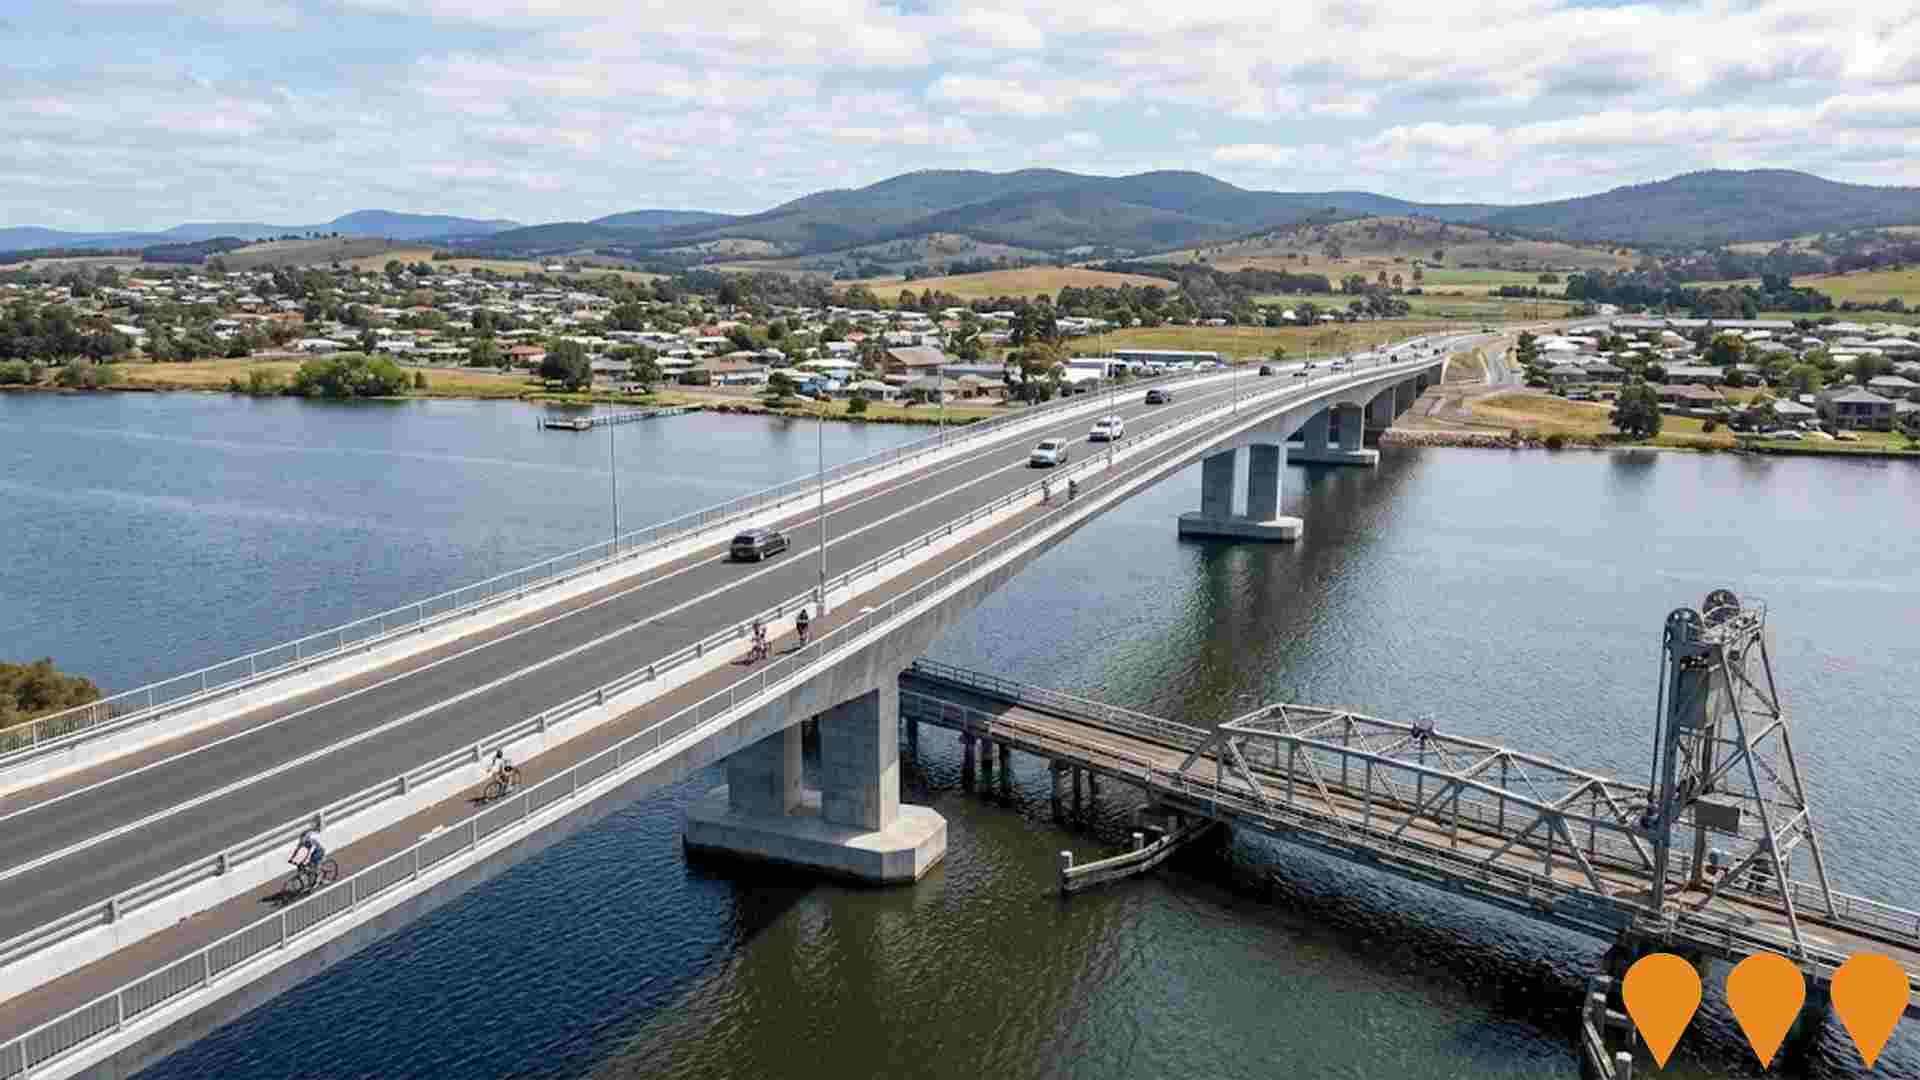
New Bridgewater Bridge
The New Bridgewater Bridge is a 1.2-kilometre four-lane concrete box girder bridge that opened on June 1, 2025, replacing the 78-year-old lift-span bridge across the River Derwent. Tasmania's largest ever transport infrastructure project connects the Brooker Highway at Granton to the Midland Highway at Bridgewater, serving 22,000 trips daily. The $786 million bridge features enhanced interchanges at both ends, a 3-metre-wide shared pathway for cyclists and pedestrians, and 16-metre marine navigation clearance matching the Bowen Bridge. Construction utilized 1,082 precast concrete segments produced in a purpose-built facility. The project supported over 1,000 direct and indirect jobs and won the prestigious Australian Construction Achievement Award in August 2025. The bridge was delivered on time and on budget, with the Australian Government contributing $628.8 million and the Tasmanian Government contributing $157.2 million.
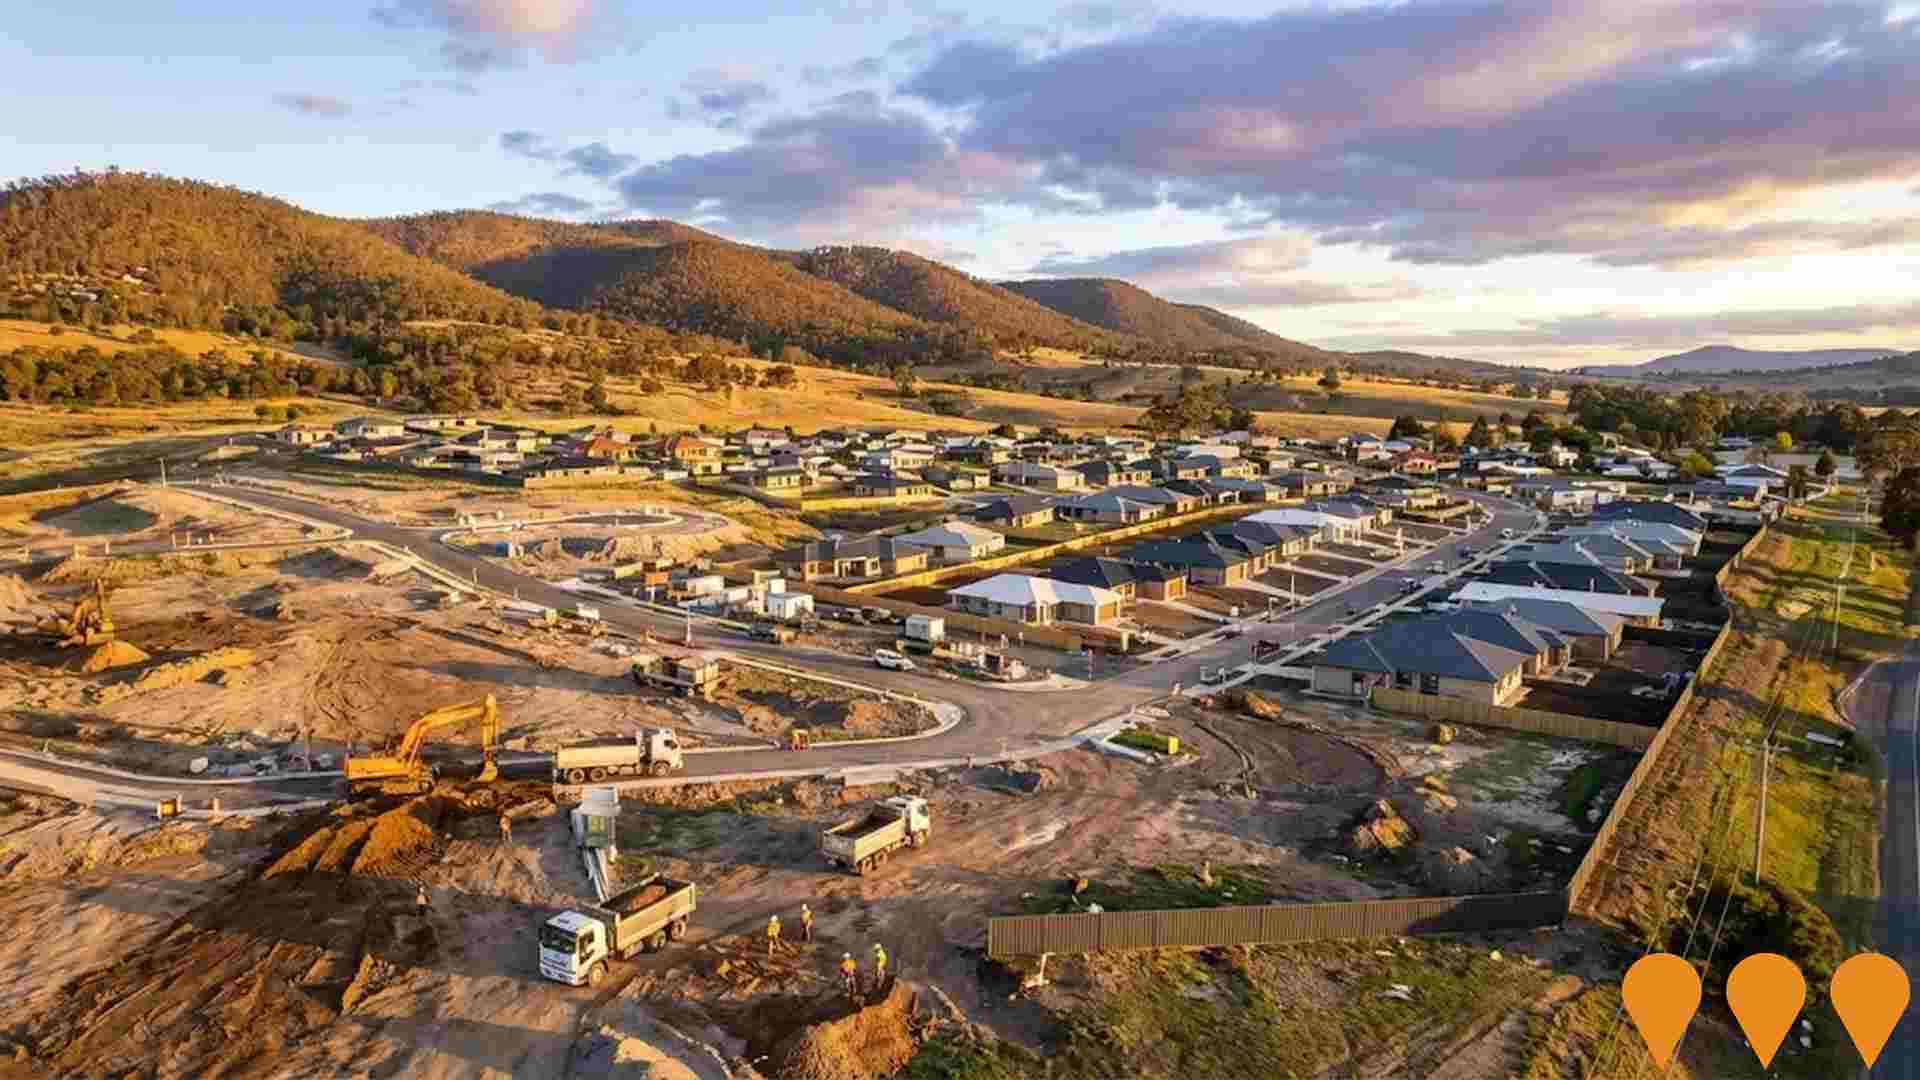
The Mills Precinct (including Noble Life New Norfolk Resort)
Large master-planned mixed-use precinct in New Norfolk. Original $500m+ vision included 700+ homes, private hospital, retirement village, hotel and commercial areas. Developer entered administration in July 2024 with ~1/3 of homes built. Project restructured: the over-50s lifestyle resort component has restarted as Noble Life New Norfolk Resort (186 homes, $75m), with earthworks and civil works underway from March 2025 and home construction commencing late 2025. The broader master-plan (hospital, remaining residential, hotel, commercial) remains on hold pending new ownership/investment; no active construction outside the Noble Life component as of December 2025.
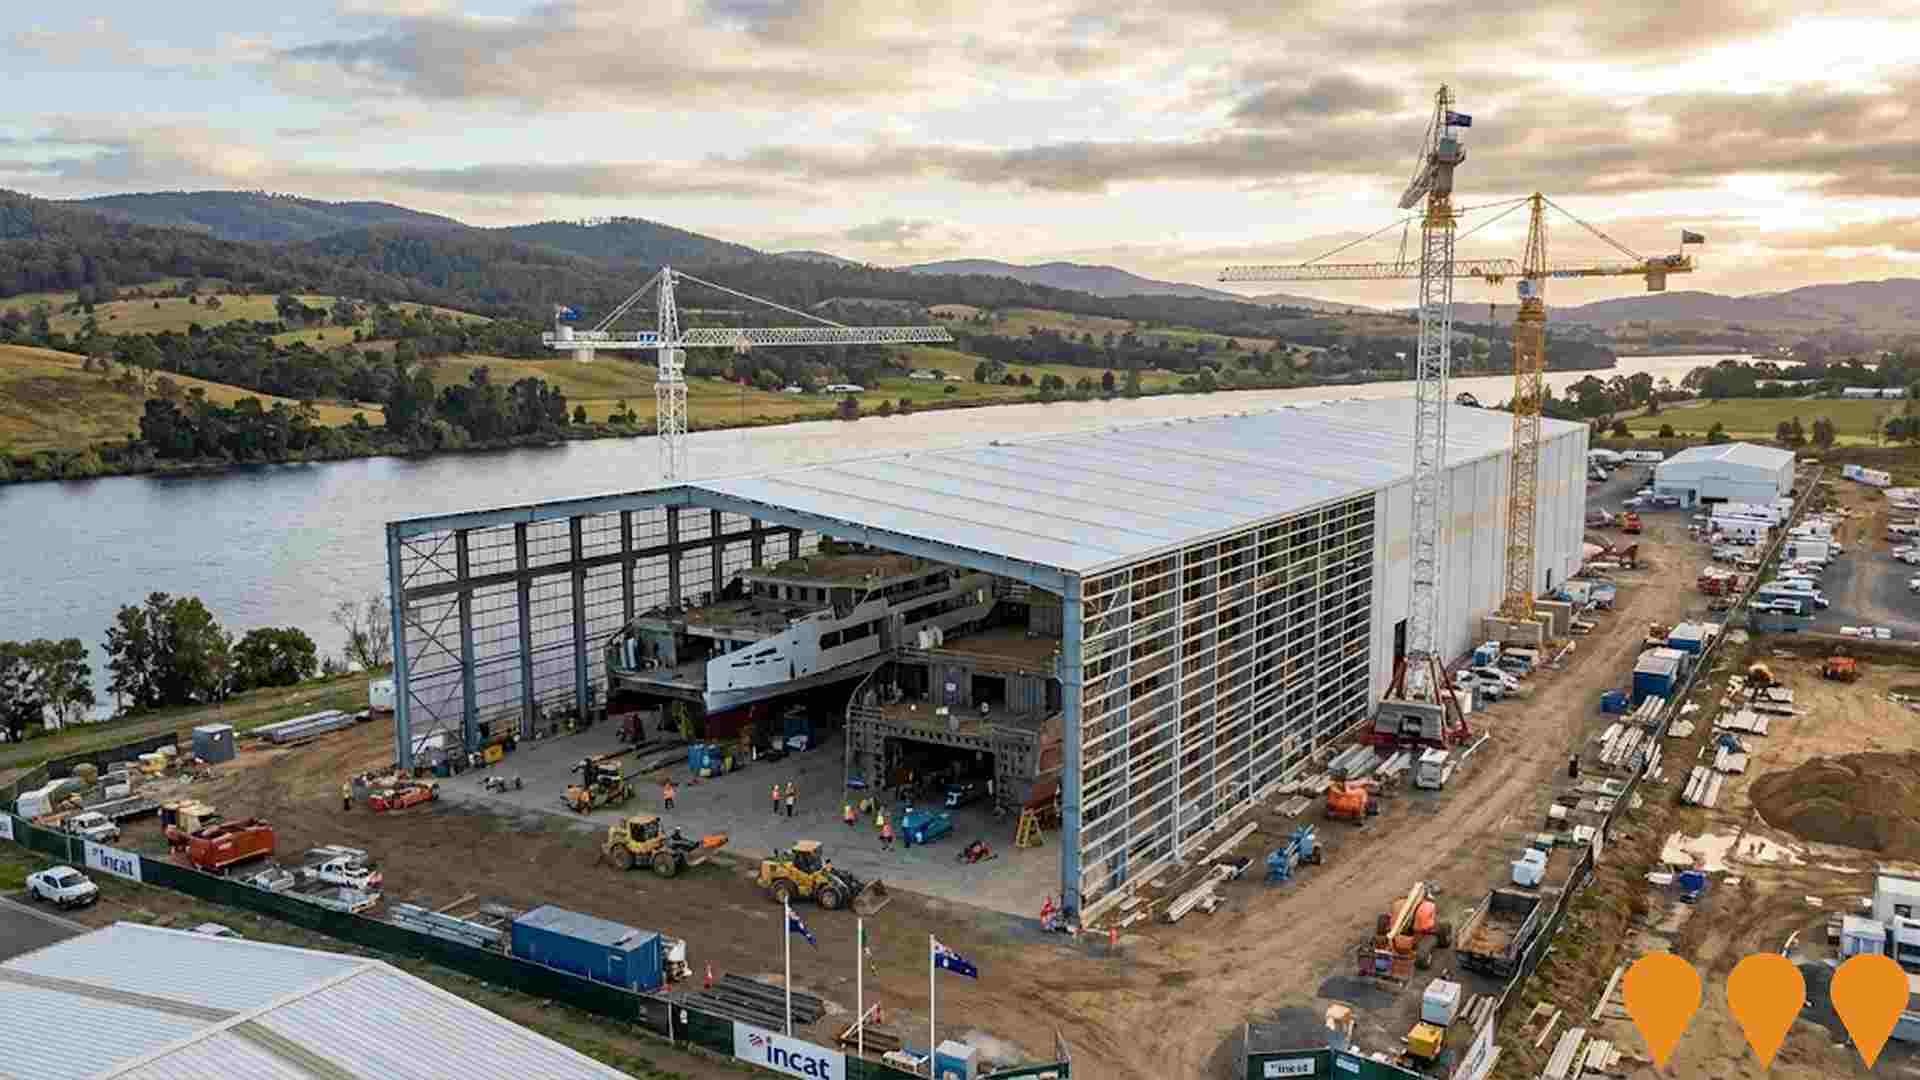
Incat Boyer Ferry Manufacturing Facility
New 12-hectare shipbuilding facility for construction of electric ferries. Features 240x120m production facility capable of constructing three large vessels simultaneously. Expected to create 500 new jobs and double Incat's workforce. Construction begins 2026.
Homes Tasmania Social Housing Program
Statewide social housing program delivering over 1,000 social housing dwellings under the Community Housing Growth Program. Includes 23 new units approved at Glenorchy site and 15 new units at another Glenorchy location, with modular construction methods to accelerate delivery.
Hobart City Deal
A 10-year partnership (2019-2029) between the Australian and Tasmanian Governments and the Clarence, Glenorchy, Hobart and Kingborough councils to deliver coordinated investments across Greater Hobart, including major transport upgrades such as the New Bridgewater Bridge, activation of the Northern Suburbs Transit Corridor, airport border services, Antarctic and science precinct initiatives, housing and urban renewal, and smart city programs.

Derwent Valley Health and Wellbeing Hub
Multi-purpose health and wellbeing facility by Corumbene Care. Received $3.75 million federal grant. Will provide expanded health services to Derwent Valley region including aged care and medical services.
Willow Court Heritage Precinct Redevelopment
Adaptive reuse of Australia's oldest continually operated asylum site. Includes heritage interpretation centre, tourism facilities, hospitality venues, and potential museum development. Multiple buildings undergoing restoration.

Employment
Despite maintaining a low unemployment rate of 3.5%, Derwent Valley has experienced recent job losses, resulting in a below average employment performance ranking when compared nationally
Derwent Valley's workforce is balanced across white and blue collar jobs, with prominent essential services sectors. The unemployment rate here was 3.5% in June 2025.
Compared to the Rest of Tas., Derwent Valley had an unemployment rate 0.4% lower at 3.9%, and a workforce participation rate of 58.1%. Key industries for employment among residents are health care & social assistance, construction, and agriculture, forestry & fishing. Construction is particularly strong here, with an employment share 1.3 times the regional level. Conversely, retail trade has lower representation at 7.9% versus the regional average of 10.1%.
The area may have limited local employment opportunities, as seen in the count of Census working population versus resident population. Between June 2024 and May 2025, labour force decreased by 4.9%, employment declined by 5.3%, leading to a 0.4 percentage point rise in unemployment rate. This contrasts with Rest of Tas., where employment contracted by 0.5%, labour force fell by 0.6%, and unemployment fell marginally. Jobs and Skills Australia's national employment forecasts from May 2025 project national employment growth of 6.6% over five years and 13.7% over ten years. Applying these projections to Derwent Valley's employment mix suggests local growth of approximately 6.0%% over five years and 12.8% over ten years, although these are simple extrapolations for illustrative purposes only.
Frequently Asked Questions - Employment
Income
Income figures position the area below 75% of locations analysed nationally by AreaSearch
Derwent Valley's median income among taxpayers was $46,955 in financial year 2022. The average income stood at $51,803 during the same period. For comparison, Rest of Tas.'s median and average incomes were $47,358 and $57,384 respectively. By September 2025, estimates project Derwent Valley's median income to be approximately $53,449 and the average at around $58,967, accounting for a 13.83% growth since financial year 2022 as per Wage Price Index data. Census data indicates that household, family, and personal incomes in Derwent Valley fall between the 18th and 23rd percentiles nationally. Income distribution shows that 32.0% of individuals (1,120 people) earn within the $1,500 - $2,999 bracket, which is consistent with surrounding regions at 28.5%. Despite modest housing costs allowing for 88.1% income retention, total disposable income ranks at only the 28th percentile nationally.
Frequently Asked Questions - Income
Housing
Derwent Valley is characterized by a predominantly suburban housing profile, with ownership patterns similar to the broader region
The latest Census evaluation of dwelling structures in Derwent Valley revealed that 98.2% were houses and 1.9% other dwellings (semi-detached, apartments, 'other' dwellings). In comparison, Non-Metro Tas. had 97.8% houses and 2.2% other dwellings. Home ownership in Derwent Valley was 43.6%, with mortgaged dwellings at 46.7% and rented dwellings at 9.7%. The median monthly mortgage repayment was $1,239, higher than Non-Metro Tas.'s average of $1,200. The median weekly rent figure in Derwent Valley was $258, compared to Non-Metro Tas.'s $240. Nationally, Derwent Valley's mortgage repayments were significantly lower than the Australian average of $1,863, while rents were substantially below the national figure of $375.
Frequently Asked Questions - Housing
Household Composition
Derwent Valley has a typical household mix, with a higher-than-average median household size
Family households account for 74.3% of all households, including 31.4% couples with children, 32.7% couples without children, and 9.7% single parent families. Non-family households make up the remaining 25.7%, consisting of 23.7% lone person households and 1.3% group households. The median household size is 2.6 people, larger than the Rest of Tas average of 2.4.
Frequently Asked Questions - Households
Local Schools & Education
Derwent Valley faces educational challenges, with performance metrics placing it in the bottom quartile of areas assessed nationally
The area's university qualification rate is 13.3%, significantly lower than Australia's average of 30.4%. This presents both a challenge and an opportunity for targeted educational initiatives. Bachelor degrees are the most common at 8.6%, followed by postgraduate qualifications (3.3%) and graduate diplomas (1.4%). Vocational credentials are prevalent, with 41.4% of residents aged 15+ holding them, including advanced diplomas (9.3%) and certificates (32.1%).
Educational participation is high at 28.3%, with 12.0% in primary education, 8.8% in secondary education, and 2.5% pursuing tertiary education. Glenora District School and Westerway Primary School serve a total of 260 students in the area. The educational mix includes one primary school and one K-12 school.
Frequently Asked Questions - Education
Schools Detail
Nearby Services & Amenities
Transport
No public transport data available for this catchment area.
Frequently Asked Questions - Transport
Transport Stops Detail
Health
Health performance in Derwent Valley is well below average with prevalence of common health conditions notable across both younger and older age cohorts
Health data indicates significant challenges in Derwent Valley's healthcare landscape. The prevalence of common health conditions is high across both younger and older age groups.
Private health cover is low, with approximately 46% of the total population (~1,618 people) having it, compared to the national average of 55.3%. Mental health issues and arthritis are the most prevalent medical conditions in the area, affecting 10.9% and 10.1% of residents respectively. Conversely, 62.7% of residents report being completely free from medical ailments, similar to the Rest of Tas. (62.3%). The area has a lower proportion of seniors aged 65 and over at 19.8% (693 people), compared to Rest of Tas.'s 22.0%. Despite this, health outcomes among seniors in Derwent Valley are above average, outperforming the general population in health metrics.
Frequently Asked Questions - Health
Cultural Diversity
The latest Census data sees Derwent Valley placing among the least culturally diverse areas in the country when compared across a range of language and cultural background related metrics
Derwent Valley's cultural diversity was below average, with 90.4% citizens, 89.6% born in Australia, and 98.1% speaking English only at home. Christianity dominated at 44.1%. Judaism was overrepresented at 0.3%, compared to 0.1% regionally.
Top ancestry groups were English (35.9%), Australian (34.2%), Irish (8.1%). Dutch (1.6%) and Welsh (0.5%) were notably overrepresented, while Australian Aboriginal (4.5%) was slightly underrepresented compared to regional averages.
Frequently Asked Questions - Diversity
Age
Derwent Valley hosts an older demographic, ranking in the top quartile nationwide
Derwent Valley's median age is 44, comparable to Rest of Tas.'s figure of 45 but significantly higher than Australia's norm of 38. The 45-54 age group constitutes 15.7%, higher than Rest of Tas., while the 25-34 cohort is less prevalent at 8.8%. Post-2021 Census data shows the 75 to 84 age group grew from 4.4% to 5.9%, and the 15 to 24 cohort increased from 12.5% to 13.8%. Conversely, the 5 to 14 cohort declined from 12.5% to 10.7%, and the 35 to 44 group dropped from 12.9% to 11.2%. By 2041, Derwent Valley's age composition is expected to shift notably. Leading this shift, the 75 to 84 group will grow by 32%, reaching 273 from 206. The aging population trend is clear, with those aged 65 and above comprising 77% of projected growth. Conversely, population declines are projected for the 0 to 4 and 45 to 54 cohorts.
