Chart Color Schemes
est. as @ -- *
ABS ERP | -- people | --
2021 Census | -- people
Sales Activity
Curious about local property values? Filter the chart to assess the volume and appreciation (including resales) trends and regional comparisons, or scroll to the map below view this information at an individual property level.
Find a Recent Sale
Sales Detail
Population
Claremont has seen population growth performance typically on par with national averages when looking at short and medium term trends
Claremont's population was 8,397 as of Aug 2021. By Aug 2025, it is estimated to be around 8,726, an increase of 329 people (3.9%). This growth is inferred from ABS data showing an estimated resident population of 8,614 in June 2024 and 202 validated new addresses since the Census date. The population density is 486 persons per square kilometer. Claremont's growth exceeded its SA3 area's 2.4% increase since the 2021 Census. Overseas migration contributed approximately 79.8% of overall population gains recently.
AreaSearch uses ABS/Geoscience Australia projections for each SA2 area, released in 2024 with a 2022 base year. For areas not covered by this data and post-2032 growth by age group, Tasmania State Government's Regional/LGA projections released in 2022 with a 2021 base year are adopted with adjustments made using weighted aggregation of population growth from LGA to SA2 levels. Based on projected demographic shifts, Claremont is expected to increase by 569 persons to 2041, representing a total increase of 5.2% over the 17 years.
Frequently Asked Questions - Population
Development
Recent residential development output has been above average within Claremont when compared nationally
Claremont recorded approximately 43 residential properties granted approval annually over the past five financial years, totalling 217 homes. As of FY-26, 8 approvals have been recorded. On average, 1.6 people moved to Claremont per year for each dwelling built between FY-21 and FY-25, indicating balanced supply and demand with stable market conditions. The average construction cost value of new homes was $344,000, below the regional average, suggesting more affordable housing options for buyers.
In FY-26, $2.1 million in commercial approvals were registered, reflecting Claremont's residential nature. Compared to Greater Hobart, Claremont recorded 15.0% higher construction activity per person over the five-year period, balancing buyer choice while supporting current property values. All recent development comprised detached dwellings, preserving Claremont's low-density character and attracting space-seeking buyers.
Notably, developers built more traditional houses than the current mix suggests (73.0% at Census), indicating strong demand for family homes despite density pressures. Claremont reflects a low-density area with approximately 196 people per approval. By 2041, Claremont is projected to grow by 457 residents. At current development rates, new housing supply should comfortably meet demand, providing favourable conditions for buyers and potentially supporting population growth beyond projections.
Frequently Asked Questions - Development
Infrastructure
Claremont has limited levels of nearby infrastructure activity, ranking in the 6thth percentile nationally
Changes to local infrastructure significantly influence an area's performance. AreaSearch has identified 16 projects likely impacting the area. Notable ones include Chocolate Experience at Cadbury Tasmania, Claremont Village Retail Expansion, Glenorchy Sports Centre, and Whitestone Point Housing Development. The following list details those most relevant:.
Professional plan users can use the search below to filter and access additional projects.
INFRASTRUCTURE SEARCH
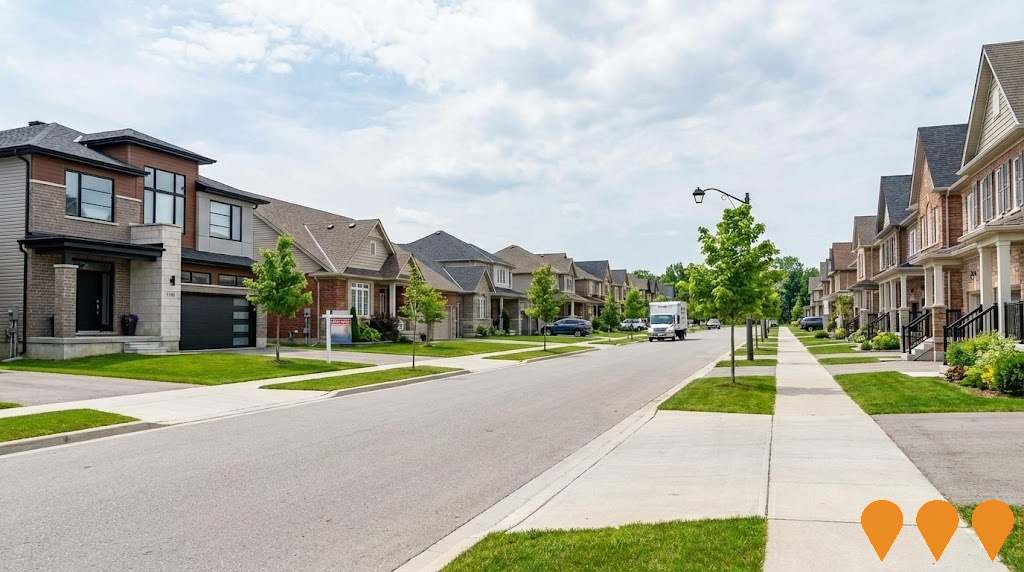
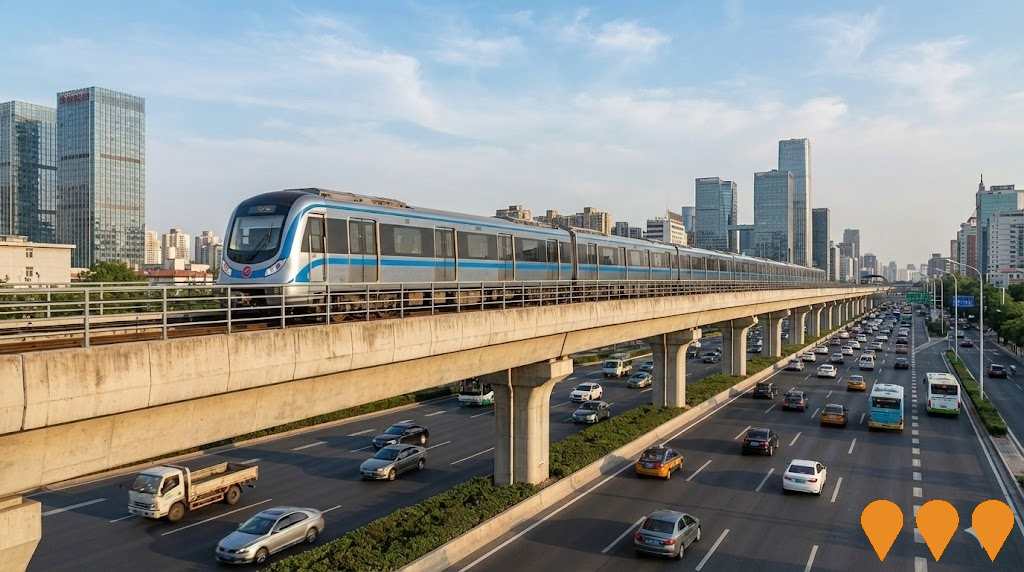
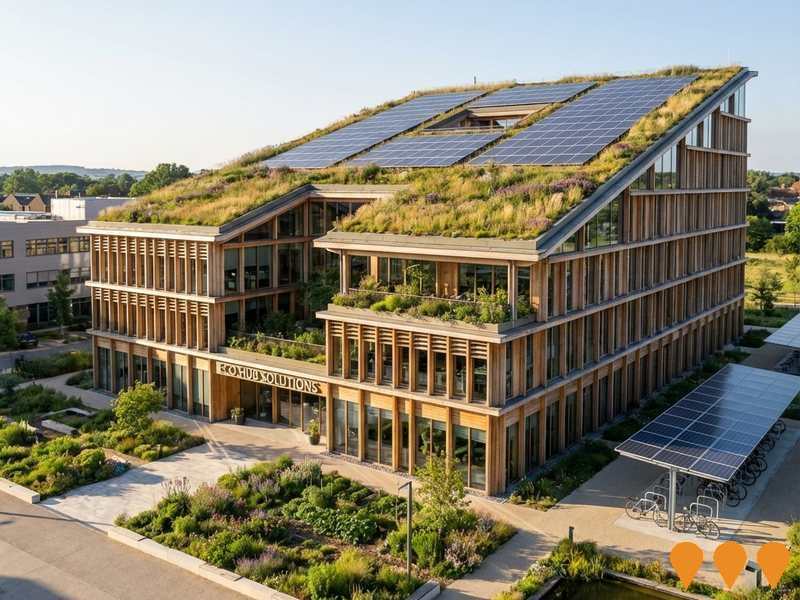
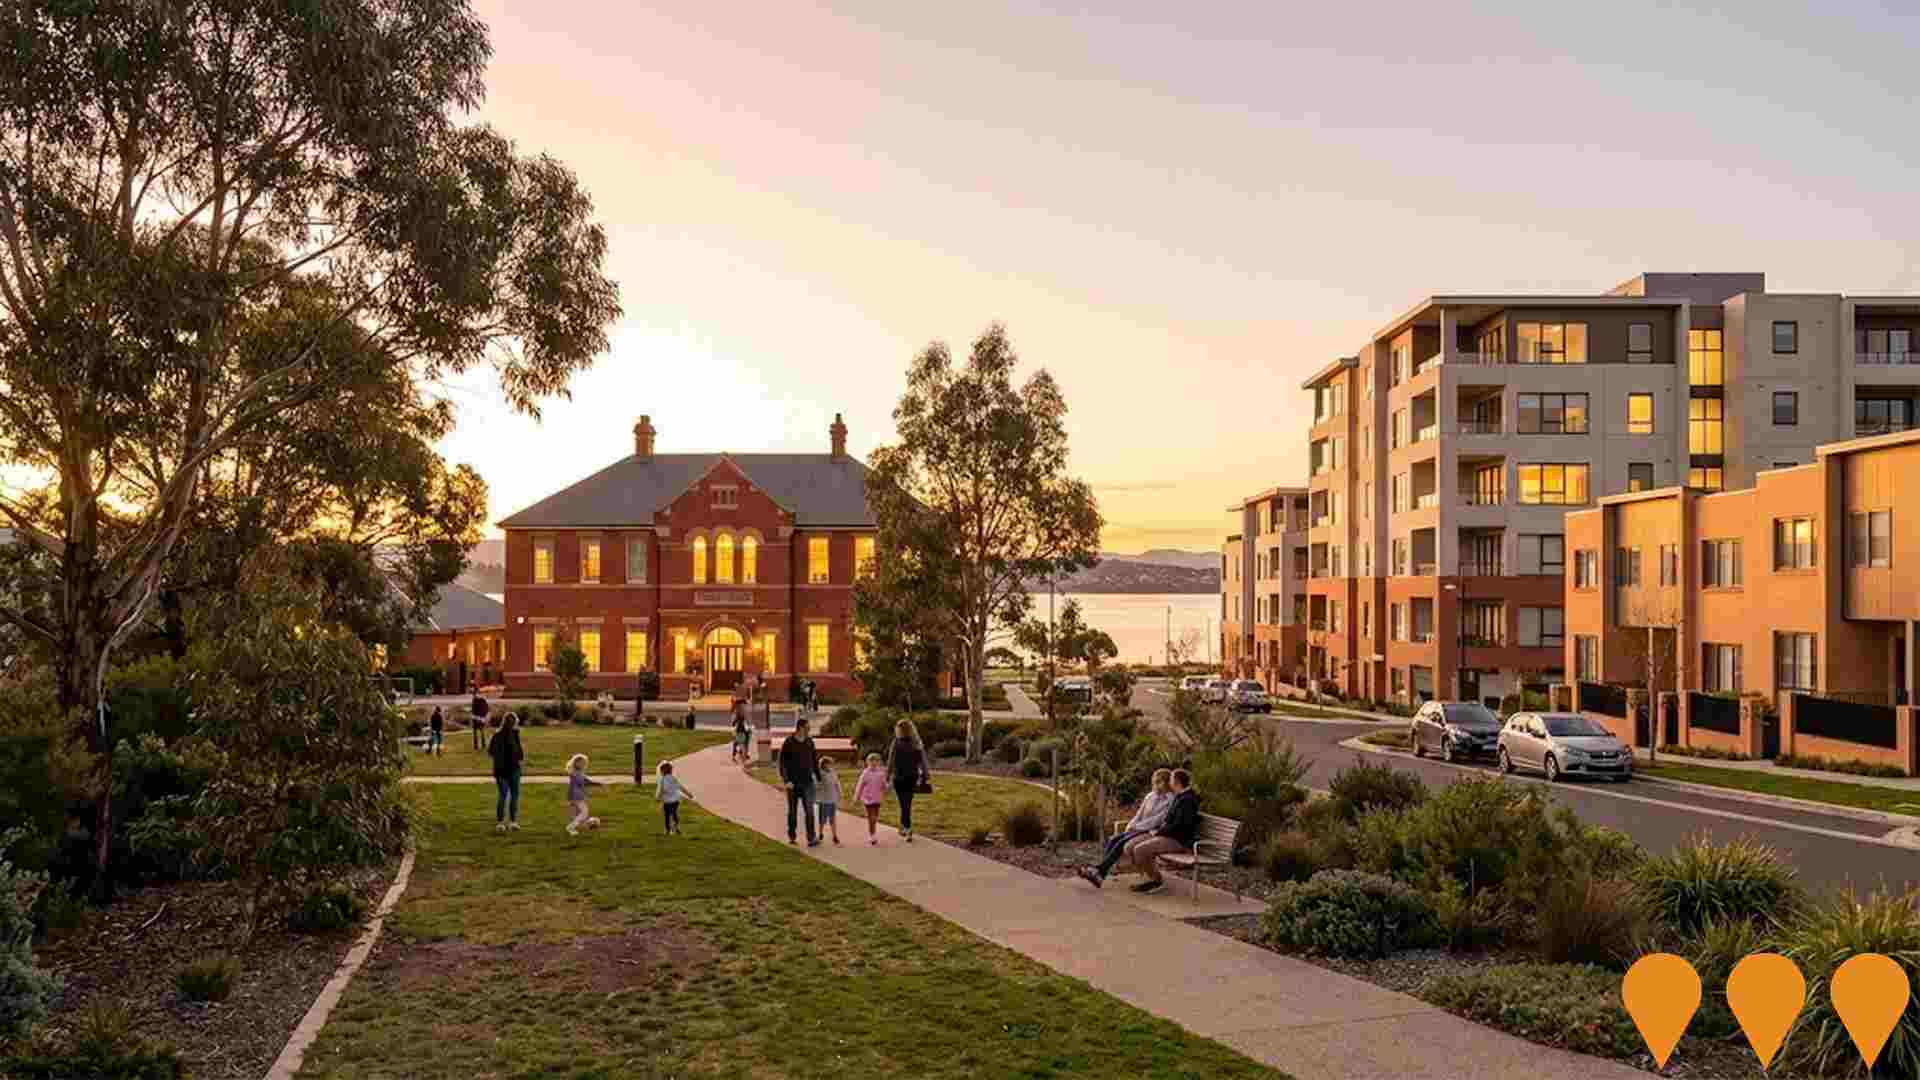
 Denotes AI-based impression for illustrative purposes only, not to be taken as definitive under any circumstances. Please follow links and conduct other investigations from the project's source for actual imagery. Developers and project owners wishing us to use original imagery please Contact Us and we will do so.
Frequently Asked Questions - Infrastructure
Wilkinsons Point Precinct
A transformational $500 million mixed-use precinct on a 15-hectare waterfront site featuring a 12-storey, 250-room hotel, 120 student apartments, sports centre with basketball courts and gyms, waterfront food and beverage facilities, sports-related retail, public spaces and trails, ferry terminal, and community facilities. The development will be staged across three phases and aims to create a sports and entertainment destination comparable to what MONA has achieved for culture and arts in Tasmania's northern suburbs.

Chocolate Experience at Cadbury Tasmania
A $150 million flagship tourism development that will transform the waterfront parklands beside the Cadbury factory at Claremont into the Chocolate Experience at Cadbury Tasmania. The project will create an immersive visitor attraction featuring Chocolate Central, a Chocolate Immersion Tour with zones such as the Cacao Forest, Chocolate Lab, Dairy and Taste Kitchen, along with a Chocolate Lounge, Premium Chocolate Studio, Build Your Own Bar experience and retail emporium. The precinct will add a new ferry terminal, upgraded foreshore paths and landscaped public areas, and is forecast to attract around 550,000 visitors a year and inject about $120 million annually into the Tasmanian visitor economy.

Windermere Bay Precinct
A 3.75 hectare mixed-use development on the former Claremont Primary School site comprising 261 apartments, 54 townhouses (315 dwellings total), childcare centre, cafe, community hall, and local shopping spaces. The project is designed by award-winning Tasmanian architects Circa Morris-Nunn Chua and aims to provide quality affordable housing in a medium-density model. The development preserves historic school buildings for community use and features two large green spaces with river views. The precinct aligns with the Greater Glenorchy Plan to increase density along the northern transport corridor.
Claremont Village Retail Expansion
Planned expansion and refurbishment of the Claremont Village neighbourhood shopping centre (trading as Claremont Plaza) in central Claremont. The project is expected to deliver additional specialty retail space, upgrades to car parking and improved pedestrian links, supporting the Greater Glenorchy Plan vision for an expanded retail and food precinct around the Claremont village core.
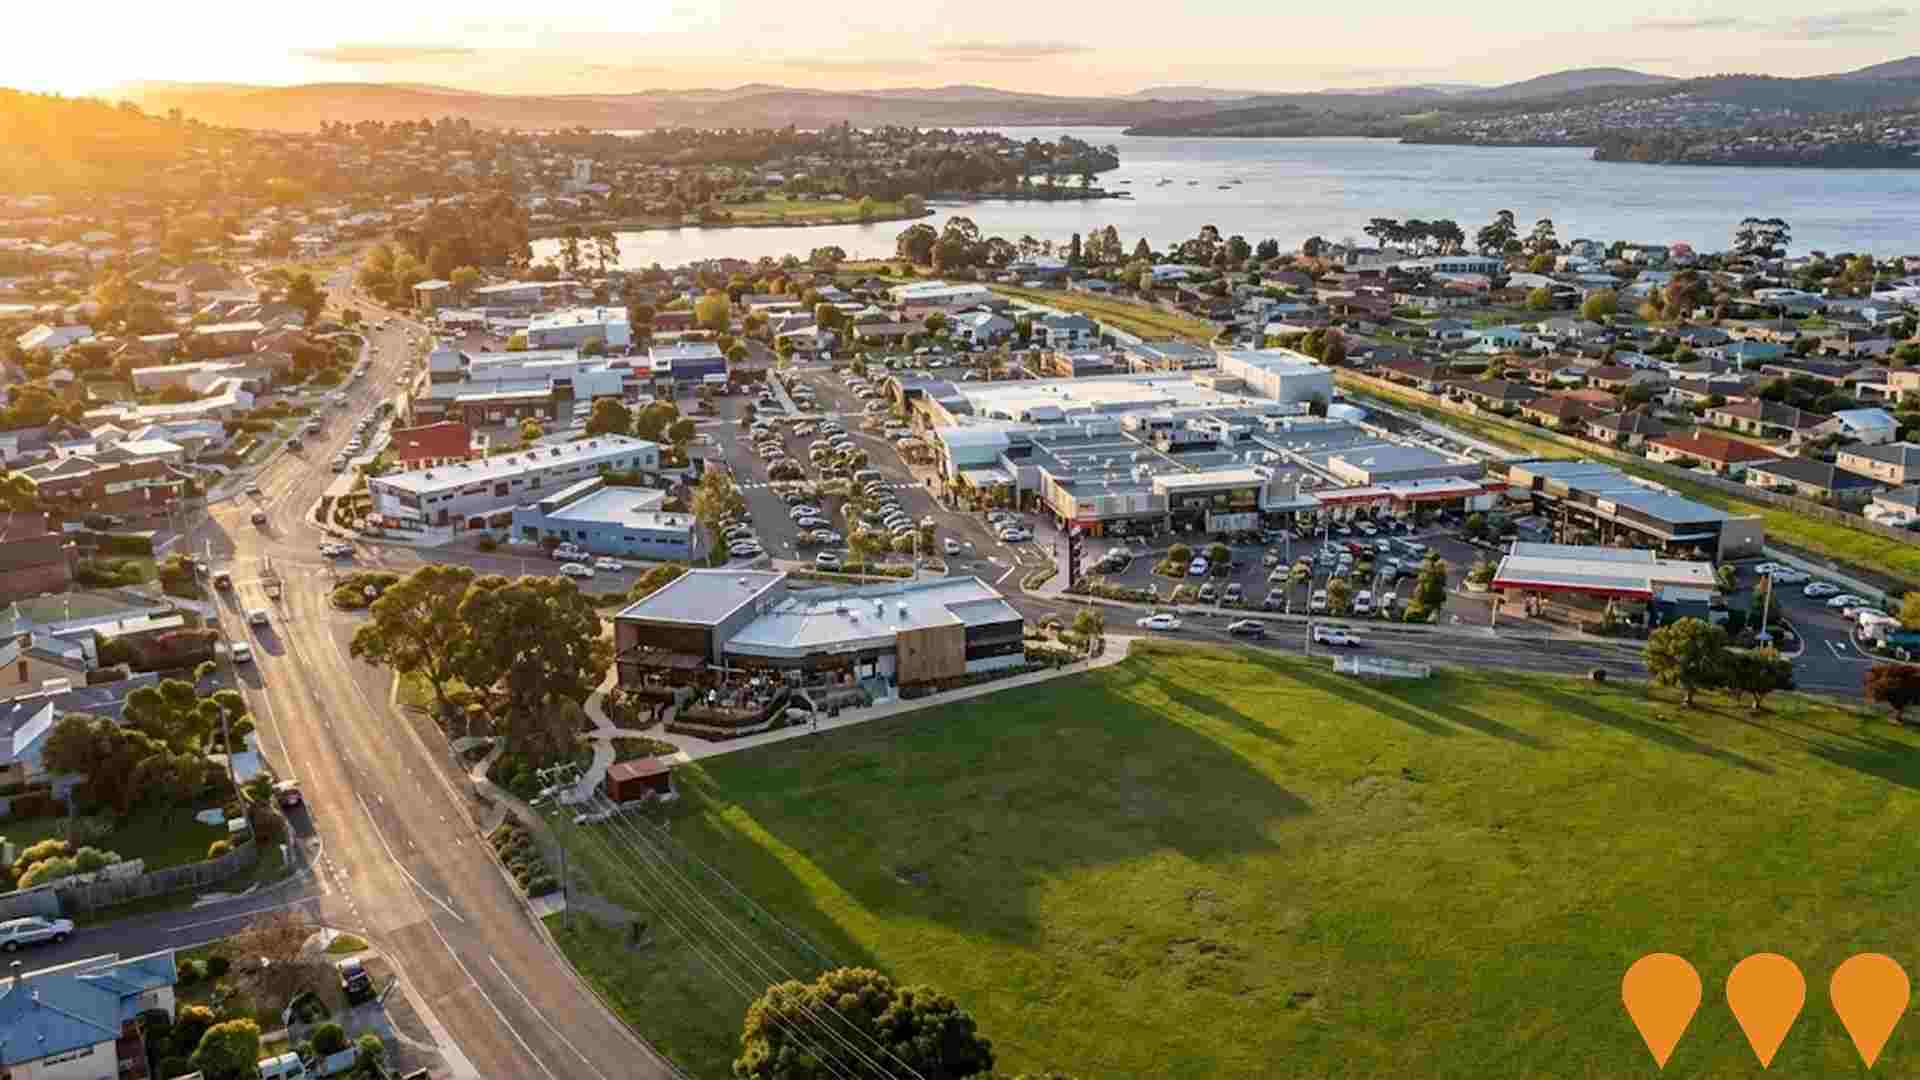
Glenorchy Sports Centre
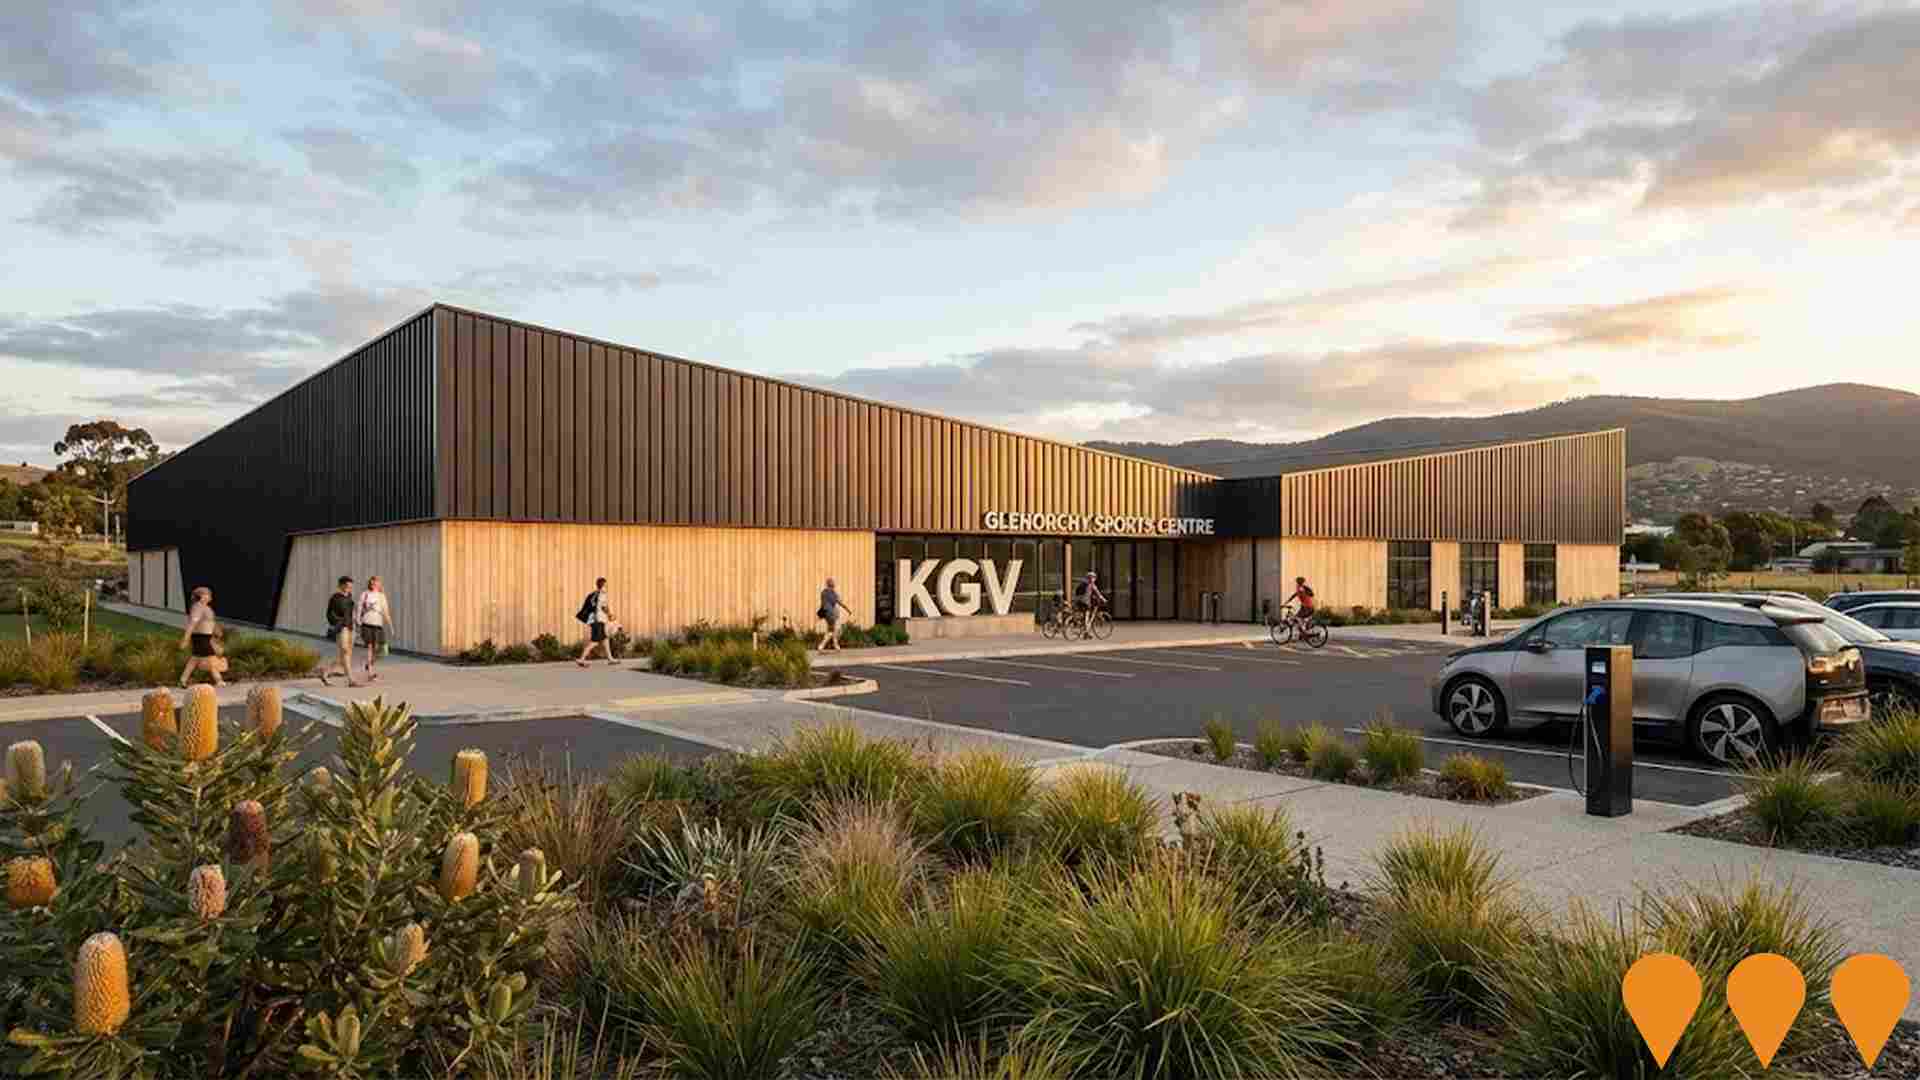
A modern $28 million multi-sport facility featuring four indoor courts including a dedicated show court for netball, basketball, futsal, volleyball and wheelchair sports. The centre includes spectator seating for up to 600 patrons (300 permanent, 300 portable), modern change rooms with parent and sensory rooms, a registered Changing Places facility, three multi-purpose meeting and event spaces, administrative areas with foyer, reception, office space and kiosk, and secure storage options. The facility will include 68 car parks with three DDA-compliant spaces, two electric vehicle charging stations, dedicated drop-off and loading bay, motorbike parking and bike racks. Located at the entrance of Claremont College, the project has received planning approval and construction tender closed December 17, 2025, with construction expected to commence Q1 2026 and practical completion Q1 2027.
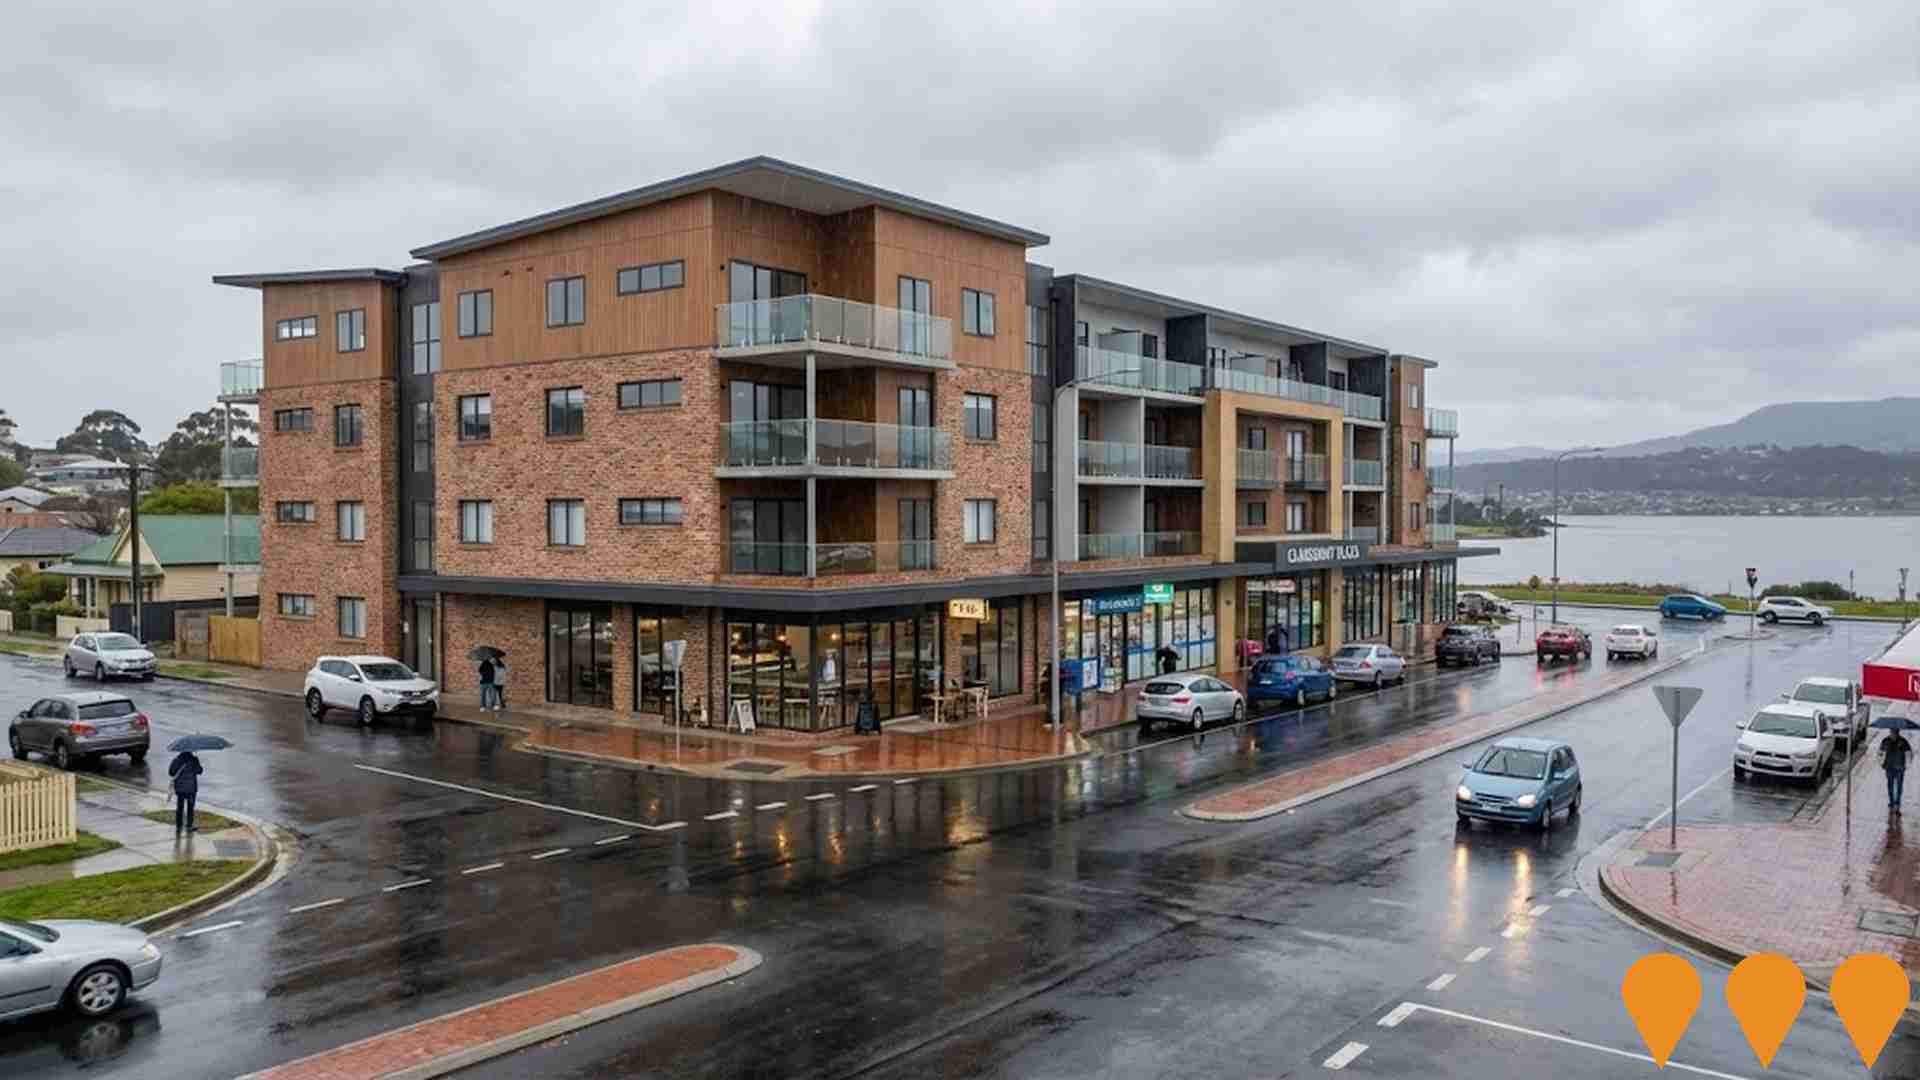
Abbotsfield Road Mixed-Use Development
Proposed mixed-use, medium-density development opposite Claremont Plaza, comprising approximately 80 apartments above ground-floor retail and commercial tenancies.
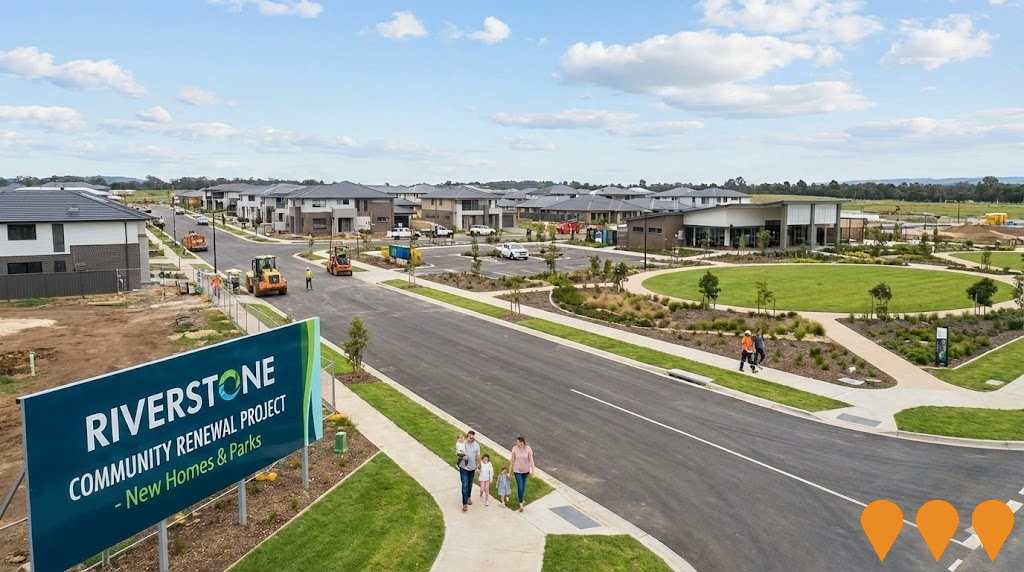
Glenorchy Showgrounds Redevelopment
Comprehensive redevelopment of Glenorchy Showgrounds including new facilities for events, sports and community activities. Modern amenities and improved accessibility.

Whitestone Point Housing Development
A boutique masterplanned residential development comprising 243 residential lots on the River Derwent in Austins Ferry. The subdivision was developed on the former Gunns site and included over 120,000m3 of earthworks, full service network installation including stormwater, sewerage, water mains, power and communications, and a new roundabout on Main Road. Positioned on the River Derwent with water views, the development offers premium lifestyle living close to Hobart CBD, MONA, St Virgil's College, and local amenities. Construction completed March 2021 with lots continuing to be sold and homes built.
Employment
The labour market performance in Claremont lags significantly behind most other regions nationally
Claremont, Tasmania, has a skilled workforce with prominent essential services sectors. Its unemployment rate as of June 2025 is 6.0%.
In that month, 4,043 residents were employed, which was 1.9% higher than Greater Hobart's unemployment rate of 4.1%. However, workforce participation in Claremont was lower at 57.3%, compared to Greater Hobart's 61.6%. Key industries for employment among Claremont residents are health care & social assistance, retail trade, and construction. Notably, manufacturing shows a high concentration with employment levels at 1.6 times the regional average.
Conversely, education & training has lower representation at 6.4%, compared to the regional average of 10.8%. The area may offer limited local employment opportunities, as indicated by the difference between Census working population and resident population numbers. In the 12-month period ending June 2025, Claremont's labour force decreased by 1.6% and employment fell by 1.2%, leading to a unemployment rate drop of 0.4 percentage points. In comparison, Greater Hobart saw employment fall by 1.5%, labour force contract by 1.6%, and unemployment decrease by 0.2 percentage points during the same period. Jobs and Skills Australia's national employment forecasts from May 2025 project overall employment growth of 6.6% over five years and 13.7% over ten years. Applying these projections to Claremont's employment mix suggests potential local growth of approximately 6.3% over five years and 13.4% over ten years, based on a simple weighting extrapolation for illustrative purposes.
Frequently Asked Questions - Employment
Income
Income figures position the area below 75% of locations analysed nationally by AreaSearch
AreaSearch's aggregation of latest postcode level ATO data released for financial year 2022 indicates Claremont had a median income among taxpayers of $49,507 and an average level of $53,604. Both figures are below the national average, which stands at $51,272 for Greater Hobart. Based on Wage Price Index growth of 13.83% since financial year 2022, current estimates suggest approximately $56,354 (median) and $61,017 (average) as of September 2025. According to the 2021 Census, household, family, and personal incomes in Claremont all fall between the 16th and 24th percentiles nationally. Income distribution data shows that 29.8% of Claremont's population (2,600 individuals) have incomes ranging from $1,500 to $2,999, a pattern also seen at regional levels where 32.2% occupy this income range. Housing affordability pressures are severe in Claremont, with only 82.4% of income remaining, ranking at the 16th percentile nationally.
Frequently Asked Questions - Income
Housing
Claremont is characterized by a predominantly suburban housing profile, with a higher proportion of rental properties than the broader region
Claremont's dwelling structure, as per the latest Census, consisted of 73.1% houses and 26.9% other dwellings. In comparison, Hobart metro had 83.1% houses and 17.0% other dwellings. Home ownership in Claremont was 29.6%, with mortgaged dwellings at 33.8% and rented ones at 36.6%. The median monthly mortgage repayment was $1,300, aligning with Hobart metro's average. The median weekly rent figure was $320, matching Hobart metro's figure. Nationally, Claremont's mortgage repayments were lower than the Australian average of $1,863, and rents were below the national figure of $375.
Frequently Asked Questions - Housing
Household Composition
Claremont features high concentrations of lone person households, with a lower-than-average median household size
Family households account for 63.1% of all households, including 23.7% couples with children, 23.0% couples without children, and 15.5% single parent families. Non-family households constitute the remaining 36.9%, with lone person households at 33.7% and group households making up 3.1% of the total. The median household size is 2.3 people, which is smaller than the Greater Hobart average of 2.4.
Frequently Asked Questions - Households
Local Schools & Education
Claremont faces educational challenges, with performance metrics placing it in the bottom quartile of areas assessed nationally
The area's university qualification rate is 17.1%, significantly lower than the SA4 region average of 32.8%. Bachelor degrees are the most prevalent at 10.5%, followed by postgraduate qualifications (5.3%) and graduate diplomas (1.3%). Vocational credentials are also common, with 36.6% of residents aged 15+ holding them, including advanced diplomas (7.8%) and certificates (28.8%). Educational participation is high, with 27.7% of residents currently enrolled in formal education.
This includes 11.1% in primary, 7.0% in secondary, and 3.2% in tertiary education. Claremont's five schools have a combined enrollment of 1,845 students. The area has varied educational conditions with three primary, one secondary, and one K-12 school. School capacity exceeds typical residential needs (21.1 places per 100 residents vs the regional average of 14.6), indicating Claremont serves as an educational center for the broader region.
Frequently Asked Questions - Education
Schools Detail
Nearby Services & Amenities
Transport
Transport servicing is high compared to other areas nationally based on assessment of service frequency, route connectivity and accessibility
The analysis of public transport in Claremont shows that there are 66 active transport stops currently operating. These stops serve a mix of bus routes, totaling 105 individual routes. Together, these routes facilitate 8,753 weekly passenger trips.
The accessibility of transport is rated as excellent, with residents on average located just 192 meters from the nearest transport stop. On an average day, there are 1,250 trips across all routes, which amounts to approximately 132 weekly trips per individual stop.
Frequently Asked Questions - Transport
Transport Stops Detail
Health
Health performance in Claremont is well below average with a range of health conditions having marked impacts on both younger and older age cohorts
Claremont faces significant health challenges, as indicated by health data. Both younger and older age cohorts are affected by various health conditions.
Private health cover is low, at approximately 47% of the total population (~4,101 people), compared to the national average of 55.3%. Mental health issues and arthritis are the most common medical conditions in the area, impacting 11.5 and 11.0% of residents respectively. However, 60.5% of residents claim to be completely clear of medical ailments, compared to 63.7% across Greater Hobart. The area has a higher proportion of seniors aged 65 and over at 20.9%, with 1,822 people falling into this category, compared to 18.7% in Greater Hobart. Health outcomes among seniors present some challenges, broadly aligning with the general population's health profile.
Frequently Asked Questions - Health
Cultural Diversity
Claremont ranks below the Australian average when compared to other local markets across a number of language and cultural background related metrics
Claremont's cultural diversity was found to be below average, with 86.4% of its population being Australian citizens, born in Australia (85.4%), and speaking English only at home (89.3%). Christianity was the predominant religion, comprising 43.0% of Claremont's population. The most notable overrepresentation was found in the 'Other' category, which accounted for 1.7% of Claremont's population compared to 1.8% across Greater Hobart.
In terms of ancestry (country of birth of parents), the top three represented groups were English at 33.2%, Australian at 31.4%, and Irish at 7.0%. Notably, Australian Aboriginal was overrepresented in Claremont at 5.1% compared to 4.0% regionally, while Sri Lankan and Indian populations showed minimal divergence at 0.2% each versus regional percentages of 0.2% and 1.9%, respectively.
Frequently Asked Questions - Diversity
Age
Claremont's population is slightly younger than the national pattern
Claremont has a median age of 38, closely matching Greater Hobart's figure of 39 and Australia's median age of 38. Compared to the Greater Hobart average, Claremont has an over-representation of the 75-84 age cohort (8.1% locally) and an under-representation of the 25-34 age group (14.7%). Between 2021 and present, the 35-44 age group has increased from 12.4% to 13.8%, while the 25-34 cohort has decreased from 16.3% to 14.7%. Additionally, the 5-14 age group has dropped from 12.4% to 11.0%. By 2041, demographic modeling suggests significant changes in Claremont's age profile. The 45-54 age cohort is projected to expand by 417 people (43%), growing from 960 to 1,378. Conversely, both the 0-4 and 25-34 age groups are expected to decrease in number.
