Chart Color Schemes
This analysis uses ABS Statistical Areas Level 2 (SA2) boundaries, which can materially differ from Suburbs and Localities (SAL) even when sharing similar names.
SA2 boundaries are defined by the Australian Bureau of Statistics and are designed to represent communities for statistical reporting (e.g., census and ERP).
Suburbs and Localities (SAL) represent commonly-used suburb/locality names (postal-style areas) and may use different geographic boundaries. For comprehensive analysis, consider reviewing both boundary types if available.
est. as @ -- *
ABS ERP | -- people | --
2021 Census | -- people
Sales Activity
Curious about local property values? Filter the chart to assess the volume and appreciation (including resales) trends and regional comparisons, or scroll to the map below view this information at an individual property level.
Find a Recent Sale
Sales Detail
Population
An assessment of population growth drivers in Forster reveals an overall ranking slightly below national averages considering recent, and medium term trends
Forster's population, as of November 2025, is approximately 14,984. This figure represents a growth of 275 people since the 2021 Census, which reported a population of 14,709. The increase is inferred from the estimated resident population of 14,926 as of June 2024 and an additional 568 validated new addresses since the Census date. This results in a population density ratio of 442 persons per square kilometer. Forster's growth rate of 1.9% since the census is within 0.2 percentage points of the SA3 area's growth rate of 2.1%. Interstate migration contributed approximately 68.6% of overall population gains during recent periods.
AreaSearch uses ABS/Geoscience Australia projections for each SA2 area, released in 2024 with a base year of 2022. For areas not covered by this data, AreaSearch utilises NSW State Government's SA2 level projections, released in 2022 with a base year of 2021. Growth rates by age group are applied to all areas for the years 2032 to 2041. Based on projected demographic shifts, Forster is expected to increase by approximately 1,832 persons by 2041, reflecting an overall increase of 11.7% over the 17-year period.
Frequently Asked Questions - Population
Development
AreaSearch assessment of residential approval activity sees Forster among the top 30% of areas assessed nationwide
Forster recorded approximately 117 residential properties approved annually. Over the past five financial years, from FY-21 to FY-25588 homes were approved, with an additional 25 approved in FY-26. The average new residents per year per dwelling constructed over this period was 0.2.
This supply meets or exceeds demand, offering greater buyer choice and potential for population growth beyond projections. The average construction value of these properties was $416,000. In FY-26, Forster recorded $21.4 million in commercial development approvals, indicating moderate levels of commercial development.
Compared to the rest of NSW, Forster shows moderately higher new home approvals, with 31.0% above the regional average per person over the five-year period. This maintains good buyer choice while supporting existing property values. New building activity consists of 60.0% detached houses and 40.0% townhouses or apartments, offering choices across price ranges from spacious family homes to more compact options. Forster has approximately 99 people per dwelling approval, indicating a low density market. Population forecasts estimate Forster will gain 1,747 residents by 2041. At current development rates, new housing supply should comfortably meet demand, providing good conditions for buyers and potentially supporting growth beyond current population projections.
Frequently Asked Questions - Development
Infrastructure
Forster has moderate levels of nearby infrastructure activity, ranking in the top 50% nationally
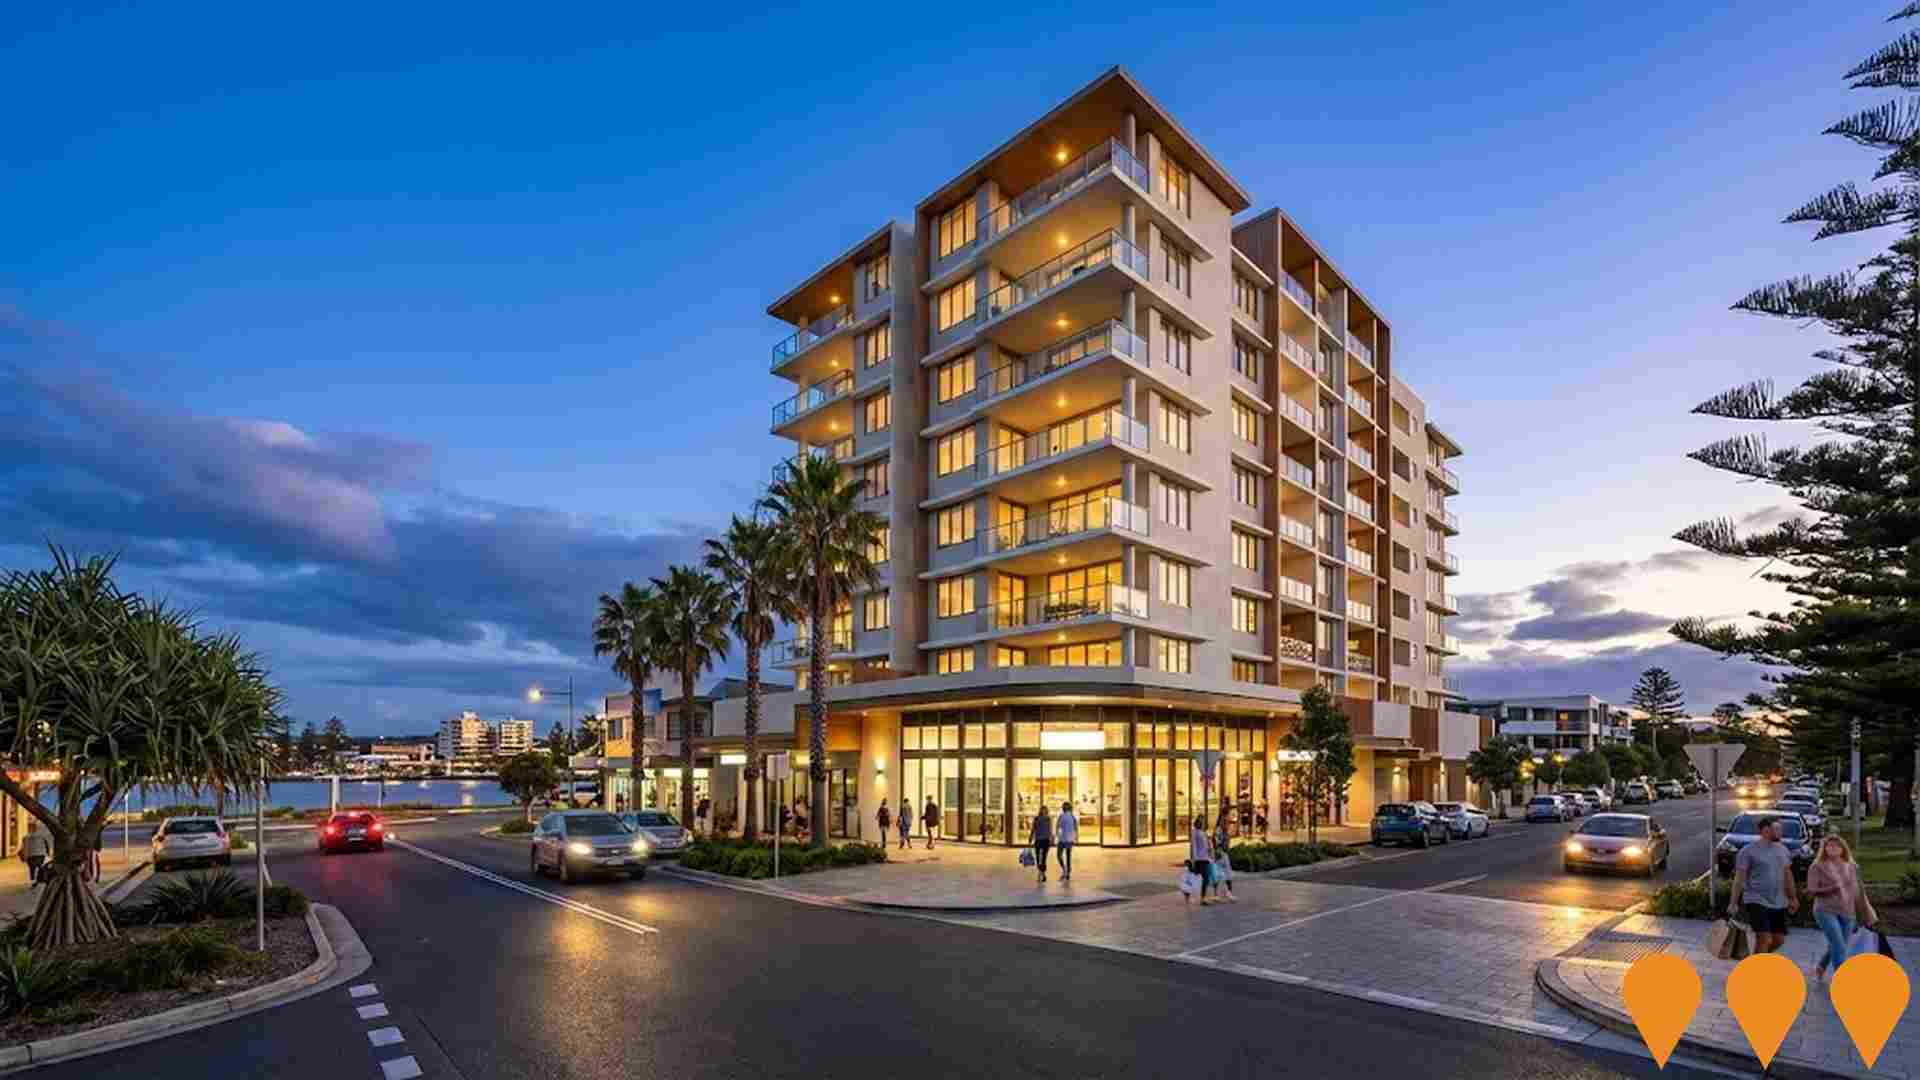
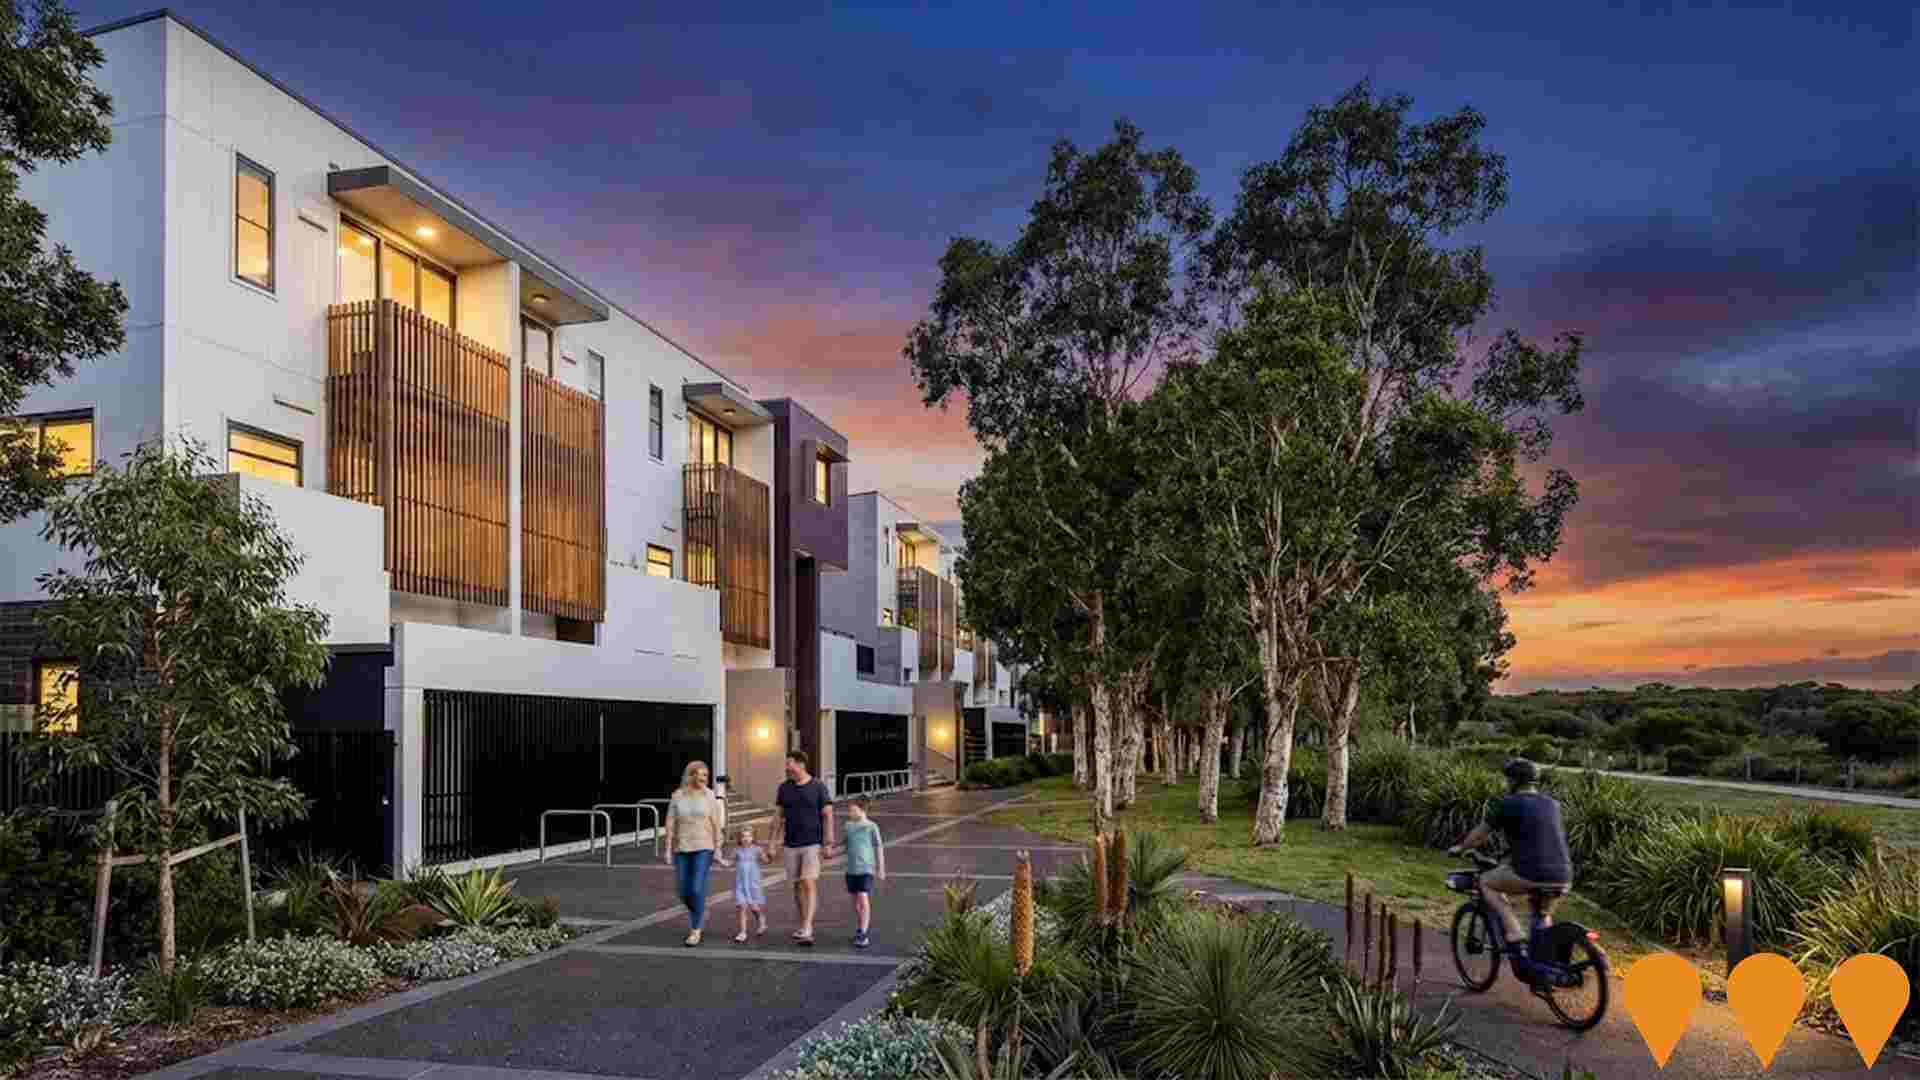
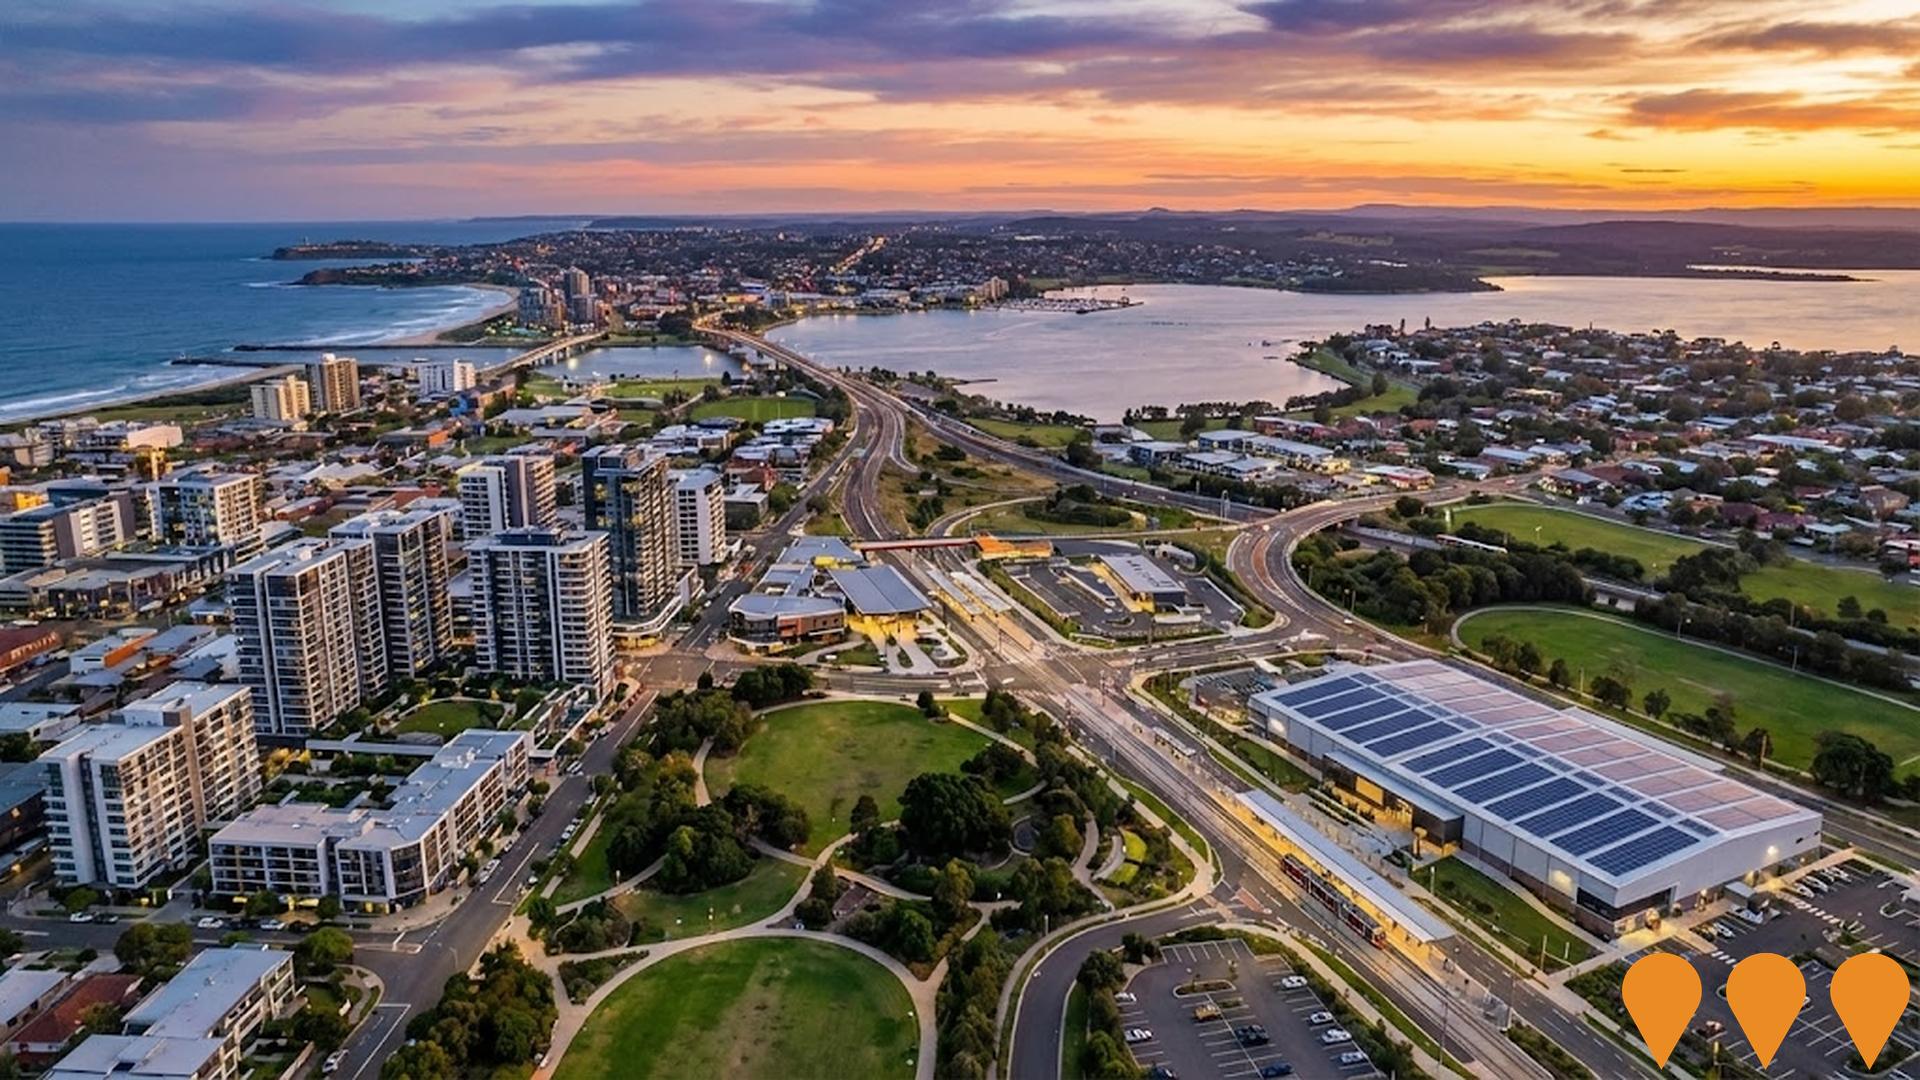
Changes to local infrastructure significantly impact an area's performance. AreaSearch identified ten projects potentially affecting the region. Notable ones are Forster Tuncurry Health Facility (part of Lower Mid North Coast Health Service Project), Forster and Old Bar New Ambulance Stations, Forster Main Beach Masterplan, and Forster Gateway Development - The Lakes Way.
Professional plan users can use the search below to filter and access additional projects.
INFRASTRUCTURE SEARCH
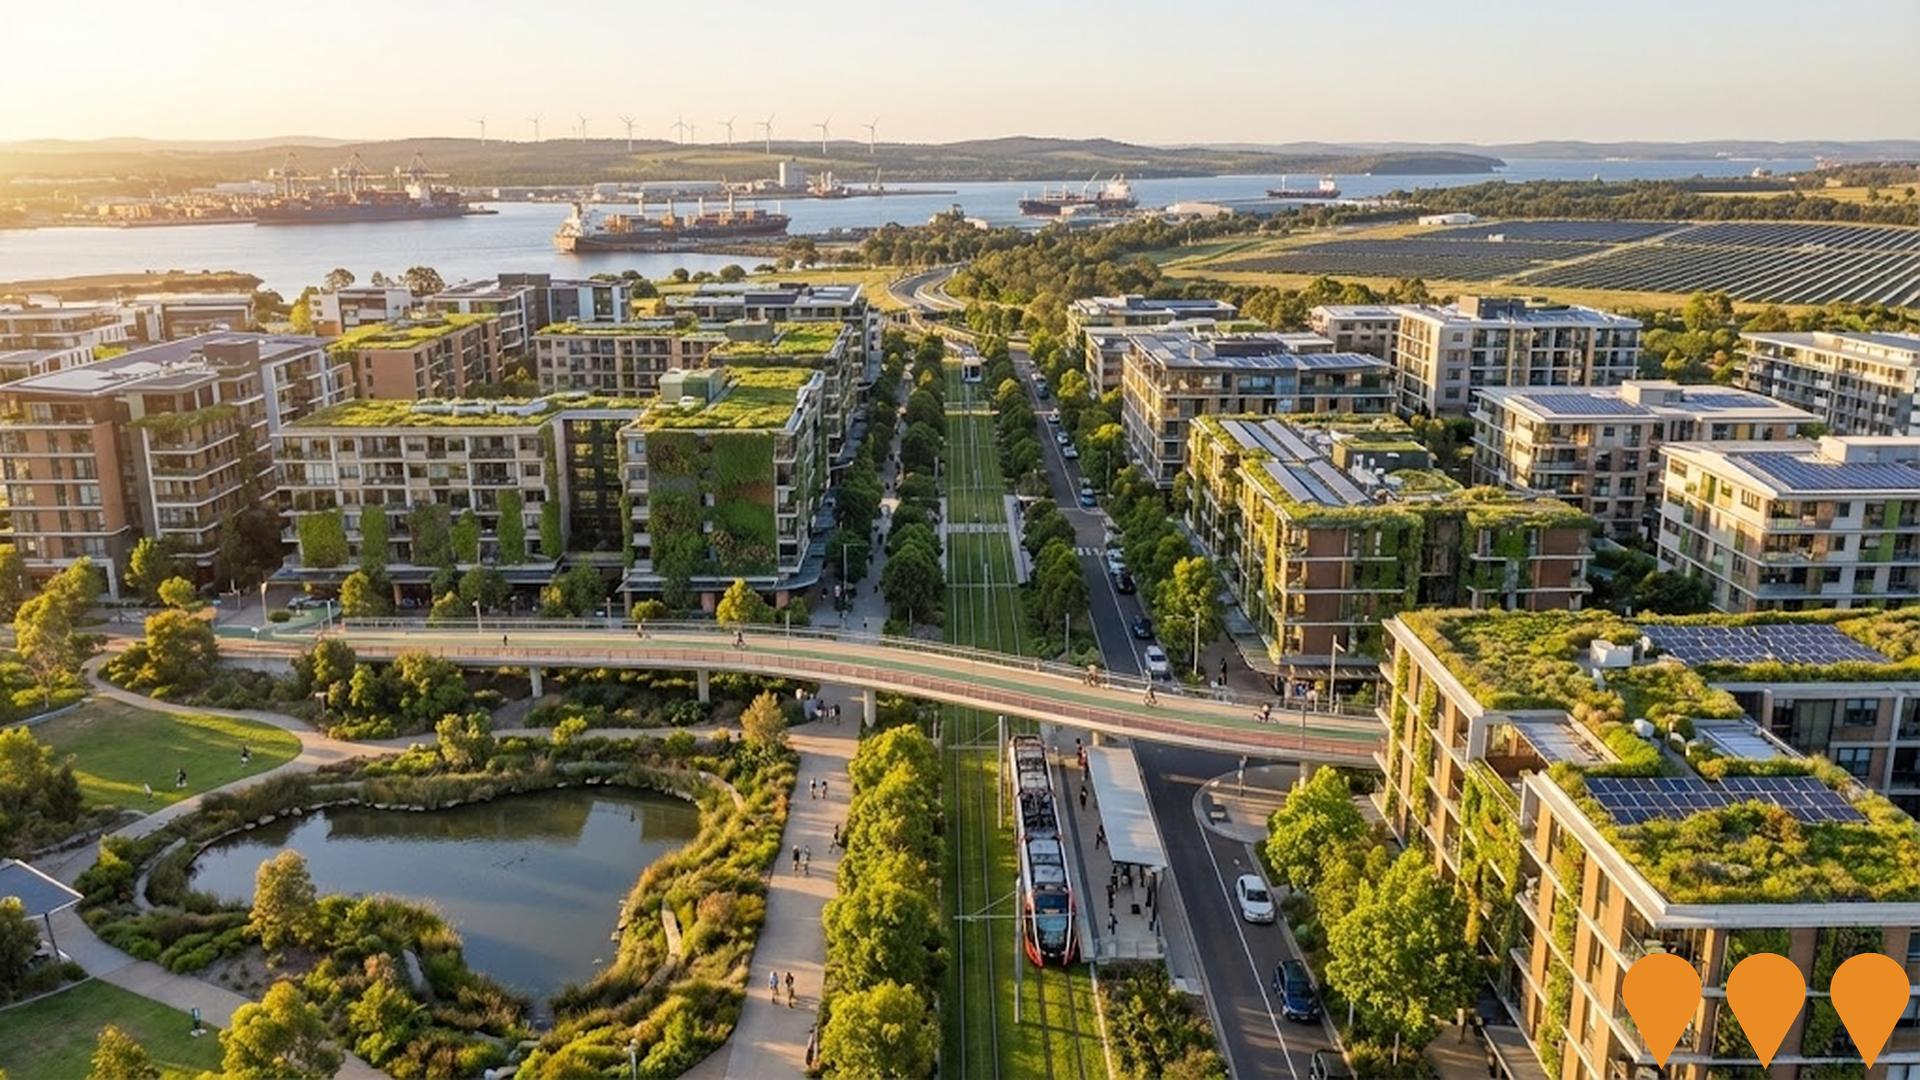
 Denotes AI-based impression for illustrative purposes only, not to be taken as definitive under any circumstances. Please follow links and conduct other investigations from the project's source for actual imagery. Developers and project owners wishing us to use original imagery please Contact Us and we will do so.
Frequently Asked Questions - Infrastructure
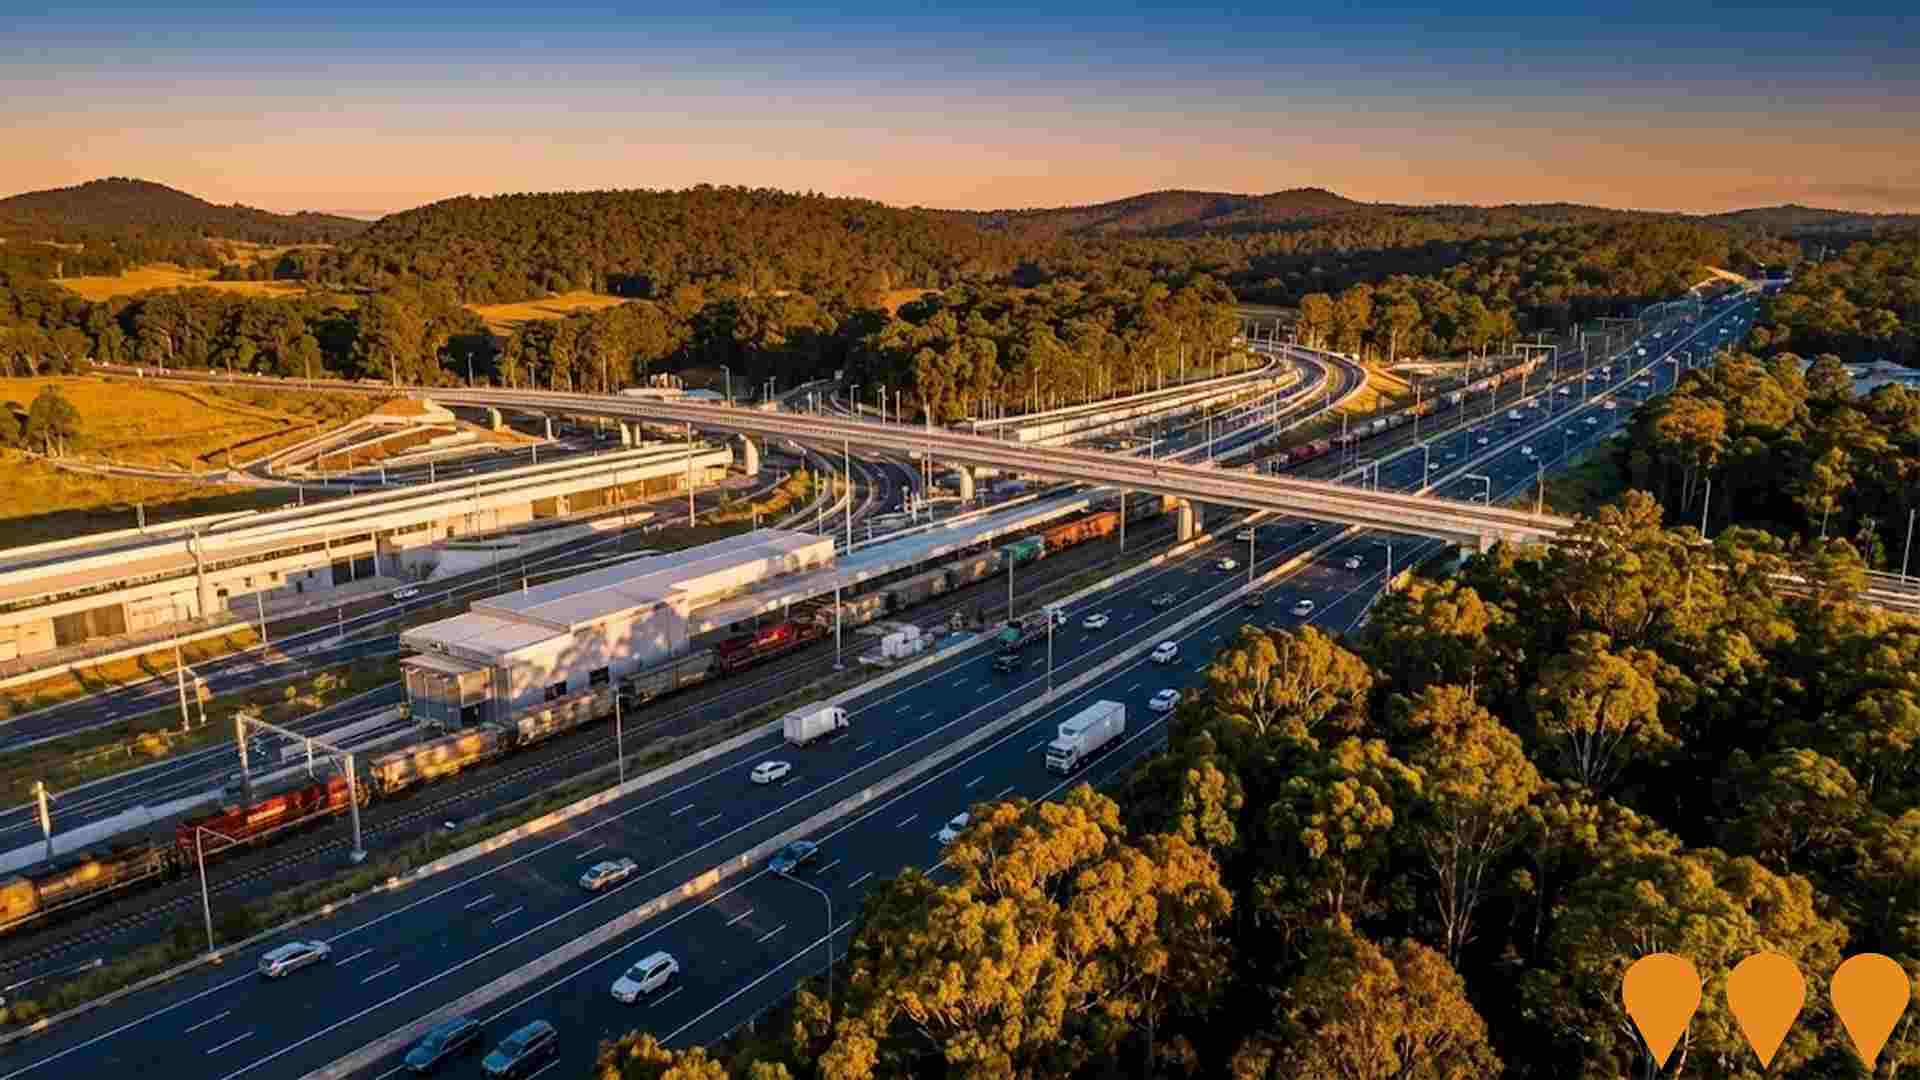
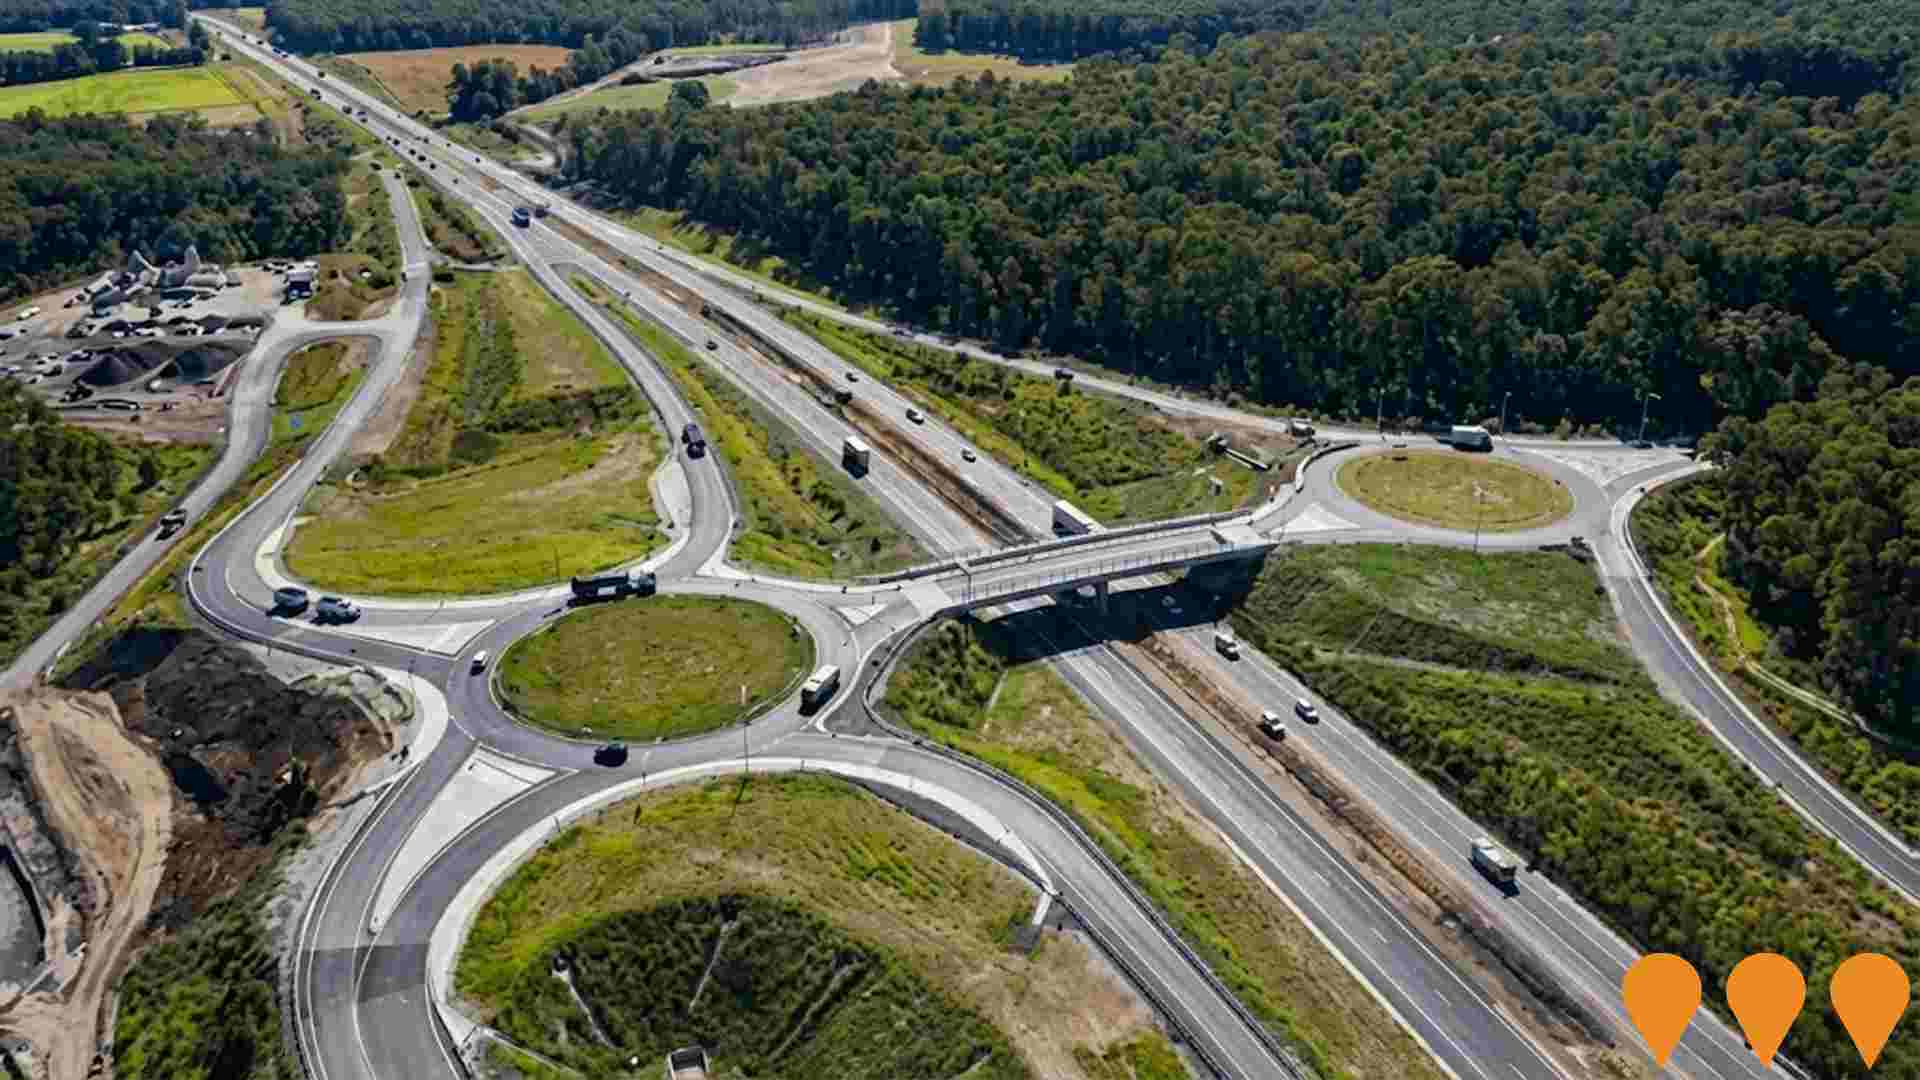
Pacific Highway Upgrade - Forster Region Connectivity
Major Pacific Highway upgrade project improving connectivity to the Forster region. Includes the elevated Lakes Way interchange located north of Forster which opened to traffic in 2005. Part of the broader Pacific Highway upgrade program to provide safer and more efficient travel along the NSW coast.
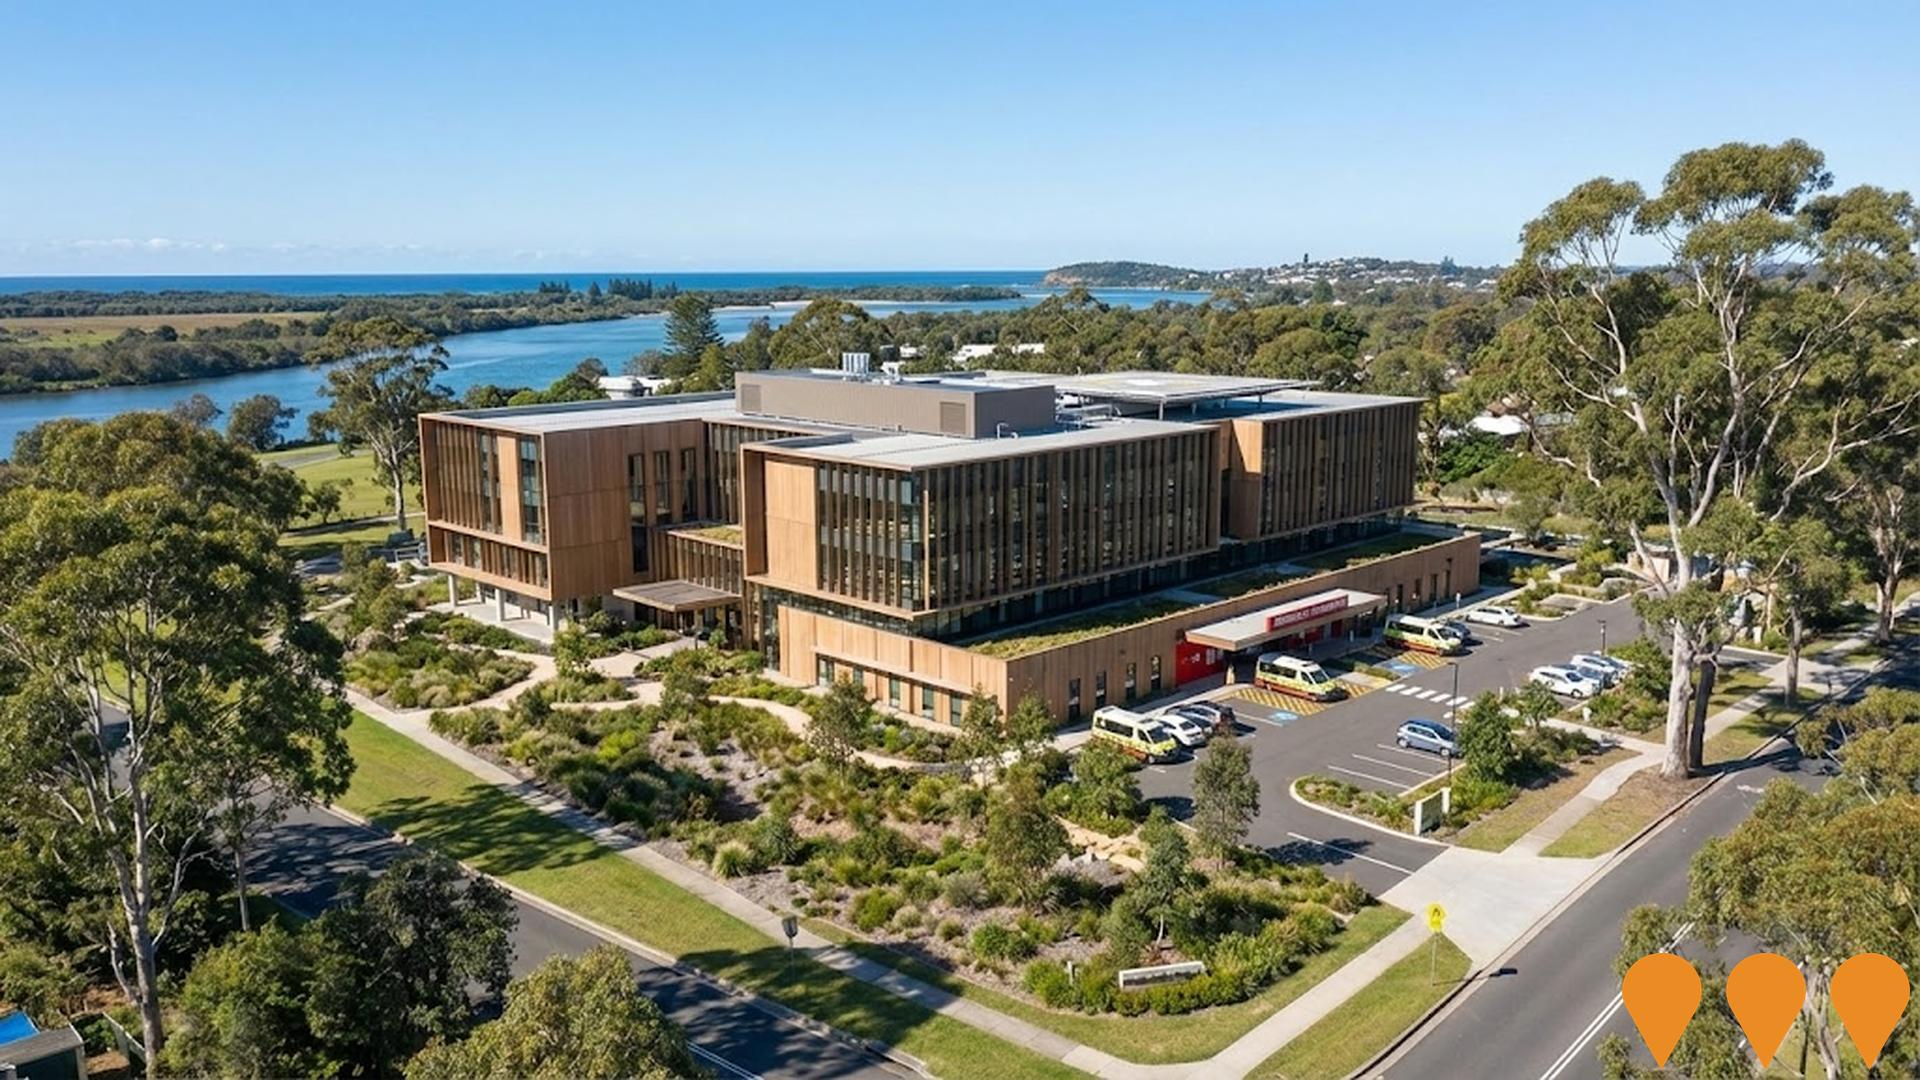
Forster Tuncurry Health Facility (Lower Mid North Coast Health Service Project)
A new public health facility for the Forster-Tuncurry area is being planned as part of the broader Lower Mid North Coast Health Service Project (combined with Manning Base Hospital Stage 2 redevelopment). The Forster facility will deliver emergency department, inpatient beds, outpatient and ambulatory care services. Site options are being evaluated near the existing Forster Private Hospital. Health Infrastructure NSW is leading planning and community consultation in partnership with Hunter New England Local Health District.
Low and Mid-Rise Housing Policy
State-wide NSW planning reforms via amendments to the State Environmental Planning Policy to enable more diverse low and mid-rise housing (dual occupancies, terraces, townhouses, manor houses and residential flat buildings up to 6 storeys) in well-located areas within 800 m of selected train, metro and light-rail stations and town centres. Stage 1 (dual occupancies in R2 zones statewide) commenced 1 July 2024. Stage 2 (mid-rise apartments, terraces and dual occupancies near stations) commenced 28 February 2025. Expected to facilitate up to 112,000 additional homes over the next five years.
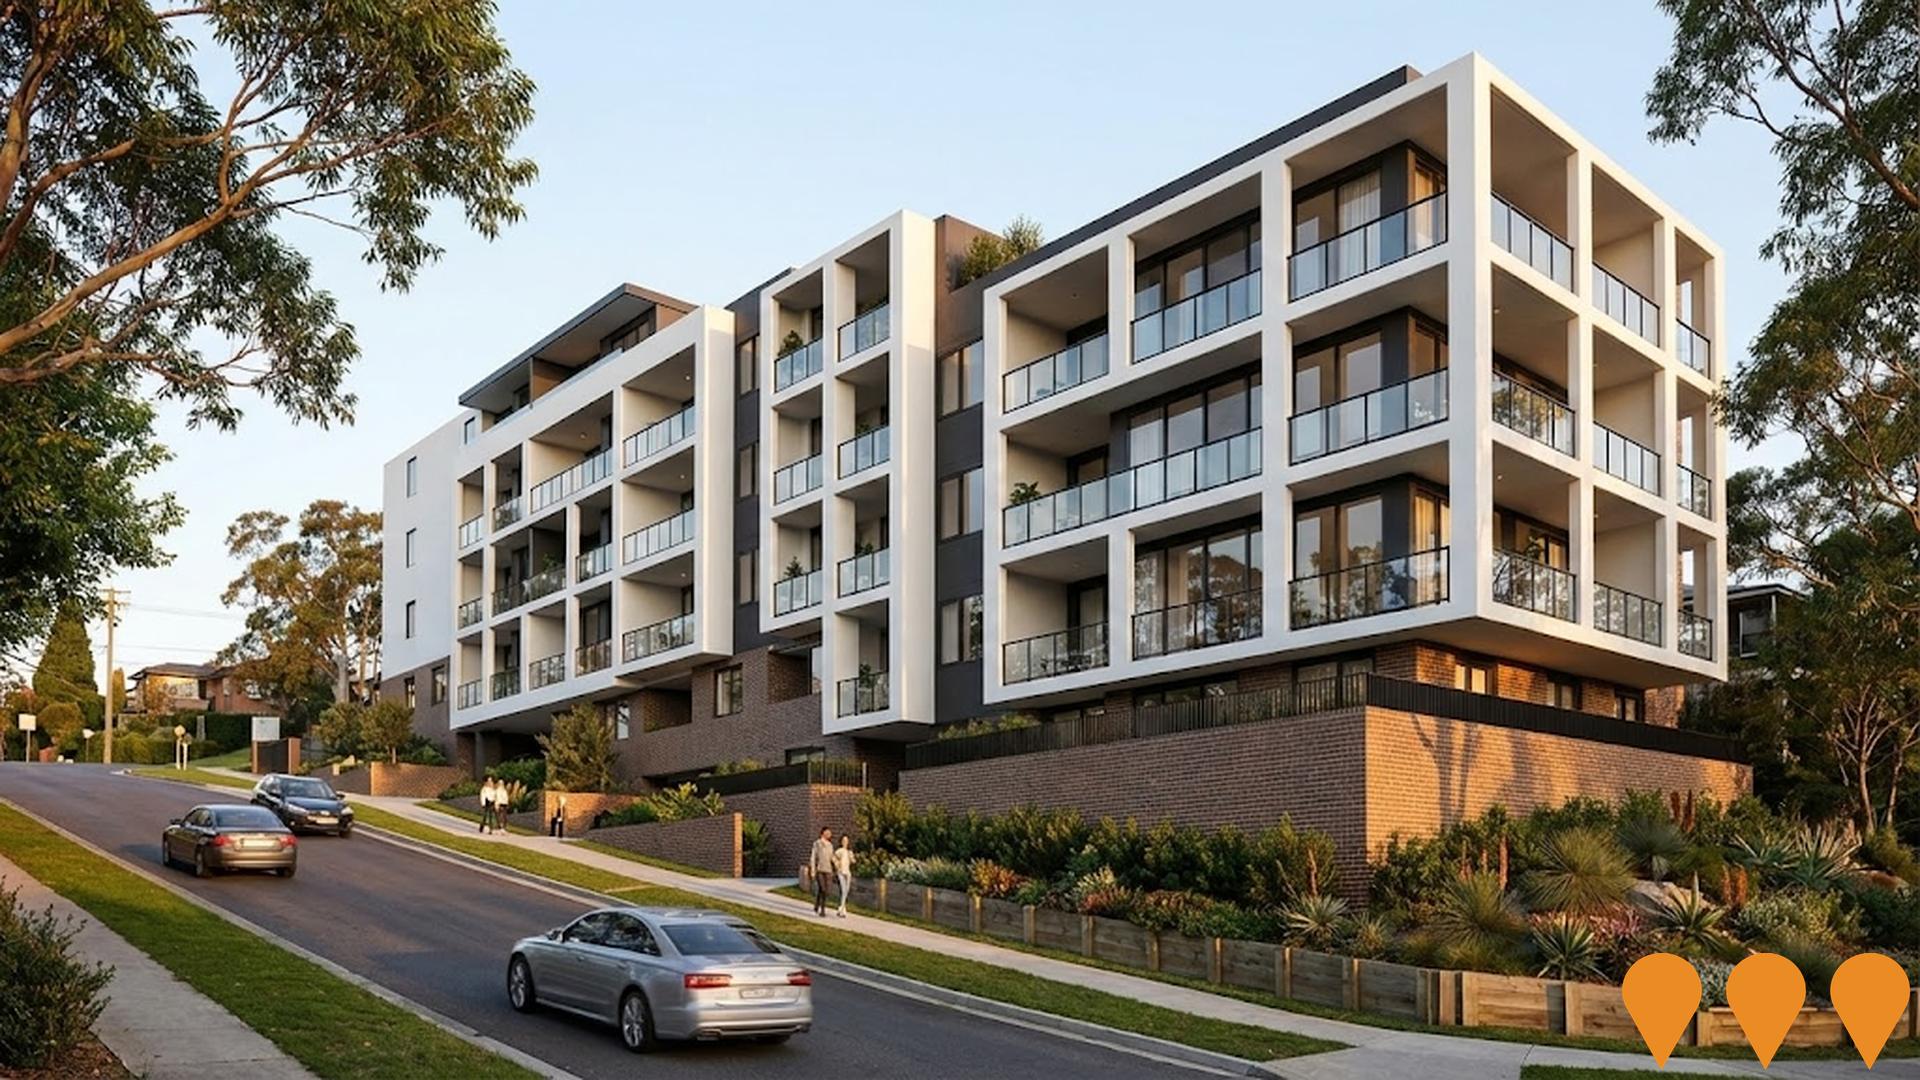
Forster Civic Precinct - Solaris
A completed mixed-use development providing new council facilities including a 2,000m2 public library, visitor information centre, customer service centre, flexible community spaces accommodating 200+ people, conference rooms, and underground parking. The civic facilities opened to the public on October 9, 2023. Future stages include seniors living apartments and retail facilities by the developer.
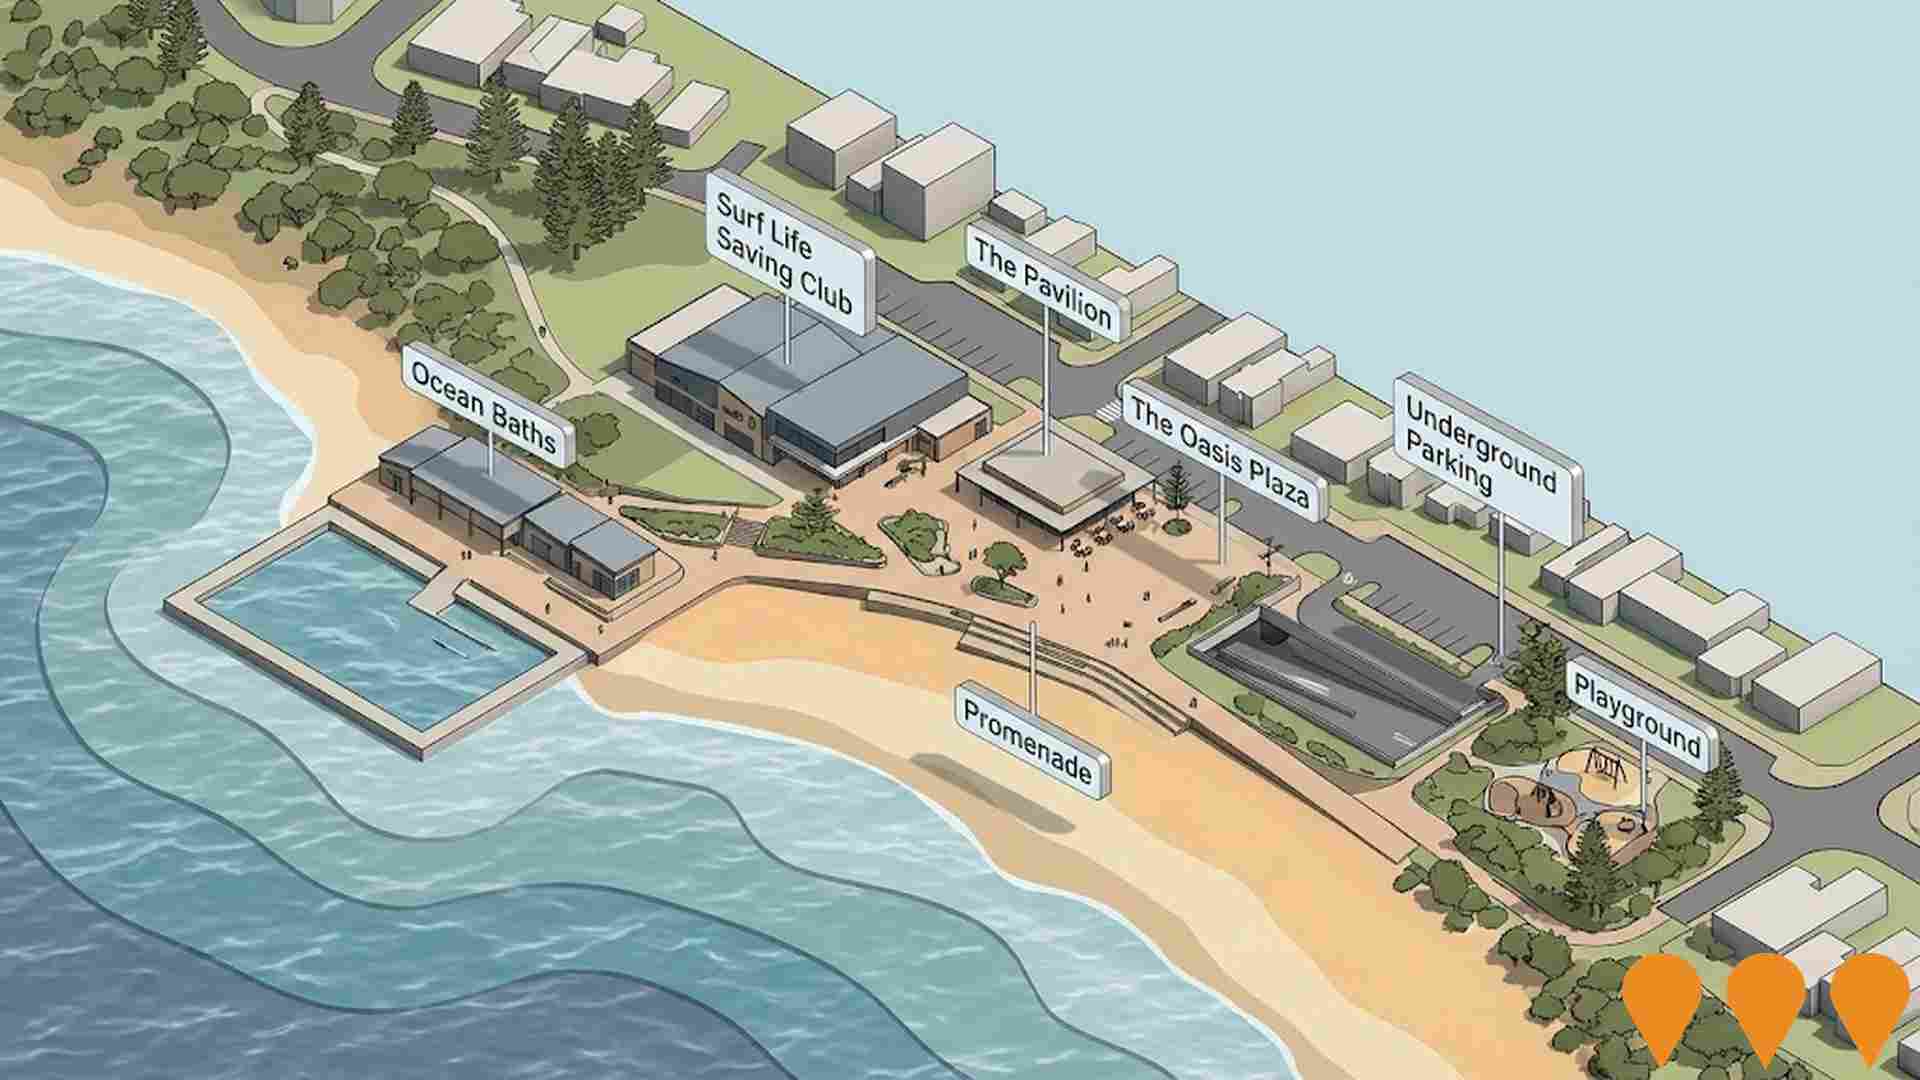
Forster Main Beach Masterplan
A comprehensive 30-year strategy to revitalize the Forster Main Beach precinct through staged development. Stage 1 has been completed with the new Surf Life Saving Club opening in 2024, and Ocean Baths facilities upgraded with new amenities, BBQ shelters, and accessible ramps. Future stages include The Pavilion cafe and amenities building, The Oasis public plaza, upgraded promenade with beach access, underground parking for 200 cars, and children's playground. The masterplan aims to create more green space, improve accessibility, modernize facilities, and strengthen community connections while maintaining the natural coastal character.
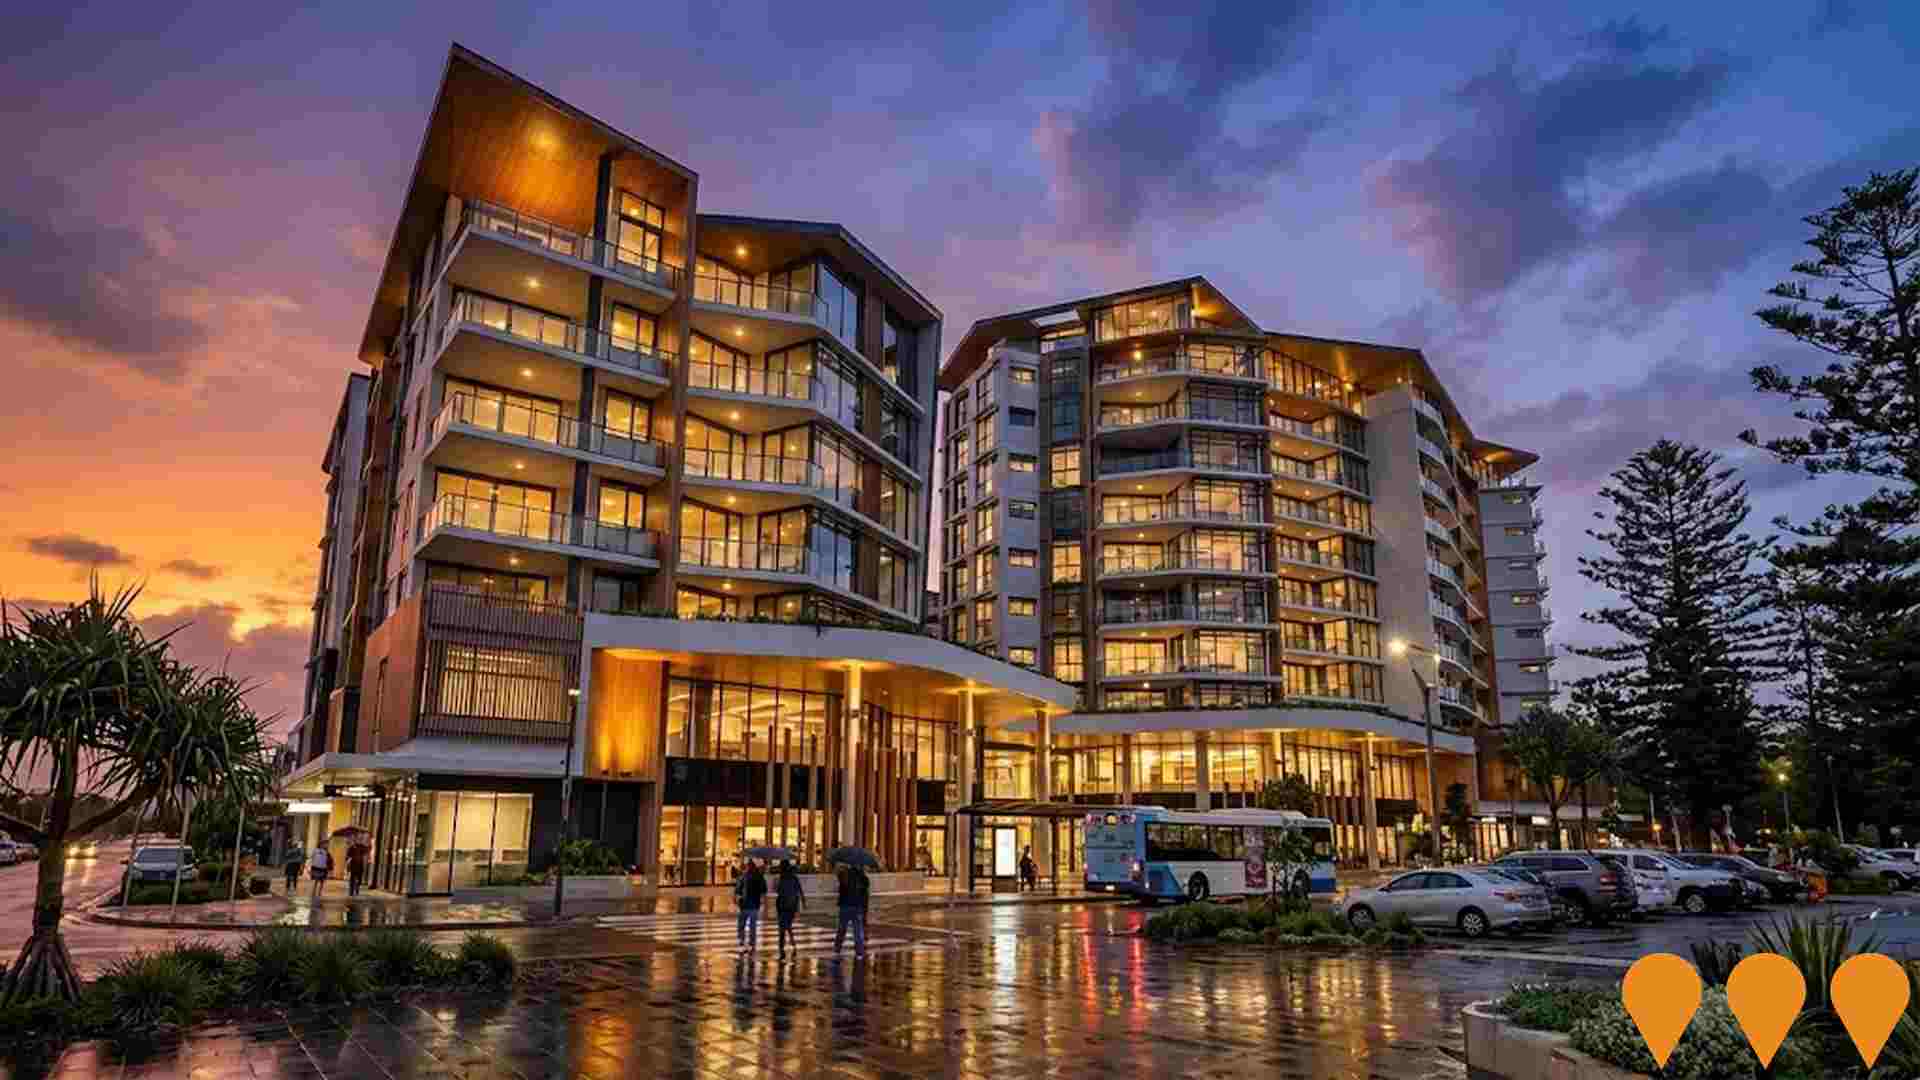
4-12 Breese Parade Large Format Retail Development
A large-format retail development offering up to 4,000 square metres of gross leasable area in the retail heart of Forster. The former MidCoast Council site was sold for $12.72 million and features prime positioning directly opposite Stockland Forster shopping centre with high exposure and accessibility. The development includes rear loading facilities and showroom space across a commanding 14,110mý site with B2 Local Centre zoning.

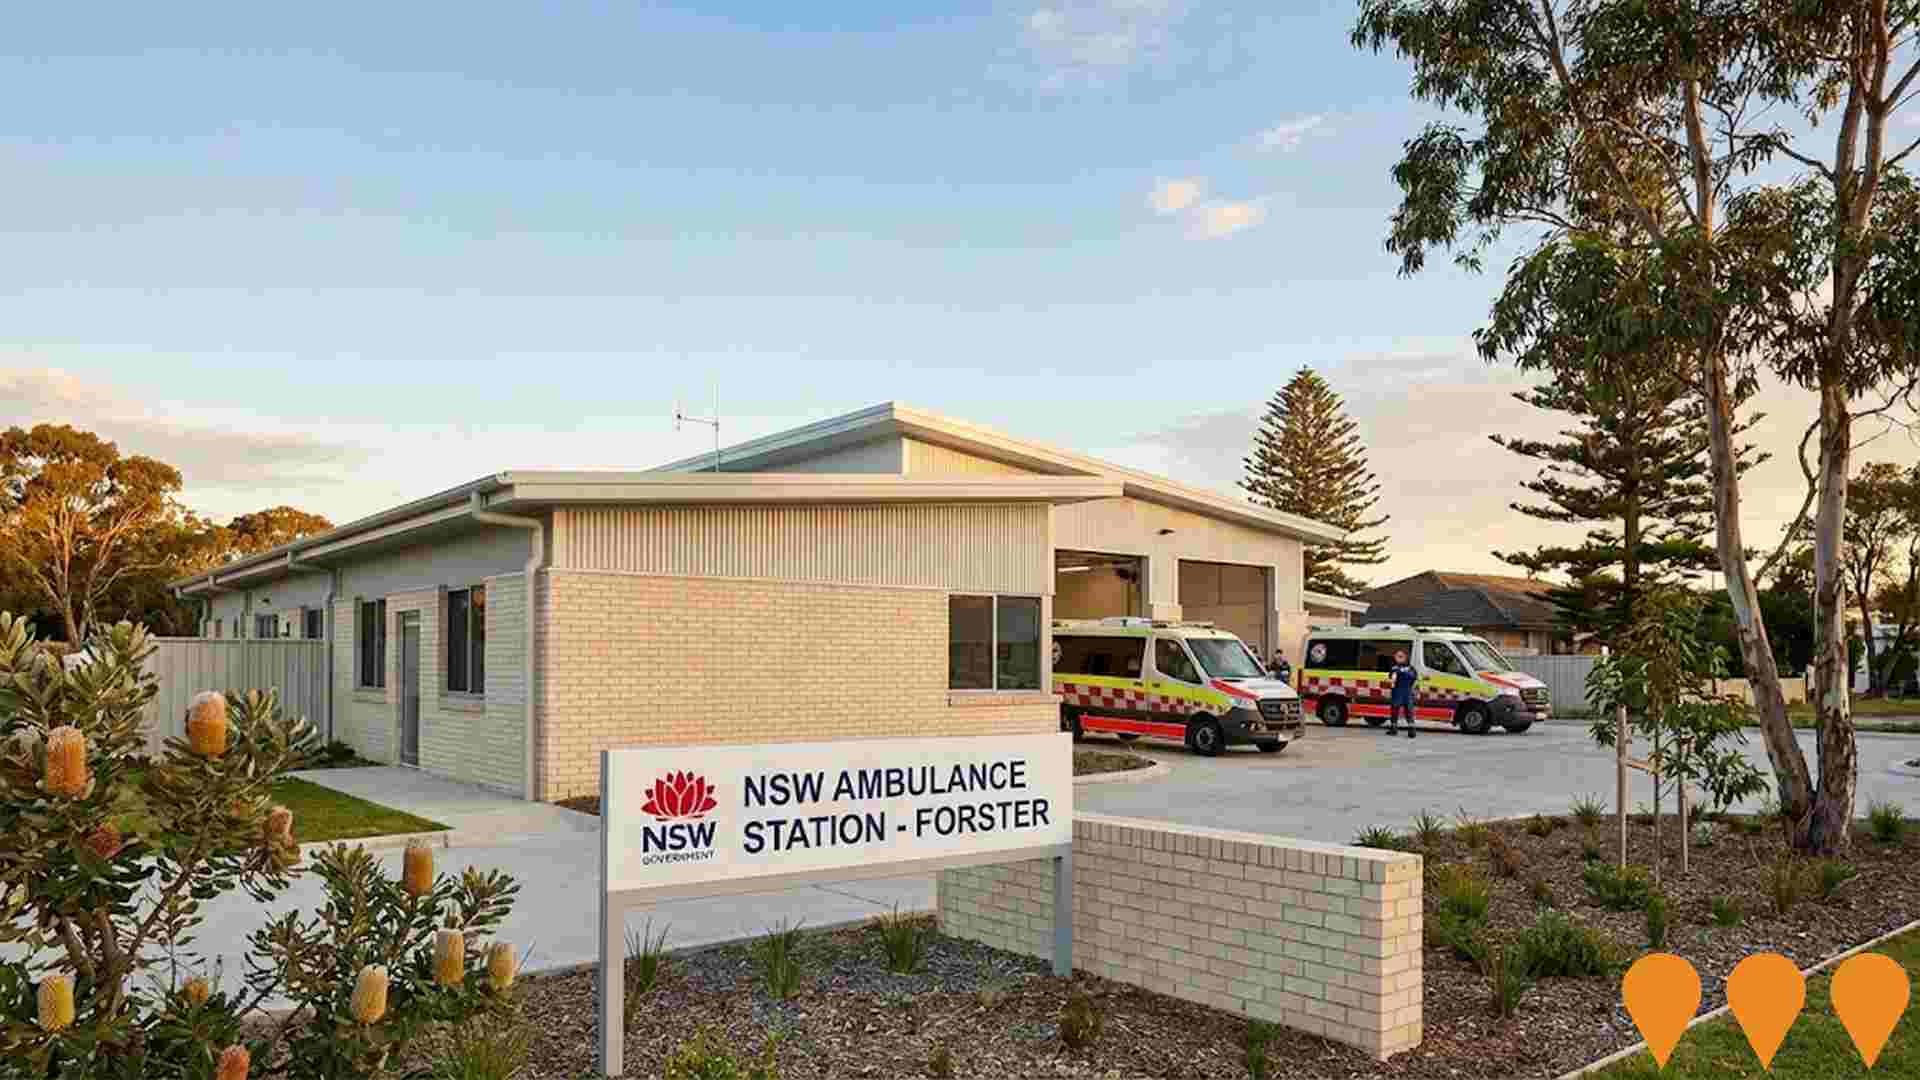
Forster and Old Bar New Ambulance Stations
New ambulance stations planned for Forster and Old Bar to improve emergency medical services coverage in the Great Lakes region. Part of the broader health infrastructure investment by the NSW Government to ensure emergency services are better equipped to serve the growing population in the Mid North Coast region.
Forster Gateway Development - The Lakes Way
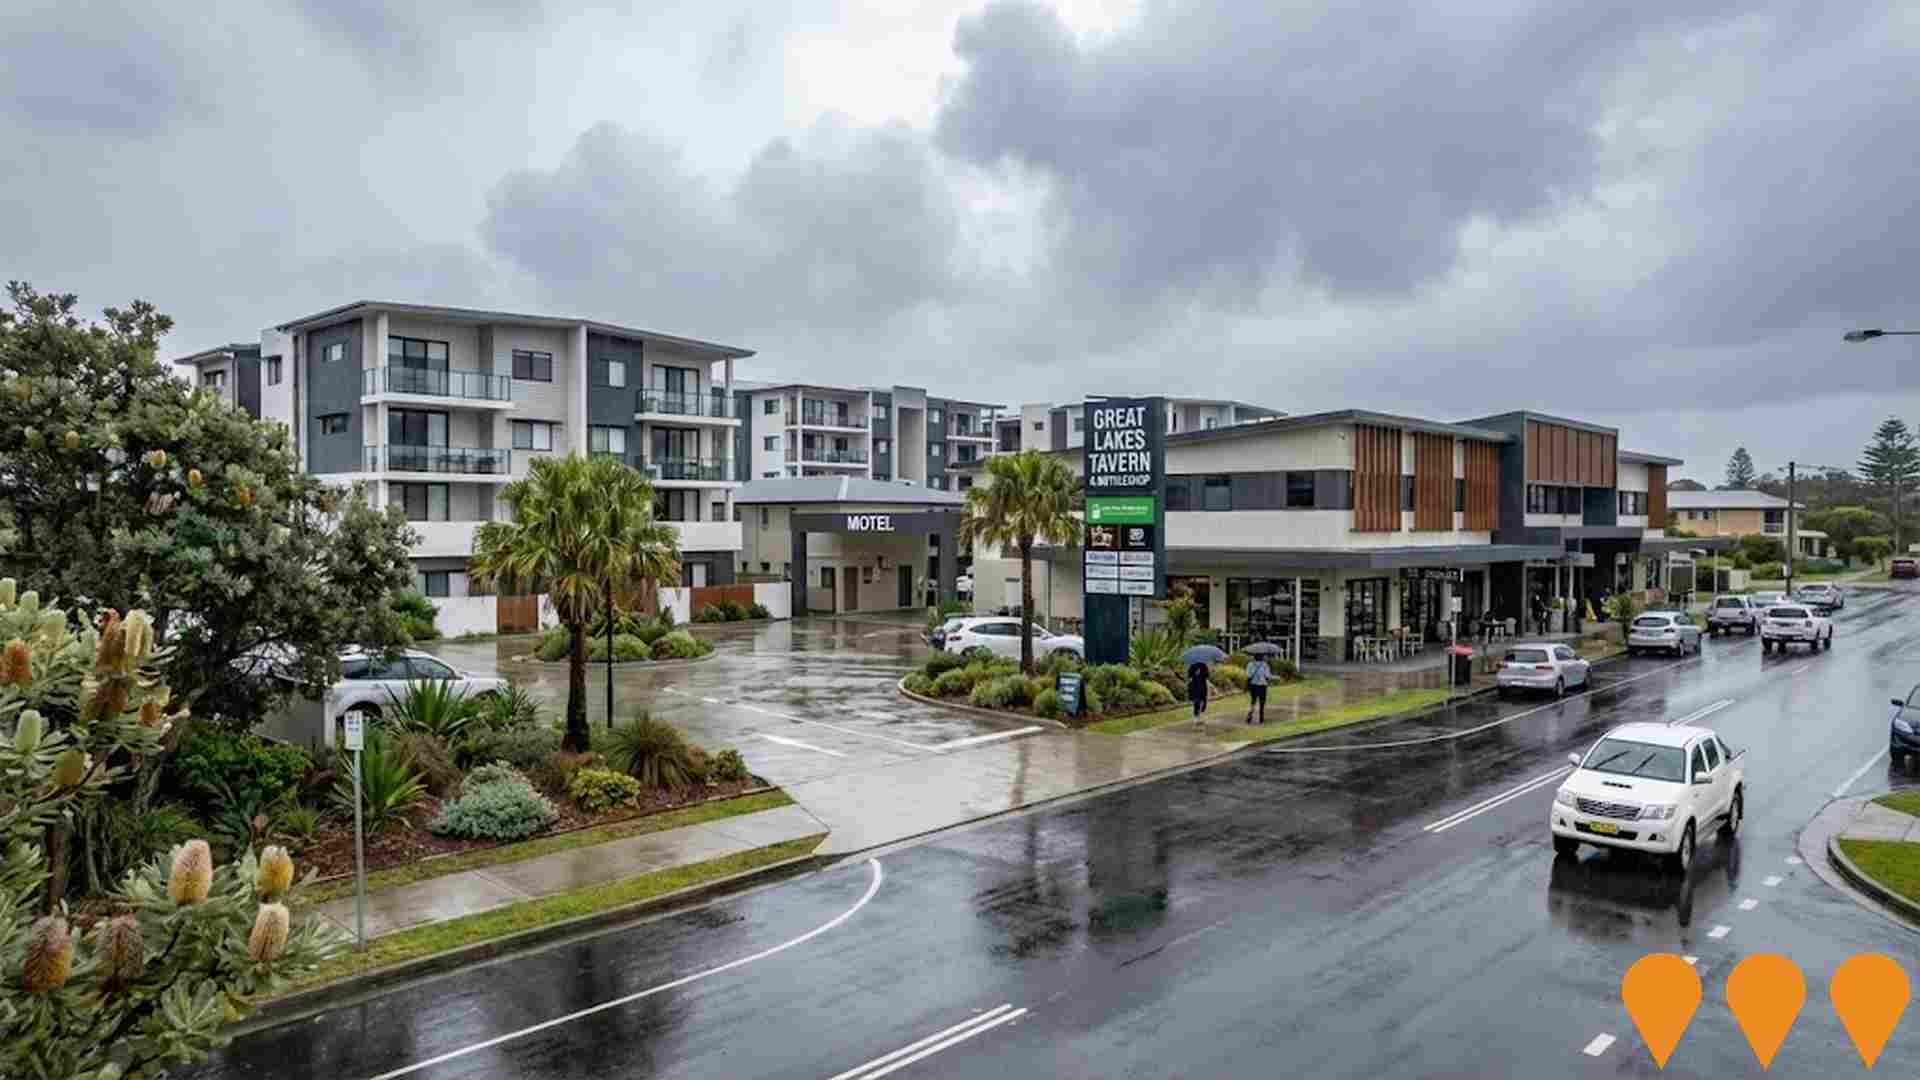
Proposed future development on a 25.12ha plot of land along The Lakes Way, Forster would accommodate a mix of residential, commercial and conservation zones. The site includes the Great Lakes Tavern and bottleshop, shopping complex, motel, cafe/bar and houses. The project has potential to provide approximately 135 dwellings in a variety of housing styles.
Employment
Forster shows employment indicators that trail behind approximately 70% of regions assessed across Australia
Forster's workforce is balanced across white and blue-collar jobs with significant representation in essential services sectors. The unemployment rate was 4.5% as of September 2021.
In Forster, 5,866 residents were employed by September 2025, with an unemployment rate of 4.4%, which is 0.6% higher than Rest of NSW's rate of 3.8%. Workforce participation in Forster was 41.7%, significantly lower than Rest of NSW's 56.4%. Employment is concentrated in health care & social assistance, retail trade, and accommodation & food services. Health care & social assistance employment levels are particularly high at 1.3 times the regional average.
Agriculture, forestry & fishing is under-represented, with only 1.6% of Forster's workforce compared to Rest of NSW's 5.3%. Over the year to September 2025, labour force levels increased by 0.5%, while employment declined by 0.5%, causing unemployment to rise by 0.9 percentage points. In contrast, Rest of NSW experienced a 0.5% employment decline and a 0.1% labour force decline, with a 0.4 percentage point rise in unemployment. As of 25-Nov-25, NSW employment contracted by 0.03%, losing 2,260 jobs, with the state unemployment rate at 3.9%. National forecasts from May-25 suggest total employment will expand by 6.6% over five years and 13.7% over ten years. Applying these projections to Forster's employment mix indicates local employment should increase by 6.9% over five years and 14.3% over ten years, though this is a simple extrapolation for illustrative purposes and does not account for local population projections.
Frequently Asked Questions - Employment
Income
Income metrics place the area in the bottom 10% of locations nationally according to AreaSearch analysis
AreaSearch's latest postcode level ATO data for financial year 2022 shows Forster SA2 had a median income among taxpayers of $42,100 and an average of $55,644. This is below the national average. Rest of NSW had a median income of $49,459 and an average of $62,998 in the same period. As of September 2025, current estimates suggest Forster's median income would be approximately $47,409 and average $62,661, based on a 12.61% Wage Price Index growth since financial year 2022. According to the 2021 Census, incomes in Forster fall between the 3rd and 9th percentiles nationally for households, families, and individuals. The $400 - 799 earnings band captures 30.7% of the community (4,600 individuals), unlike surrounding regions where 29.9% fall within the $1,500 - 2,999 range. Housing affordability pressures are severe in Forster, with only 82.7% of income remaining, ranking at the 5th percentile nationally.
Frequently Asked Questions - Income
Housing
Forster displays a diverse mix of dwelling types, with a higher proportion of rental properties than the broader region
Forster's housing structure, as per the latest Census, consisted of 65.9% houses and 34.1% other dwellings (semi-detached, apartments, 'other' dwellings). This compares to Non-Metro NSW's 73.0% houses and 27.0% other dwellings. Home ownership in Forster was 51.7%, with mortgaged dwellings at 21.1% and rented ones at 27.1%. The median monthly mortgage repayment in the area was $1,712, higher than Non-Metro NSW's average of $1,517. The median weekly rent figure was recorded at $340, compared to Non-Metro NSW's $330. Nationally, Forster's mortgage repayments were lower than the Australian average of $1,863, and rents were less than the national figure of $375.
Frequently Asked Questions - Housing
Household Composition
Forster features high concentrations of lone person households, with a fairly typical median household size
Family households account for 62.2% of all households, including 16.0% couples with children, 35.0% couples without children, and 10.4% single parent families. Non-family households constitute the remaining 37.8%, with lone person households at 34.7% and group households comprising 3.1%. The median household size is 2.1 people, which matches the average for the Rest of NSW.
Frequently Asked Questions - Households
Local Schools & Education
Educational outcomes in Forster fall within the lower quartile nationally, indicating opportunities for improvement in qualification attainment
The area's university qualification rate is 16.9%, significantly lower than the NSW average of 32.2%. This disparity presents both a challenge and an opportunity for targeted educational initiatives. Bachelor degrees are the most prevalent at 12.1%, followed by postgraduate qualifications (2.8%) and graduate diplomas (2.0%). Vocational credentials are also common, with 42.1% of residents aged 15 and above holding such qualifications – advanced diplomas comprise 10.7%, while certificates make up 31.4%.
A substantial portion of the population, 23.1%, is actively engaged in formal education. This includes 8.8% in primary education, 7.1% in secondary education, and 1.6% pursuing tertiary education.
Frequently Asked Questions - Education
Schools Detail
Nearby Services & Amenities
Transport
Transport servicing is moderate compared to other areas nationally based on assessment of service frequency, route connectivity and accessibility
Forster has 226 active public transport stops, all of which are bus stops. These stops are served by 34 different routes that together facilitate 627 weekly passenger trips. The average distance from a resident's location to the nearest transport stop is 118 meters, indicating excellent accessibility.
On average, there are 89 trips per day across all routes, which equates to about two weekly trips per stop.
Frequently Asked Questions - Transport
Transport Stops Detail
Health
Health performance in Forster is a key challenge with a range of health conditions having marked impacts on both younger and older age cohorts
Forster faces significant health challenges, with various conditions affecting both younger and older residents. Private health cover stands at approximately 48%, covering around 7,132 people, which is lower than the national average of 55.3%.
The most prevalent medical conditions are arthritis (13.7% of residents) and mental health issues (9.4%). Conversely, 55.7% of Forster residents report having no medical ailments, compared to 56.6% in Rest of NSW. As of the latest data (2021), 38.7% of Forster's population is aged 65 and over, totaling about 5,800 people, which is higher than the 36.0% recorded in Rest of NSW. Despite this, health outcomes among seniors in Forster are commendable, outperforming those of the general population.
Frequently Asked Questions - Health
Cultural Diversity
Forster is considerably less culturally diverse than average when assessed alongside AreaSearch's national rankings for language and cultural background related metrics
Forster's population showed lower cultural diversity, with 87.6% born in Australia, 90.9% being citizens, and 96.0% speaking English only at home. Christianity was the predominant religion, accounting for 59.9%, slightly higher than the regional average of 58.5%. The top three ancestry groups were English (34.2%), Australian (30.6%), and Irish (8.9%).
Notably, Forster had a higher percentage of Australian Aboriginal people at 4.5% compared to the regional average of 4.3%, while Maltese and Scottish populations were similarly represented at 0.5% and 8.1% respectively.
Frequently Asked Questions - Diversity
Age
Forster ranks among the oldest 10% of areas nationwide
The median age in Forster is 57 years, which is significantly higher than the average for Rest of NSW at 43 years, and substantially exceeds the Australian median of 38 years. Compared to Rest of NSW, Forster has a higher proportion of residents aged 65-74 (19.1%) but fewer residents aged 25-34 (7.3%). This concentration of 65-74 year-olds is well above the national average of 9.4%. According to post-2021 Census data, the proportion of Forster's population aged 75-84 has grown from 13.1% to 14.3%, while the proportion of those aged 55-64 has declined from 14.5% to 13.2%. By 2041, demographic projections indicate significant shifts in Forster's age structure. The number of residents aged 85 and above is projected to increase markedly by 502 people (63%), from 792 to 1,295. Conversely, both the 15-24 and 55-64 age groups are expected to see reduced numbers.

