Chart Color Schemes
This analysis uses ABS Statistical Areas Level 2 (SA2) boundaries, which can materially differ from Suburbs and Localities (SAL) even when sharing similar names.
SA2 boundaries are defined by the Australian Bureau of Statistics and are designed to represent communities for statistical reporting (e.g., census and ERP).
Suburbs and Localities (SAL) represent commonly-used suburb/locality names (postal-style areas) and may use different geographic boundaries. For comprehensive analysis, consider reviewing both boundary types if available.
est. as @ -- *
ABS ERP | -- people | --
2021 Census | -- people
Sales Activity
Curious about local property values? Filter the chart to assess the volume and appreciation (including resales) trends and regional comparisons, or scroll to the map below view this information at an individual property level.
Find a Recent Sale
Sales Detail
Population
An assessment of population growth drivers in Nanango reveals an overall ranking slightly below national averages considering recent, and medium term trends
Nanango's population, as of November 2025, is approximately 10,817 people. This figure represents an increase of 814 individuals since the 2021 Census, which recorded a population of 10,003. The growth is inferred from the estimated resident population of 10,674 in June 2024 and the addition of 202 validated new addresses since the Census date. This results in a population density ratio of 6.6 persons per square kilometer. Nanango's 8.1% growth since the 2021 census exceeds that of its SA3 area (6.2%), indicating it is a leader in regional growth. Interstate migration contributed approximately 93.1% of overall population gains during recent periods.
AreaSearch uses ABS/Geoscience Australia projections for each SA2 area, released in 2024 with a base year of 2022. For areas not covered by this data and years post-2032, Queensland State Government's SA2 area projections are adopted, released in 2023 based on 2021 data. However, these state projections do not provide age category splits, so AreaSearch applies proportional growth weightings aligned with ABS Greater Capital Region projections for each age cohort, released in 2023 and based on 2022 data. Looking ahead, demographic trends suggest a population increase just below the median of Australia's non-metropolitan areas, with an expected growth of 768 persons to 2041, reflecting a total gain of 5.7% over the 17 years.
Frequently Asked Questions - Population
Development
AreaSearch assessment of residential development activity positions Nanango among the top 25% of areas assessed nationwide
Nanango has averaged approximately 43 new dwelling approvals annually over the past five financial years, totalling 215 homes. As of FY-26 so far, 33 approvals have been recorded. On average, 3.6 people per year moved to the area for each dwelling built between FY-21 and FY-25, indicating high demand outstripping supply, which typically drives price growth and increased buyer competition. New homes are being constructed at an average expected cost of $259,000, below the regional average, suggesting more affordable housing options.
This financial year has seen $7.2 million in commercial approvals, reflecting Nanango's predominantly residential character. Compared to the Rest of Qld, Nanango shows slightly higher development activity, with 29.0% above the regional average per person over the five-year period, offering reasonable buyer choices while maintaining existing property demand. Recent construction comprises 97.0% detached dwellings and 3.0% townhouses or apartments, preserving the area's traditional low-density character favoring family homes.
The location has approximately 204 people per dwelling approval, suggesting an expanding market. Population forecasts indicate Nanango will gain 615 residents by 2041, with current construction levels expected to meet housing demand adequately, creating favorable conditions for buyers and potentially enabling growth beyond current projections.
Frequently Asked Questions - Development
Infrastructure
Nanango has strong levels of nearby infrastructure activity, ranking in the top 40% nationally
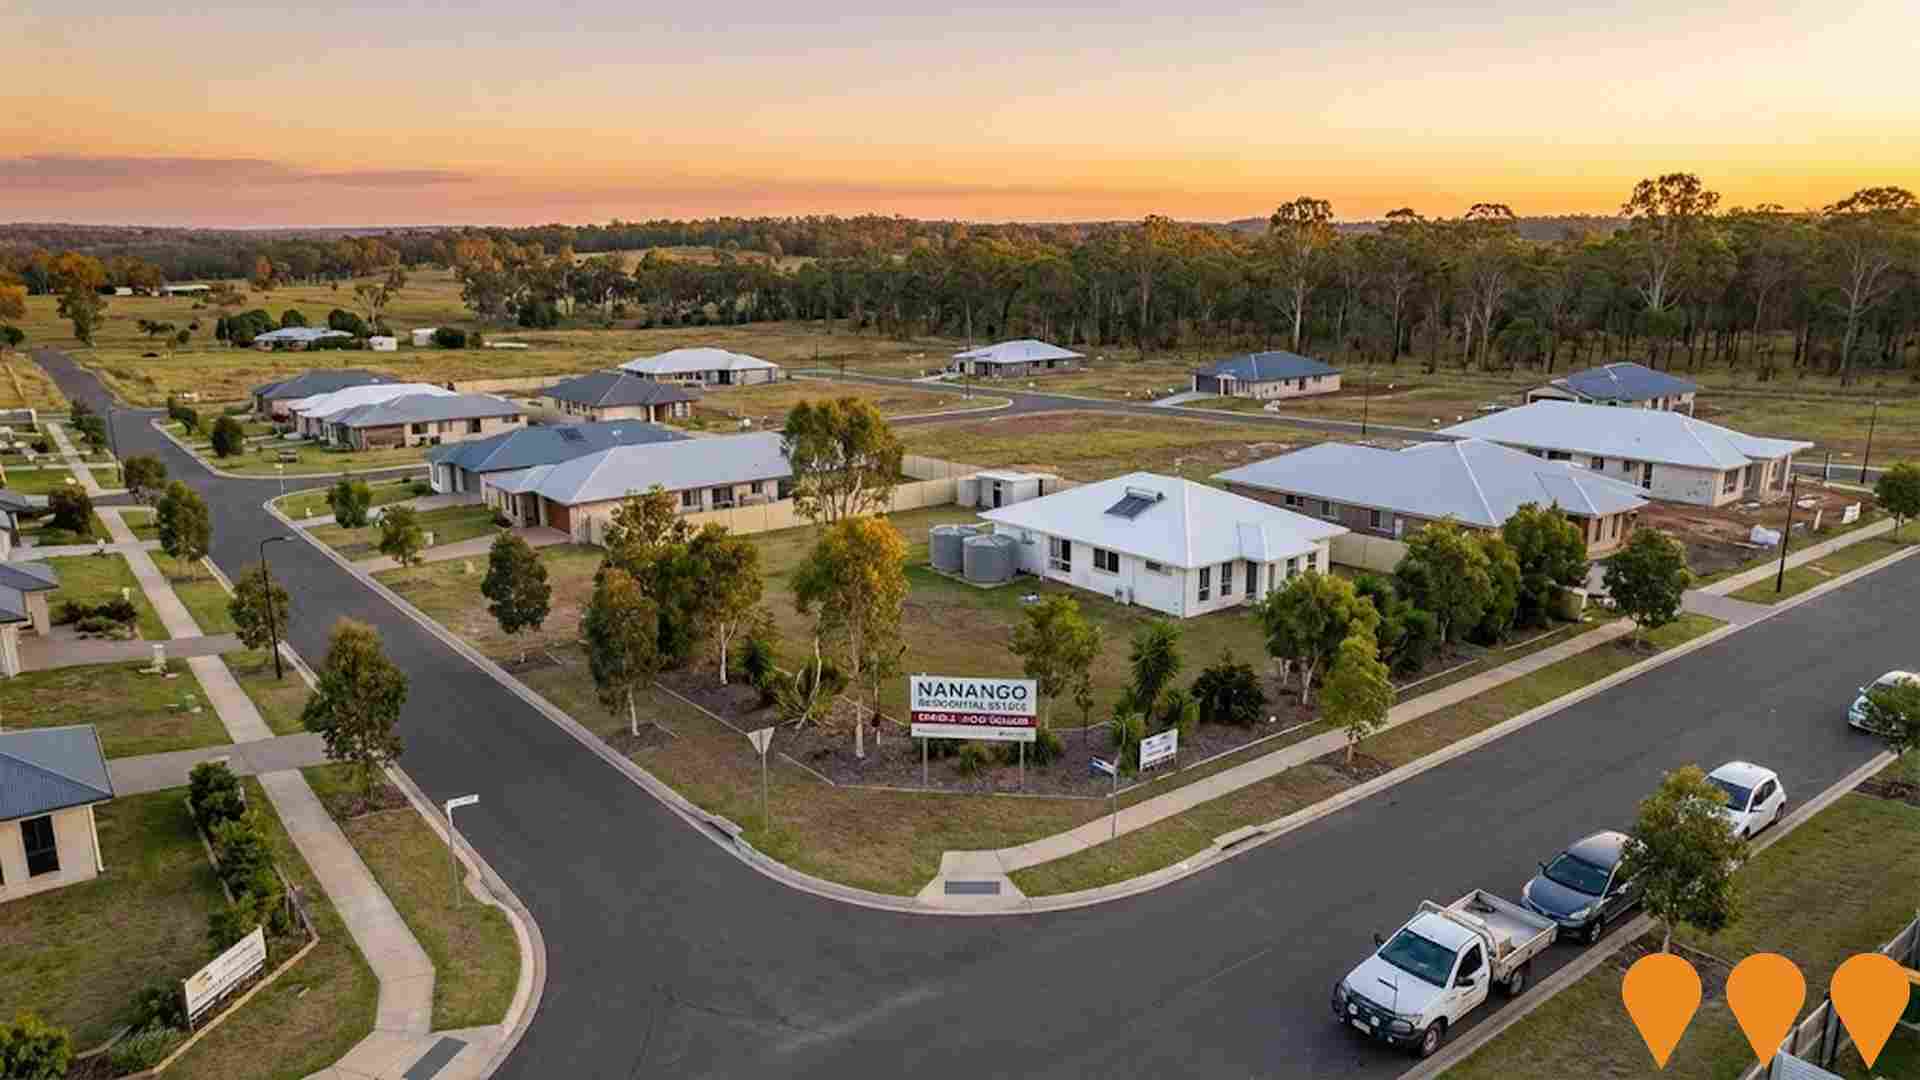
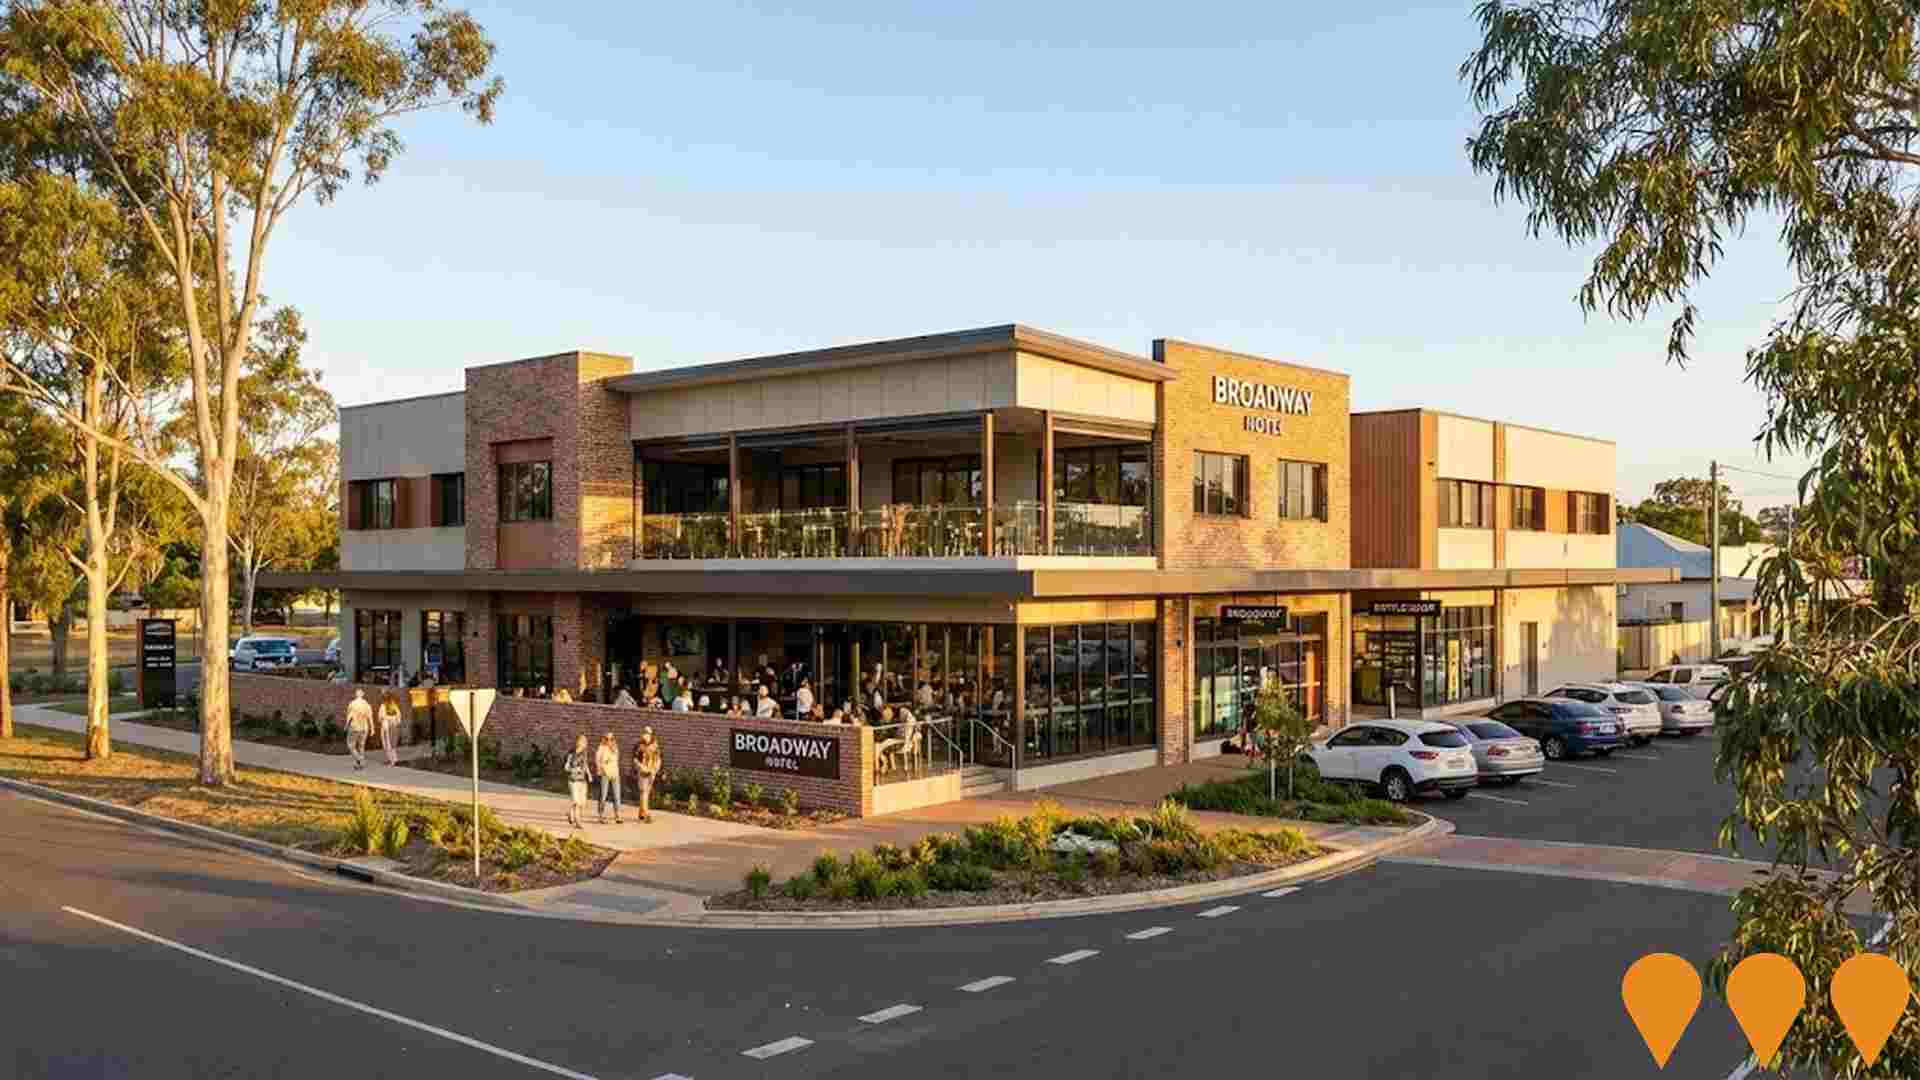
Twenty projects were identified by AreaSearch as potentially impacting the area's performance, with major ones including Nanango Solar Farm, Nanango Residential Estate Stage 2, South Burnett Energy Centre, and Nanango Town Centre Revitalisation.
Professional plan users can use the search below to filter and access additional projects.
INFRASTRUCTURE SEARCH
 Denotes AI-based impression for illustrative purposes only, not to be taken as definitive under any circumstances. Please follow links and conduct other investigations from the project's source for actual imagery. Developers and project owners wishing us to use original imagery please Contact Us and we will do so.
Frequently Asked Questions - Infrastructure
Kingaroy Hospital Redevelopment
Redevelopment of Kingaroy Hospital delivering a new two-level clinical services building with around 66 beds. The project expanded emergency, inpatient, maternity, operating theatres, dialysis, chemotherapy, and outpatient services, replacing and refurbishing parts of the old campus. The upgrade increases local care capacity for the South Burnett so fewer patients need to travel to larger centres.

South Burnett Renewable Energy Hub
The South Burnett Renewable Energy Hub is a regional initiative led by the South Burnett Regional Council to establish the area as a key renewable energy center in Queensland. It encompasses multiple projects including the Tarong West Wind Farm, Kingaroy Solar Farm, and South Burnett Battery Energy Storage System (BESS), focusing on solar, wind, and storage to support Queensland's renewable energy goals. The hub is expected to create hundreds of construction and permanent jobs, boost local economy, and increase housing demand in the region.

Tarong West Wind Farm
The project is for a 436.5MW wind farm consisting of up to 97 wind turbines and ancillary infrastructure, located approximately 30km west of Kingaroy. Stanwell acquired the project from RES, and it is set to be Australia's largest publicly owned wind farm. A Final Investment Decision is expected in early 2025, with construction anticipated to commence from 2025 and commercial operations expected in 2027.

Nanango Solar Farm
A proposed 100MW solar farm project by ENGIE Australia, planned for Lot 1 Nanango Tarong Road near Nanango, QLD. The original project was described as featuring over 300,000 solar panels and contributing to Queensland's renewable energy targets. Publicly available current information about this specific ENGIE-led project is scarce, suggesting the project may be in an early or stalled planning/development stage, though no recent official updates confirm this directly.
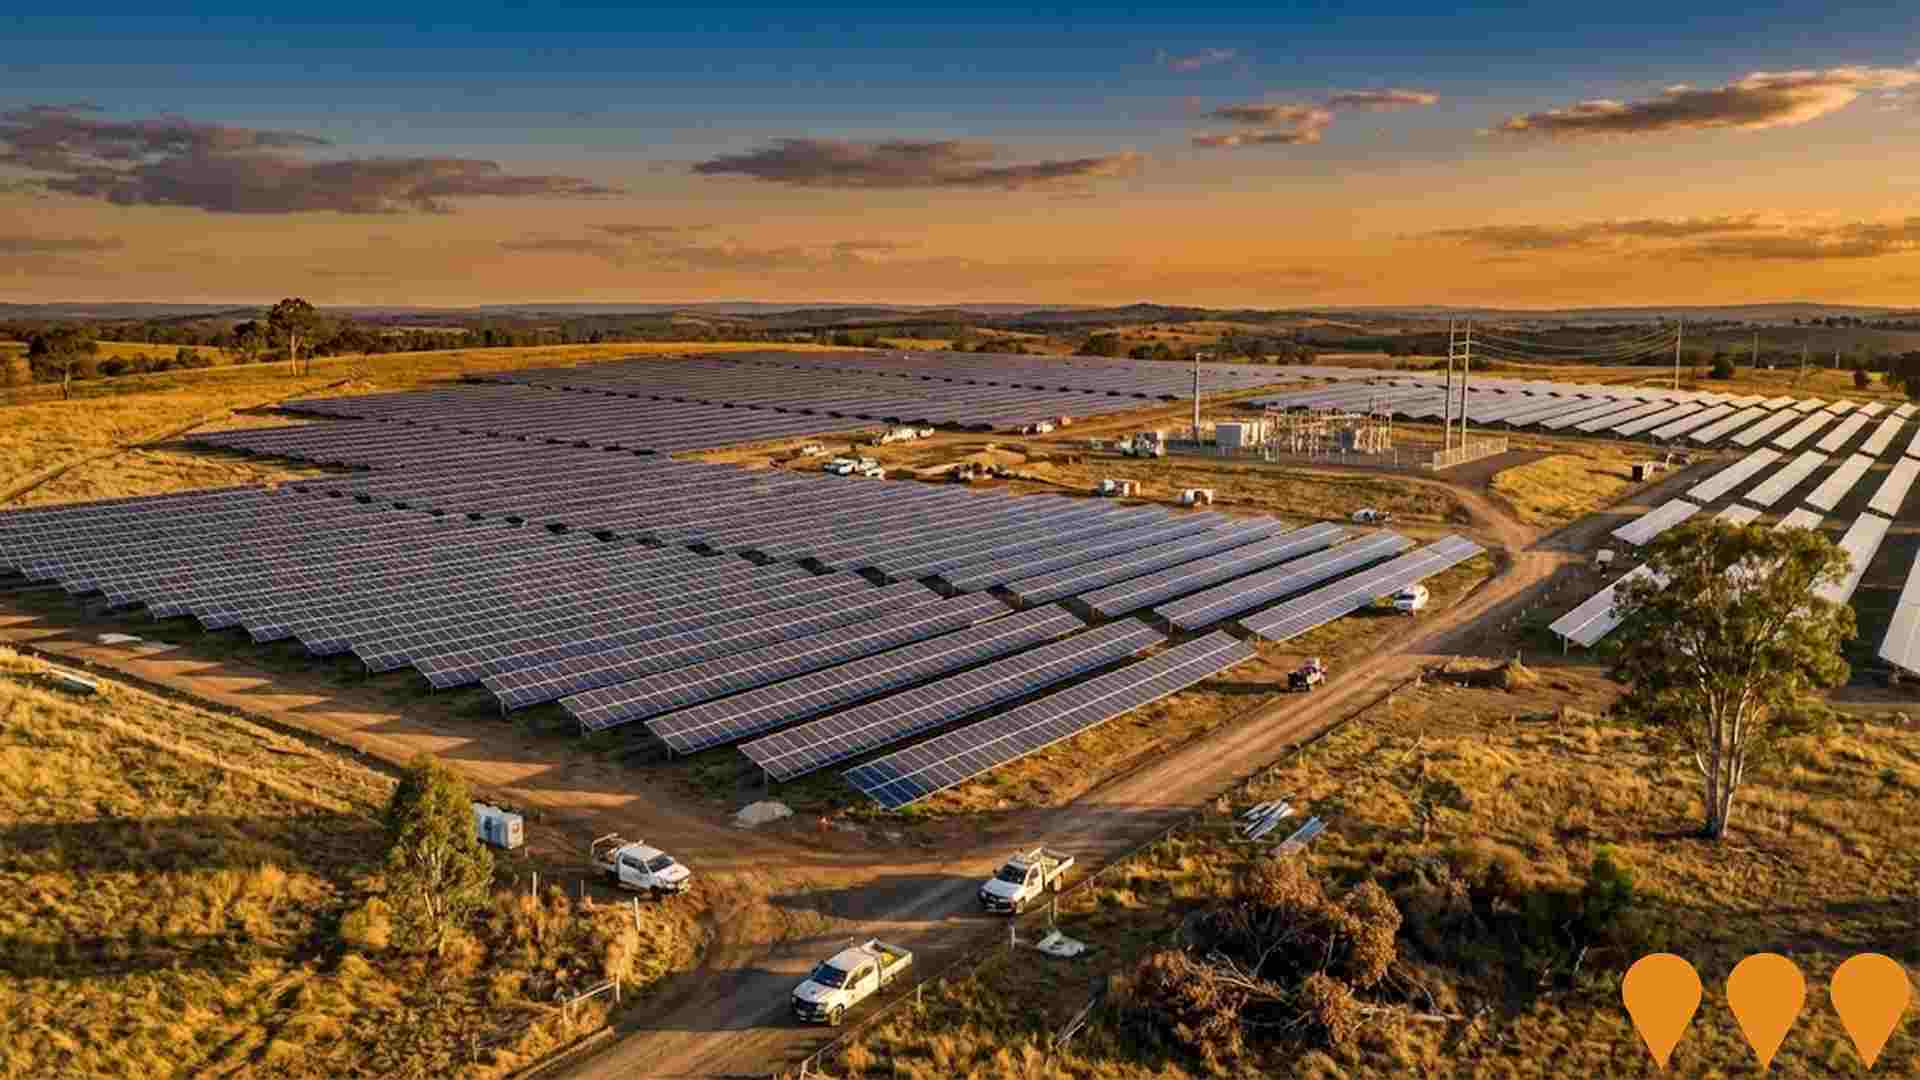
Kingaroy Solar Farm
A 53MW solar farm project bringing renewable energy to the area, now operational and in the Operations and Maintenance phase as of June 2025. It comprises solar PV modules, steel racking and piled supports, electrical transformers and inverters, electrical cabling, battery storage, telecommunications equipment, internal access tracks, an electrical operations room, substation, perimeter fencing, and an adequate buffer between sensitive receptors provided by setback and landscape planting.

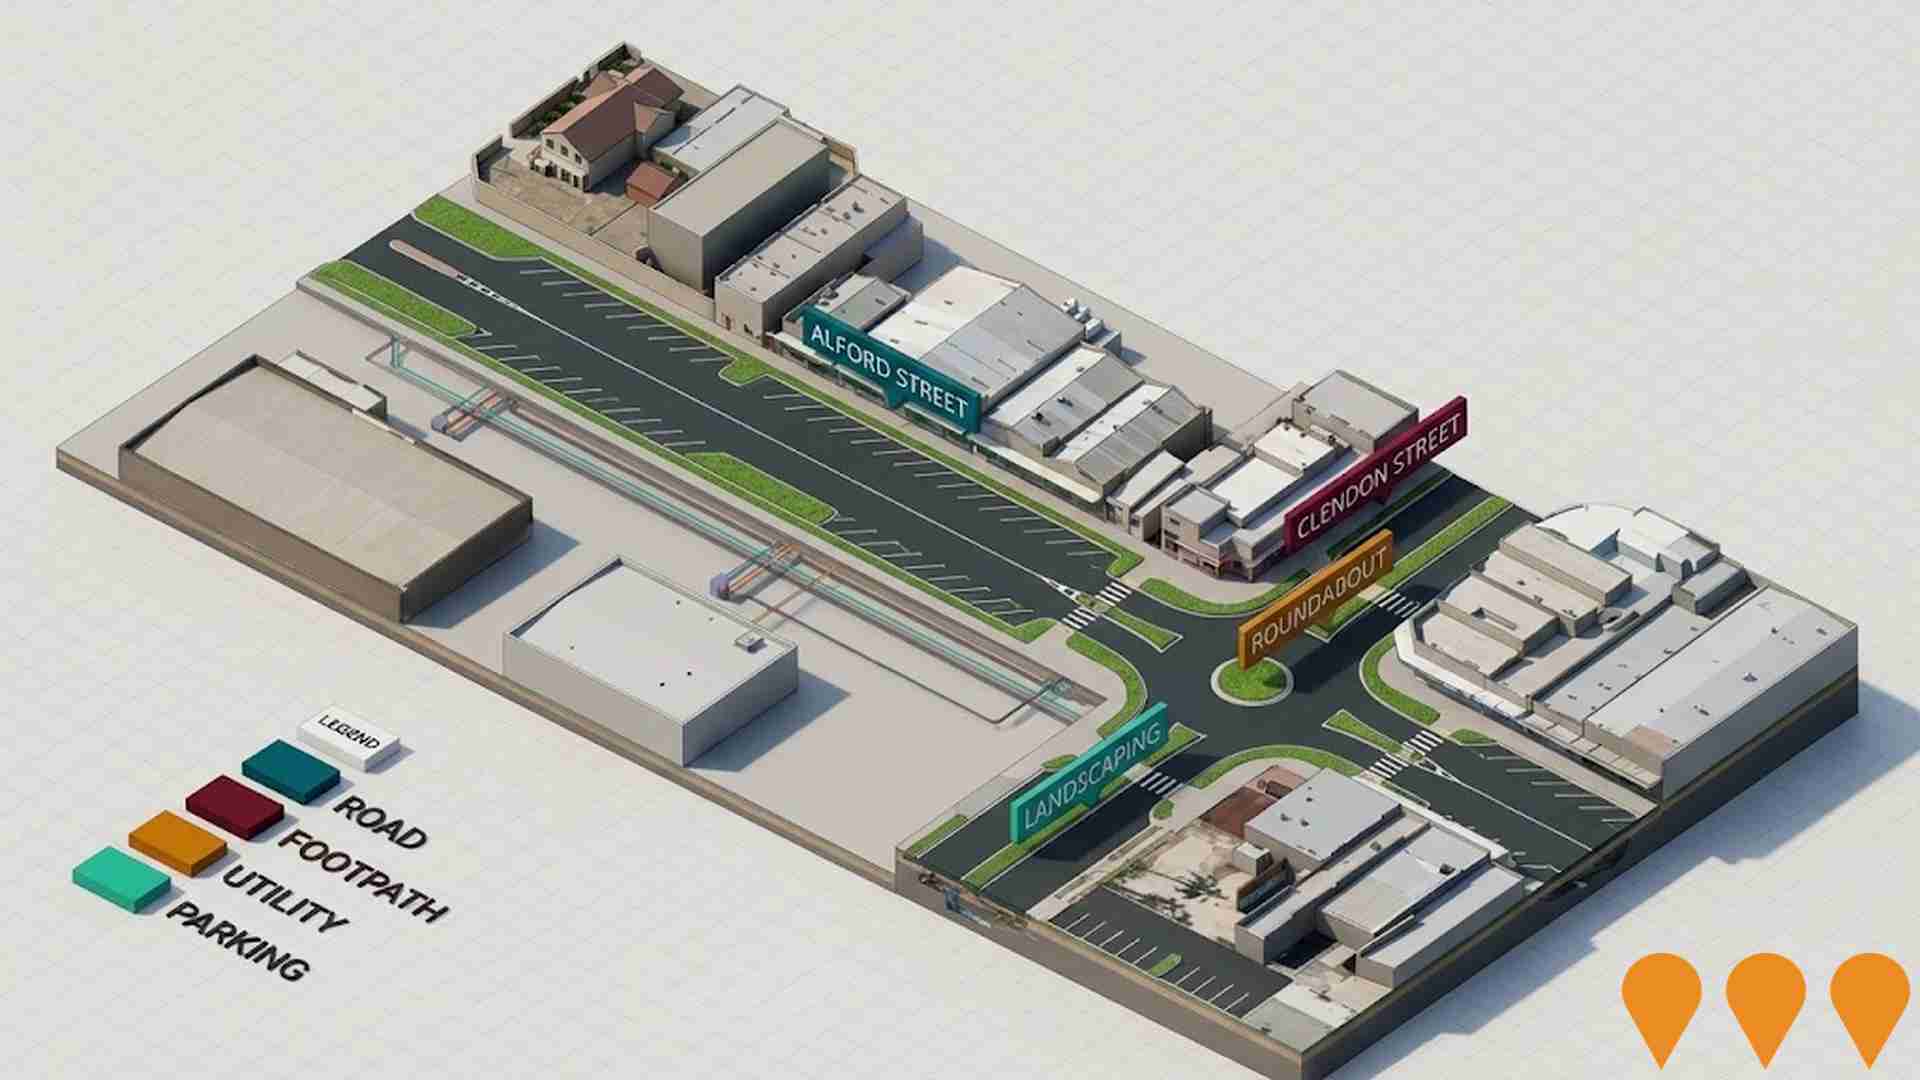
Nanango Town Centre Revitalisation
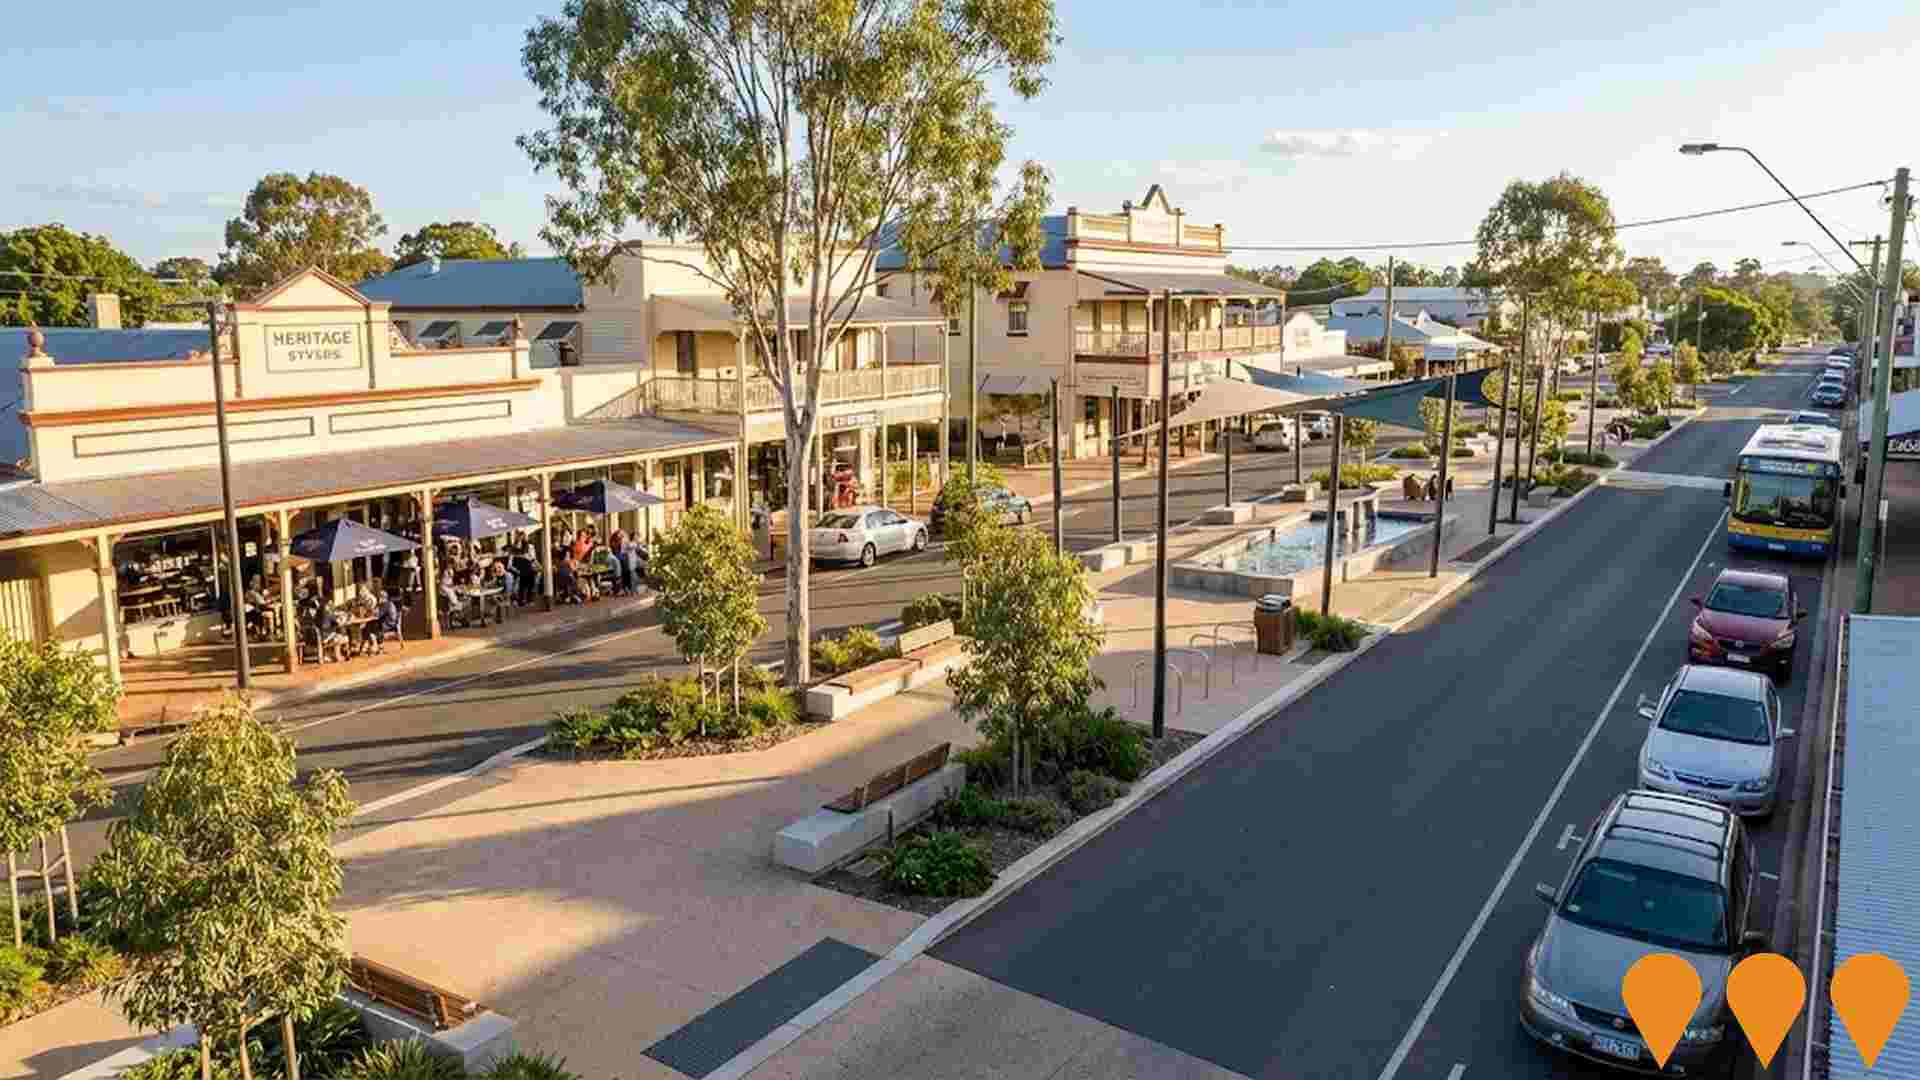
Revitalisation project to upgrade the town centre, primarily Drayton Street and adjacent side streets, with improved streetscapes, public spaces, alfresco dining opportunities, and amenities to boost local economy and community engagement. The design incorporates the history of Nanango, referencing the aboriginal meaning of the area - 'the place where the waters gather together'. Detailed design, including road, drainage, and streetscape elements, has been completed by JFP Urban Consultants for the South Burnett Regional Council.
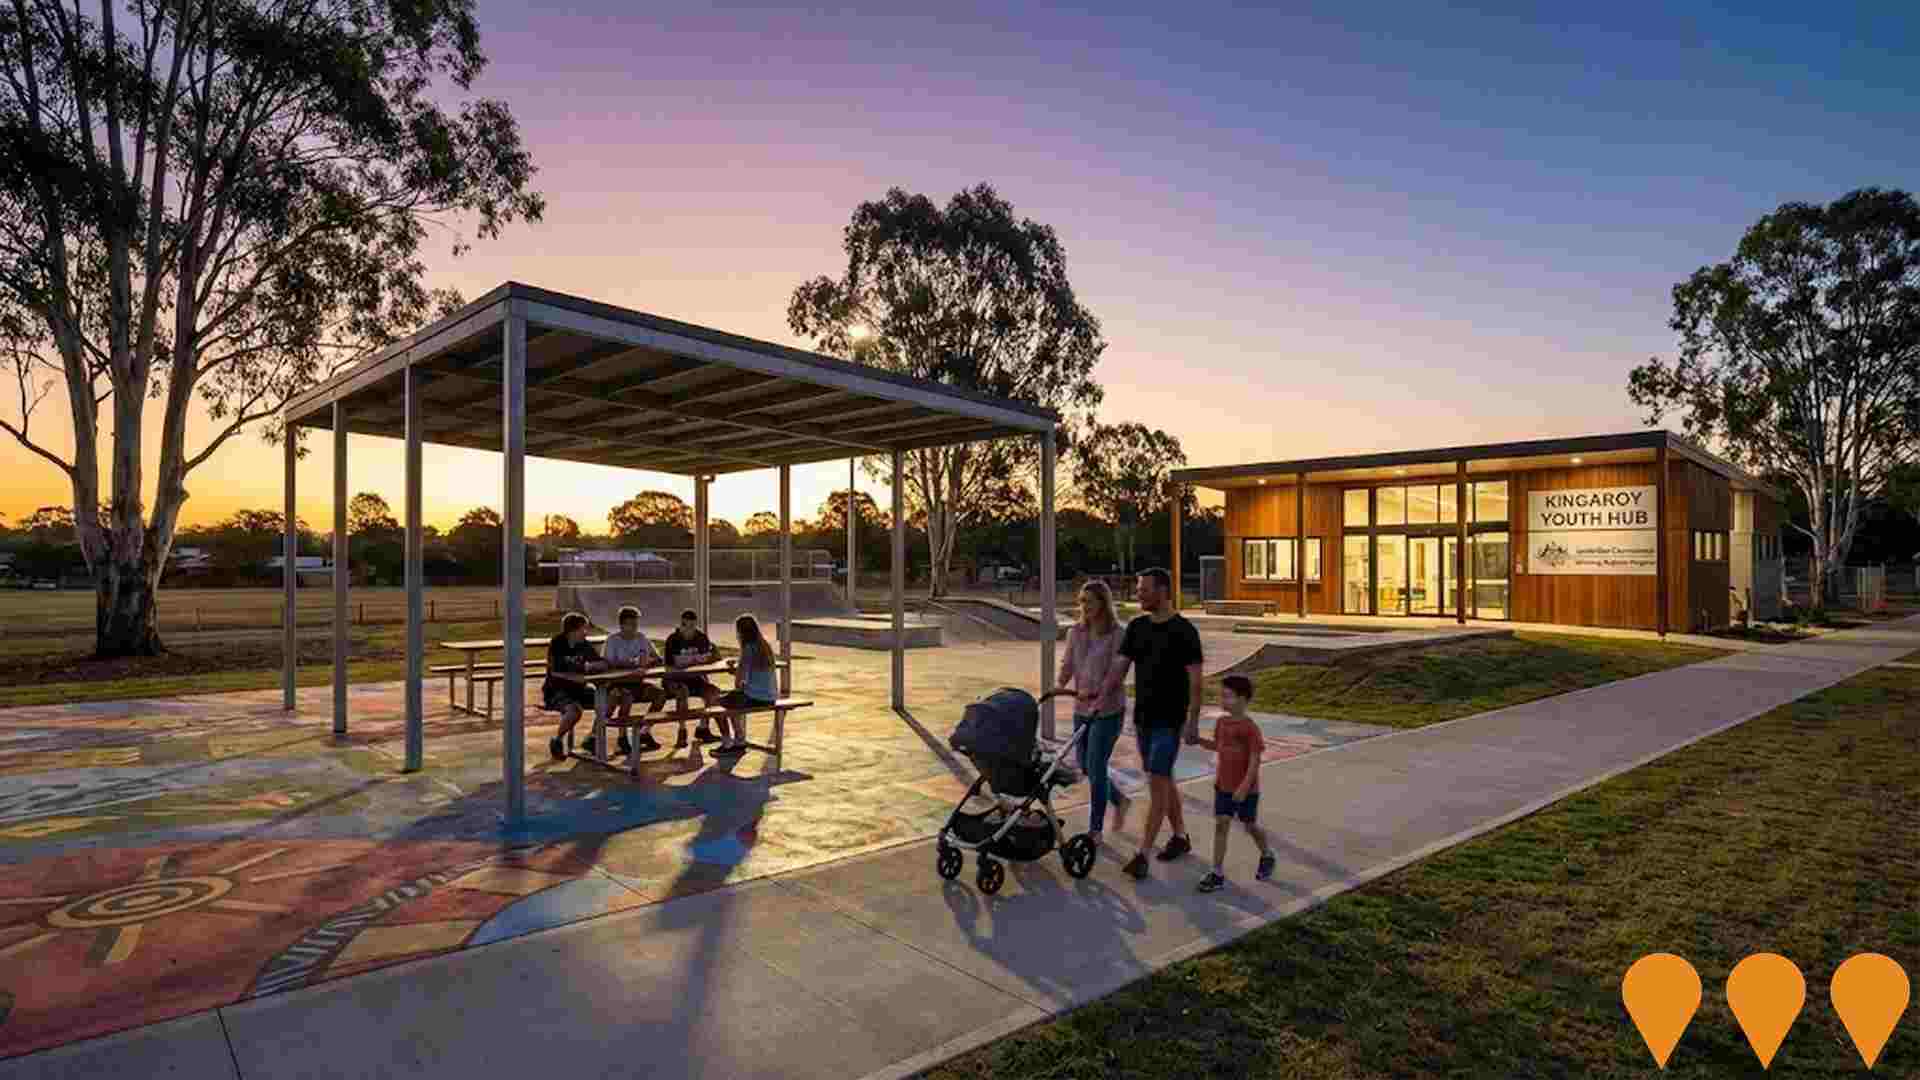
Kingaroy Youth Park Redevelopment: Stage 1
South Burnett CTC Inc will deliver Stage 1 works at the Kingaroy Youth Park to expand youth and family services. Scope includes a new welcoming reception, community undercover area, chat rooms, amenities, offices, landscaping and car parking. The project is 50/50 funded by the Australian Government Growing Regions Program and CTC (about $3.96m total). Tender awarded to Favier Building Industries; construction scheduled to commence October 2025.
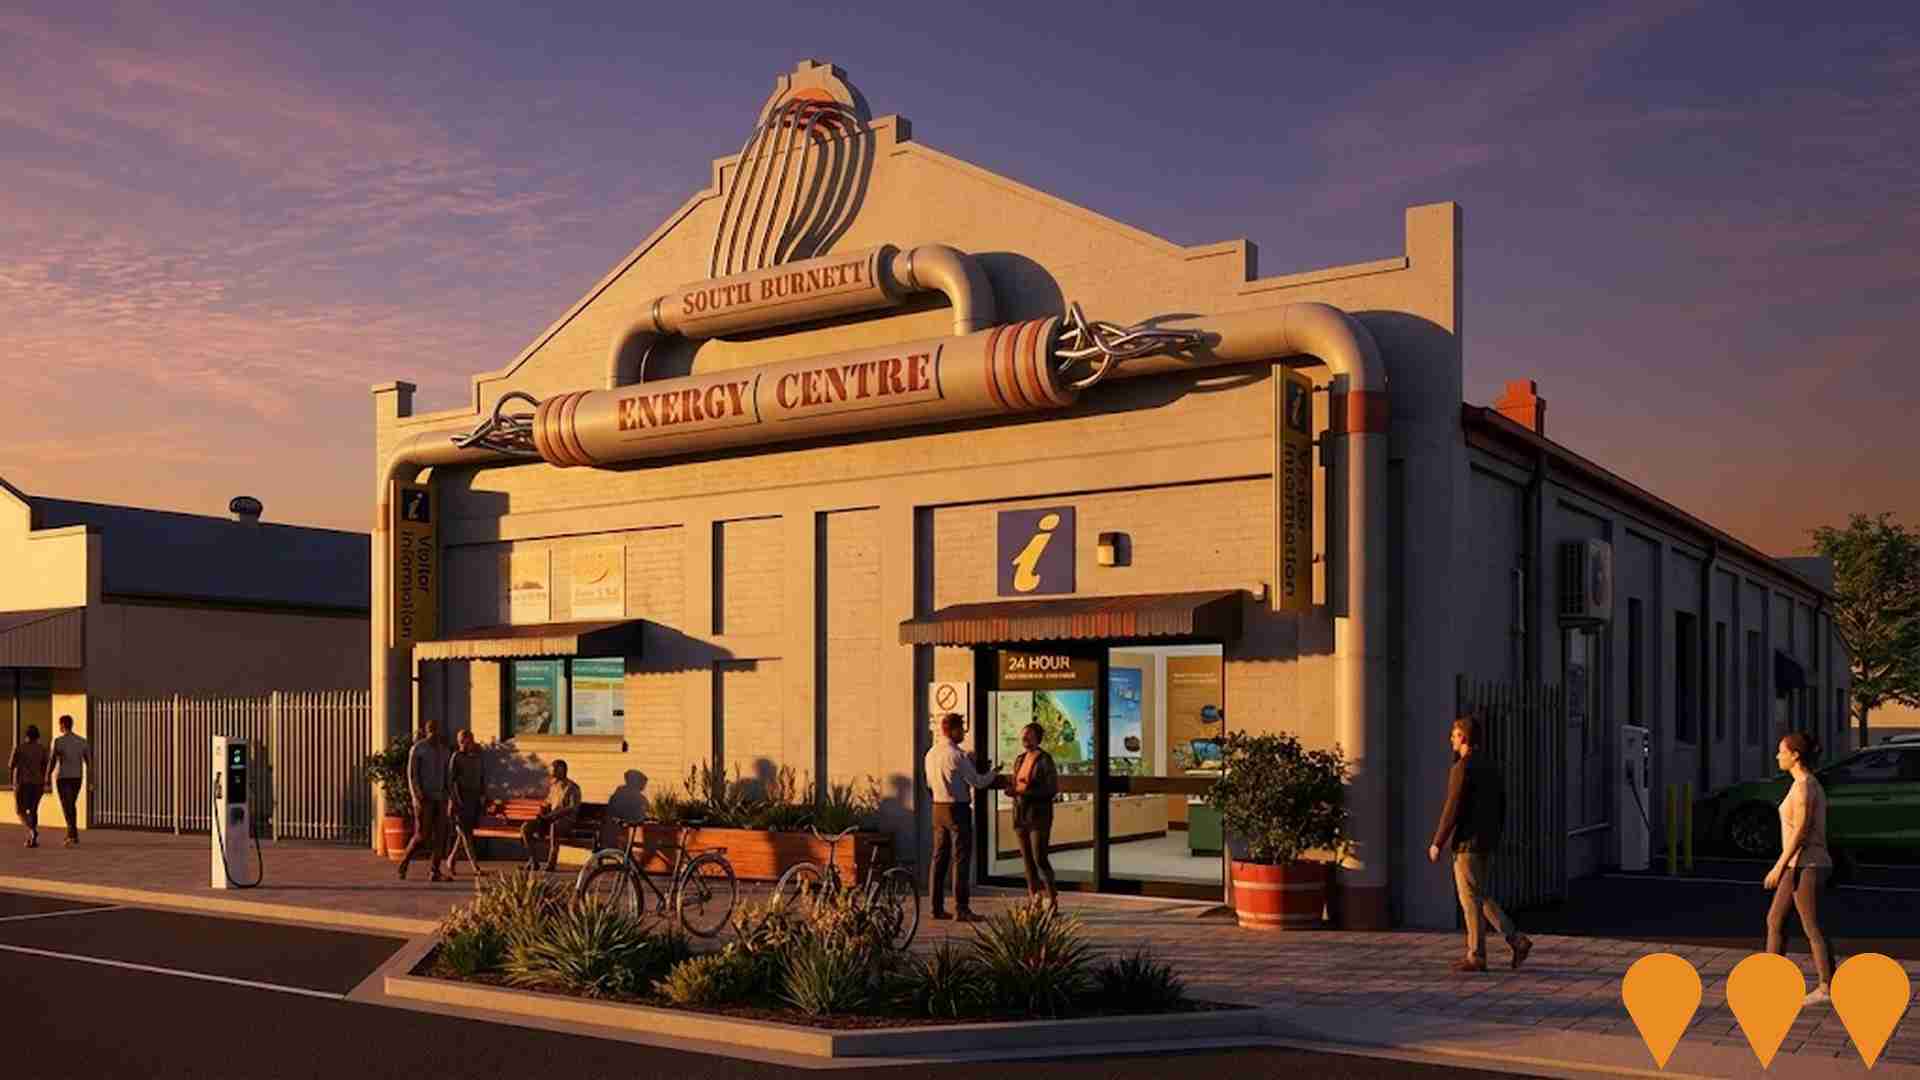
South Burnett Energy Centre
Renewable energy education and visitor centre in Nanango. Existing Energy Centre and Visitor Information Centre will incorporate updated renewable energy information and community education content to position the region as an energy hub, building on current interactive exhibits and heritage engines.
Employment
Employment drivers in Nanango are experiencing difficulties, placing it among the bottom 20% of areas assessed across Australia
Nanango has a balanced workforce with white and blue collar jobs, prominent manufacturing and industrial sectors, an unemployment rate of 8.4%, and estimated employment growth of 9.3% over the past year as of September 2025. There are 3,894 residents employed, with an unemployment rate of 4.3%, which is higher than Rest of Qld's rate of 4.1%.
Workforce participation in Nanango lags at 36.5% compared to Rest of Qld's 59.1%. Key industries for employment among residents are health care & social assistance, retail trade, and agriculture, forestry & fishing. Nanango has a strong specialization in agriculture, forestry & fishing with an employment share 2.4 times the regional level. However, health care & social assistance has limited presence at 13.6% compared to the regional rate of 16.1%.
Employment opportunities locally appear limited based on Census data. In the 12-month period ending September 2025, employment increased by 9.3%, labour force by 10.2%, leading to an unemployment rise of 0.8 percentage points. This contrasts with Rest of Qld where employment grew by 1.7%, labour force expanded by 2.1%, and unemployment rose by 0.3 percentage points. State-level data as of 25-Nov-25 shows Queensland's employment contracted by 0.01% (losing 1,210 jobs), with the state unemployment rate at 4.2%. National employment forecasts from May-25 project national growth of 6.6% over five years and 13.7% over ten years. Applying these projections to Nanango's employment mix suggests local employment should increase by 5.6% over five years and 12.2% over ten years, based on a simple weighting extrapolation for illustrative purposes.
Frequently Asked Questions - Employment
Income
Income metrics place the area in the bottom 10% of locations nationally according to AreaSearch analysis
AreaSearch's latest postcode level ATO data for financial year 2022 shows Nanango SA2 had a median taxpayer income of $38,509 and an average of $47,985. This is below the national average. Rest of Qld had a median of $50,780 and an average of $64,844. Based on Wage Price Index growth of 13.99% since financial year 2022, current estimates for Nanango are approximately $43,896 (median) and $54,698 (average) as of September 2025. Census data reveals household, family, and personal incomes in Nanango fall between the 1st and 2nd percentiles nationally. Income brackets indicate 34.7% of Nanango's population falls within the $400 - $799 income range, differing from metropolitan regions where the $1,500 - $2,999 category predominates at 31.7%. The concentration of 45.2% in sub-$800 weekly brackets highlights economic challenges faced by a significant portion of Nanango's community. While housing costs are modest with 87.5% of income retained, total disposable income ranks at just the 3rd percentile nationally.
Frequently Asked Questions - Income
Housing
Nanango is characterized by a predominantly suburban housing profile, with above-average rates of outright home ownership
Nanango's housing structure, as per the latest Census, comprised 94.7% houses and 5.2% other dwellings such as semi-detached homes, apartments, and 'other' dwellings. In comparison, Non-Metro Qld had 93.4% houses and 6.6% other dwellings. Home ownership in Nanango stood at 52.0%, with mortgaged dwellings at 27.6% and rented ones at 20.4%. The median monthly mortgage repayment was $1,000, lower than Non-Metro Qld's average of $1,083. The median weekly rent in Nanango was $230, matching Non-Metro Qld's figure but significantly lower than the national average of $375. Nationally, Nanango's mortgage repayments were notably lower at $1,000 compared to Australia's average of $1,863.
Frequently Asked Questions - Housing
Household Composition
Nanango features high concentrations of lone person households, with a lower-than-average median household size
Family households account for 63.9% of all households, including 17.5% couples with children, 34.4% couples without children, and 10.8% single parent families. Non-family households constitute the remaining 36.1%, with lone person households at 32.5% and group households comprising 3.6%. The median household size is 2.2 people, which is smaller than the Rest of Qld average of 2.3.
Frequently Asked Questions - Households
Local Schools & Education
Nanango faces educational challenges, with performance metrics placing it in the bottom quartile of areas assessed nationally
The area's university qualification rate is 10.0%, significantly lower than the Australian average of 30.4%. Bachelor degrees are most common at 7.5%, followed by postgraduate qualifications (1.3%) and graduate diplomas (1.2%). Vocational credentials are prevalent, with 41.9% of residents aged 15+ holding them - advanced diplomas at 9.0% and certificates at 32.9%. Educational participation is high, with 25.3% currently enrolled in formal education: 10.5% in primary, 9.8% in secondary, and 1.6% in tertiary education.
Educational participation is notably high, with 25.3% of residents currently enrolled in formal education. This includes 10.5% in primary education, 9.8% in secondary education, and 1.6% pursuing tertiary education.
Frequently Asked Questions - Education
Schools Detail
Nearby Services & Amenities
Transport
No public transport data available for this catchment area.
Frequently Asked Questions - Transport
Transport Stops Detail
Health
Health performance in Nanango is a key challenge with a range of health conditions having marked impacts on both younger and older age cohorts
Nanango faces significant health challenges, with various conditions affecting both younger and older residents. Private health cover is low at approximately 46%, compared to the national average of 55.3%.
The most prevalent medical conditions are arthritis (13.6%) and mental health issues (11.4%). Conversely, 53.4% of residents report no medical ailments, compared to 59.4% in the rest of Queensland. Nanango has a higher proportion of seniors aged 65 and over at 33.5%, compared to 26.8% in the rest of Queensland. Despite this, health outcomes among seniors are challenging but perform better than the general population in health metrics.
Frequently Asked Questions - Health
Cultural Diversity
Nanango is considerably less culturally diverse than average when assessed alongside AreaSearch's national rankings for language and cultural background related metrics
Nanango's cultural diversity was found to be below average, with 86.5% of its population being citizens, 87.2% born in Australia, and 97.8% speaking English only at home. Christianity is the predominant religion in Nanango, comprising 52.7% of people, compared to 56.4% across Rest of Qld. In terms of ancestry, the top three represented groups in Nanango are English (34.5%), Australian (30.0%), and Irish (8.8%).
Notably, German is overrepresented at 6.5%, compared to 7.8% regionally, while Australian Aboriginal is underrepresented at 3.6% (vs 6.0%) and Scottish is slightly higher at 8.2% (vs 7.4%).
Frequently Asked Questions - Diversity
Age
Nanango ranks among the oldest 10% of areas nationwide
The median age in Nanango is 54 years, significantly higher than the Rest of Queensland's average of 41 years and also above the national norm of 38 years. The proportion of people aged 65-74 years in Nanango is notably higher at 19.7%, compared to the Rest of Queensland average, while those aged 25-34 years are under-represented at 6.8%. This concentration of people aged 65-74 years is well above the national figure of 9.4%. Between 2021 and present, the proportion of people aged 75 to 84 years has increased from 9.5% to 11.3%, while the proportion of those aged 5 to 14 years has decreased from 10.6% to 9.0%. Population forecasts for 2041 indicate substantial demographic changes in Nanango, with the 75 to 84 age group projected to grow by 24%, adding 297 residents to reach a total of 1,519. Senior residents aged 65 years and above will drive 71% of population growth, highlighting demographic aging trends. Conversely, both the 5 to 14 and 15 to 24 age groups are projected to have reduced numbers.
