Chart Color Schemes
This analysis uses ABS Statistical Areas Level 2 (SA2) boundaries, which can materially differ from Suburbs and Localities (SAL) even when sharing similar names.
SA2 boundaries are defined by the Australian Bureau of Statistics and are designed to represent communities for statistical reporting (e.g., census and ERP).
Suburbs and Localities (SAL) represent commonly-used suburb/locality names (postal-style areas) and may use different geographic boundaries. For comprehensive analysis, consider reviewing both boundary types if available.
est. as @ -- *
ABS ERP | -- people | --
2021 Census | -- people
Sales Activity
Curious about local property values? Filter the chart to assess the volume and appreciation (including resales) trends and regional comparisons, or scroll to the map below view this information at an individual property level.
Find a Recent Sale
Sales Detail
Population
Warilla has shown very soft population growth performance across periods assessed by AreaSearch
Warilla's population, as of November 2025, is approximately 20,614 people. This figure represents an increase of 217 individuals since the 2021 Census, which recorded a population of 20,397. The change was inferred from the estimated resident population of 20,593 in June 2024 and an additional 139 validated new addresses since the Census date. This results in a population density ratio of 2,172 persons per square kilometer, higher than the average across national locations assessed by AreaSearch. Overseas migration contributed approximately 56.6% of overall population gains during recent periods.
AreaSearch uses ABS/Geoscience Australia projections for each SA2 area, released in 2024 with a base year of 2022. For areas not covered, NSW State Government's SA2 level projections from 2022 with a base year of 2021 are utilized. Growth rates by age group are applied to all areas for the years 2032 to 2041. Projections indicate an overall population decline over this period, with Warilla's population expected to decrease by 166 persons by 2041. However, specific age cohorts are anticipated to grow, notably the 25 to 34 age group, projected to increase by 512 people.
Frequently Asked Questions - Population
Development
AreaSearch analysis of residential development drivers sees Warilla recording a relatively average level of approval activity when compared to local markets analysed countrywide
Warilla has seen approximately 81 new homes approved annually over the past five financial years, totalling 406 homes. As of FY-26, 37 approvals have been recorded. The population has fallen during this period, suggesting that new supply has likely kept pace with demand, providing good choice for buyers. New properties are constructed at an average expected cost value of $296,000.
In the current financial year, $5.7 million in commercial development approvals have been recorded, indicating Warilla's primarily residential nature. Compared to the rest of NSW, Warilla shows reduced construction activity, with 56.0% fewer approvals per person, which generally supports stronger demand and values for established homes. Recent construction comprises 26.0% detached dwellings and 74.0% townhouses or apartments, reflecting a shift towards higher-density living to create more affordable entry points for downsizers, investors, and first-home buyers. This marks a significant change from the current housing mix, which is predominantly houses at 78.0%. Warilla has around 246 people per dwelling approval, indicating characteristics of a low density area. Given stable or declining population forecasts, Warilla may experience less housing pressure in the future, creating favourable conditions for buyers.
Given stable or declining population forecasts, Warilla may experience less housing pressure, creating favourable conditions for buyers.
Frequently Asked Questions - Development
Infrastructure
Warilla has moderate levels of nearby infrastructure activity, ranking in the top 50% nationally
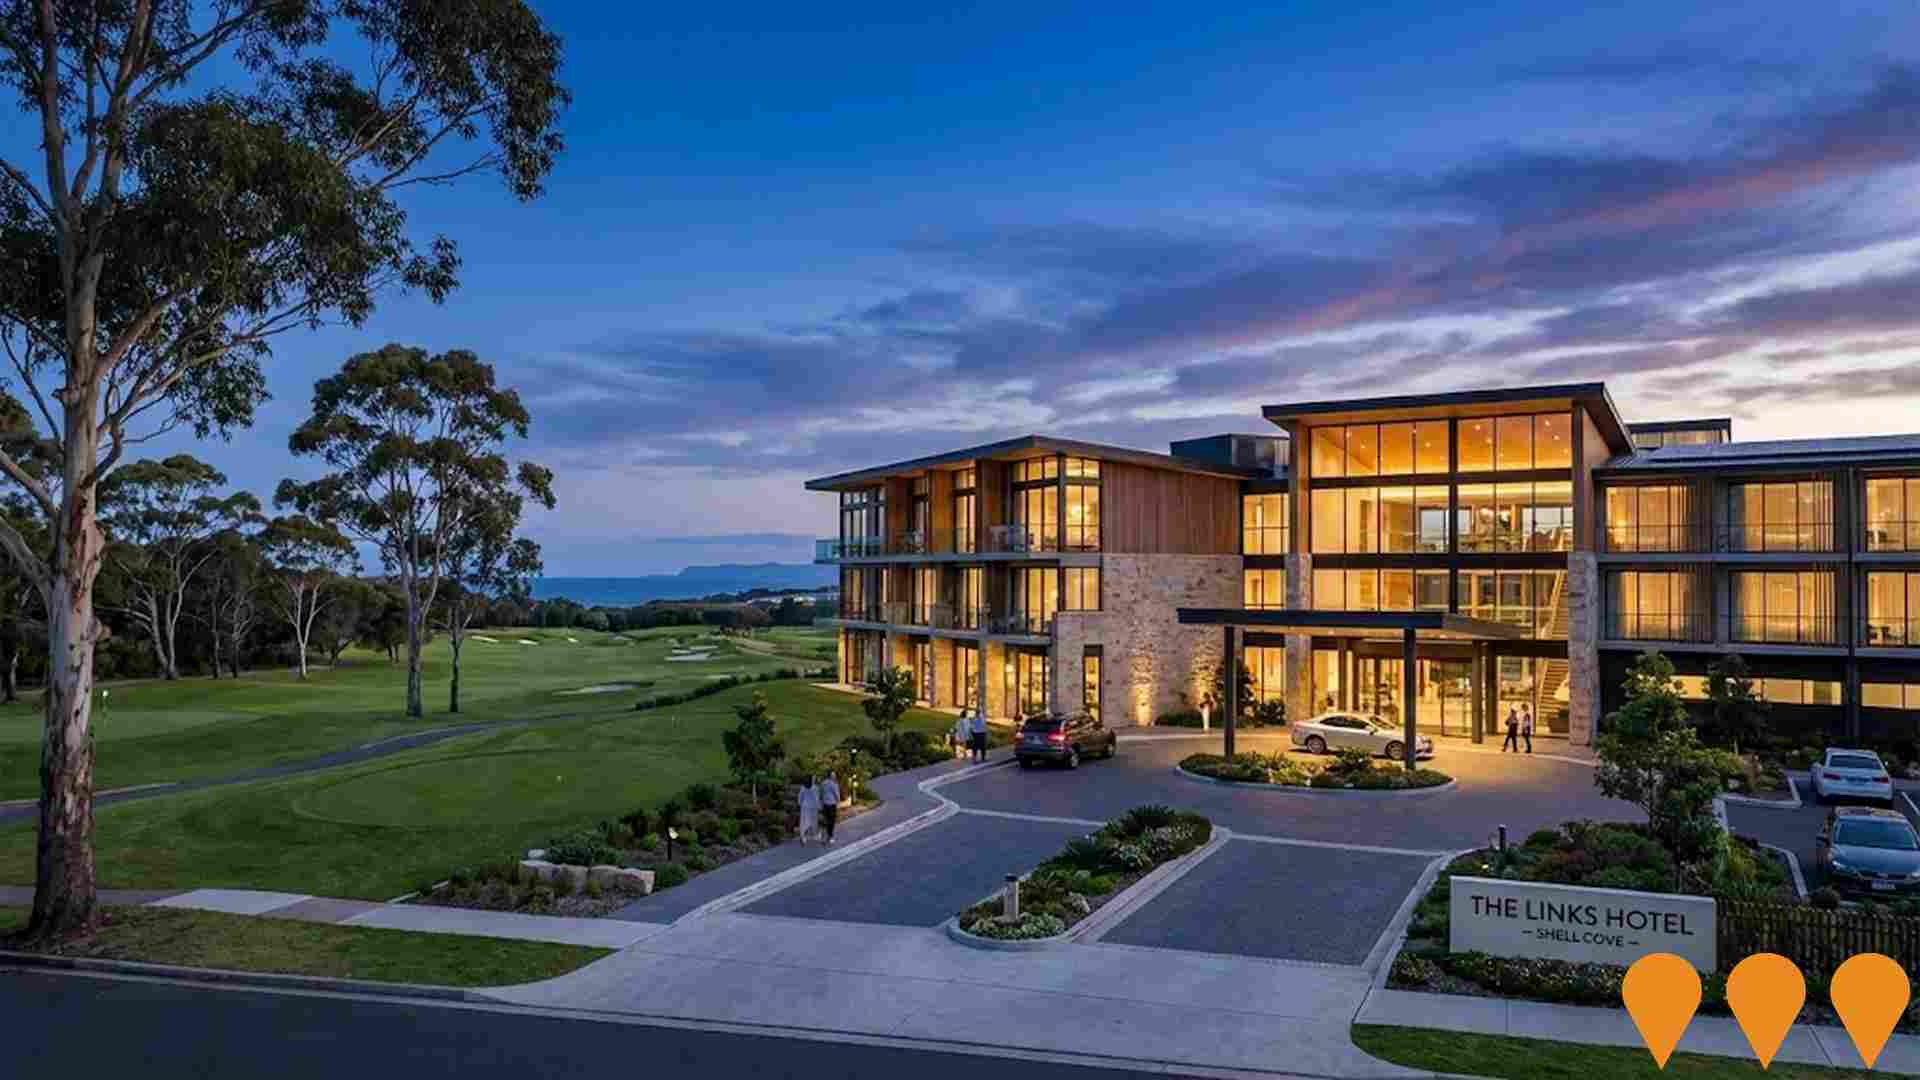
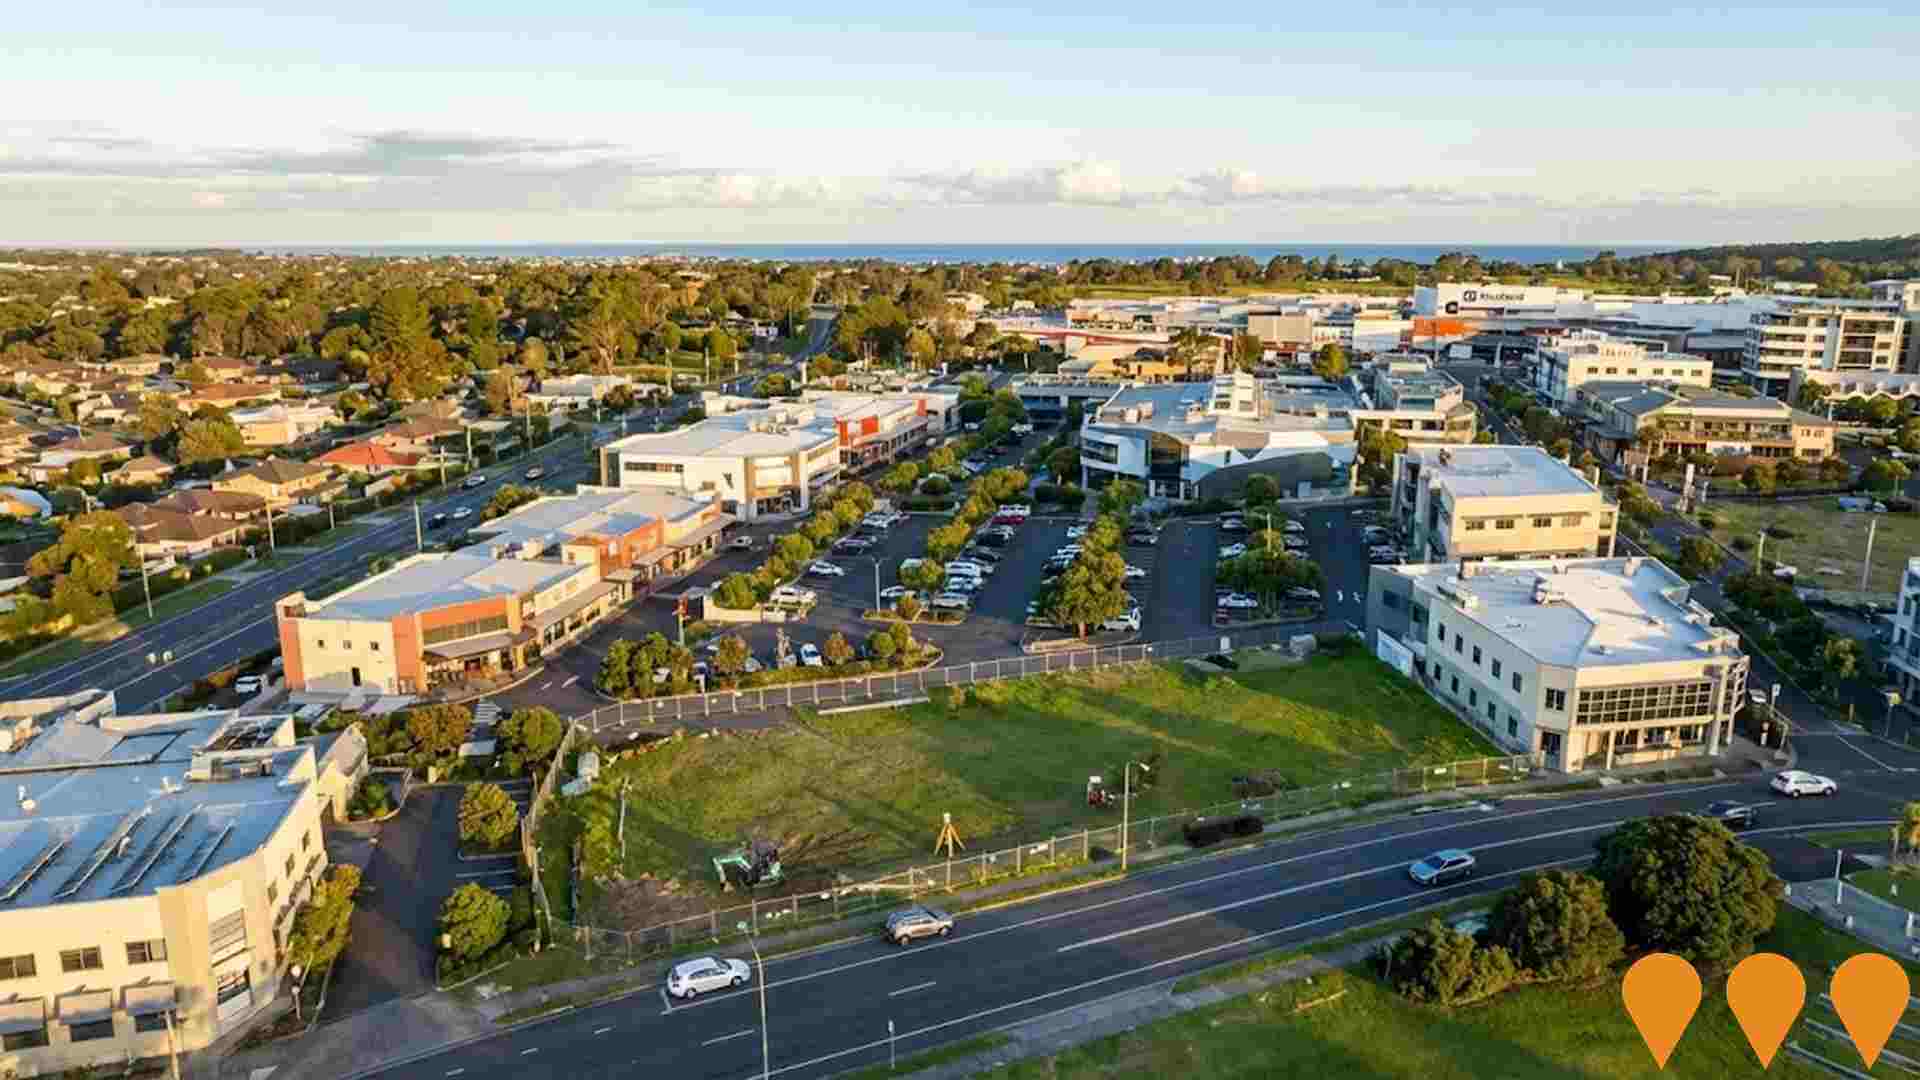
Changes in local infrastructure significantly affect an area's performance. AreaSearch has identified 13 projects expected to impact the region. Notable initiatives include Warilla Beach Seawall Renewal, Playground Renewals & Upgrades Program (Jilba Park, Collins Reserve), The Waterfront Shell Cove, and The Links Hotel. Below is a list of most relevant projects.
Professional plan users can use the search below to filter and access additional projects.
INFRASTRUCTURE SEARCH
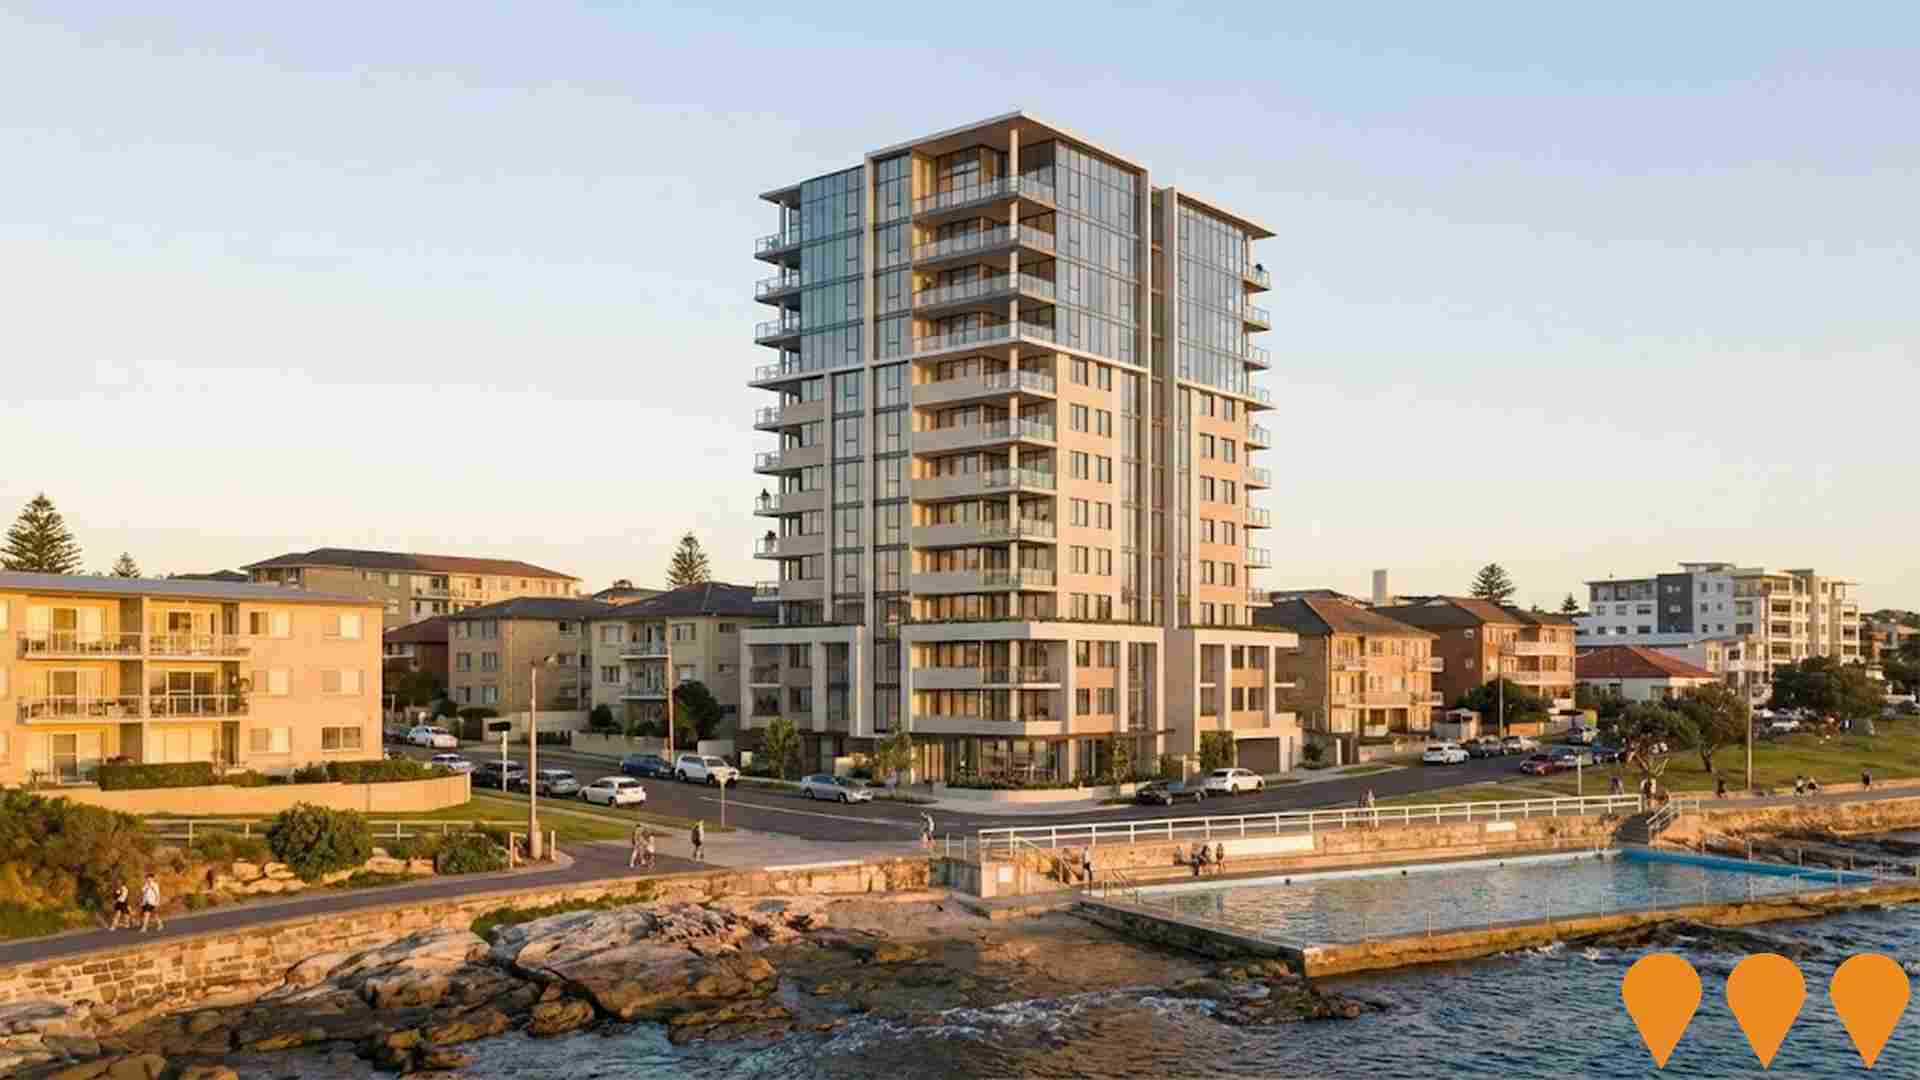
 Denotes AI-based impression for illustrative purposes only, not to be taken as definitive under any circumstances. Please follow links and conduct other investigations from the project's source for actual imagery. Developers and project owners wishing us to use original imagery please Contact Us and we will do so.
Frequently Asked Questions - Infrastructure
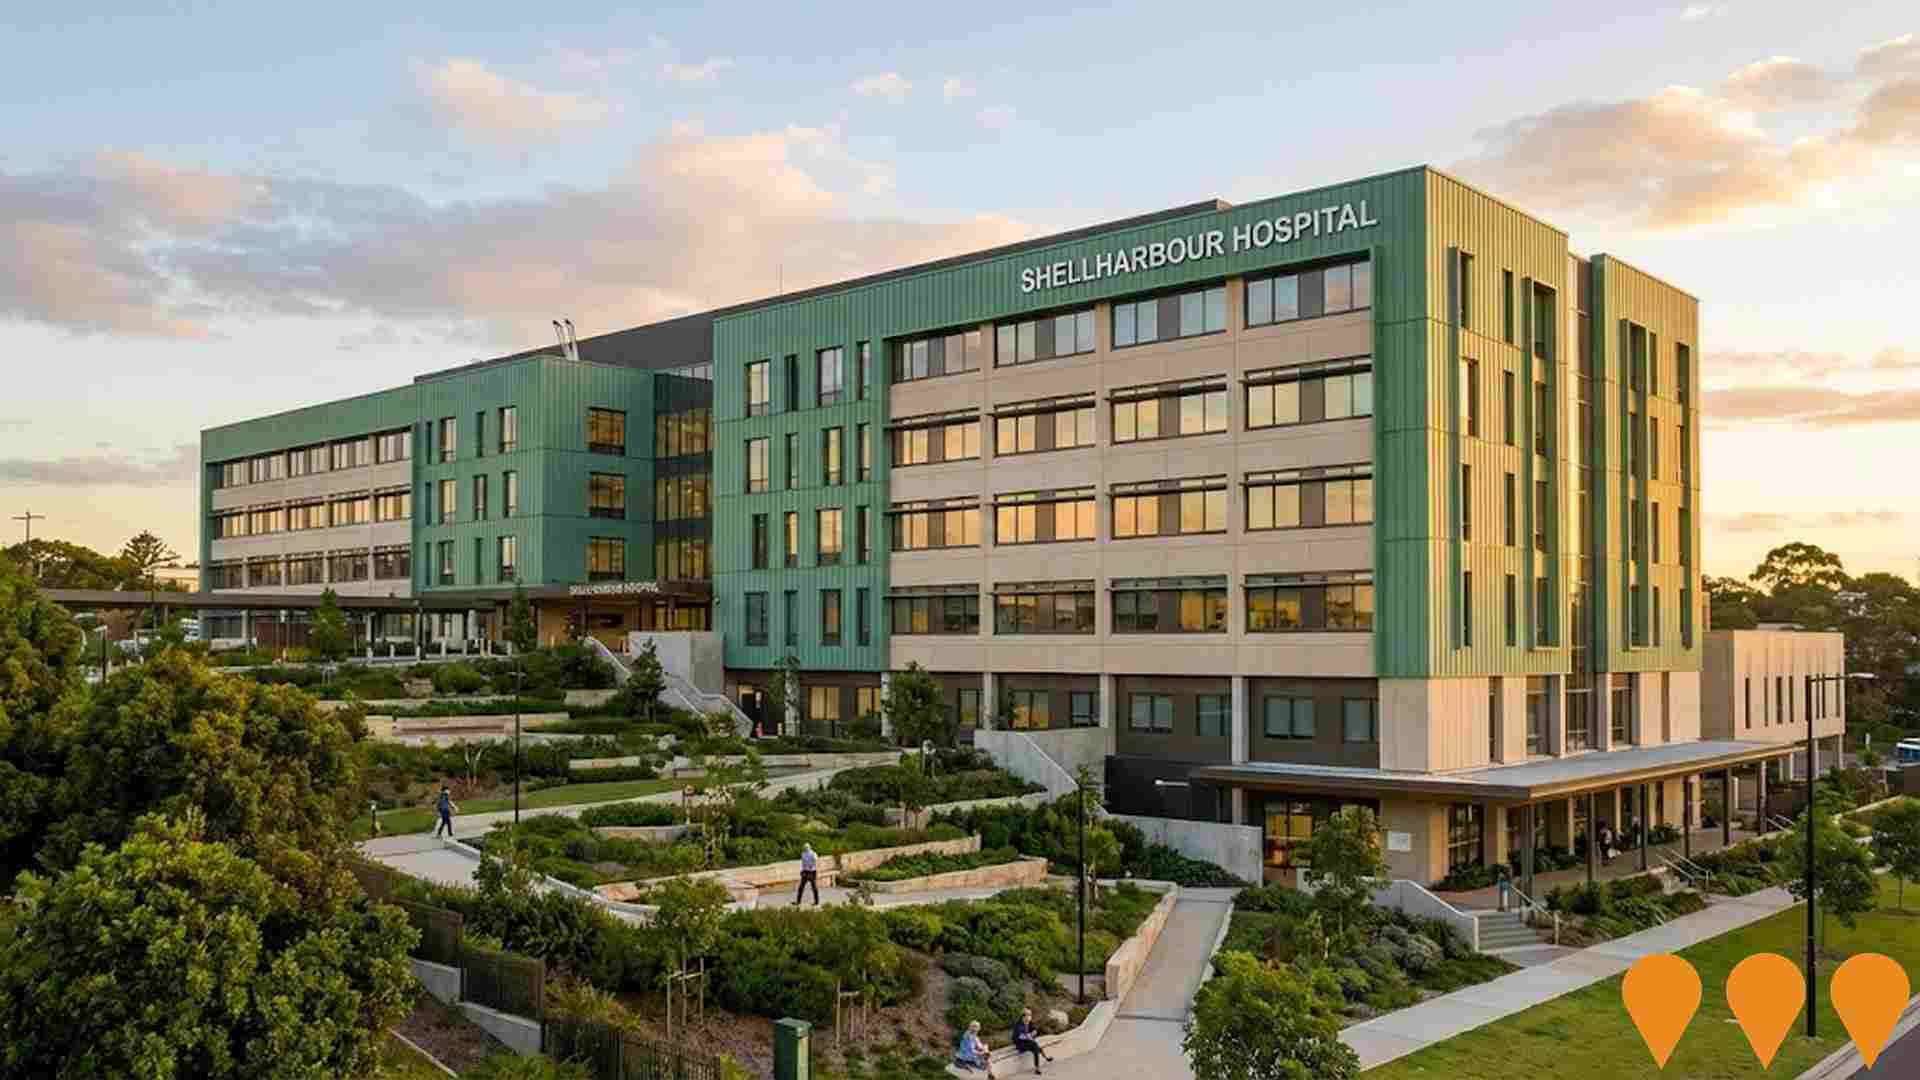
New Shellharbour Hospital and Integrated Services
A $780+ million redevelopment delivering a new multi-storey Shellharbour Hospital at Dunmore with expanded emergency department, specialist elective surgery theatres, paediatrics, mental health inpatient unit, rehabilitation and aged care services, renal dialysis, oncology, ambulatory care and outpatients. The project also includes a new Warrawong Community Health Centre and upgrades to Bulli and Wollongong hospitals. Main construction works are well underway with practical completion expected in late 2027.
Shellharbour City Centre Masterplan
The Shellharbour City Centre Masterplan is a long-term plan aimed at creating a vibrant heart, resilient economy, and improved regional employment. It seeks to increase development opportunities in the Shellharbour CBD, deliver quality community spaces, and incorporate a mix of retail, entertainment, commercial, and residential developments. The plan includes government-owned land such as the site of the current Shellharbour Hospital (to be decommissioned upon completion of the new hospital in 2027), adjoining TAFE, and NSW Land and Housing properties, as well as privately-owned land. The masterplan is being progressed to unlock the city centre's potential as the economic, cultural, and social heart of the city.
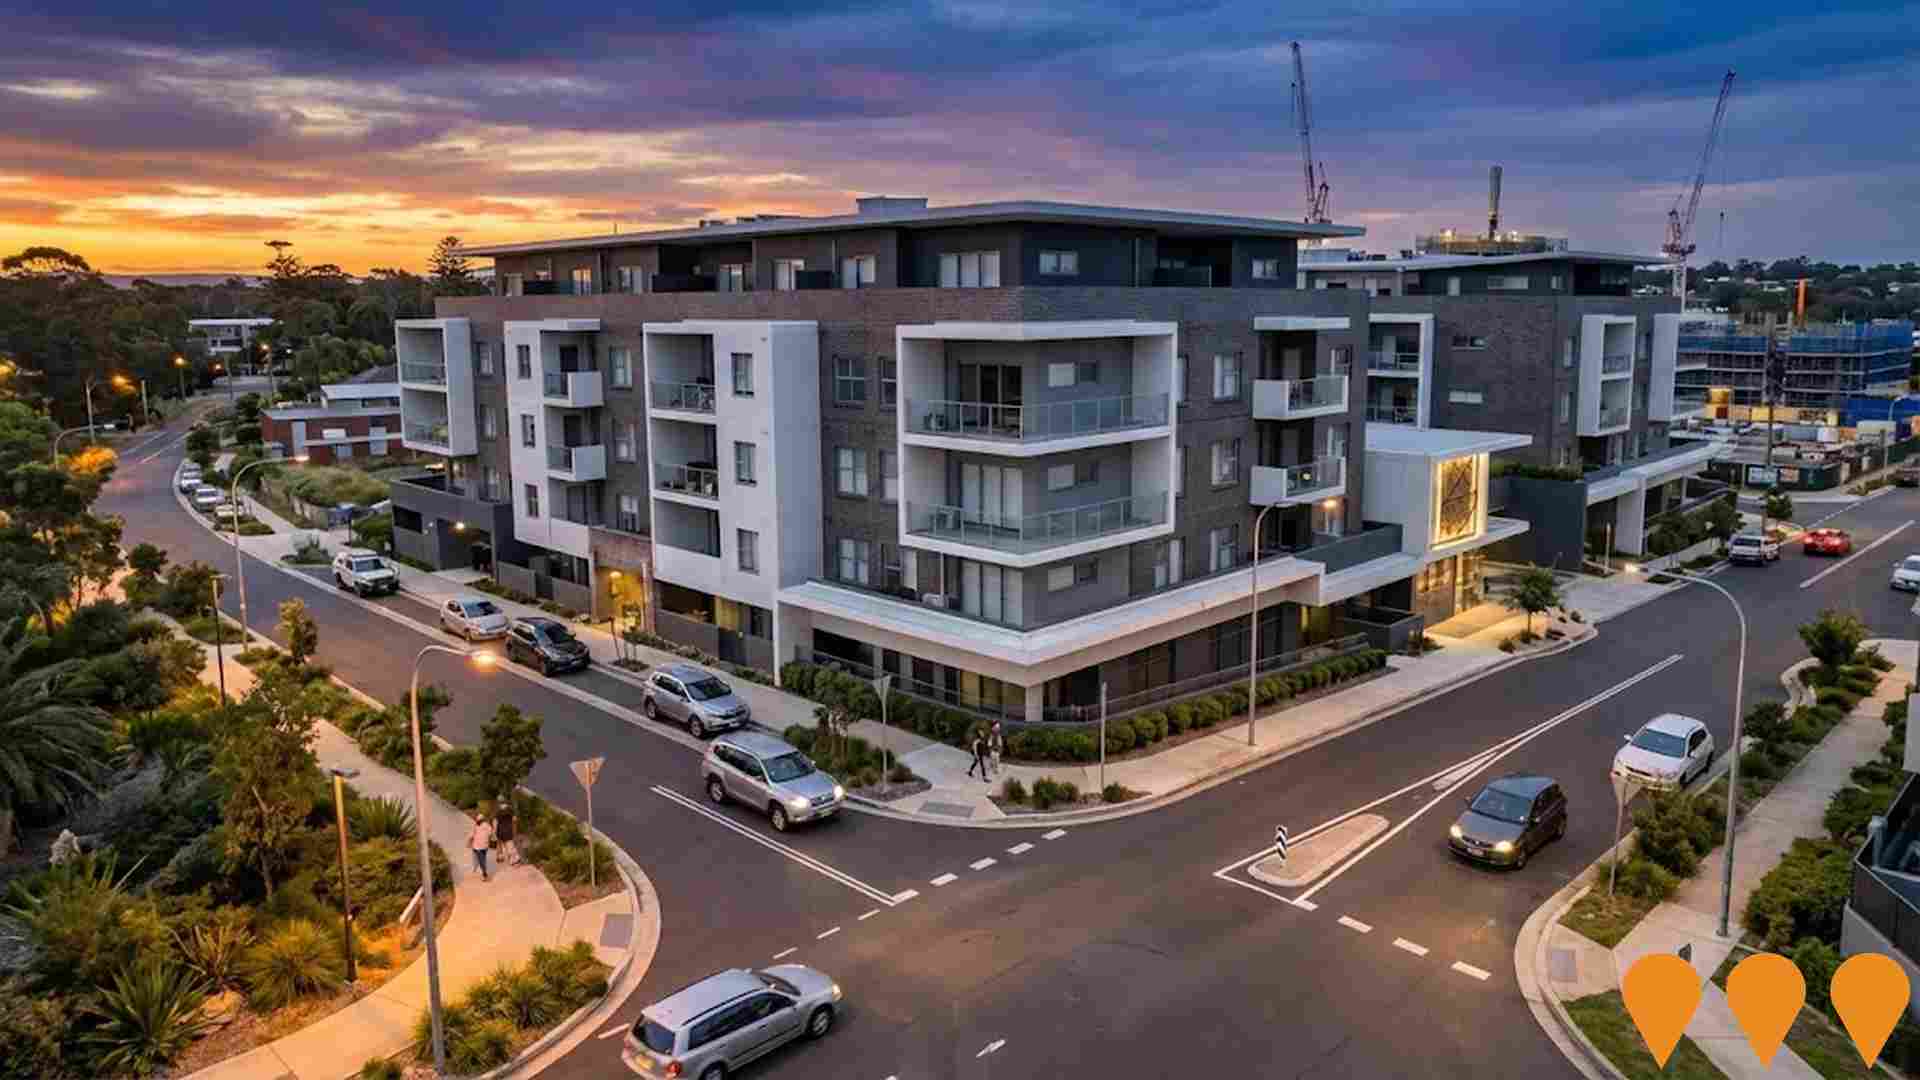
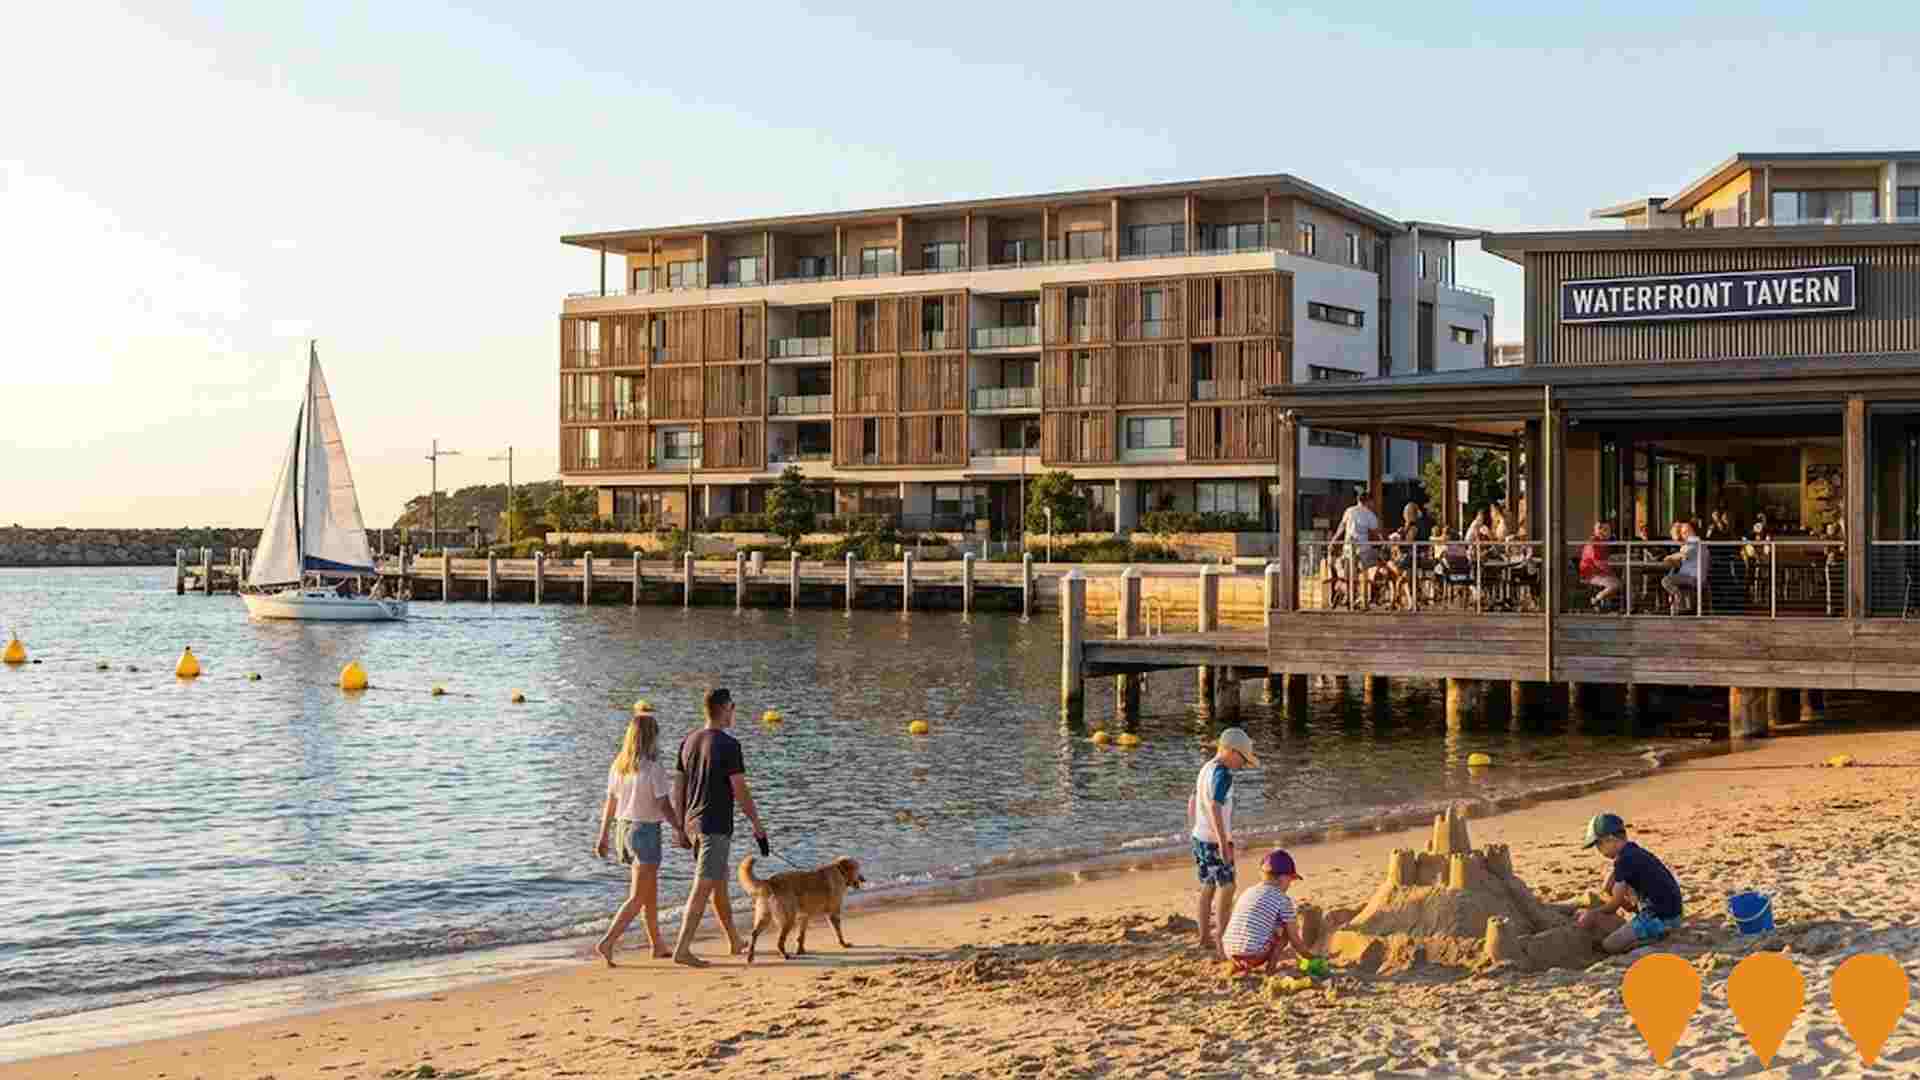
The Waterfront Shell Cove
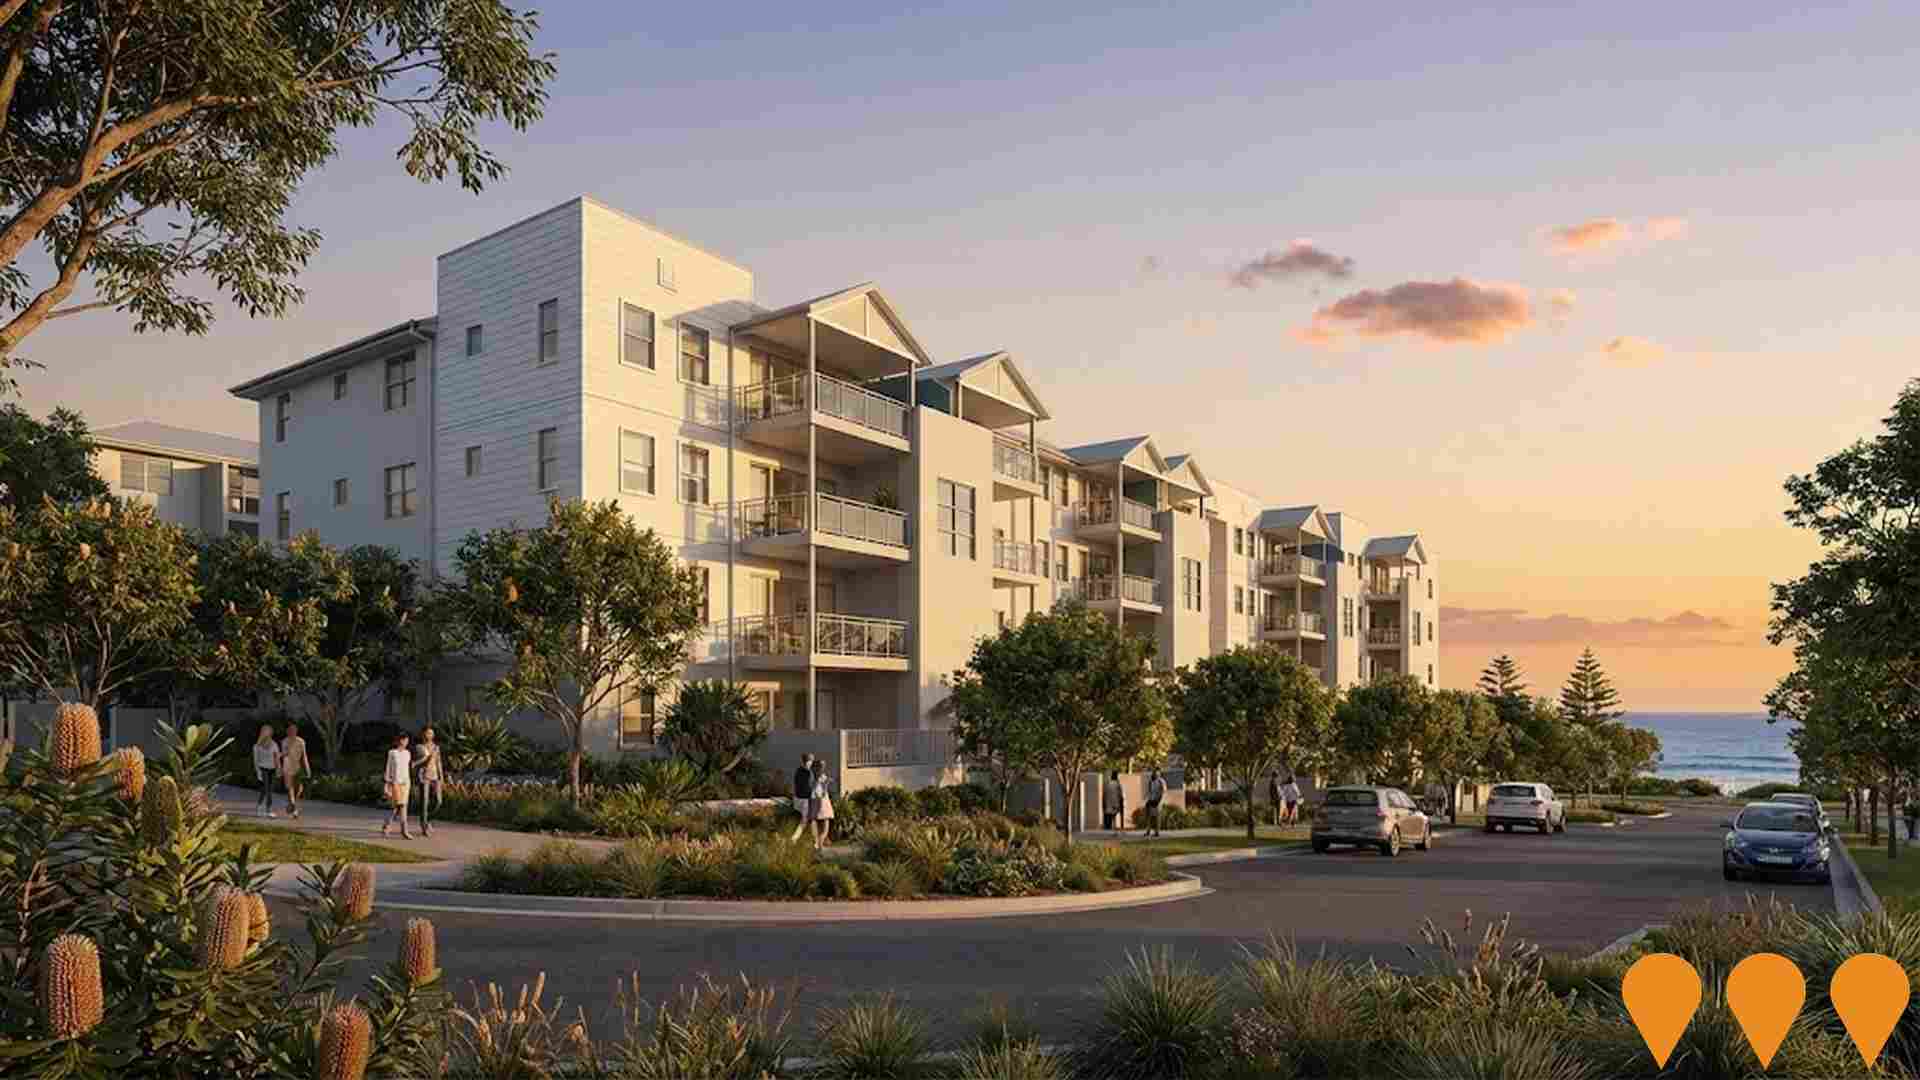
The Waterfront Shell Cove is a $2.1 billion master-planned coastal community by Frasers Property Australia in partnership with Shellharbour City Council. Key features include Australia's first man-made ocean harbour in over 100 years with a 270-berth Shellharbour Marina, over 3,000 homes and apartments (up to ~3,250), a vibrant town centre with Woolworths, specialty retail, dining precinct, tavern, library and community facilities (some on hold), Crowne Plaza hotel (opening 2025), extensive parklands, playgrounds, 2.5km of boardwalks and promenades. Recent milestones include Vela Apartments topping out (move-ins late 2026) and winning 'Best Regional Project' at the 2025 Australian Apartment Awards.
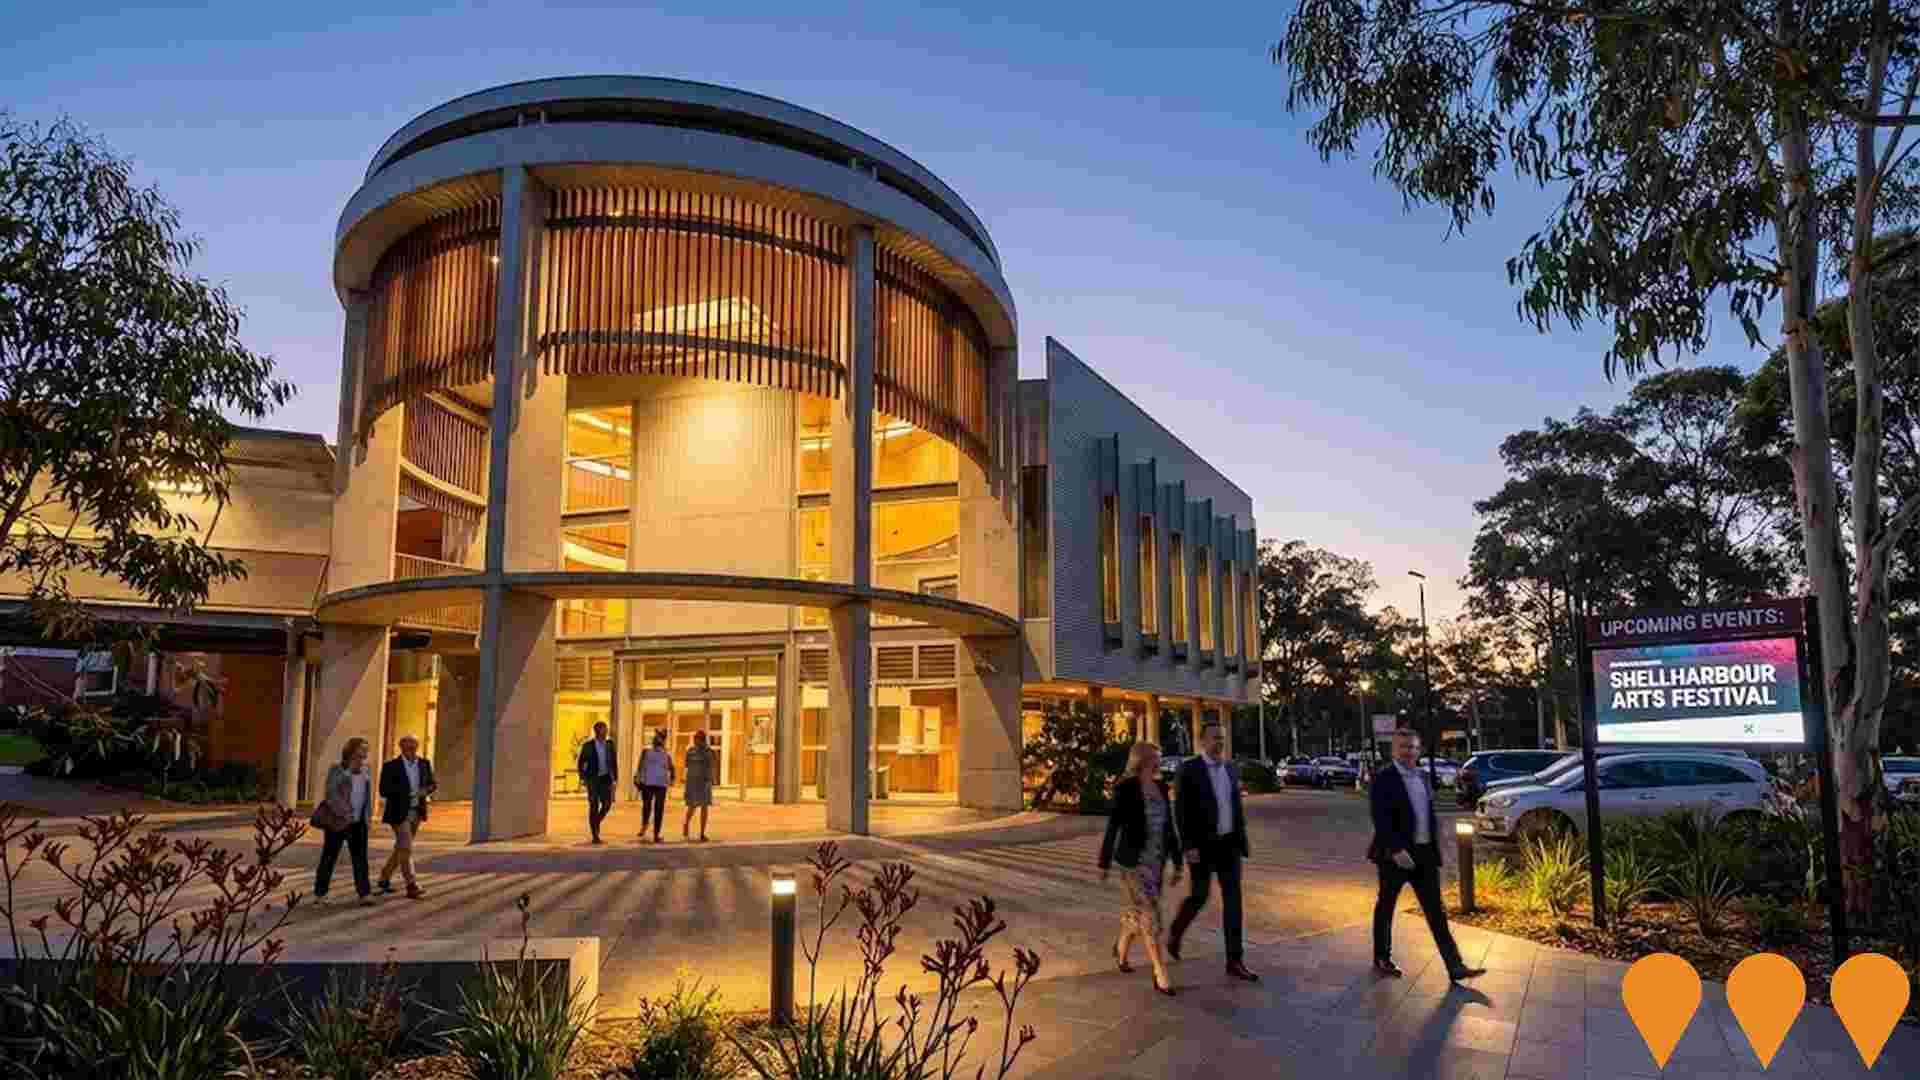
Performing Arts, Convention and Cultural Centre
Development of a state-of-the-art facility in Shellharbour Village planned as a regional creative hub. The facility is intended to be a distinctive landmark focusing on integrated technology for a modern, innovative experience, offering affordable and accessible creative spaces for emerging and established artists. It aims to enrich the community's cultural life, support convention activities, and promote Shellharbour Village as a tourist destination. The project is currently being advocated for by Shellharbour City Council as a priority project.
Shellharbour Mobile Tiny Homes Pilot Program
State-first two-year pilot program allowing mobile tiny homes on existing residential properties without development applications. Council approved September 23, 2025. Planning Proposal to amend Shellharbour LEP 2013 requires NSW Government approval and 28-day public consultation (up to 6 months process). Program provides affordable rental housing through moveable dwellings on trailers registered under Road Transport Act 2013, subject to strict conditions including minimum setbacks, connection to essential services, and fire safety compliance. Addresses housing crisis where median house price is $1 million.
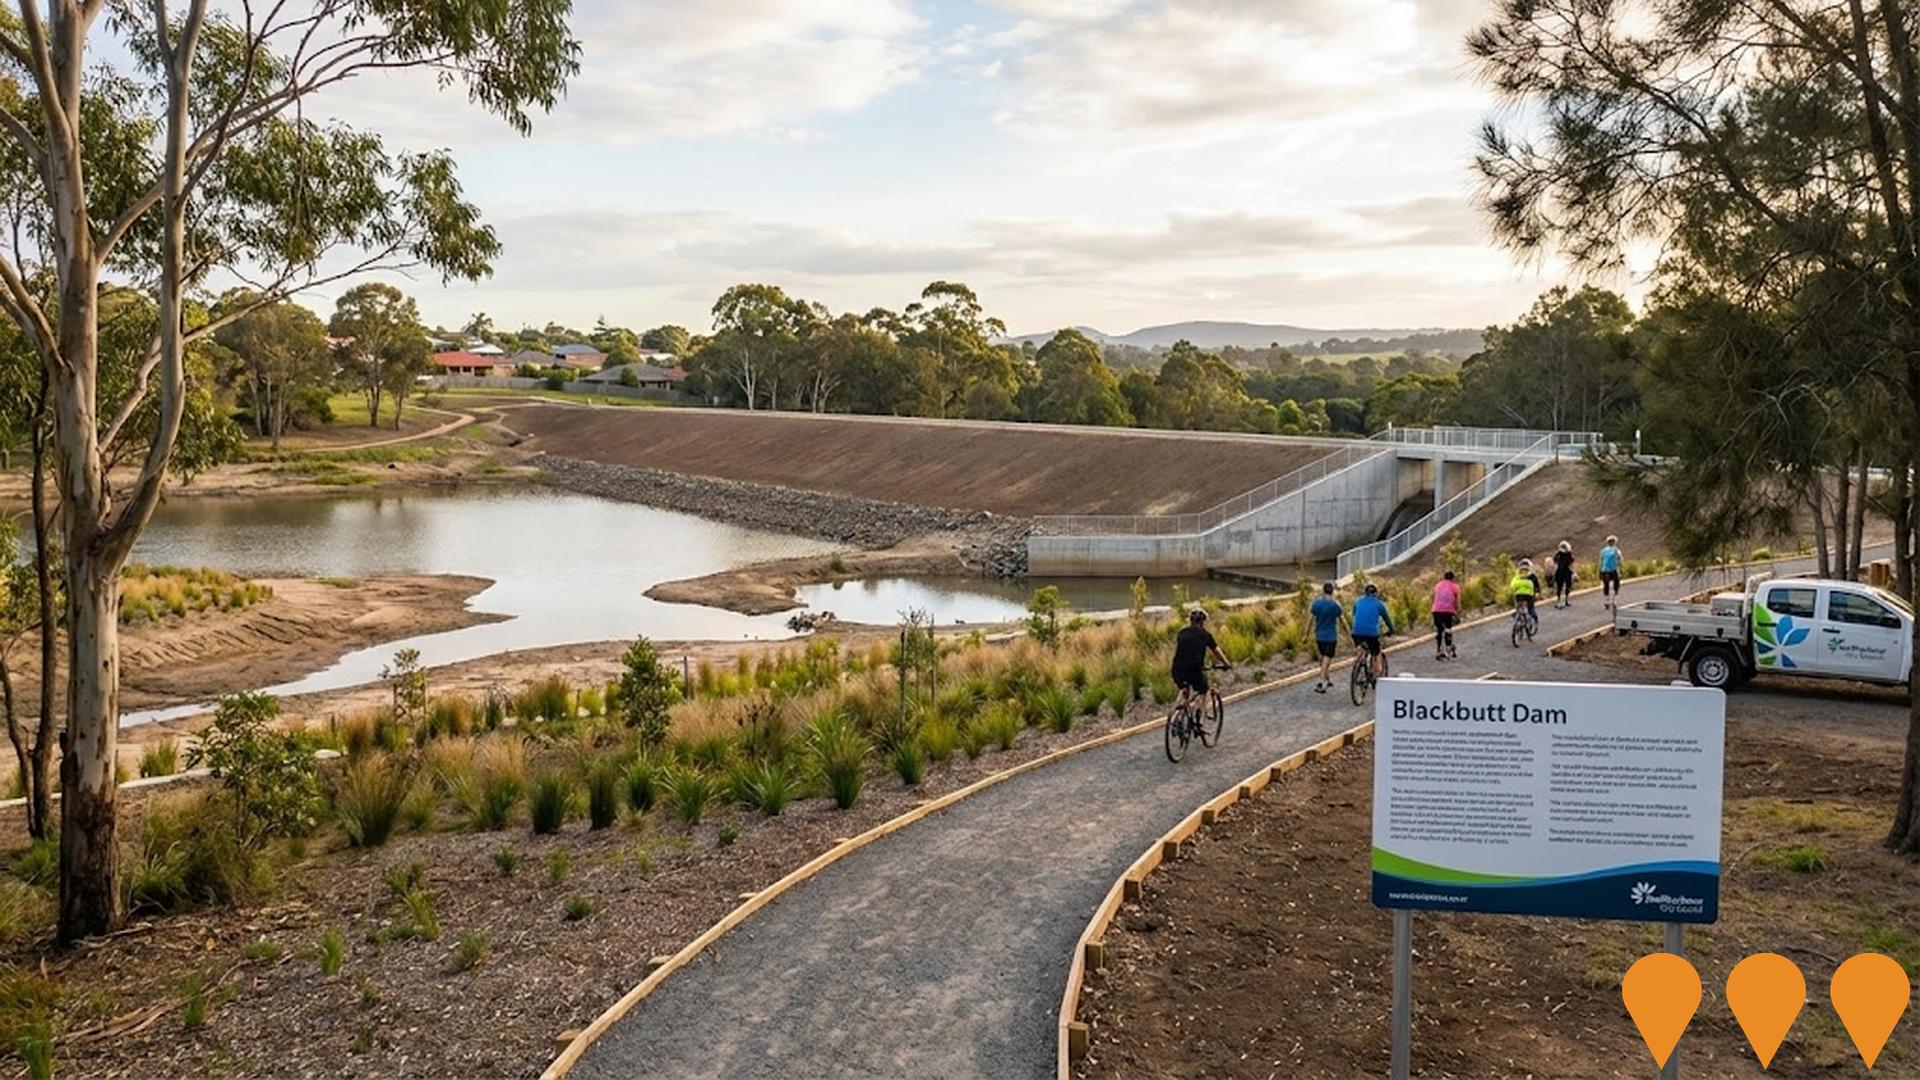
Blackbutt Dam Modification
Modifications to Blackbutt Dam by Shellharbour City Council, including lowering the water level, reconstructing the embankment and spillway, and site restoration. The project was undertaken to improve safety, meet compliance requirements from Dams Safety NSW, and resulted in the dam being de-prescribed as a declared dam in 2022. Final landscaping works were scheduled for Spring 2022.
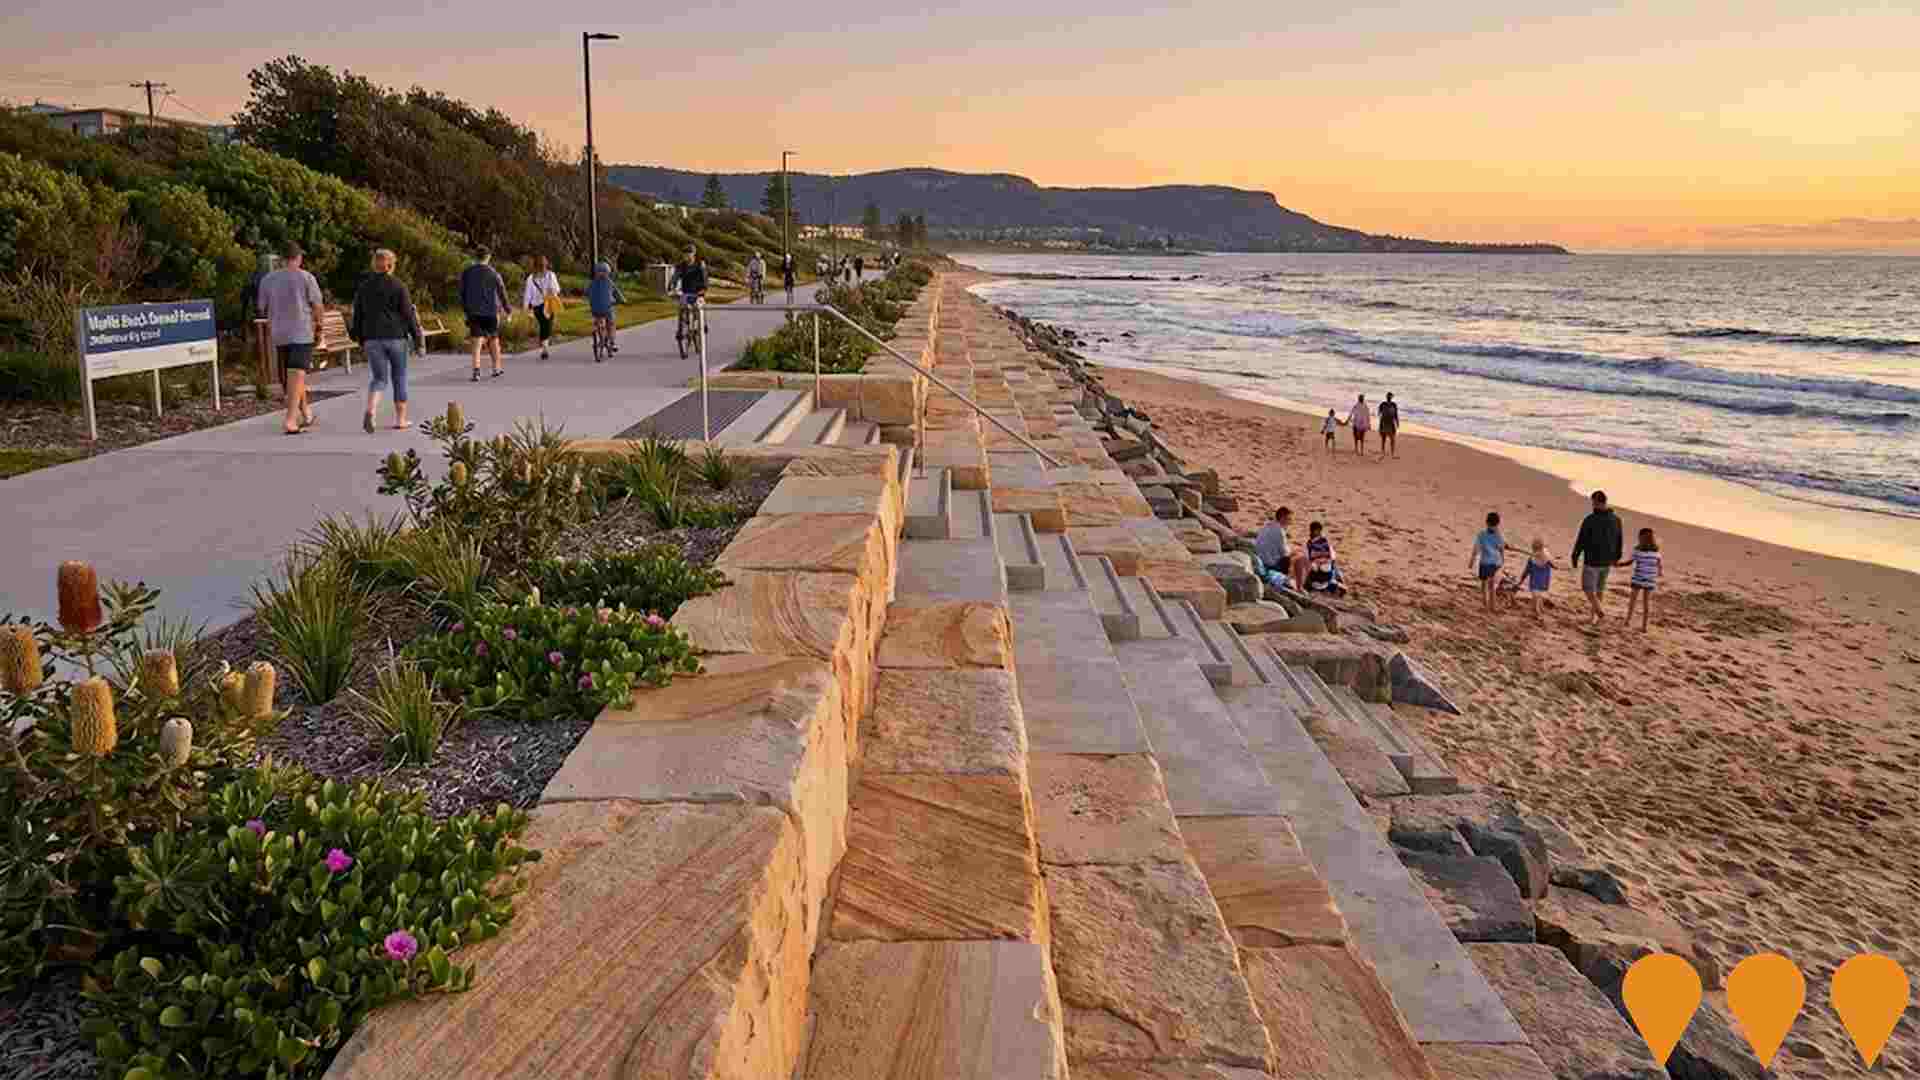
Warilla Beach Seawall Renewal
Rebuilding a 930-meter seawall to modern engineering standards to address coastal erosion and public safety, including improved beach access and landscaping.
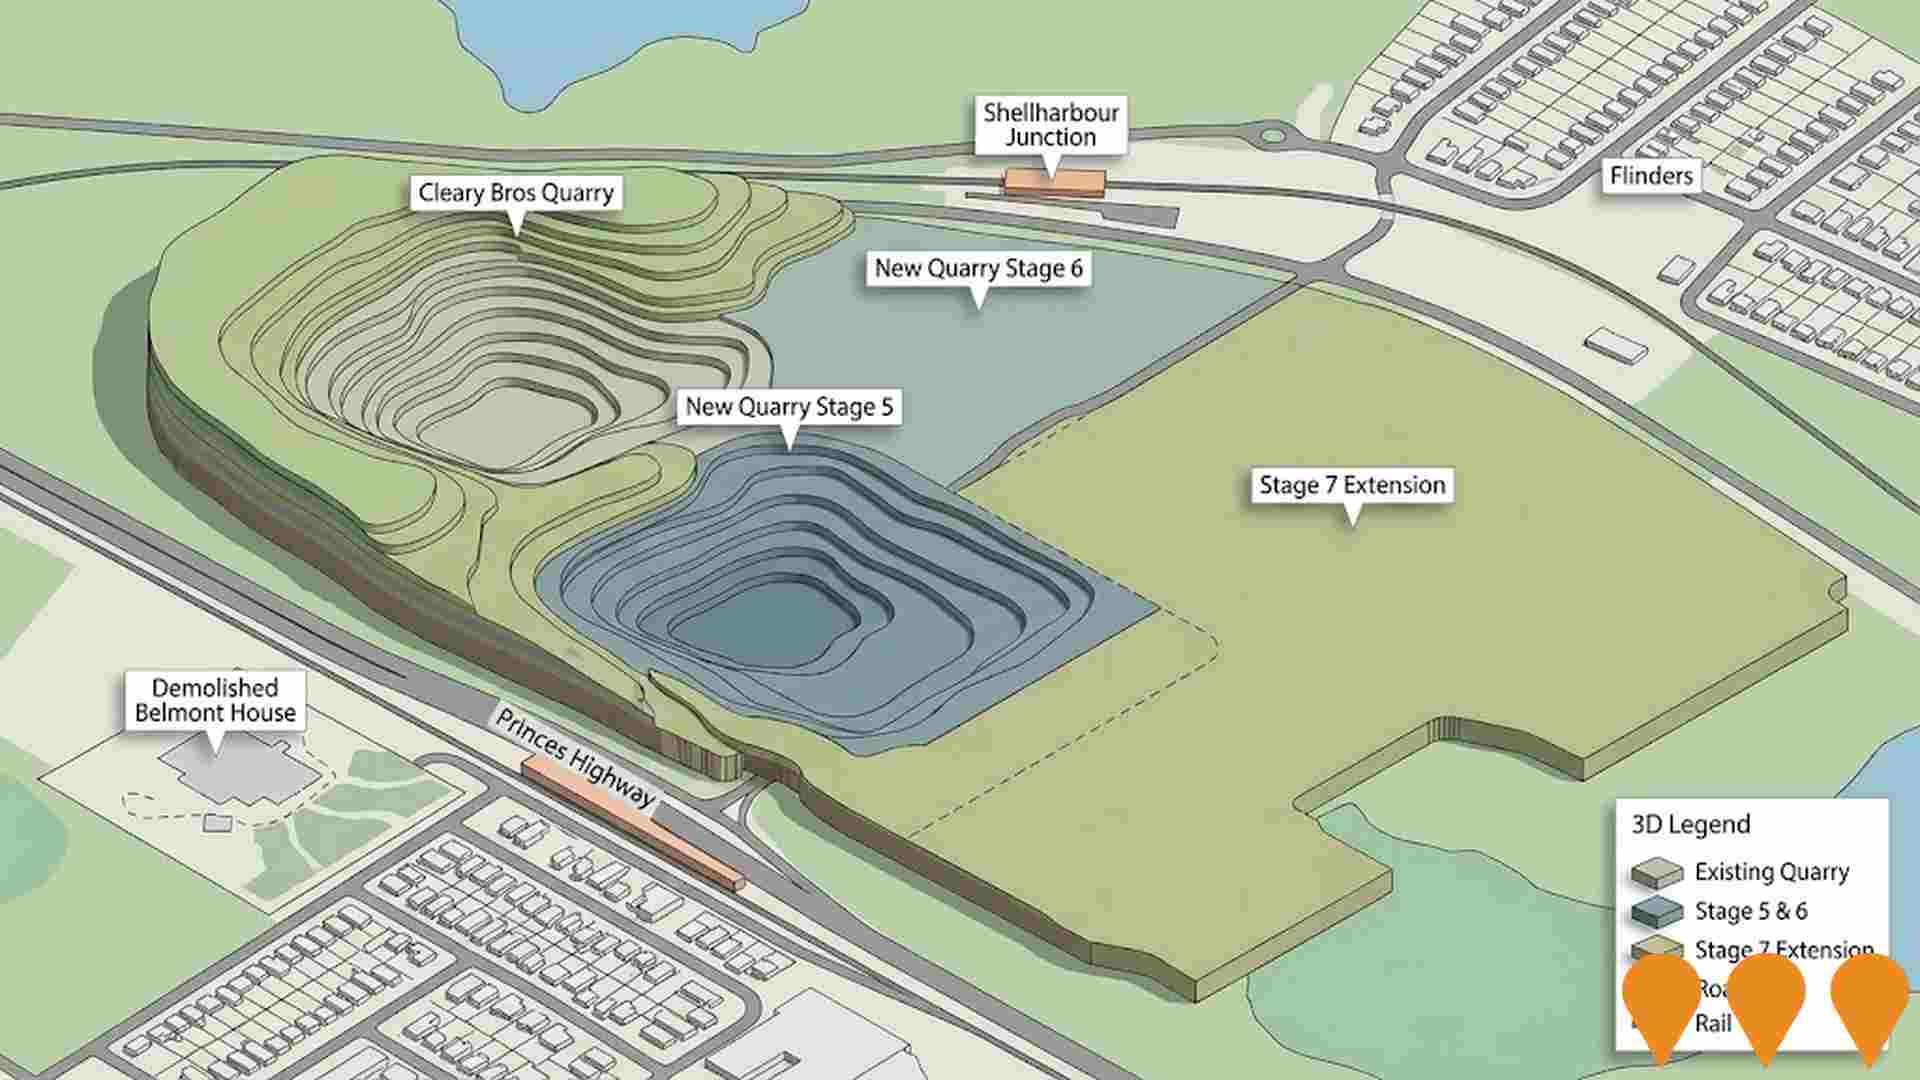
Albion Park Quarry Extraction Area Stage 7 Extension
A 30-year extension of the existing Albion Park Quarry extraction area, approved to secure approximately 33 million tonnes of hard rock resources for the Illawarra and Greater Sydney regions, ensuring continued supply for the construction industry. The project includes demolition of Belmont House and associated archaeological work, and construction of amenity barriers and tree screens.
Employment
Employment conditions in Warilla face significant challenges, ranking among the bottom 10% of areas assessed nationally
Warilla has a balanced workforce with white and blue collar jobs, well-represented essential services sectors. Unemployment rate was 14.4% in September 2025, with employment growth of 0.6% over the past year.
This is higher than Rest of NSW's unemployment rate of 3.8%. Out of 7,886 residents, 48.5% are participating in the workforce compared to Rest of NSW's 56.4%. Major industries include health care & social assistance, construction, retail trade. Construction has a significant presence with an employment share 1.4 times the regional level.
Agriculture, forestry & fishing has limited presence at 0.3% compared to the regional 5.3%. Employment opportunities seem limited locally as Census working population is lower than resident population. Over the past year, employment increased by 0.6%, labour force by 0.2%, reducing unemployment rate by 0.4 percentage points. In contrast, Rest of NSW saw employment fall by 0.5% and unemployment rise by 0.4 percentage points. State-level data to 25-Nov shows NSW employment contracted by 0.03%, with an unemployment rate of 3.9%. National unemployment rate is 4.3%. Jobs and Skills Australia projects national employment growth at 6.6% over five years and 13.7% over ten years, but growth varies between sectors. Applying these projections to Warilla's employment mix suggests local employment could increase by 6.5% over five years and 13.6% over ten years.
Frequently Asked Questions - Employment
Income
Income figures position the area below 75% of locations analysed nationally by AreaSearch
The Warilla SA2's median income among taxpayers was $48,348 in financial year 2022, according to latest ATO data aggregated by AreaSearch. The average income stood at $59,295 during the same period. This compares to figures for Rest of NSW which were $49,459 and $62,998 respectively. Based on Wage Price Index growth of 12.61% since financial year 2022, current estimates would be approximately $54,445 (median) and $66,772 (average) as of September 2025. Census data reveals that household, family and personal incomes in Warilla all fall between the 10th and 12th percentiles nationally. The earnings profile shows that 27.9% of the community (5,751 individuals) earn within the $1,500 - 2,999 range, reflecting patterns seen in metropolitan regions where similarly 29.9% occupy this range. Housing affordability pressures are severe, with only 79.8% of income remaining after housing costs, ranking at the 10th percentile.
Frequently Asked Questions - Income
Housing
Warilla is characterized by a predominantly suburban housing profile, with a higher proportion of rental properties than the broader region
Warilla's dwelling structure at the latest Census was 78.3% houses and 21.7% other dwellings (semi-detached, apartments, 'other' dwellings). Non-Metro NSW had a similar composition of 79.0% houses and 21.0% other dwellings. Home ownership in Warilla was 36.4%, with mortgaged dwellings at 25.9% and rented dwellings at 37.7%. The median monthly mortgage repayment in Warilla was $1,820, lower than Non-Metro NSW's average of $2,167. Median weekly rent in Warilla was $350, compared to Non-Metro NSW's $430. Nationally, Warilla's mortgage repayments were below the Australian average of $1,863 and rents were less than the national figure of $375.
Frequently Asked Questions - Housing
Household Composition
Warilla has a typical household mix, with a lower-than-average median household size
Family households constitute 68.3% of all households, including 23.6% couples with children, 25.7% couples without children, and 17.9% single parent families. Non-family households account for the remaining 31.7%, with lone person households at 29.2% and group households comprising 2.5%. The median household size is 2.4 people, which is smaller than the Rest of NSW average of 2.6.
Frequently Asked Questions - Households
Local Schools & Education
Warilla faces educational challenges, with performance metrics placing it in the bottom quartile of areas assessed nationally
The area's university qualification rate is 11.3%, significantly lower than the NSW average of 32.2%. This presents both a challenge and an opportunity for targeted educational initiatives. Bachelor degrees are the most prevalent at 8.1%, followed by postgraduate qualifications (1.9%) and graduate diplomas (1.3%). Trade and technical skills are prominent, with 41.6% of residents aged 15+ holding vocational credentials - advanced diplomas (9.5%) and certificates (32.1%).
Educational participation is high, with 27.1% of residents currently enrolled in formal education. This includes 10.1% in primary education, 7.6% in secondary education, and 2.5% pursuing tertiary education.
Frequently Asked Questions - Education
Schools Detail
Nearby Services & Amenities
Transport
Transport servicing is moderate compared to other areas nationally based on assessment of service frequency, route connectivity and accessibility
Warilla has 181 active public transport stops, all of which are bus stops. These stops are served by 48 different routes that together facilitate 892 weekly passenger trips. The accessibility of the transport system is rated as excellent, with residents on average located just 124 meters from their nearest stop.
Across all routes, buses run an average of 127 times per day, which works out to approximately four weekly trips per individual stop.
Frequently Asked Questions - Transport
Transport Stops Detail
Health
Health performance in Warilla is well below average with prevalence of common health conditions notable across both younger and older age cohorts
Warilla faces significant health challenges, as indicated by its health data. Both younger and older age groups have a notable prevalence of common health conditions. Private health cover is relatively low, with approximately 49% of Warilla's total population (~10,121 people) having it, compared to 52.7% in the rest of NSW and the national average of 55.3%.
The most prevalent medical conditions are arthritis (11.5%) and mental health issues (10.5%), with 59.8% of residents reporting no medical ailments, compared to 65.2% in the rest of NSW. Warilla has a higher proportion of seniors aged 65 and over, at 23.1% (4,759 people), than the rest of NSW at 20.9%. Health outcomes among seniors present challenges broadly aligned with the general population's health profile.
Frequently Asked Questions - Health
Cultural Diversity
In terms of cultural diversity, Warilla records figures broadly comparable to the national average, as found in AreaSearch's assessment of a number of language and cultural background related metrics
Warilla's cultural diversity aligns with its wider region, with 80.7% born in Australia, 88.8% being citizens, and 88.6% speaking English only at home. Christianity is the predominant religion in Warilla at 56.5%, compared to 57.3% across Rest of NSW. The top three ancestral groups are English (28.3%), Australian (28.0%), and Scottish (6.4%).
Notably, Spanish (1.3%) and Macedonian (2.1%) are overrepresented in Warilla compared to regional averages of 1.0% and 1.9%, respectively. Welsh representation is also higher at 0.8%.
Frequently Asked Questions - Diversity
Age
Warilla's median age exceeds the national pattern
Warilla's median age is 42 years, similar to Rest of NSW's average of 43 but older than Australia's 38 years. The age profile shows that those aged 25-34 are prominent at 12.5%, while the 45-54 group is smaller at 10.8% compared to Rest of NSW. Between 2021 and present, the 25-34 age group has grown from 11.6% to 12.5%. Conversely, the 45-54 cohort has declined from 12.1% to 10.8%, and the 55-64 group has dropped from 13.6% to 12.5%. Population forecasts for 2041 indicate substantial demographic changes in Warilla, with the 25-34 cohort projected to grow by 17%, adding 440 residents to reach 3,009. Meanwhile, population declines are projected for the 45-54 and 65-74 cohorts.
