Chart Color Schemes
This analysis uses ABS Statistical Areas Level 2 (SA2) boundaries, which can materially differ from Suburbs and Localities (SAL) even when sharing similar names.
SA2 boundaries are defined by the Australian Bureau of Statistics and are designed to represent communities for statistical reporting (e.g., census and ERP).
Suburbs and Localities (SAL) represent commonly-used suburb/locality names (postal-style areas) and may use different geographic boundaries. For comprehensive analysis, consider reviewing both boundary types if available.
est. as @ -- *
ABS ERP | -- people | --
2021 Census | -- people
Sales Activity
Curious about local property values? Filter the chart to assess the volume and appreciation (including resales) trends and regional comparisons, or scroll to the map below view this information at an individual property level.
Find a Recent Sale
Sales Detail
Population
An assessment of population growth drivers in Wangi Wangi - Rathmines reveals an overall ranking slightly below national averages considering recent, and medium term trends
Wangi Wangi - Rathmines' population, as of November 2025, is approximately 9,643, indicating a rise of 176 individuals (1.9%) since the 2021 Census which recorded a population of 9,467. This increase is inferred from ABS' June 2024 estimate of 9,633 and 38 new addresses validated post-Census. The population density stands at 732 persons per square kilometer, aligning with averages found in AreaSearch's assessments. Overseas migration drove recent growth, contributing about 52.9% of total gains, although all factors including natural growth and interstate migration were positive. AreaSearch uses ABS/Geoscience Australia projections for each SA2 area, released in 2024 with a 2022 base year.
For uncovered areas, NSW State Government's SA2 level projections from 2022 (base year: 2021) are employed. Growth rates by age group are applied to all areas for years 2032 to 2041. By 2041, the area is projected to expand by 69 persons, reflecting a total increase of 0.6% over 17 years.
Frequently Asked Questions - Population
Development
Residential development activity is lower than average in Wangi Wangi - Rathmines according to AreaSearch's national comparison of local real estate markets
Wangi Wangi - Rathmines has seen approximately 24 new homes approved annually. Over the past five financial years, from FY-21 to FY-25, around 123 homes were approved, with an additional 22 approved in FY-26 so far. On average, each dwelling built over these years has resulted in about 2.4 new residents per year, indicating strong demand that supports property values.
New homes are being constructed at an average expected cost of $414,000, slightly above the regional average, suggesting a focus on quality developments. This financial year has seen $11.9 million in commercial approvals registered, demonstrating moderate levels of commercial development. Compared to the Rest of NSW, Wangi Wangi - Rathmines has significantly less development activity, with 71.0% below the regional average per person. This scarcity typically strengthens demand and prices for existing properties. Nationally, this area also reflects below-average development activity, which may indicate maturity or possible planning constraints.
The majority of new building activity consists of standalone homes (95.0%), with only 5.0% being medium to high-density housing. This maintains the area's traditional low-density character and appeals to those seeking family homes with space. The estimated population per dwelling approval is around 467 people, reflecting its quiet development environment. Population forecasts indicate that Wangi Wangi - Rathmines will gain approximately 58 residents by 2041, according to the latest AreaSearch quarterly estimate. At current development rates, new housing supply should comfortably meet demand, providing good conditions for buyers and potentially supporting growth beyond current population projections.
Frequently Asked Questions - Development
Infrastructure
Wangi Wangi - Rathmines has moderate levels of nearby infrastructure activity, ranking in the top 50% nationally
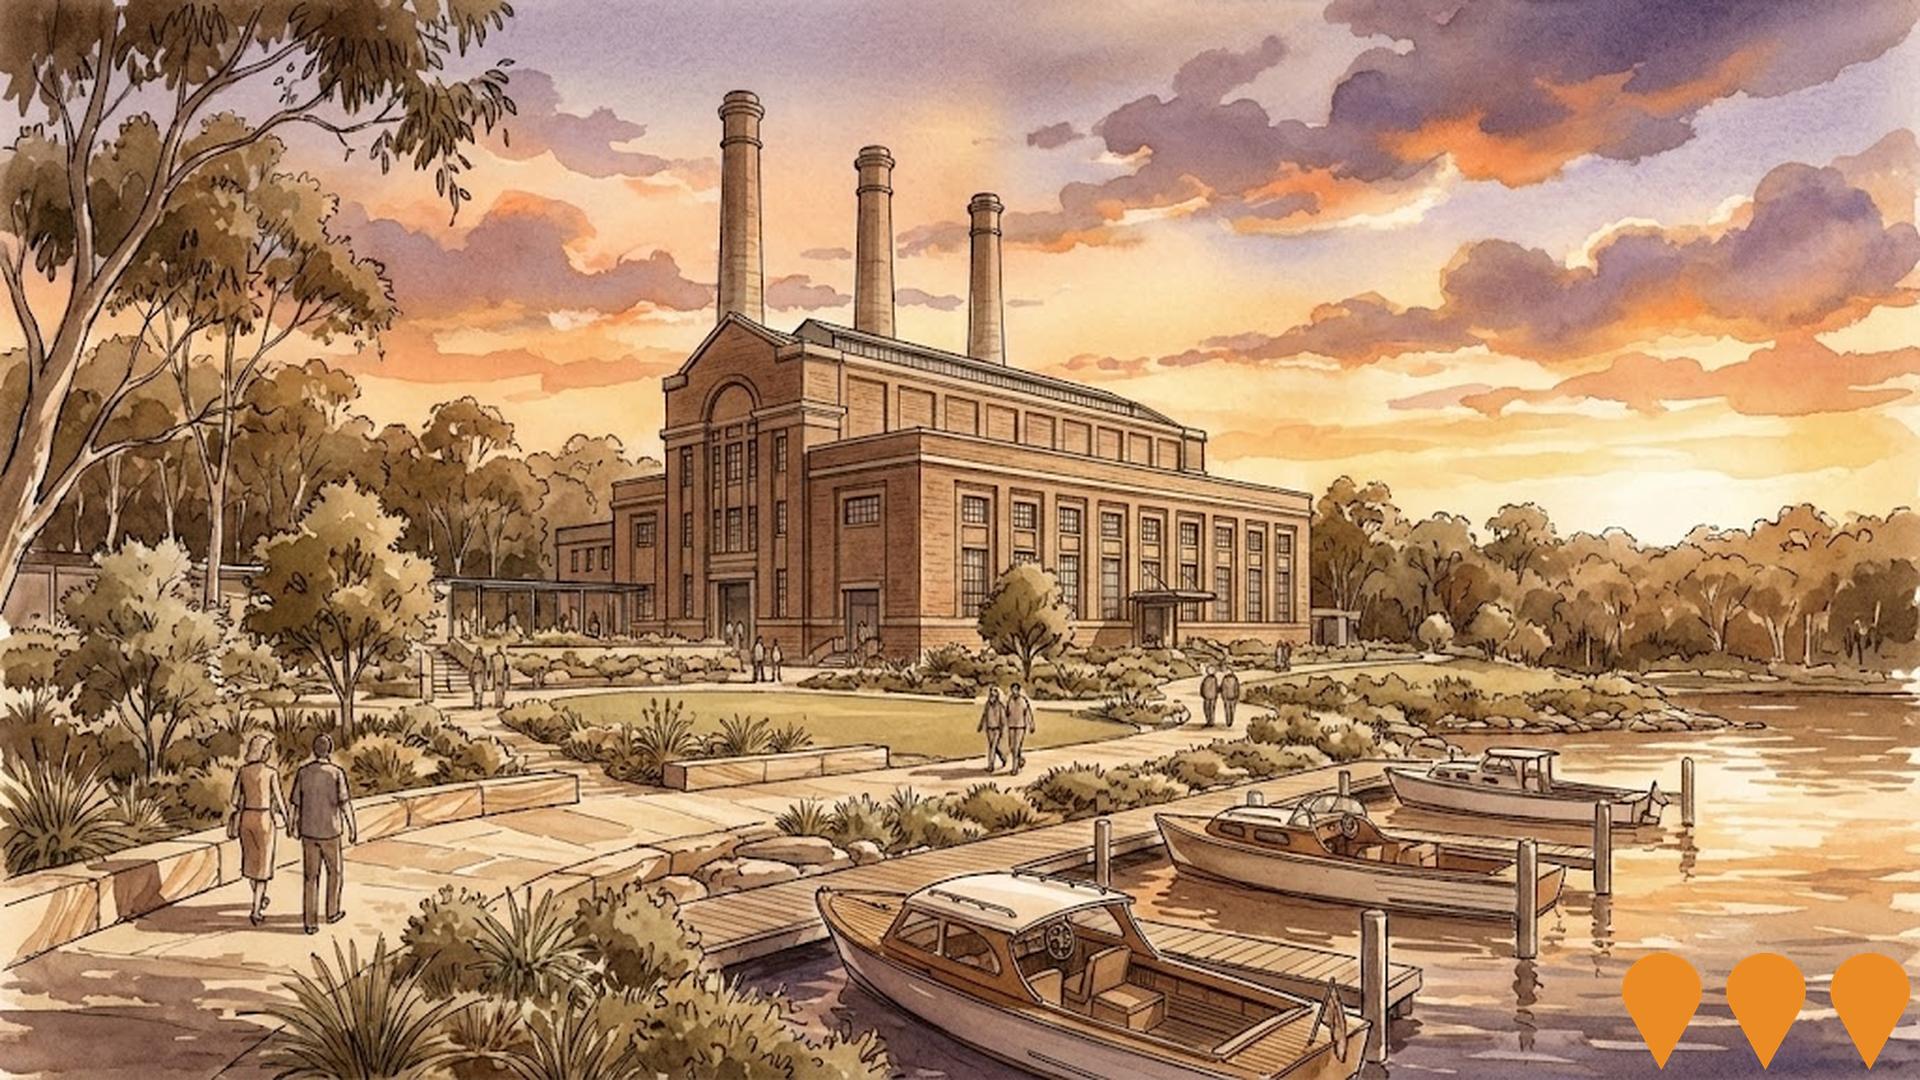
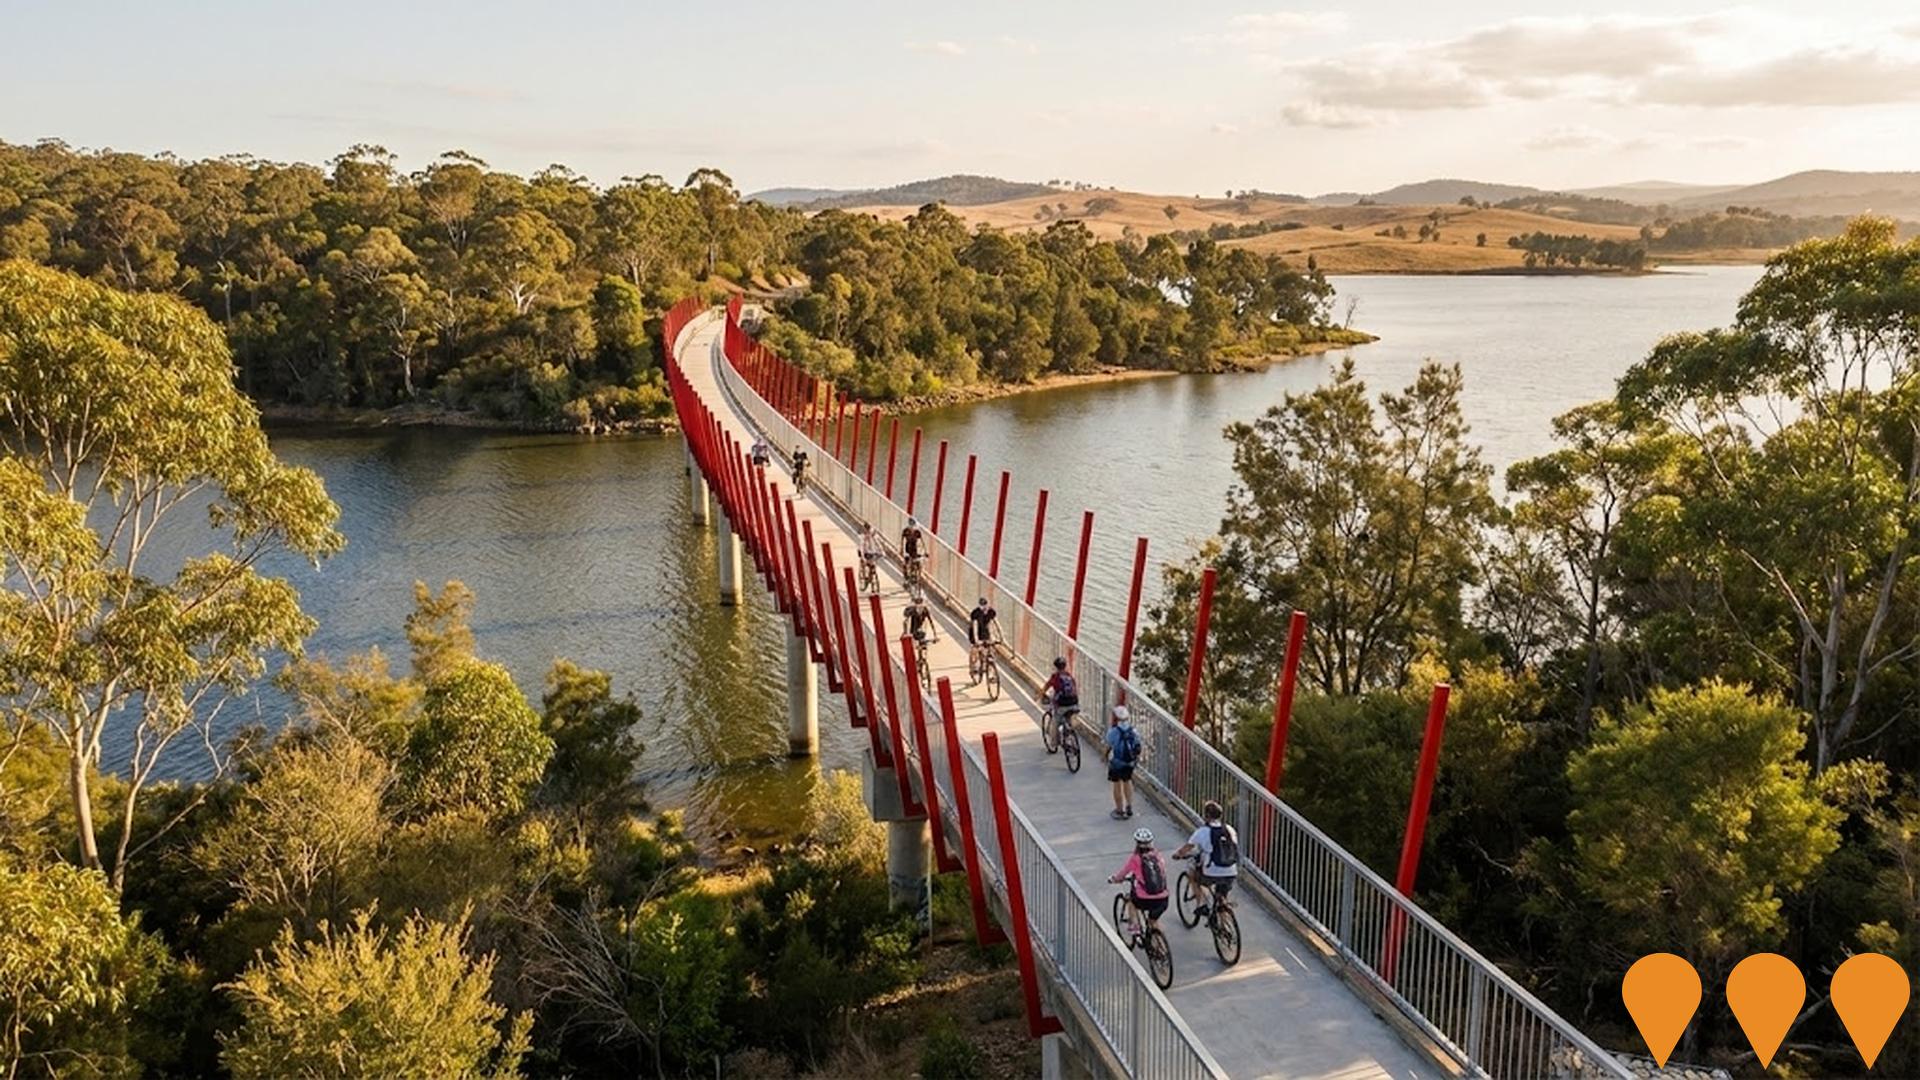
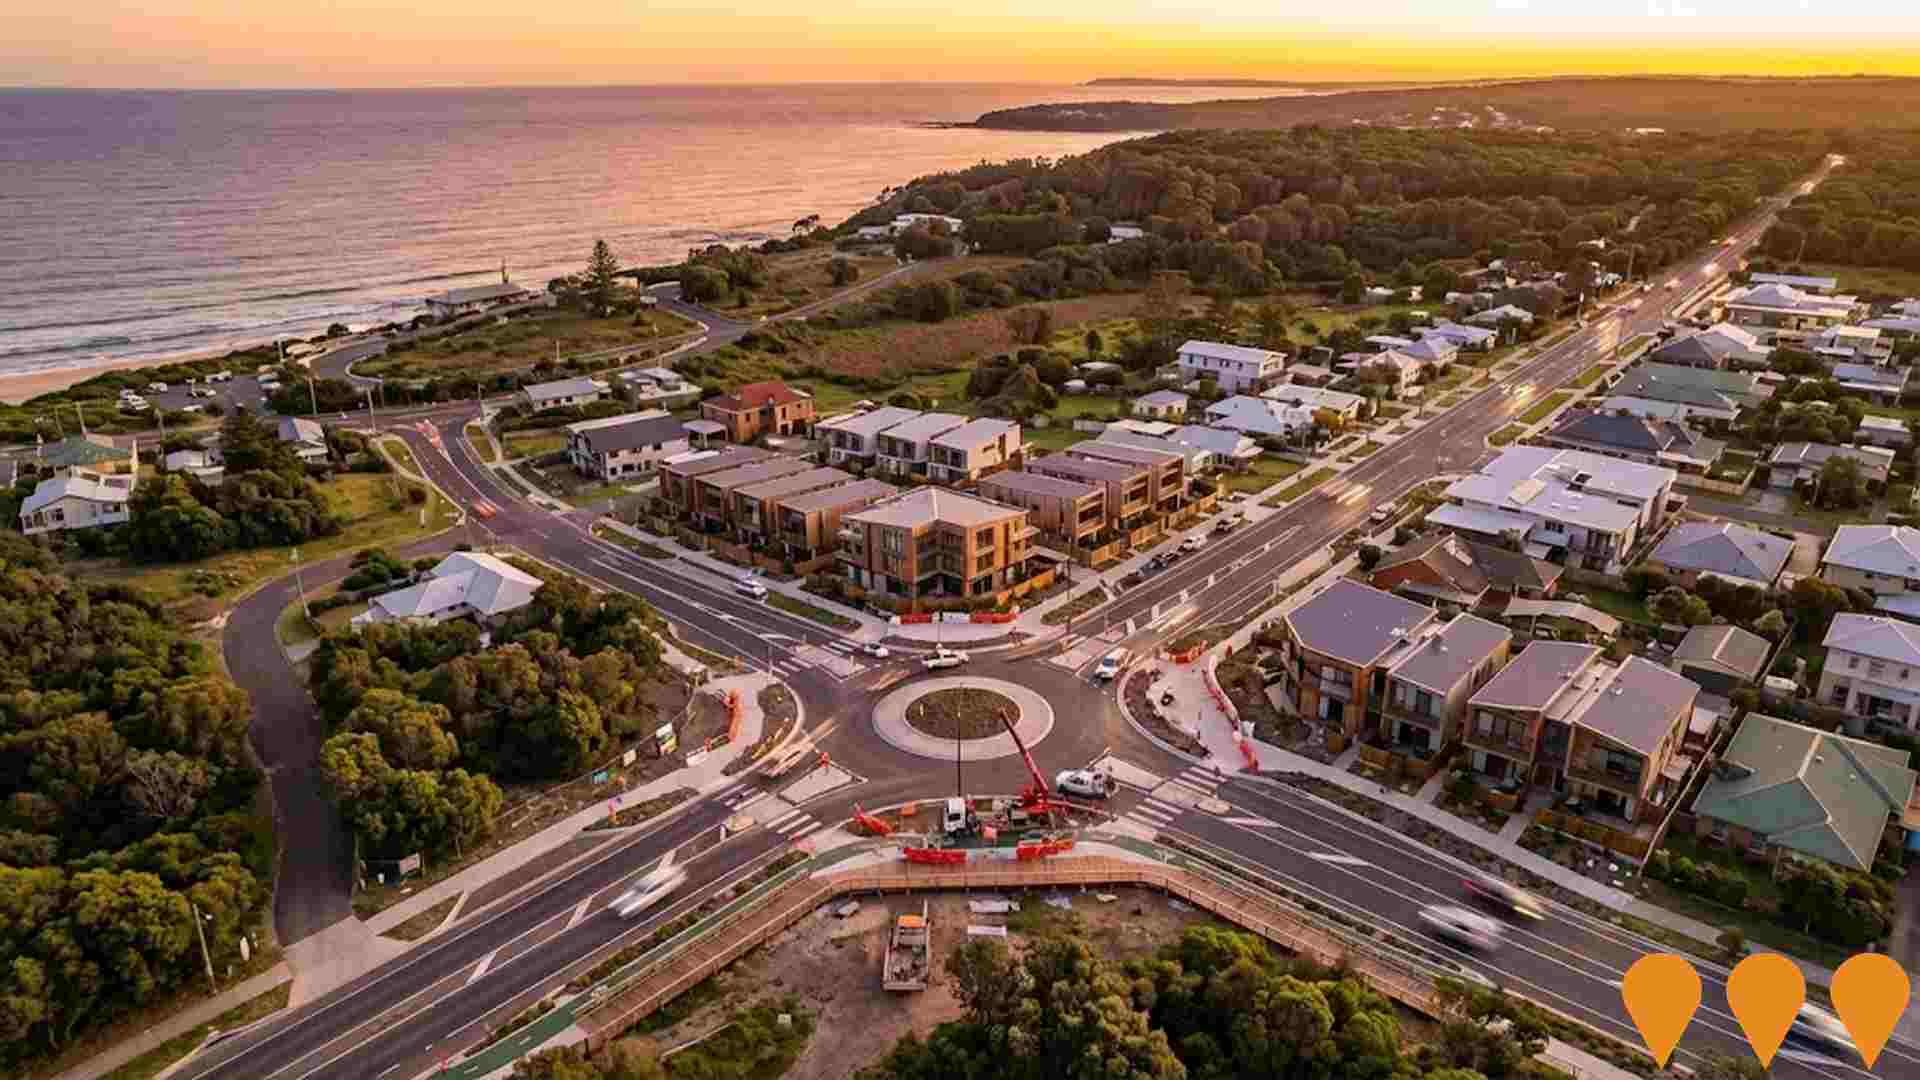
Changes in local infrastructure significantly impact an area's performance. AreaSearch has identified seven projects that could affect this region. Notable ones include Wangi Shores Retirement Village - Stage 3B Block K, Wangi Power Station Redevelopment, 1 Kent Place, Wangi Wangi - a three-storey apartment building with thirteen residences, and Rathmines Park Transformation. The following list details those most likely to be relevant.
Professional plan users can use the search below to filter and access additional projects.
INFRASTRUCTURE SEARCH
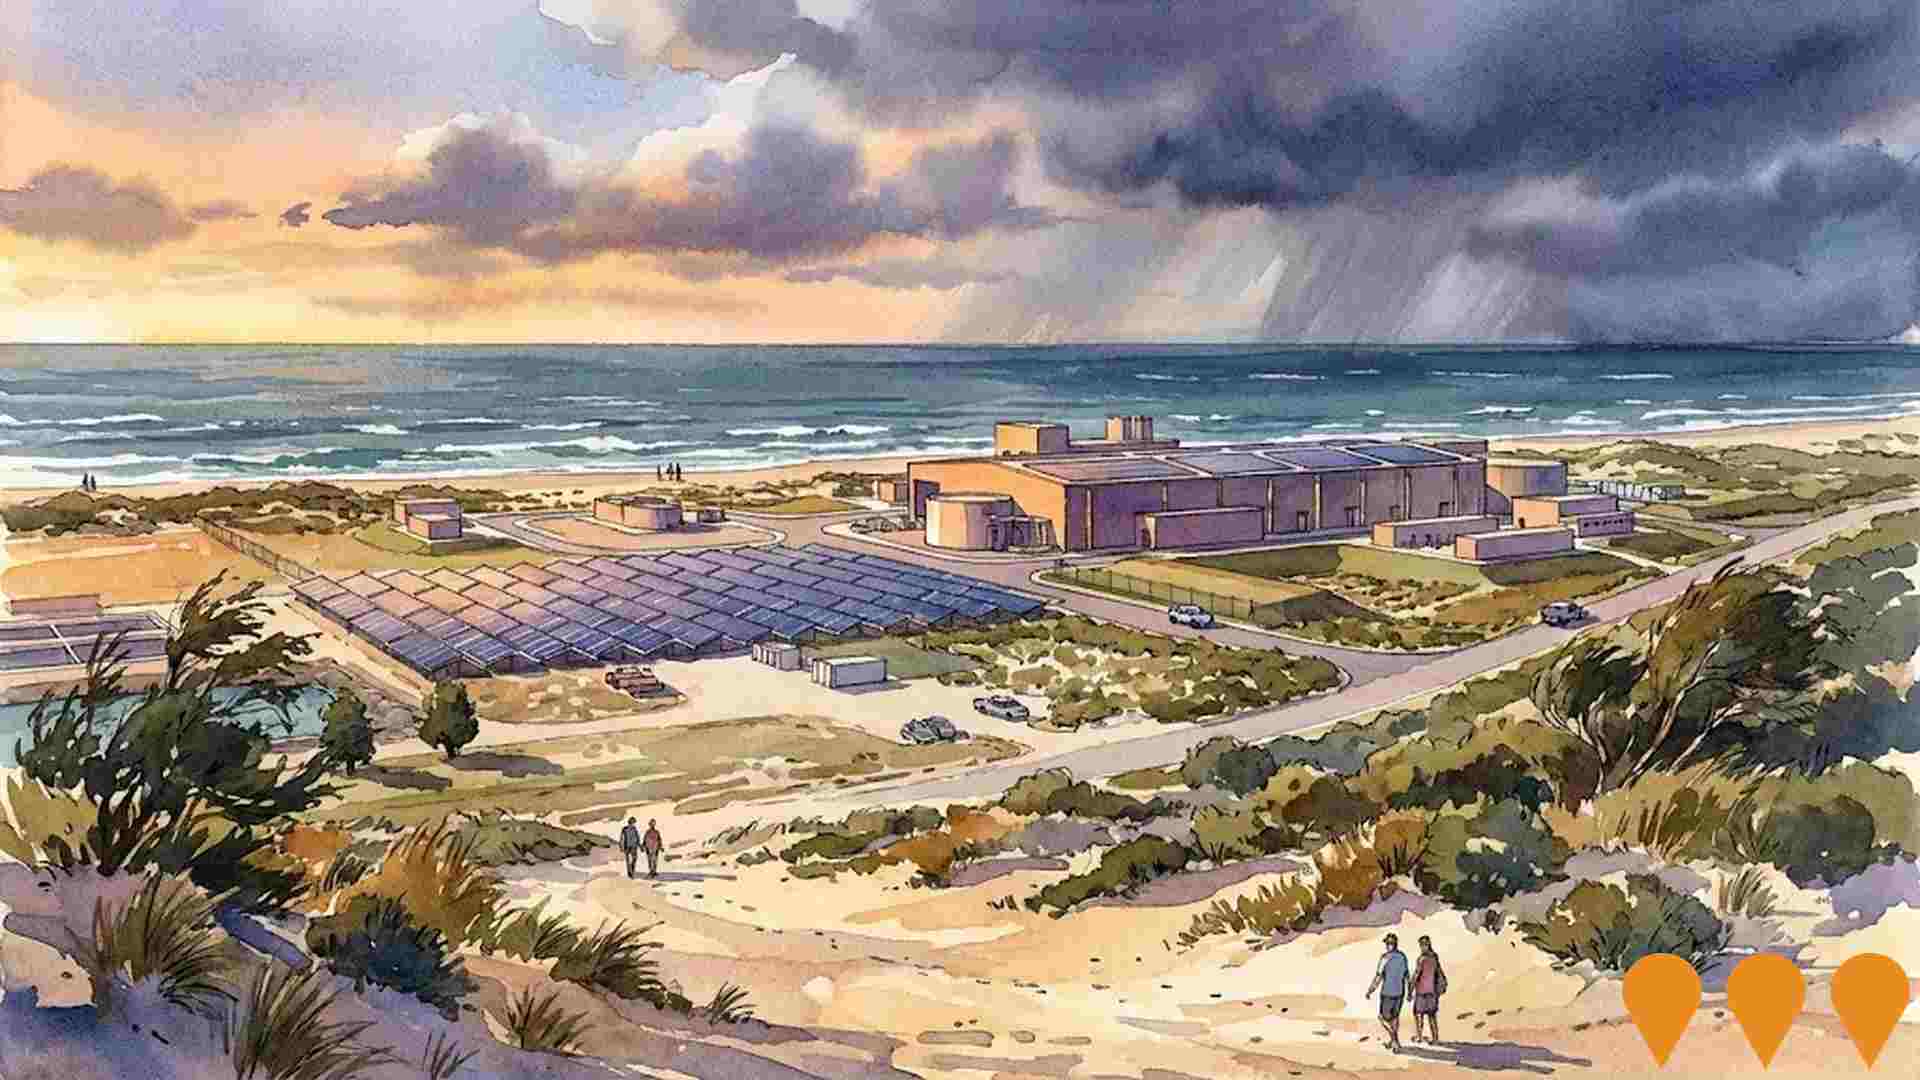
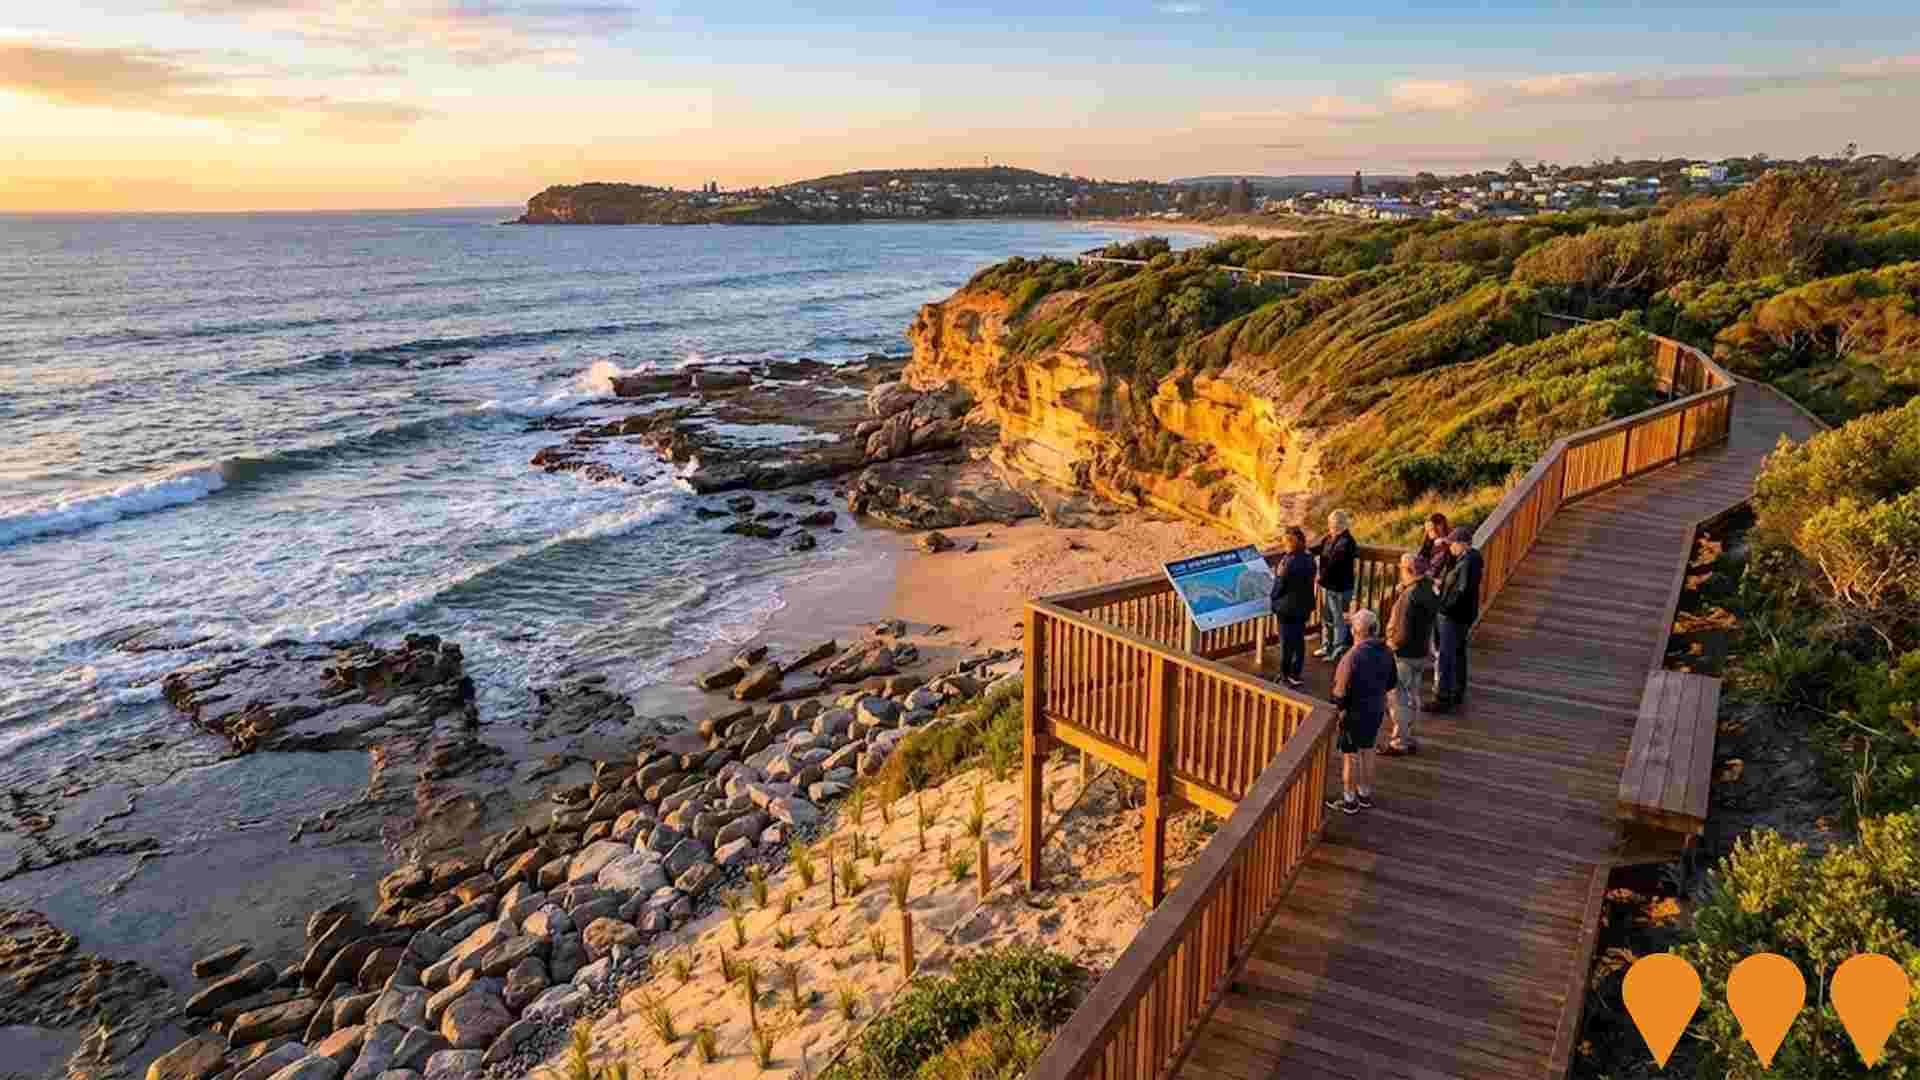
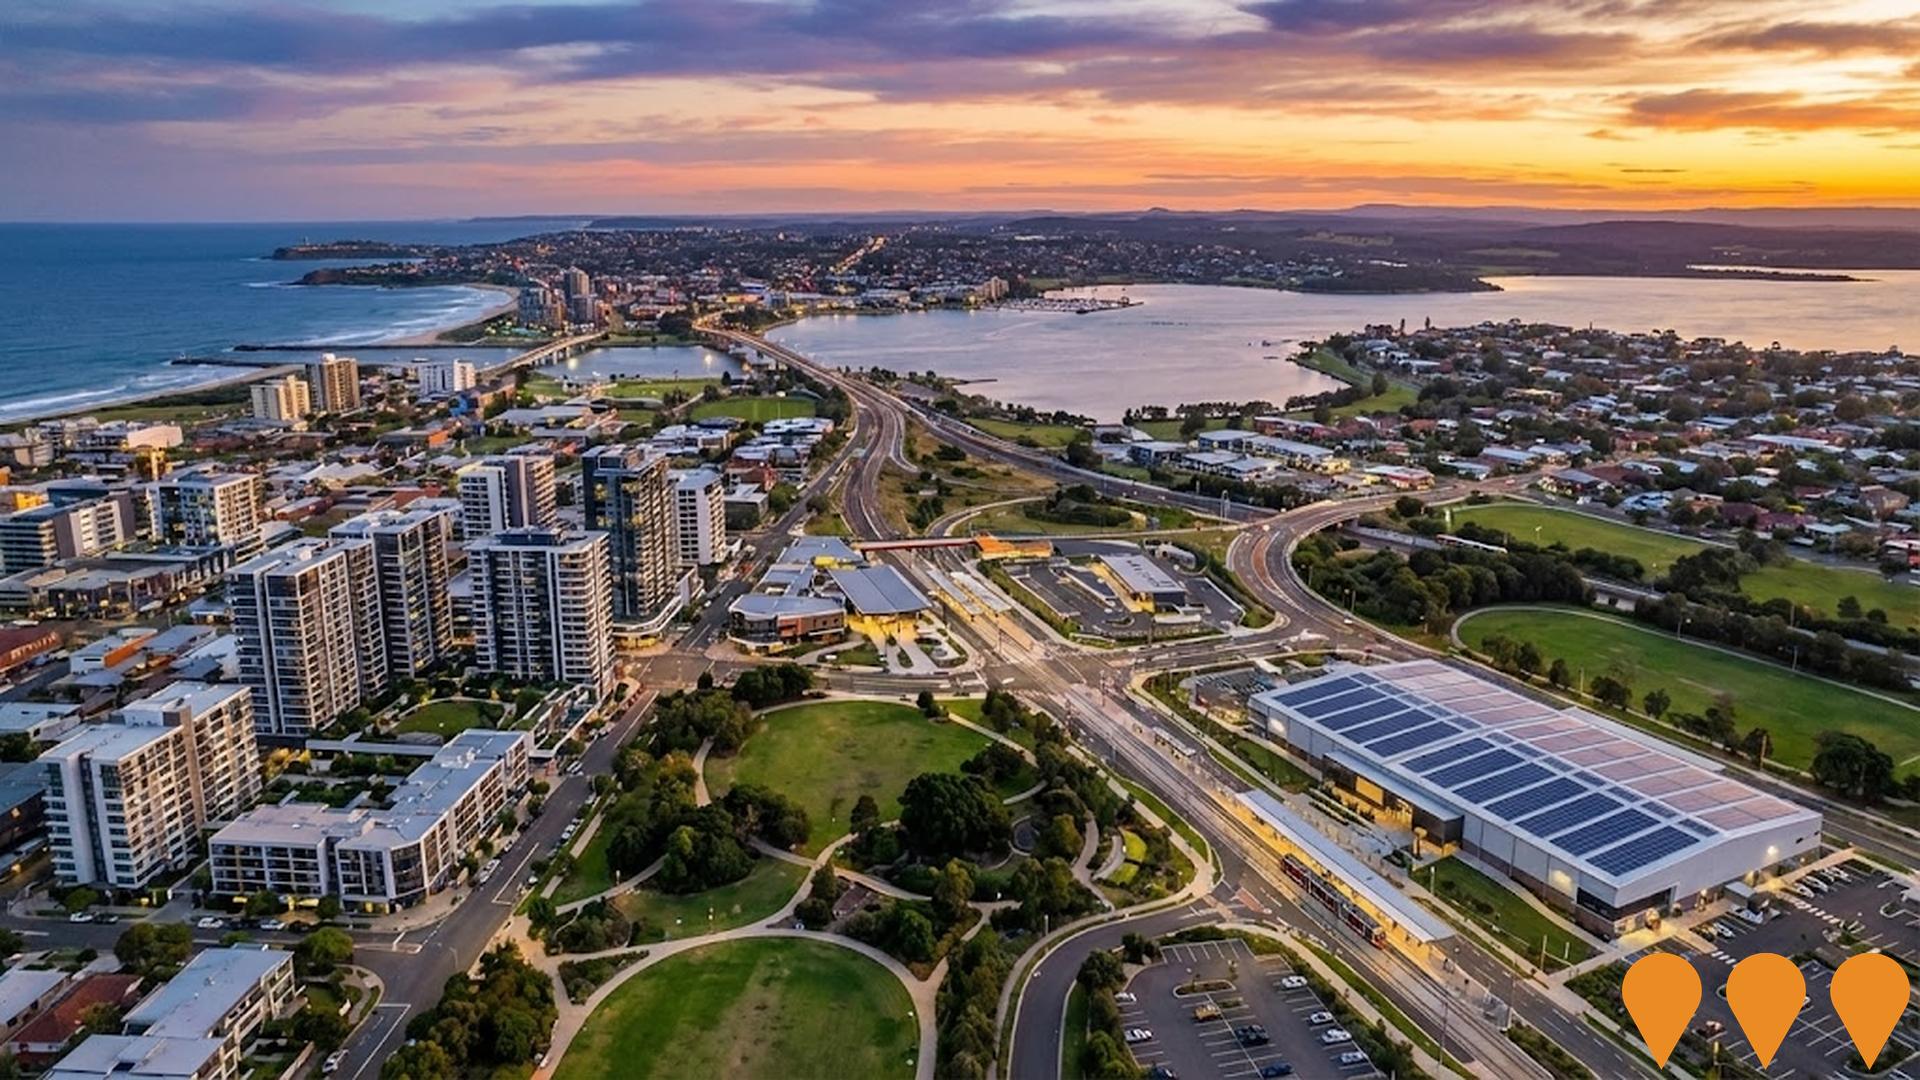
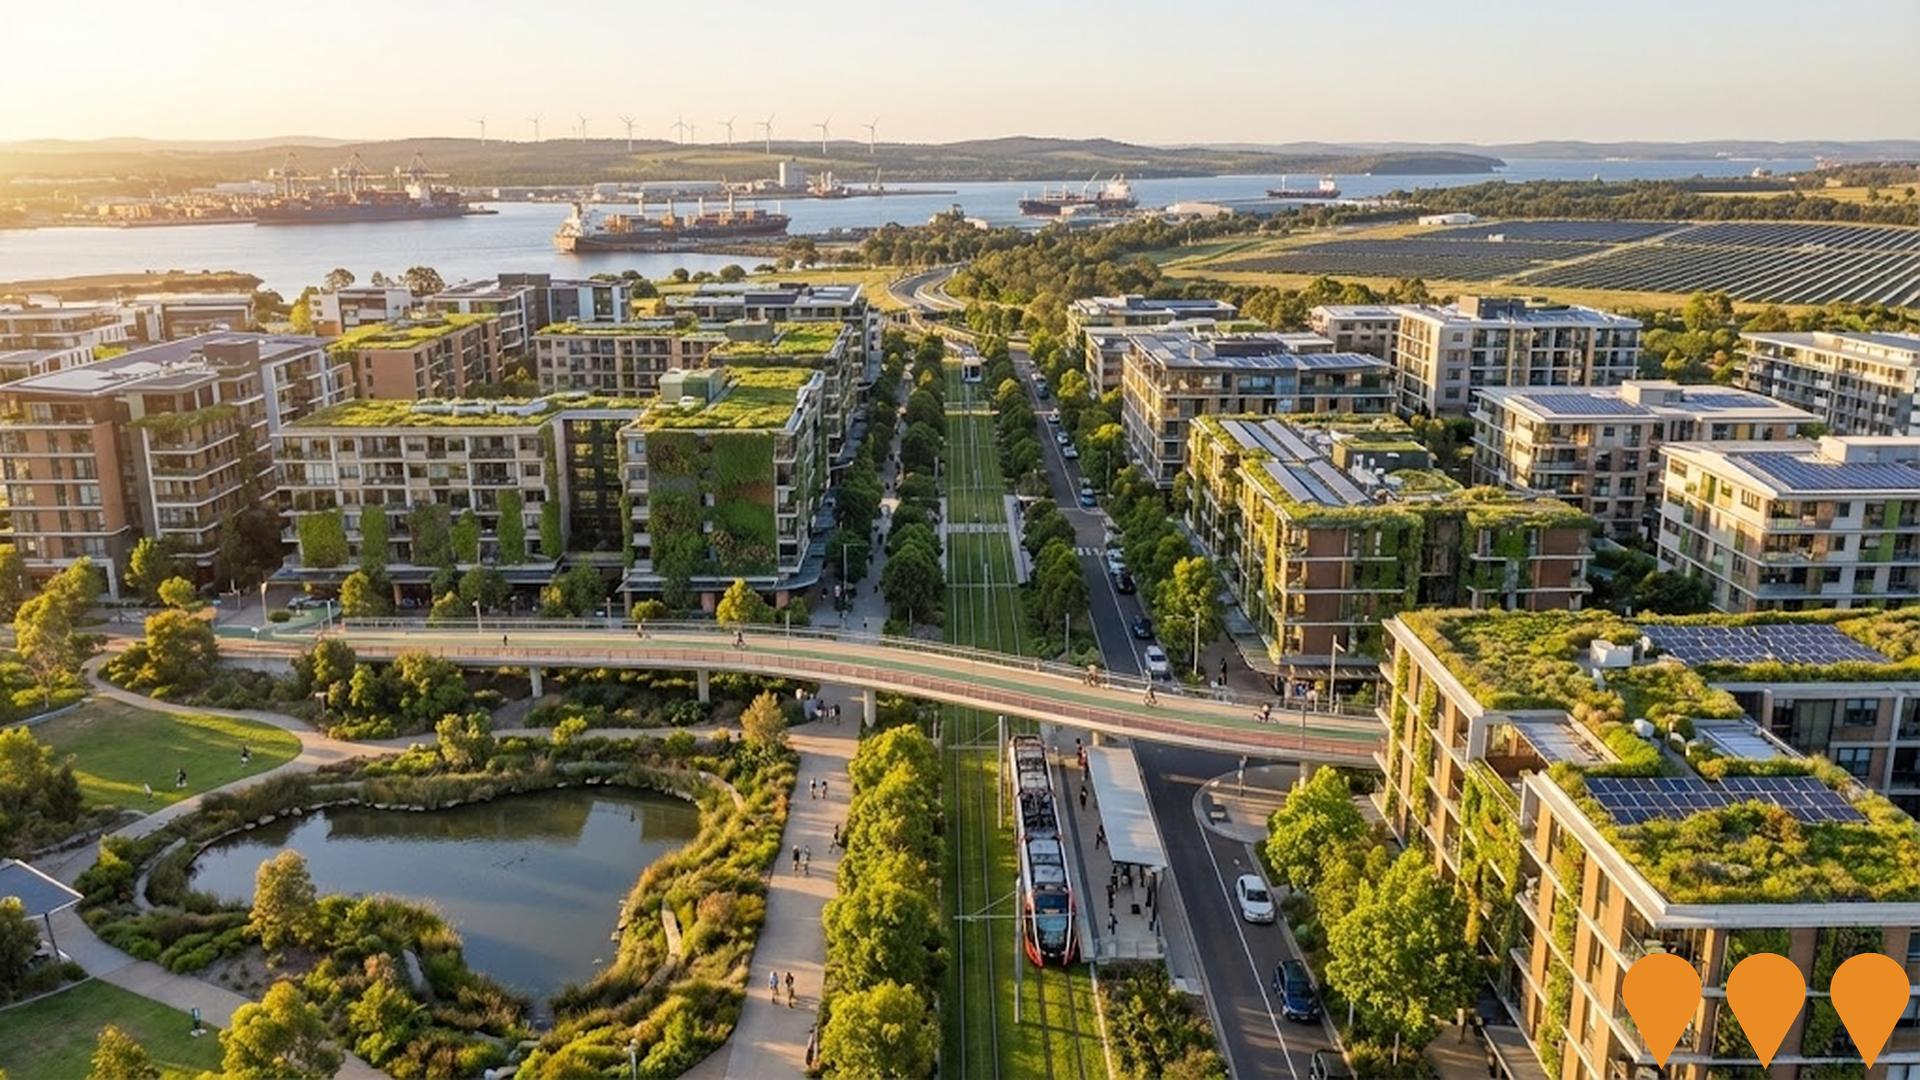
 Denotes AI-based impression for illustrative purposes only, not to be taken as definitive under any circumstances. Please follow links and conduct other investigations from the project's source for actual imagery. Developers and project owners wishing us to use original imagery please Contact Us and we will do so.
Frequently Asked Questions - Infrastructure
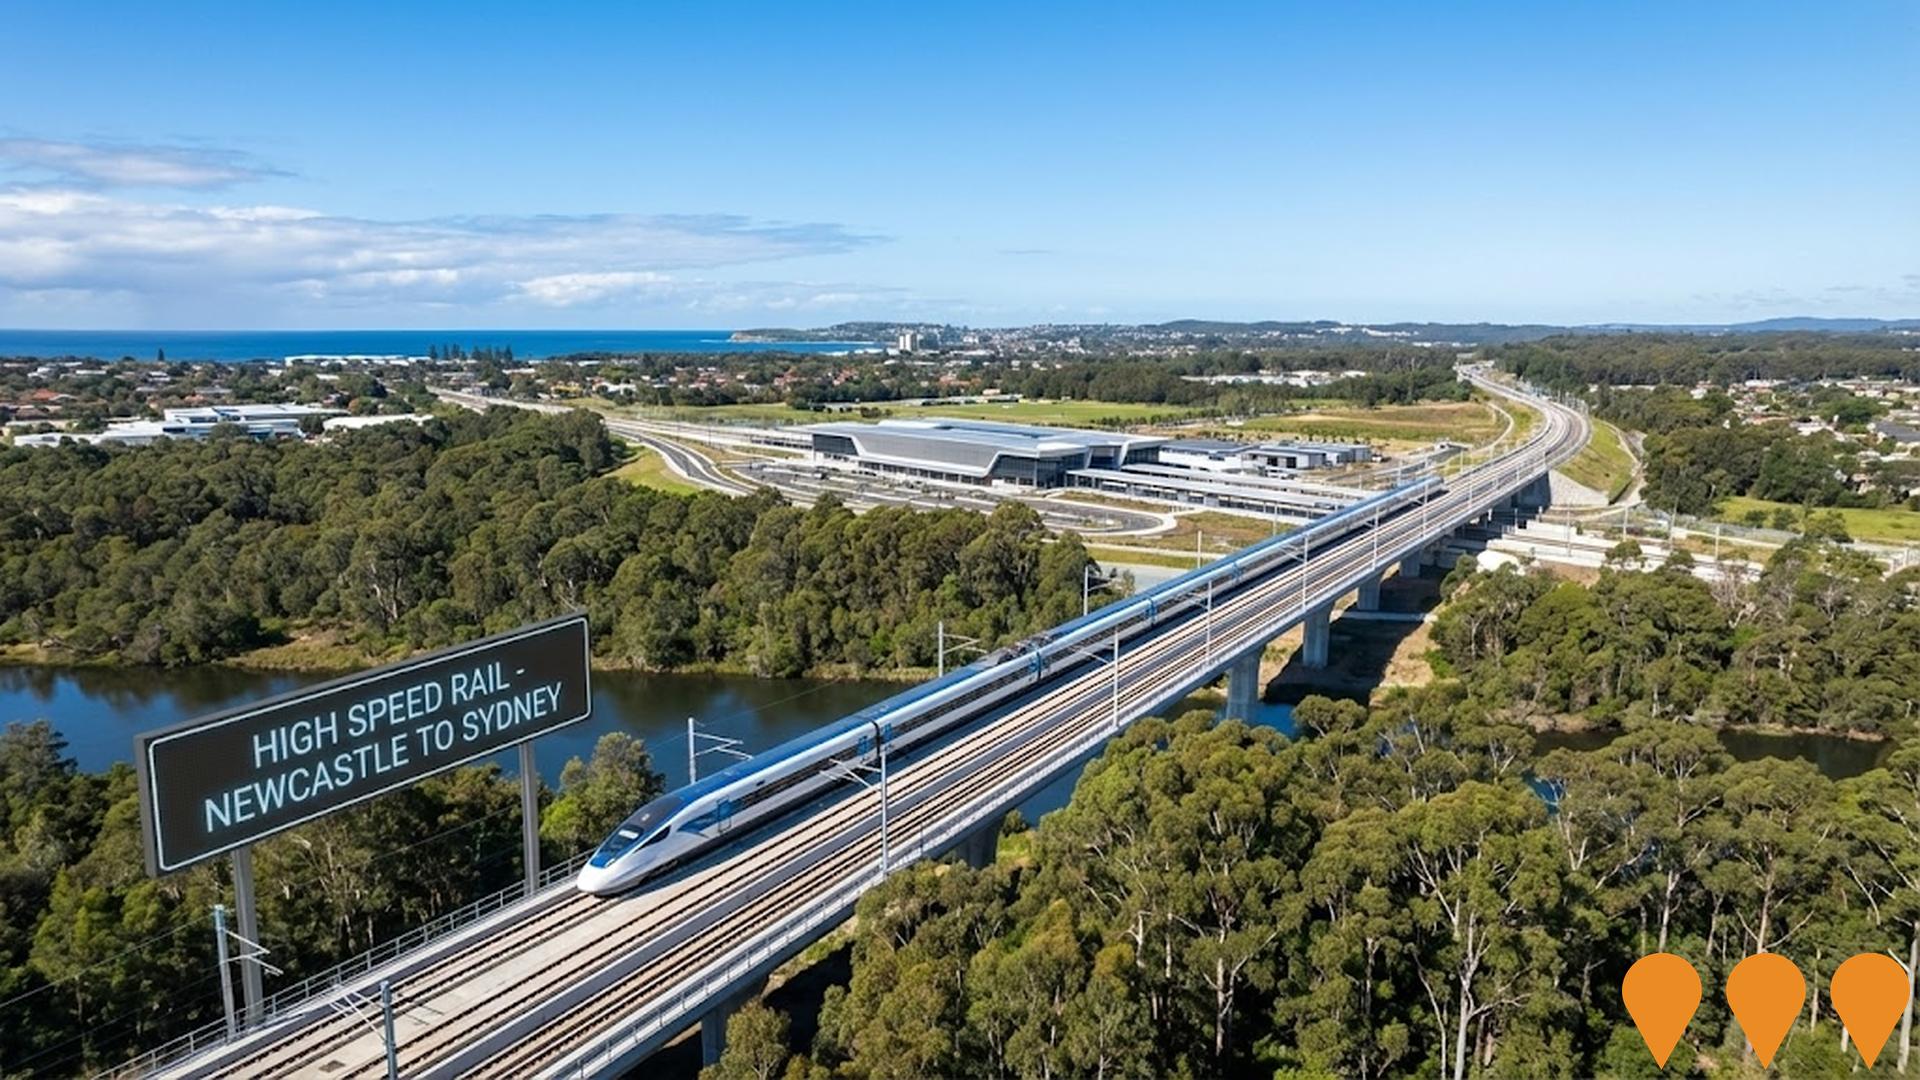
High Speed Rail - Newcastle to Sydney (Stage 1)
The first stage of the proposed National High Speed Rail network aims to connect Newcastle to Sydney via the Central Coast, reducing travel time to approximately one hour with trains reaching speeds up to 320 km/h. The project is focused on the development phase, which includes design refinement, securing planning approvals, and corridor preservation. It is being advanced by the Australian Government's High Speed Rail Authority (HSRA). Stations are planned for Broadmeadow, Lake Macquarie, Central Coast, and Central Sydney. The long-term vision is a national network connecting Brisbane, Sydney, Canberra, and Melbourne.
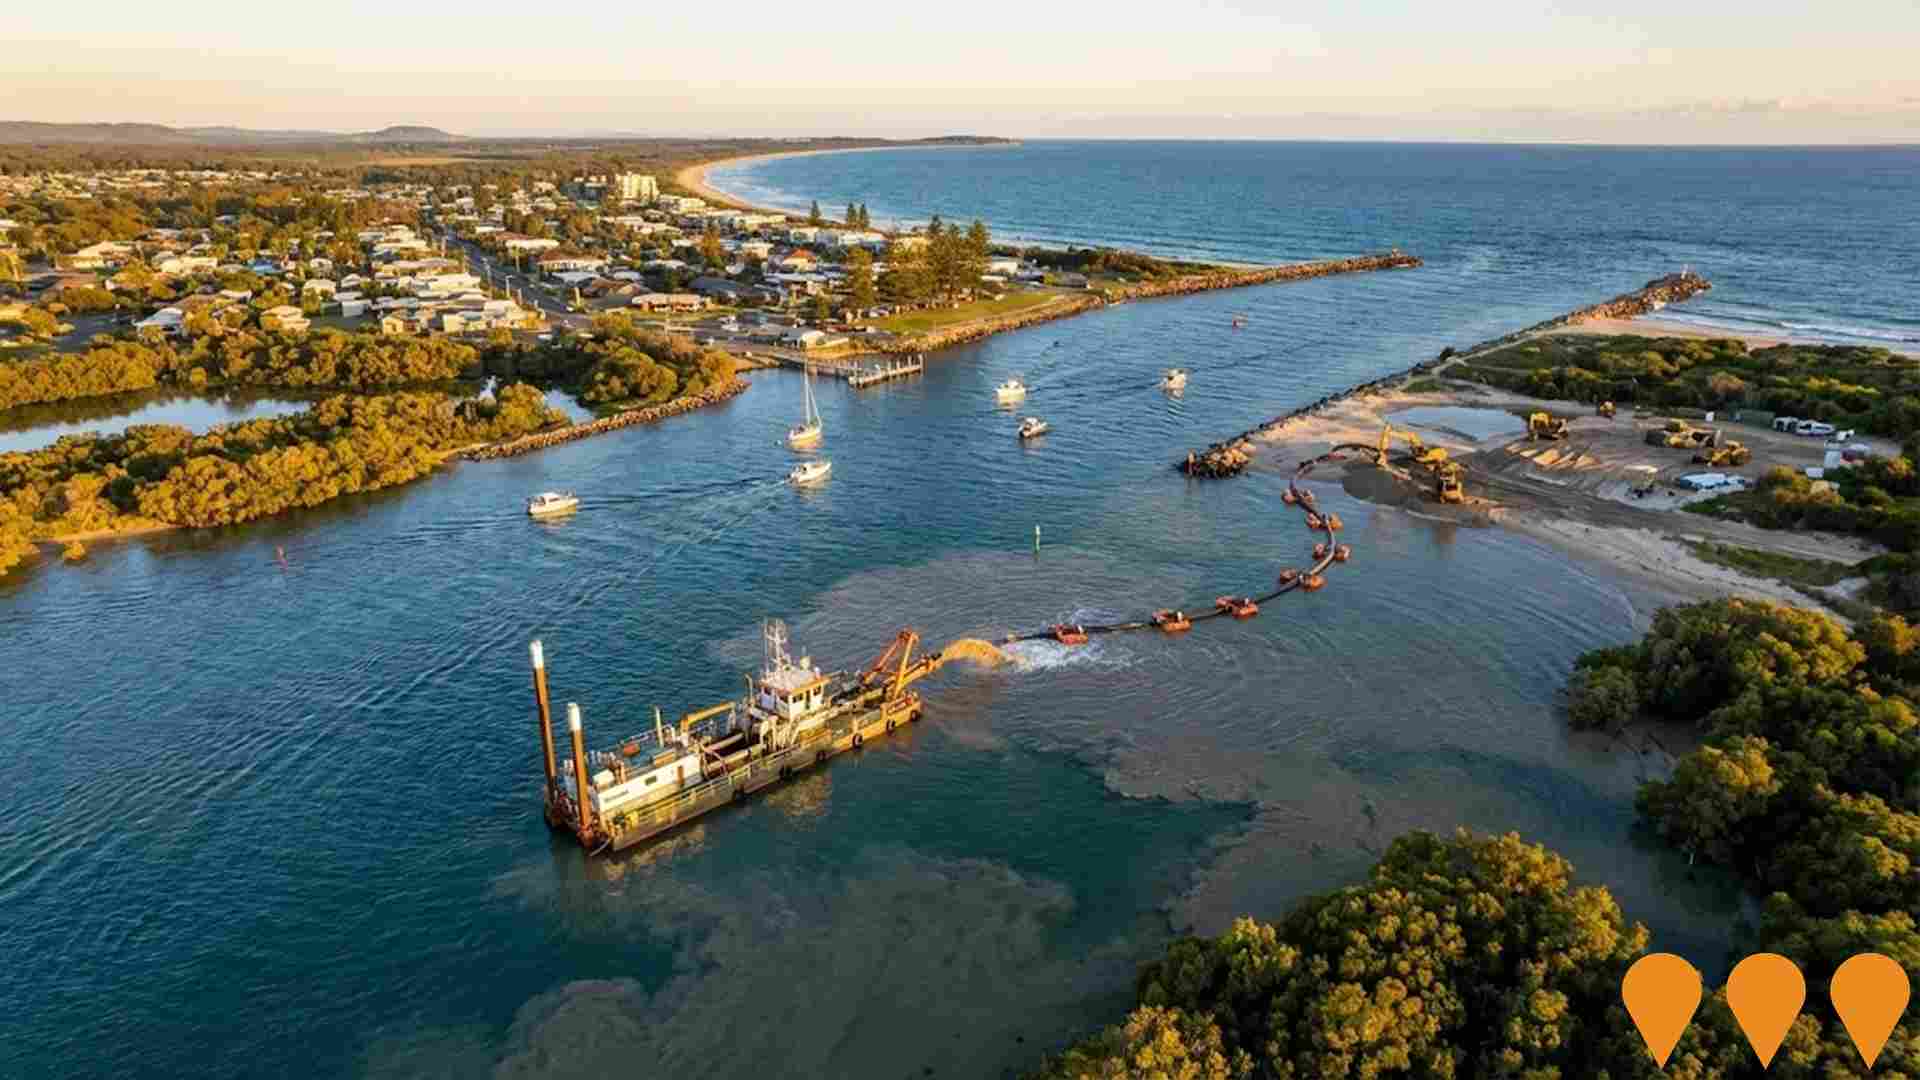
Swansea Channel Permanent Dredging Solution
A permanent dredging solution for Swansea Channel, the entrance to Lake Macquarie, involving a Beaver 30 dredge vessel and sand transfer system to maintain safe navigation for vessels, with sand pumped to Blacksmiths Beach. The project includes upgrades to the Blacksmiths boat ramp and aims to address ongoing sand accumulation issues.
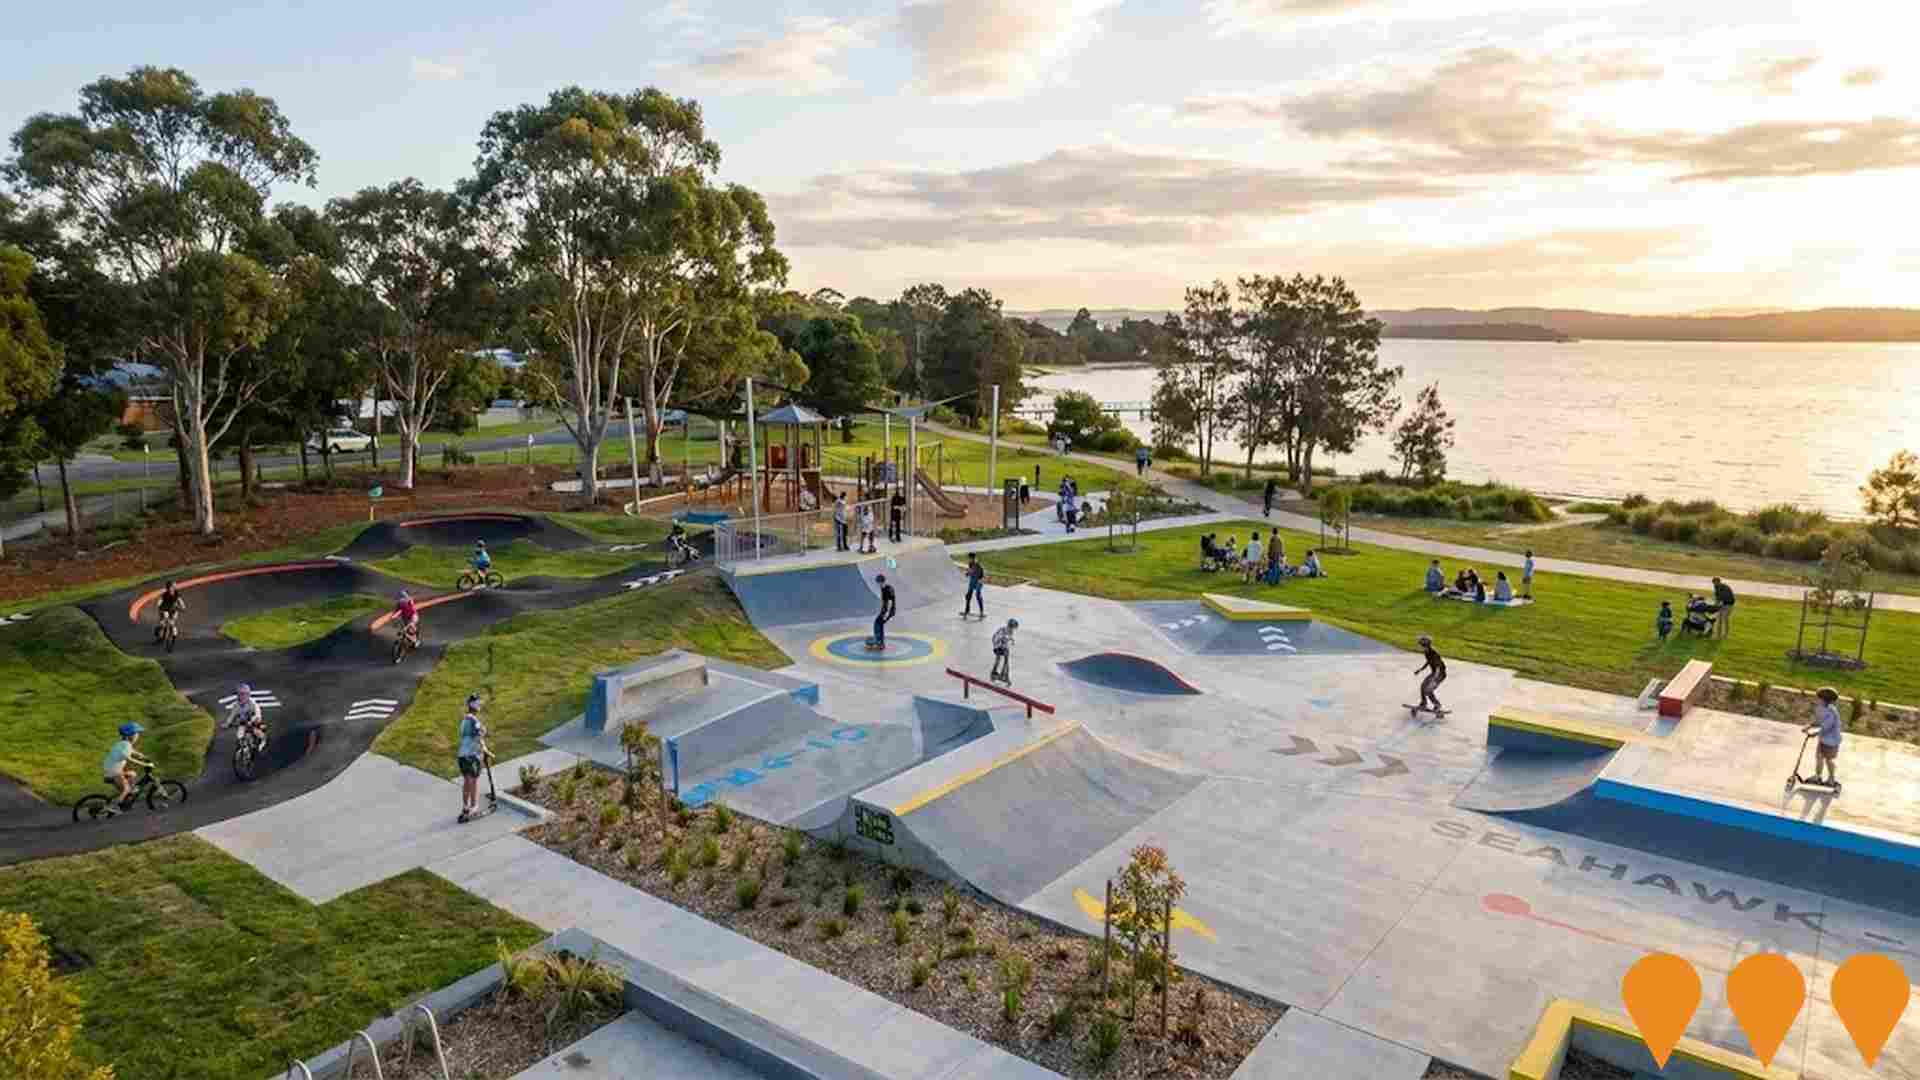
Rathmines Park Transformation
Comprehensive redevelopment of Rathmines Park into a regional recreation destination. Features a $2+ million transformation including Lake Macquarie's biggest skate park, new pump track, youth activity areas, upgraded playground equipment, new playground, learn-to-ride area, youth hub, sports facilities, walking trails, and waterfront amenities. Enhanced connection to Lake Macquarie foreshore with improved accessibility and parking.
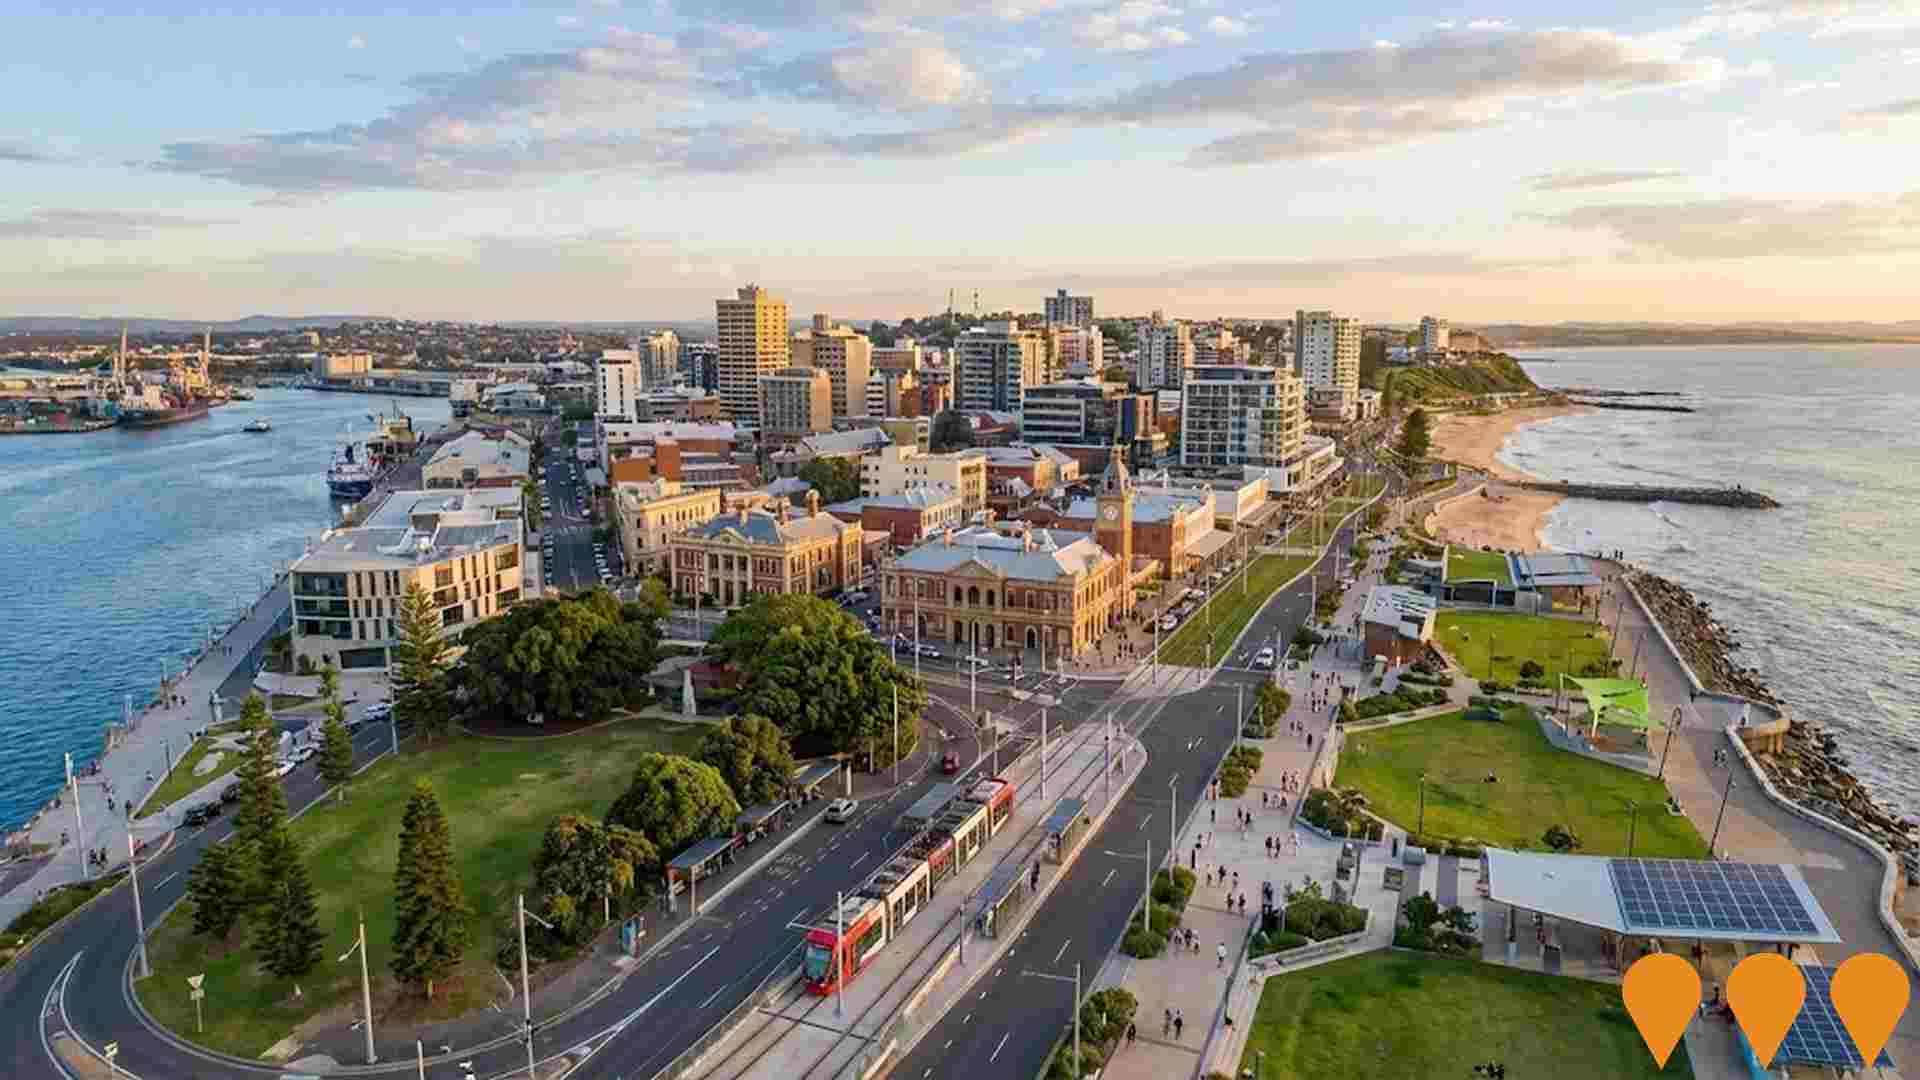
Newcastle 2040
City of Newcastle's Community Strategic Plan (CSP) setting the shared vision and priorities for the next 10+ years. Originally adopted in 2022 and revised in 2024/25, the updated CSP was endorsed by Council on 15 April 2025. It guides policies, strategies and actions across the LGA and is implemented through the Delivery Program and Operational Plan known as Delivering Newcastle 2040.
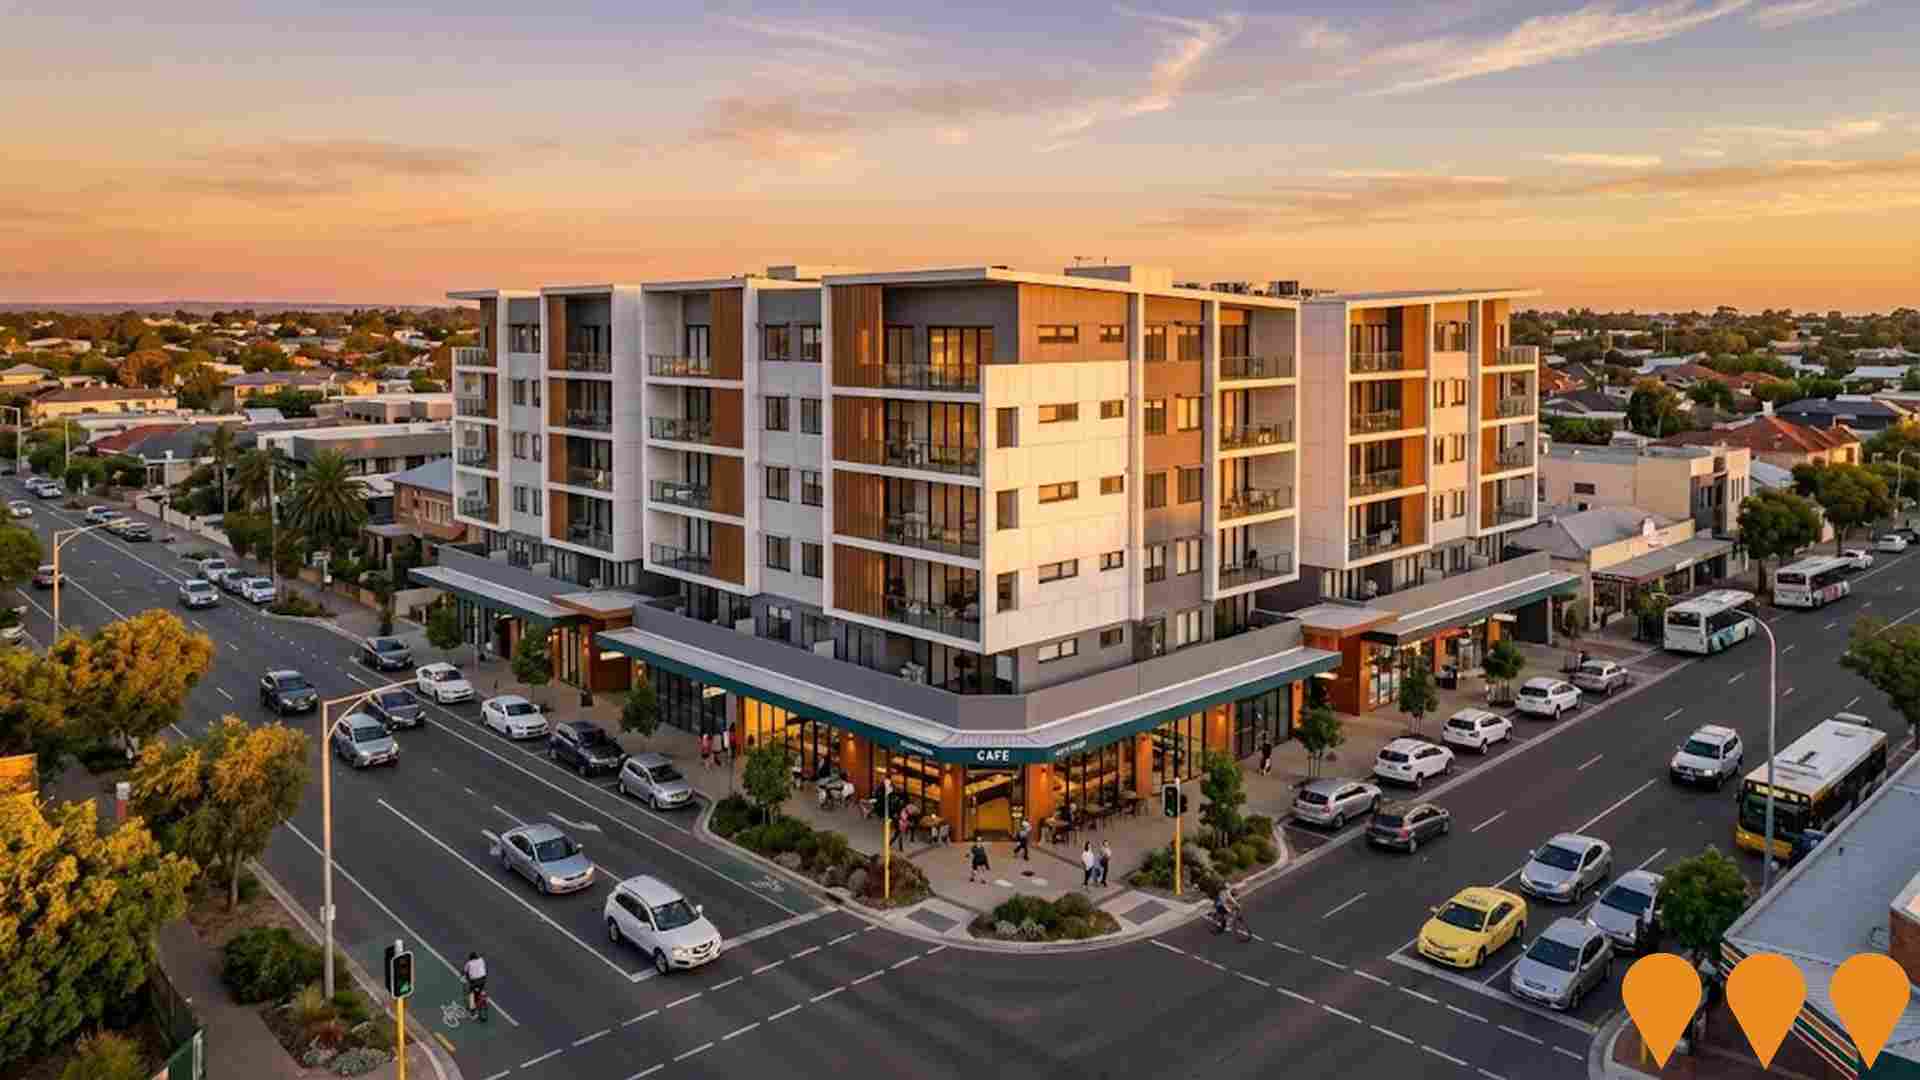
114-120 Cary Street Mixed Use Development
Five-storey twin towers mixed-use development featuring 108 residential units, commercial premises, and basement parking.
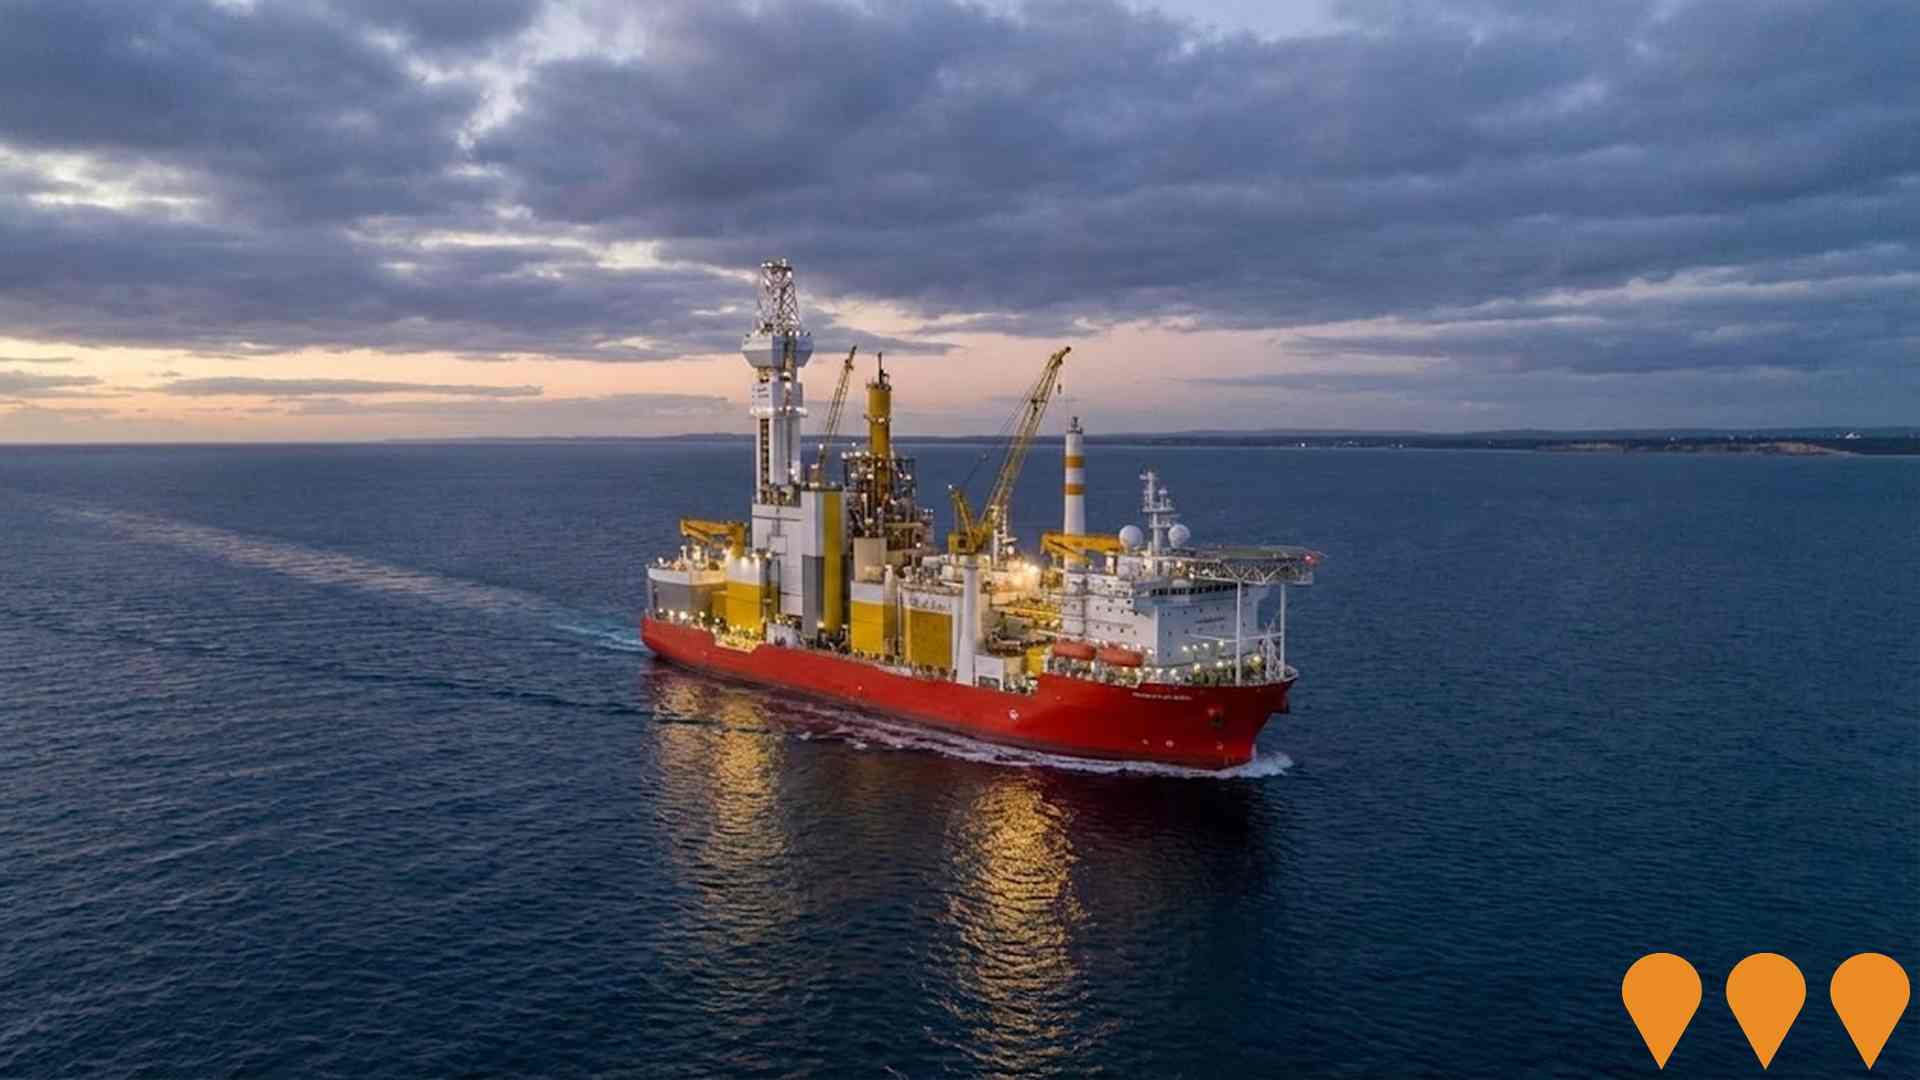
Newcastle Offshore Wind Project
The Newcastle Offshore Wind project proposes a floating wind farm off Newcastle, NSW, with an expected capacity of up to 10 gigawatts, pending a Scoping Study's results.
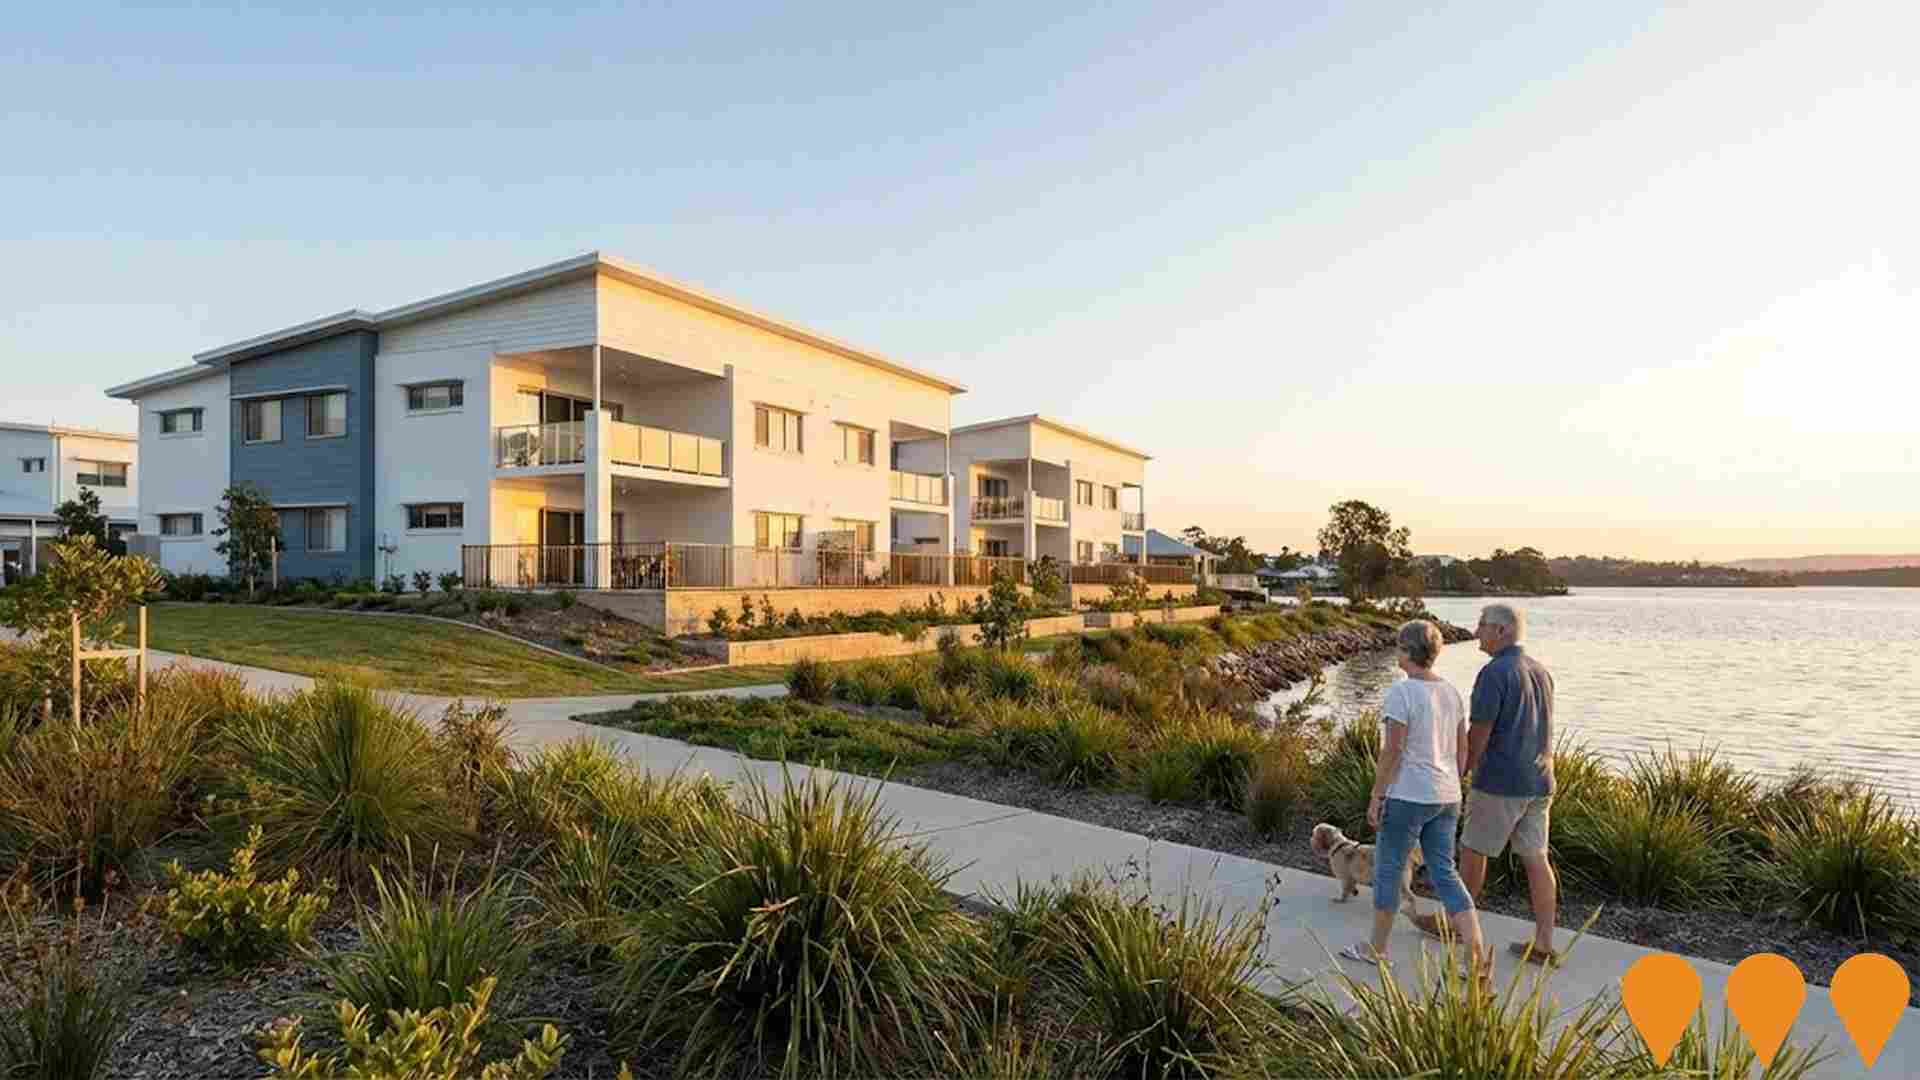
Wangi Shores Retirement Village - Stage 3B Block K
Stage 3B (Block K) at Wangi Shores Retirement Village is a new waterfront stage on Lake Macquarie, delivering eight over 55s villas (four upper and four lower) with two bedrooms, study, balconies and undercover parking, with residents enjoying access to the village pool, spa, community centre, gardens and other shared facilities; construction has commenced with completion expected in late 2026.
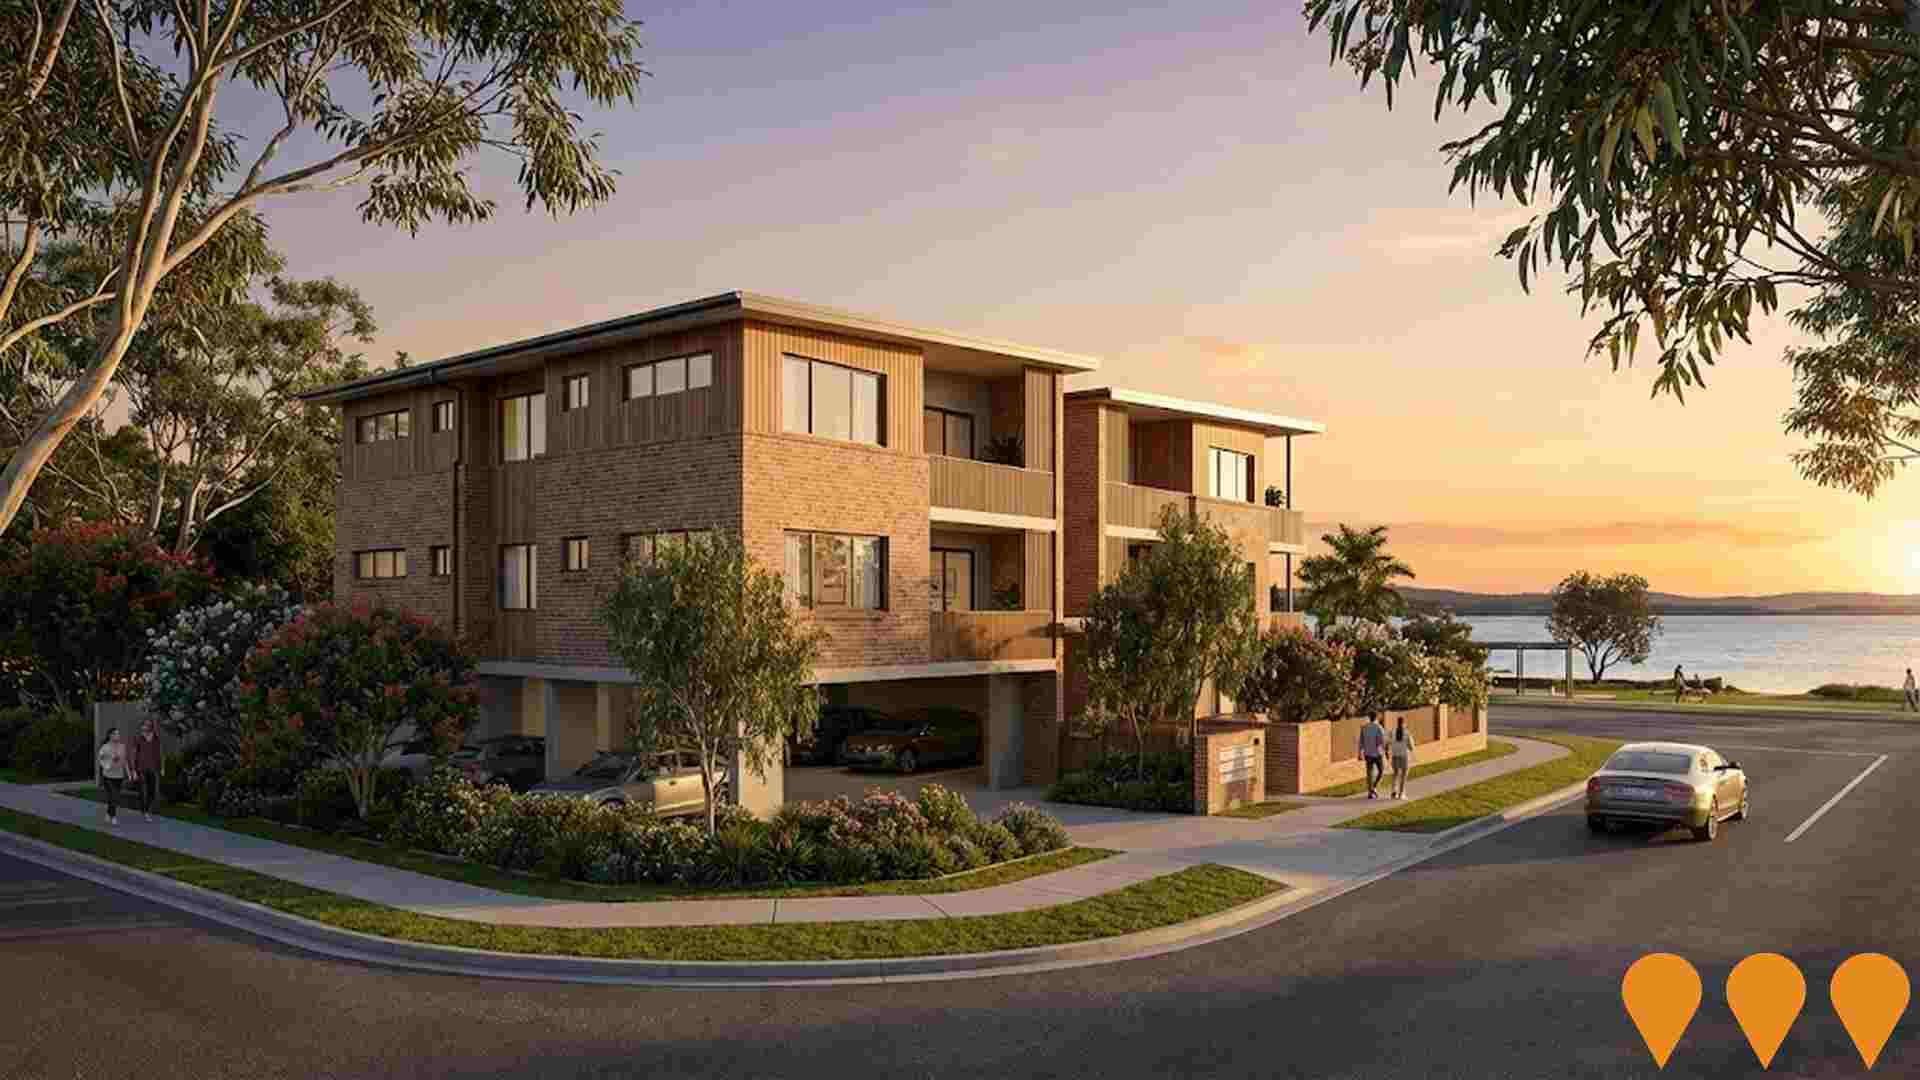
1 Kent Place, Wangi Wangi - 3 storey apartment building (13 residences)
A three storey residential building proposed at 1 Kent Place, Wangi Wangi in the Lake Macquarie City Council area. The project is planned to deliver 13 apartments above ground level parking, with 24 car spaces on a 933 square metre B1 Neighbourhood Centre corner site close to shops, services and the Wangi Wangi foreshore.
Employment
AreaSearch analysis indicates Wangi Wangi - Rathmines maintains employment conditions that align with national benchmarks
Wangi Wangi - Rathmines has a skilled workforce with significant representation in essential services sectors. The unemployment rate was 3.2% as of the past year, with an estimated employment growth of 2.4%.
As of September 2025, 4687 residents were employed, and the unemployment rate was 0.7% lower than Rest of NSW's rate of 3.8%. Workforce participation was somewhat below standard at 54.1%, compared to Rest of NSW's 56.4%. The dominant employment sectors among residents include health care & social assistance, construction, and education & training. Construction stands out with employment levels at 1.4 times the regional average, while agriculture, forestry & fishing has limited presence at 0.4% compared to the regional average of 5.3%.
Employment opportunities locally appear limited based on Census data comparison between working population and resident population. Over a 12-month period ending in September 2025, employment increased by 2.4%, labour force increased by 3.4%, resulting in an unemployment rise of 1.0 percentage points. This contrasts with Rest of NSW where employment contracted by 0.5%, the labour force fell by 0.1%, and unemployment rose by 0.4 percentage points. State-level data to 25-Nov-25 shows NSW employment contracted by 0.03% (losing 2260 jobs), with a state unemployment rate of 3.9%. National employment forecasts from May-25 suggest national employment will expand by 6.6% over five years and 13.7% over ten years. Applying these projections to Wangi Wangi - Rathmines's employment mix suggests local employment should increase by 6.5% over five years and 13.7% over ten years, based on simple weighting extrapolation for illustrative purposes.
Frequently Asked Questions - Employment
Income
Income levels sit below national averages according to AreaSearch assessment
The Wangi Wangi - Rathmines SA2 had a median taxpayer income of $47,287 and an average income of $65,785 in the financial year 2022, according to postcode level ATO data aggregated by AreaSearch. This is slightly higher than the national average for that period. In contrast, the Rest of NSW had a median income of $49,459 and an average income of $62,998 in the same year. Based on Wage Price Index growth since 2022, current estimates suggest the median income would be approximately $53,250 and the average income around $74,080 by September 2025. The 2021 Census data shows that household, family, and personal incomes in Wangi Wangi - Rathmines rank modestly, between the 34th and 38th percentiles. Income distribution indicates that 30.4% of locals (2,931 people) fall into the $1,500 - 2,999 category, similar to the surrounding region where 29.9% occupy this bracket. After housing costs, 85.3% of income remains for other expenses. The area's SEIFA income ranking places it in the fifth decile.
Frequently Asked Questions - Income
Housing
Wangi Wangi - Rathmines is characterized by a predominantly suburban housing profile, with above-average rates of outright home ownership
In Wangi Wangi - Rathmines, as per the latest Census evaluation, 93.3% of dwellings were houses, with the remaining 6.7% comprising semi-detached homes, apartments, and other types. This is compared to Non-Metro NSW's 89.7% houses and 10.2% other dwellings. Home ownership in Wangi Wangi - Rathmines stood at 45.3%, with mortgaged dwellings at 37.9% and rented ones at 16.9%. The median monthly mortgage repayment was $1,888, lower than Non-Metro NSW's average of $1,900. The median weekly rent was $370, compared to Non-Metro NSW's $380. Nationally, Wangi Wangi - Rathmines' mortgage repayments were higher than the Australian average of $1,863, while rents were lower than the national figure of $375.
Frequently Asked Questions - Housing
Household Composition
Wangi Wangi - Rathmines has a typical household mix, with a fairly typical median household size
Family households constitute 76.9% of all households, including 27.4% couples with children, 37.6% couples without children, and 11.2% single parent families. Non-family households account for the remaining 23.1%, with lone person households at 21.7% and group households comprising 1.7%. The median household size is 2.5 people, which aligns with the average in the Rest of NSW.
Frequently Asked Questions - Households
Local Schools & Education
Wangi Wangi - Rathmines shows below-average educational performance compared to national benchmarks, though pockets of achievement exist
The area's university qualification rate was 20.2%, significantly lower than the NSW average of 32.2%. This presents both a challenge and an opportunity for targeted educational initiatives. Bachelor degrees were the most common at 13.4%, followed by postgraduate qualifications (4.2%) and graduate diplomas (2.6%). Trade and technical skills were prominent, with 44.6% of residents aged 15+ holding vocational credentials - advanced diplomas (12.2%) and certificates (32.4%).
A substantial 24.7% of the population was actively pursuing formal education, including 8.8% in primary, 6.7% in secondary, and 3.5% in tertiary education.
Frequently Asked Questions - Education
Schools Detail
Nearby Services & Amenities
Transport
Transport servicing is low compared to other areas nationally based on assessment of service frequency, route connectivity and accessibility
Wangi Wangi - Rathmines has 100 active public transport stops. These are served by buses on 35 different routes. Together, these routes provide 309 weekly passenger trips.
Residents have excellent transport accessibility, with an average distance of 182 meters to the nearest stop. On average, there are 44 trips per day across all routes, which equates to approximately three weekly trips per stop.
Frequently Asked Questions - Transport
Transport Stops Detail
Health
Health performance in Wangi Wangi - Rathmines is well below average with prevalence of common health conditions notable across both younger and older age cohorts
Wangi Wangi - Rathmines faces significant health challenges, with common conditions prevalent among both younger and older residents.
Private health cover stands at approximately 52%, slightly above the average SA2 area's rate (~5,052 people). The most frequent medical issues are arthritis (11.7%) and mental health concerns (9.1%), while 60.6% of residents report no ailments, similar to Rest of NSW's 60.3%. The area has a higher proportion of seniors aged 65 and over at 27.6% (2,666 people), compared to Rest of NSW's 21.9%.
Frequently Asked Questions - Health
Cultural Diversity
Wangi Wangi - Rathmines is considerably less culturally diverse than average when assessed alongside AreaSearch's national rankings for language and cultural background related metrics
Wangi Wangi-Rathmines had a cultural diversity score below average, with 88.6% of its residents born in Australia, 92.7% being citizens, and 96.3% speaking English only at home. Christianity was the predominant religion, accounting for 53.0% of the population, compared to 54.0% across Rest of NSW. The top three ancestry groups were English (33.4%), Australian (30.1%), and Scottish (9.2%).
Notably, Welsh (0.9%) was overrepresented compared to the regional average of 0.7%, while Australian Aboriginal (3.5%) and Dutch (1.4%) also showed higher percentages than their respective regional averages of 4.5% and 1.1%.
Frequently Asked Questions - Diversity
Age
Wangi Wangi - Rathmines hosts an older demographic, ranking in the top quartile nationwide
Wangi Wangi - Rathmines has a median age of 48 years, which is older than Rest of NSW's 43 and significantly higher than Australia's median age of 38. The age profile shows that the 65-74 year-old group makes up 15.8% of the population, while the 25-34 year-olds make up 9.2%, both figures being higher than those in Rest of NSW and Australia respectively. Post-2021 Census data indicates that the 75 to 84 age group has grown from 7.9% to 9.3%, while the 55 to 64 year-old cohort has declined from 15.7% to 13.8%. Demographic modeling suggests significant changes in Wangi Wangi - Rathmines's age profile by 2041, with the 25-34 age group projected to grow steadily, increasing by 202 people (23%) from 882 to 1,085. Conversely, population declines are projected for the 5-14 and 65-74 age groups.
