Chart Color Schemes
This analysis uses ABS Statistical Areas Level 2 (SA2) boundaries, which can materially differ from Suburbs and Localities (SAL) even when sharing similar names.
SA2 boundaries are defined by the Australian Bureau of Statistics and are designed to represent communities for statistical reporting (e.g., census and ERP).
Suburbs and Localities (SAL) represent commonly-used suburb/locality names (postal-style areas) and may use different geographic boundaries. For comprehensive analysis, consider reviewing both boundary types if available.
est. as @ -- *
ABS ERP | -- people | --
2021 Census | -- people
Sales Activity
Curious about local property values? Filter the chart to assess the volume and appreciation (including resales) trends and regional comparisons, or scroll to the map below view this information at an individual property level.
Find a Recent Sale
Sales Detail
Population
An assessment of population growth drivers in Bargo reveals an overall ranking slightly below national averages considering recent, and medium term trends
Based on AreaSearch's analysis, Bargo's population is around 6278 as of Nov 2025. This reflects an increase of 344 people (5.8%) since the 2021 Census, which reported a population of 5934 people. The change is inferred from the estimated resident population of 6148 from the ABS as of June 2024 and an additional 52 validated new addresses since the Census date. This level of population equates to a density ratio of 92 persons per square kilometer, providing significant space per person and potential room for further development. Bargo's 5.8% growth since census positions it within 0.9 percentage points of the state (6.7%), demonstrating competitive growth fundamentals. Population growth for the area was primarily driven by natural growth that contributed approximately 54.9% of overall population gains during recent periods, although all drivers including interstate migration and overseas migration were positive factors.
AreaSearch is adopting ABS/Geoscience Australia projections for each SA2 area, as released in 2024 with 2022 as the base year. For any SA2 areas not covered by this data, AreaSearch is utilising the NSW State Government's SA2 level projections, as released in 2022 with 2021 as the base year. Growth rates by age group from these aggregations are also applied to all areas for years 2032 to 2041. As we examine future population trends, lower quartile growth of national statistical areas is anticipated, with the area expected to increase by 83 persons to 2041 based on the latest annual ERP population numbers, reflecting a decline of 0.8% in total over the 17 years.
Frequently Asked Questions - Population
Development
AreaSearch assessment of residential development drivers sees a low level of activity in Bargo, placing the area among the bottom 25% of areas assessed nationally
Bargo has received approximately 26 dwelling approvals annually over the past five financial years, totaling 131 homes. As of FY-26, there have been 5 recorded approvals. On average, 1.1 new residents per year were associated with each dwelling constructed between FY-21 and FY-25, indicating balanced supply and demand conditions. However, this figure has increased to 5.2 people per dwelling over the past two financial years, suggesting growing popularity in the area. The average construction cost of new properties is $369,000.
This year, there have been $8.1 million in commercial approvals, reflecting Bargo's primarily residential nature. Compared to Greater Sydney, Bargo has significantly less development activity, with 72.0% fewer approvals per person. The recent construction consists of 90.0% standalone homes and 10.0% medium and high-density housing, preserving the area's traditional low-density character. With an estimated population of 585 people per dwelling approval, Bargo maintains a quiet development environment.
Given the expected stable or declining population, pressure on housing is anticipated to remain relatively low, potentially presenting buying opportunities.
Frequently Asked Questions - Development
Infrastructure
Bargo has moderate levels of nearby infrastructure activity, ranking in the 45thth percentile nationally
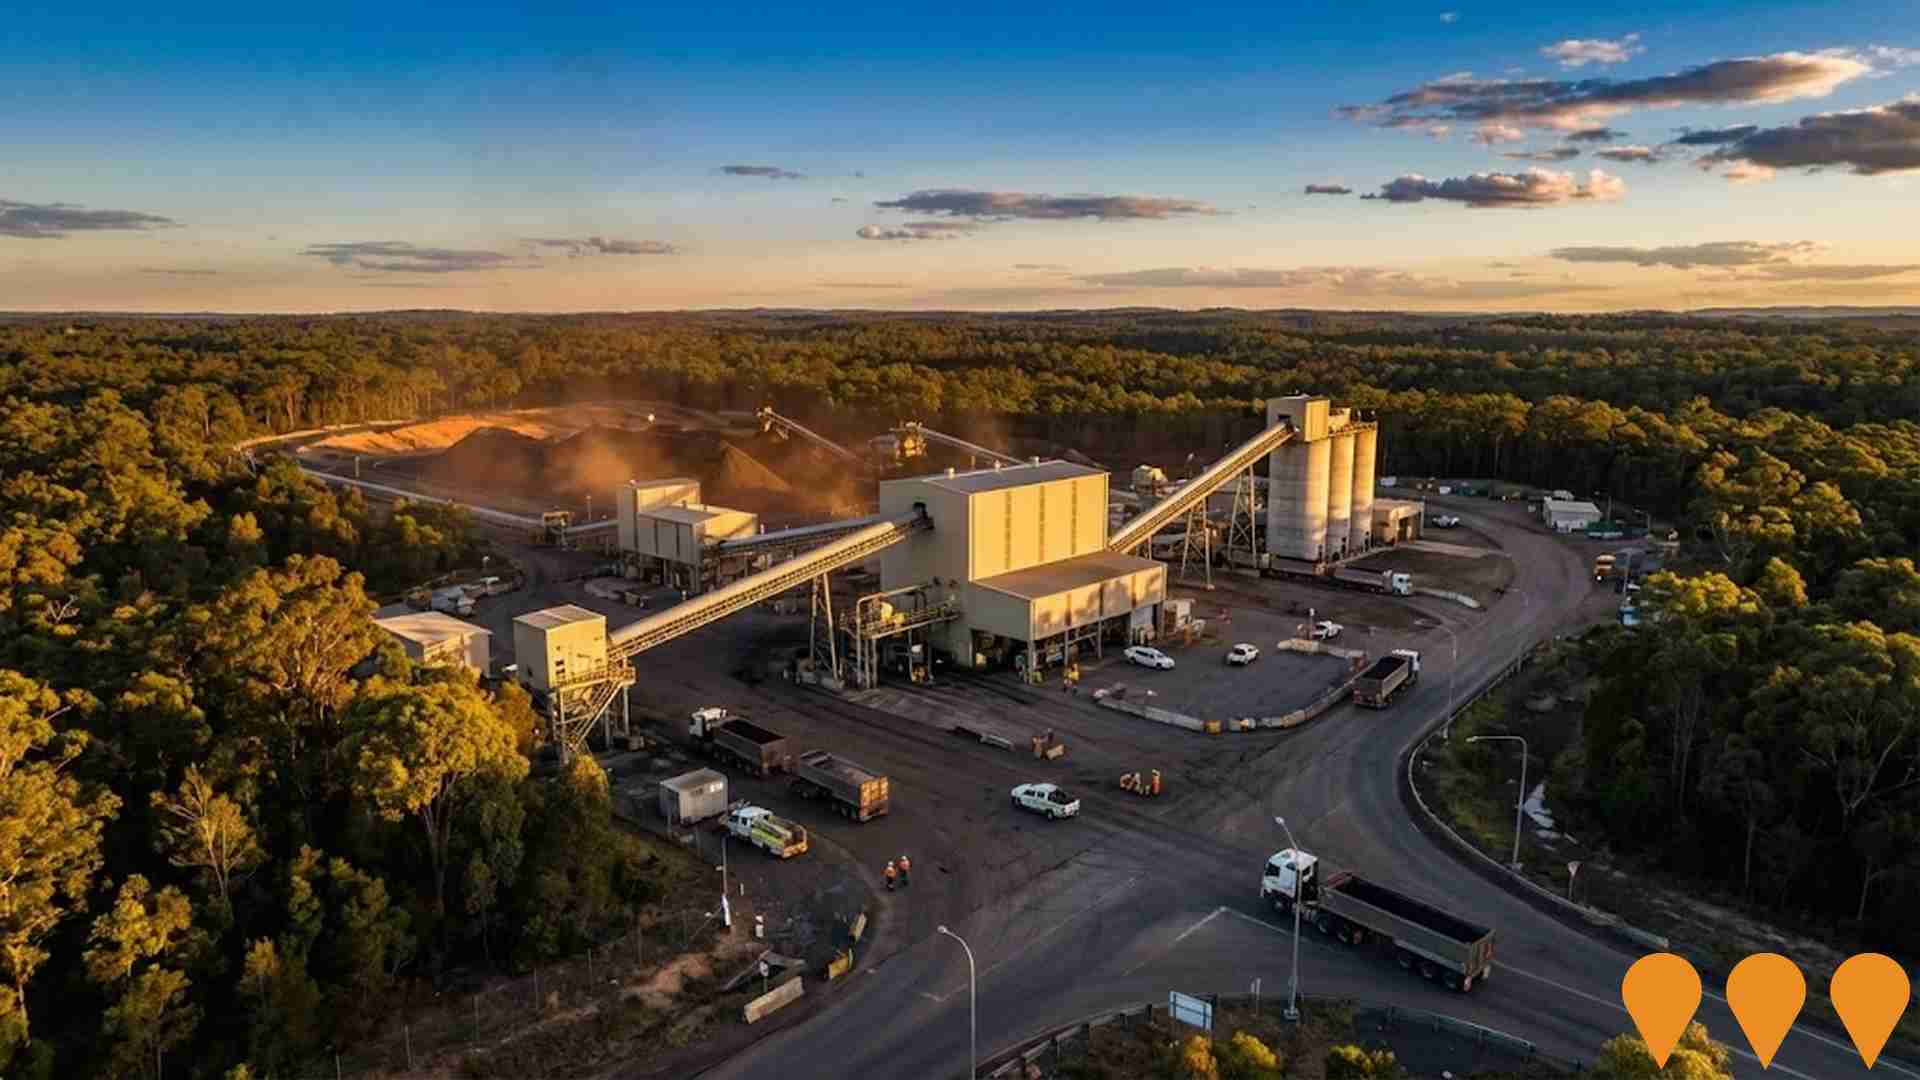
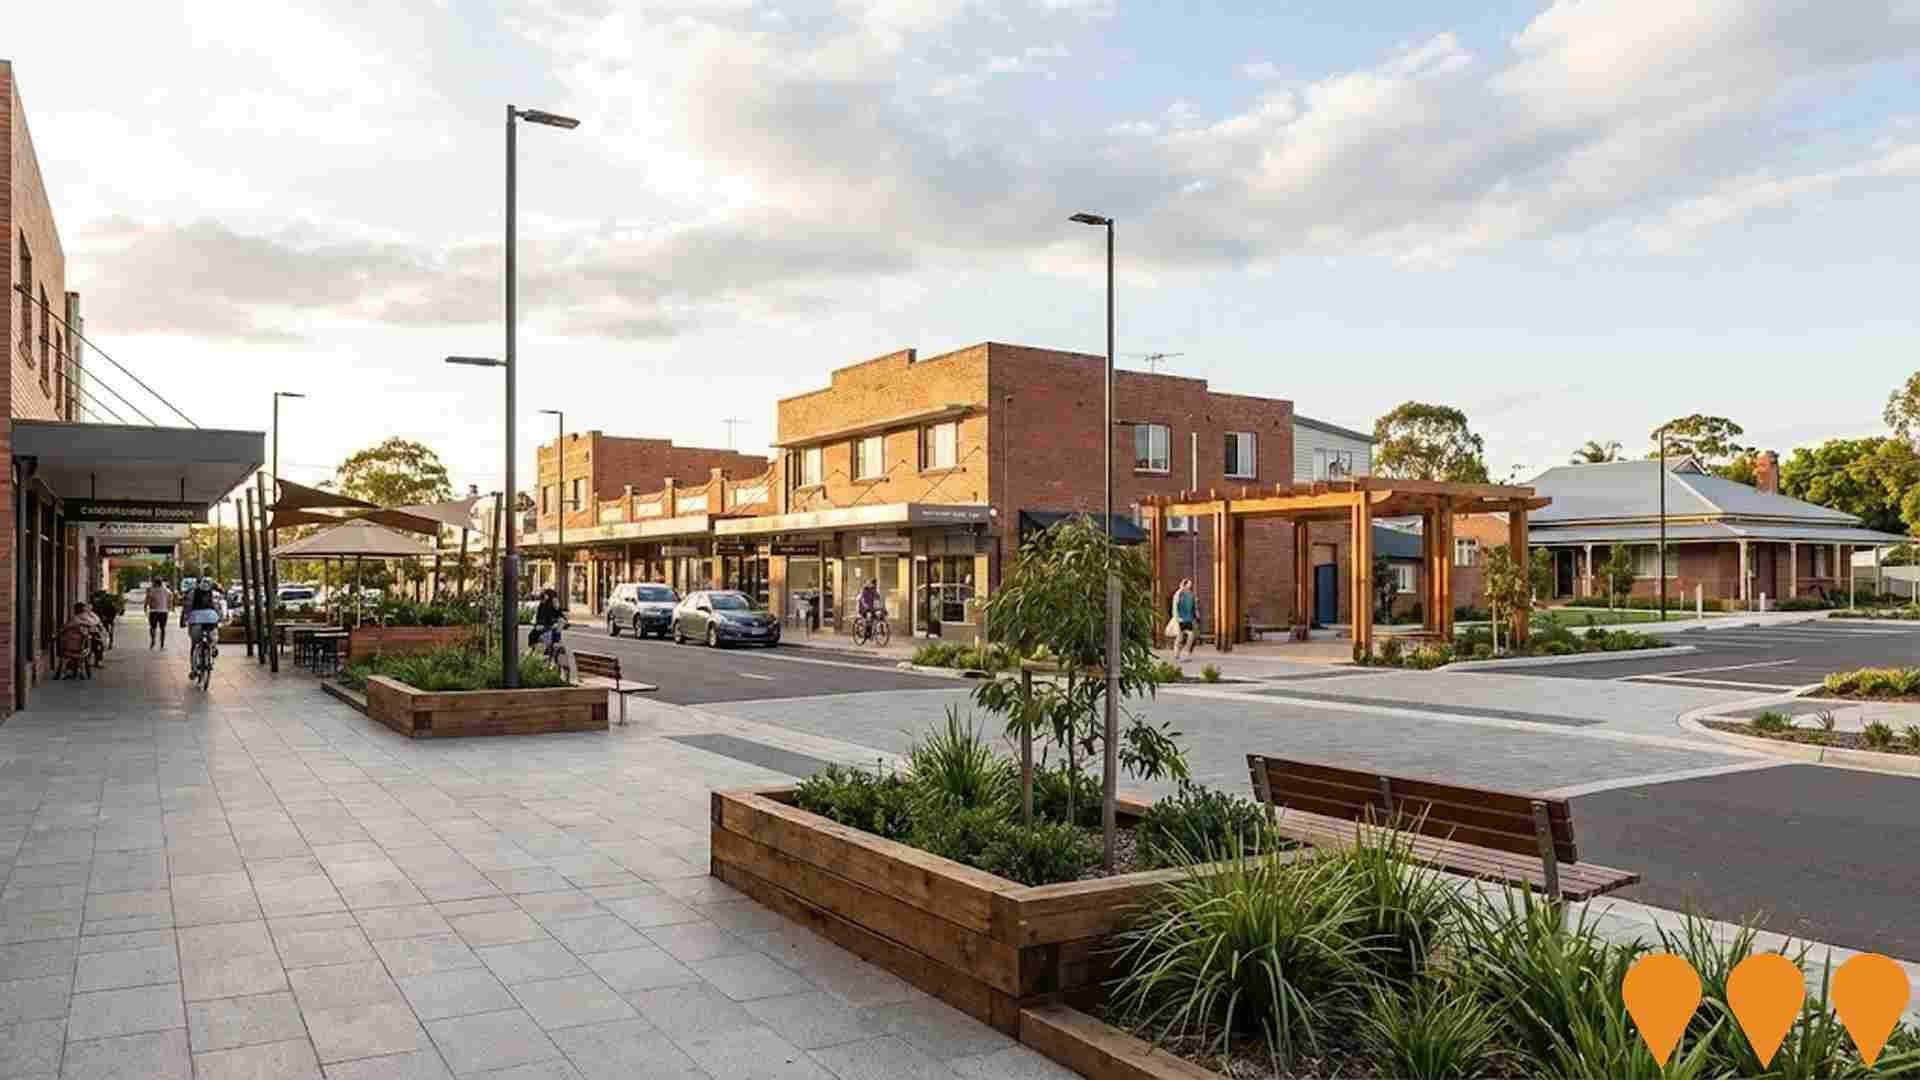
The performance of an area is significantly influenced by changes in local infrastructure, major projects, and planning initiatives. AreaSearch has identified four projects that are expected to impact the area. Notable projects include Tahmoor South Coal Project, Tahmoor Town Centre Revitalisation, Tahmoor Marketplace Expansion, and Maldon to Dombarton Freight Rail Line. The following list details those projects likely to be most relevant.
Professional plan users can use the search below to filter and access additional projects.
INFRASTRUCTURE SEARCH
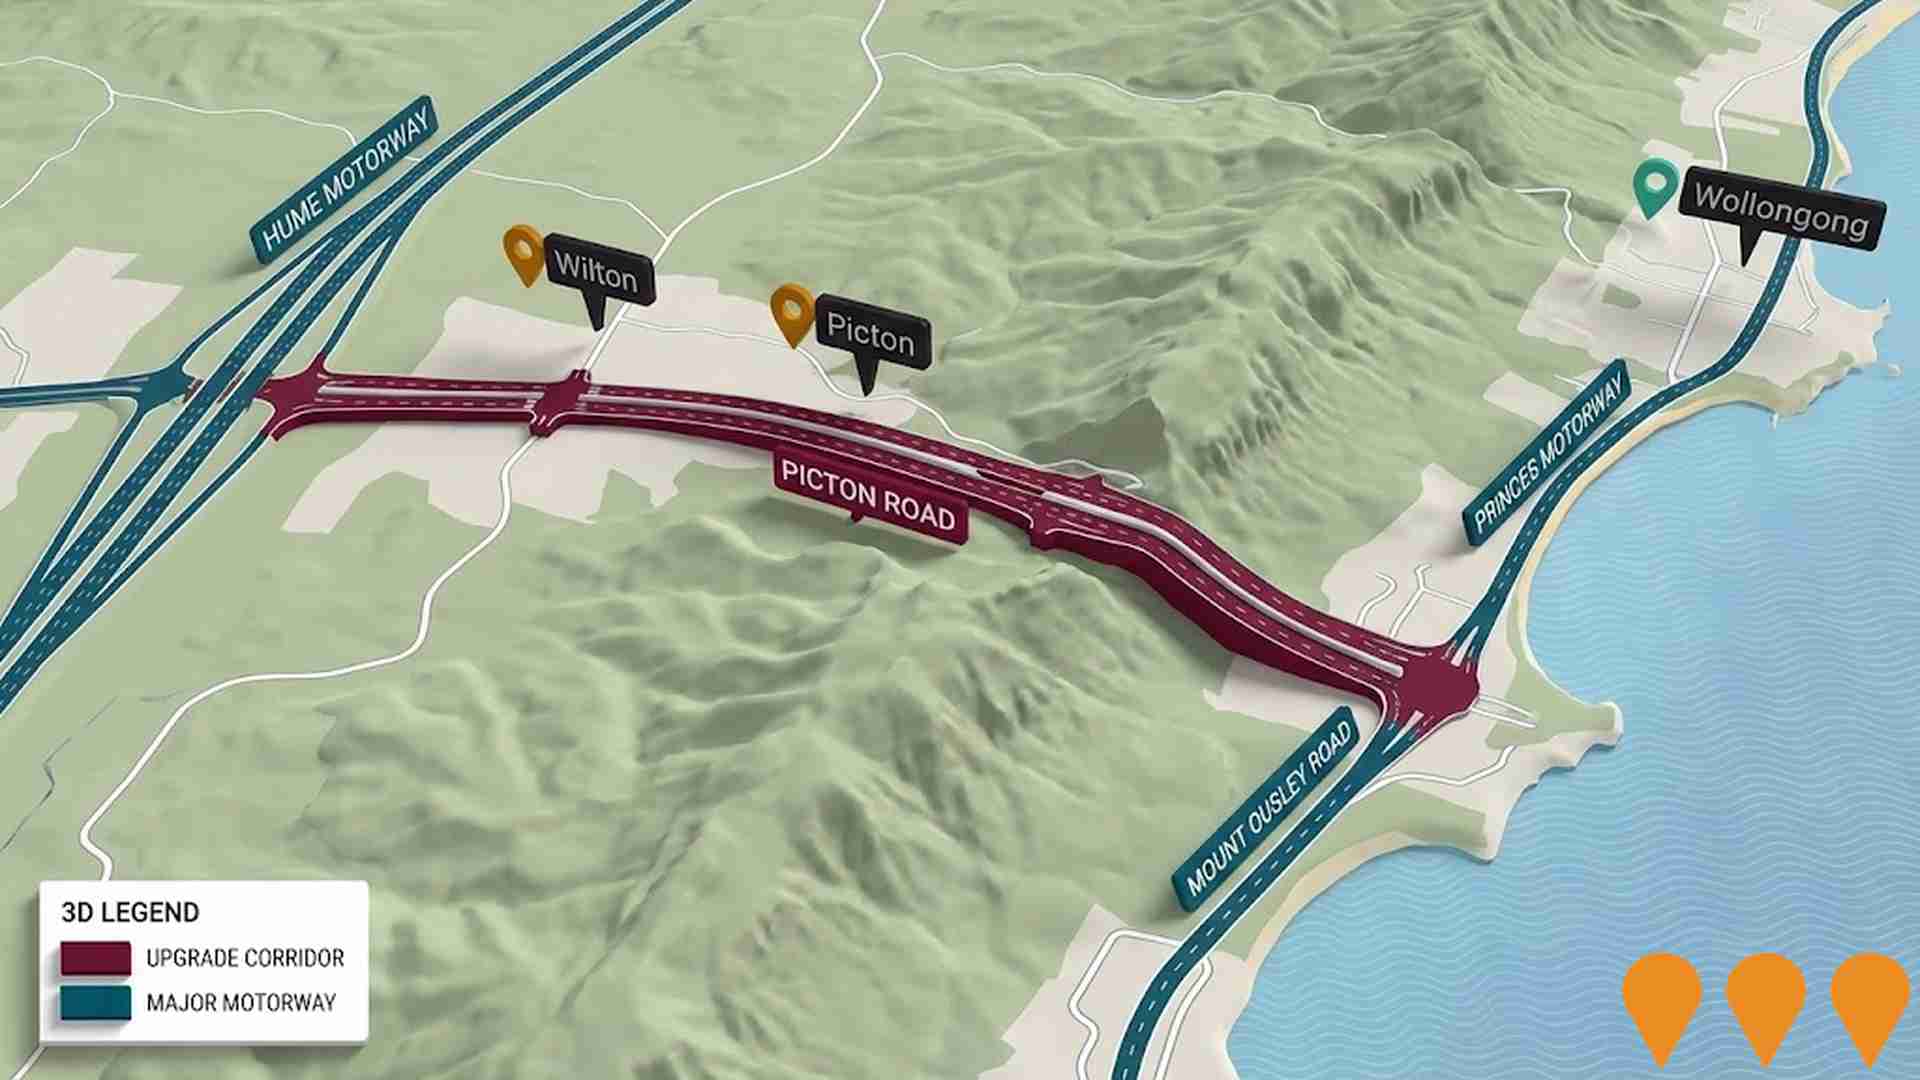
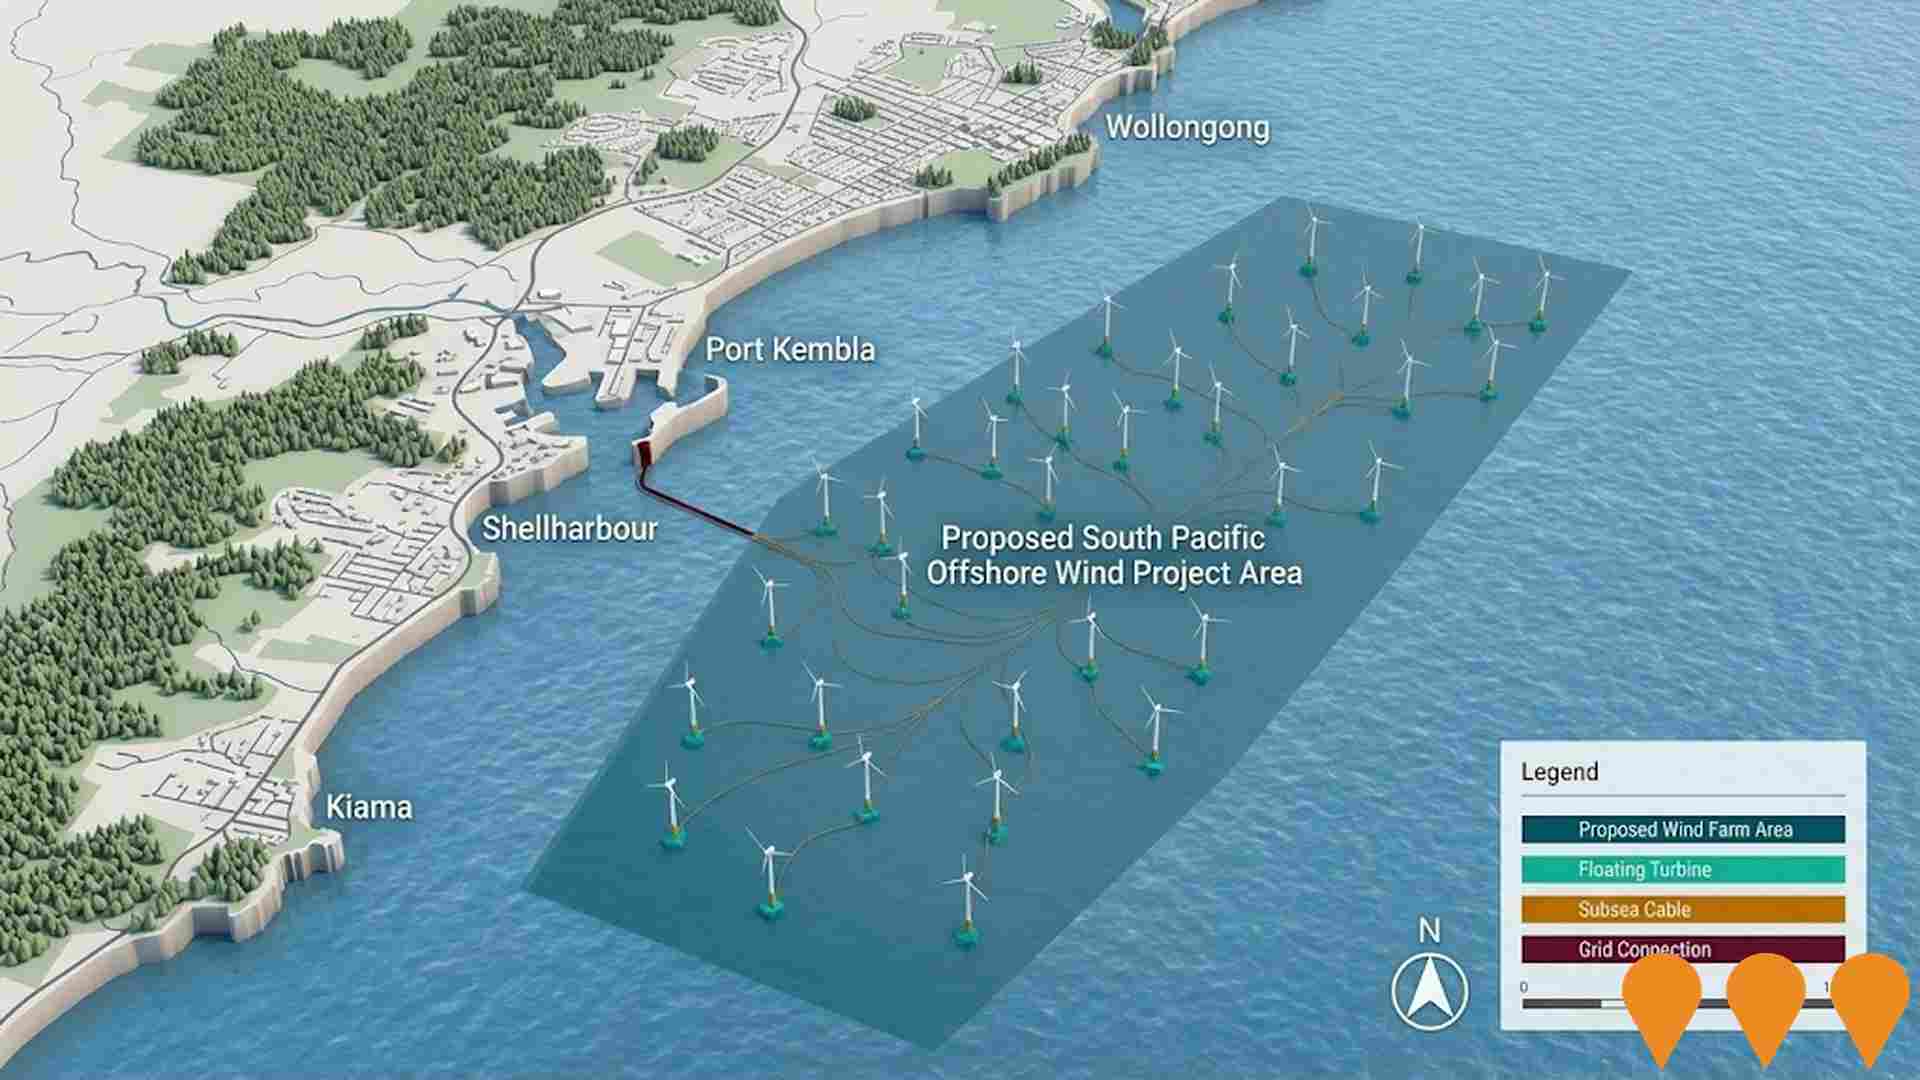
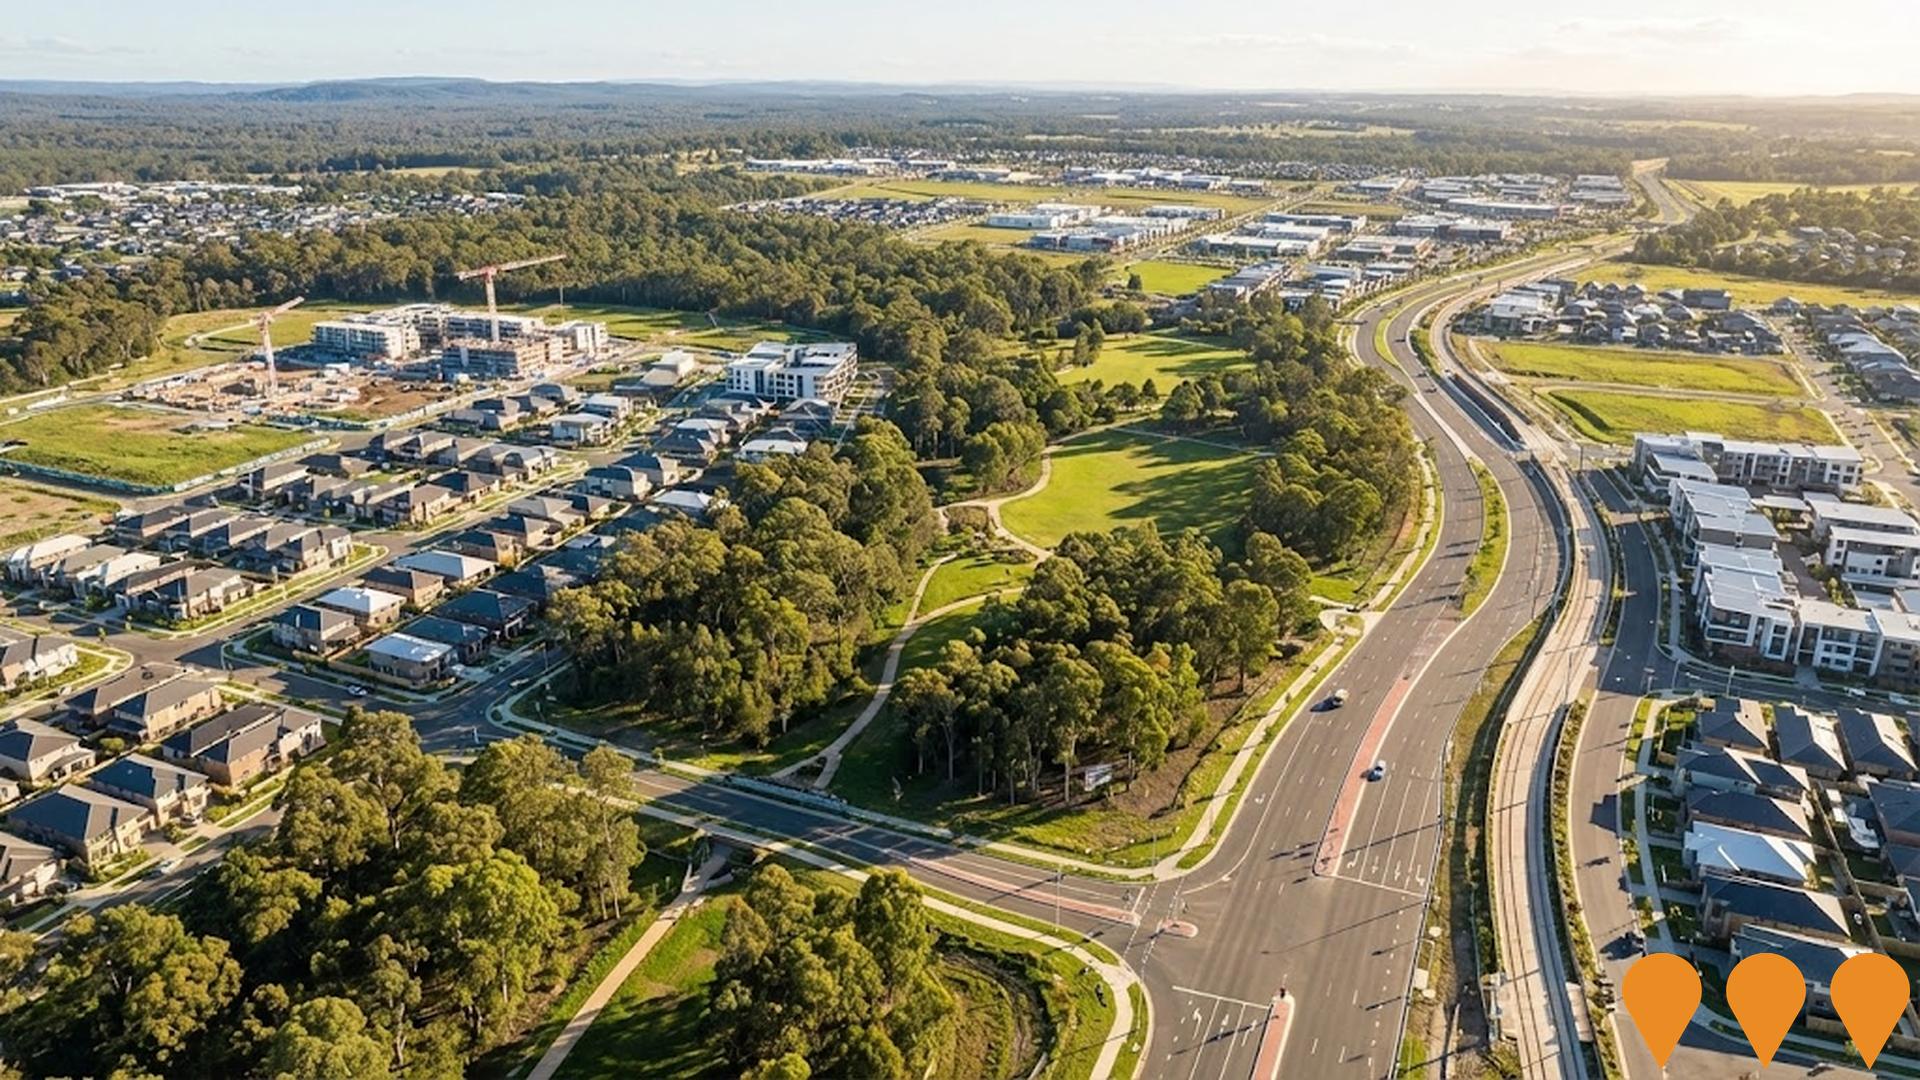
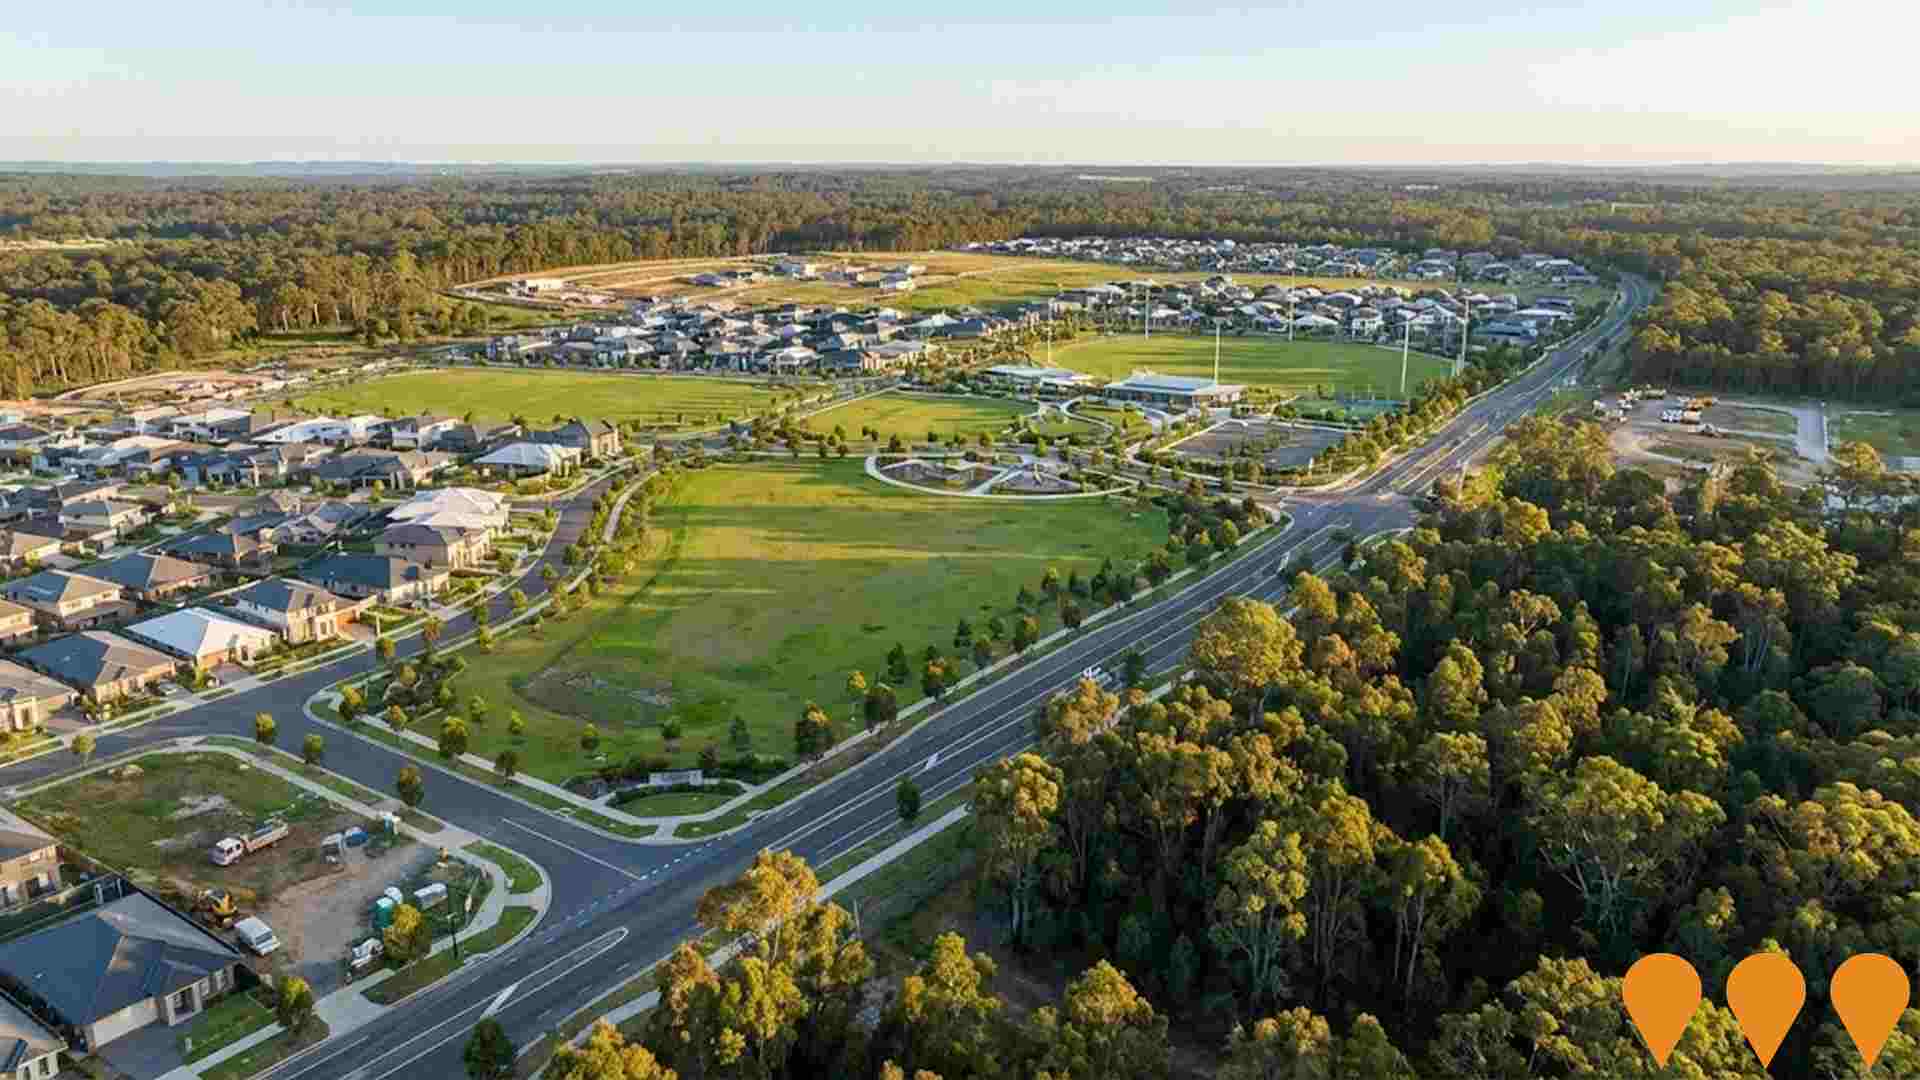
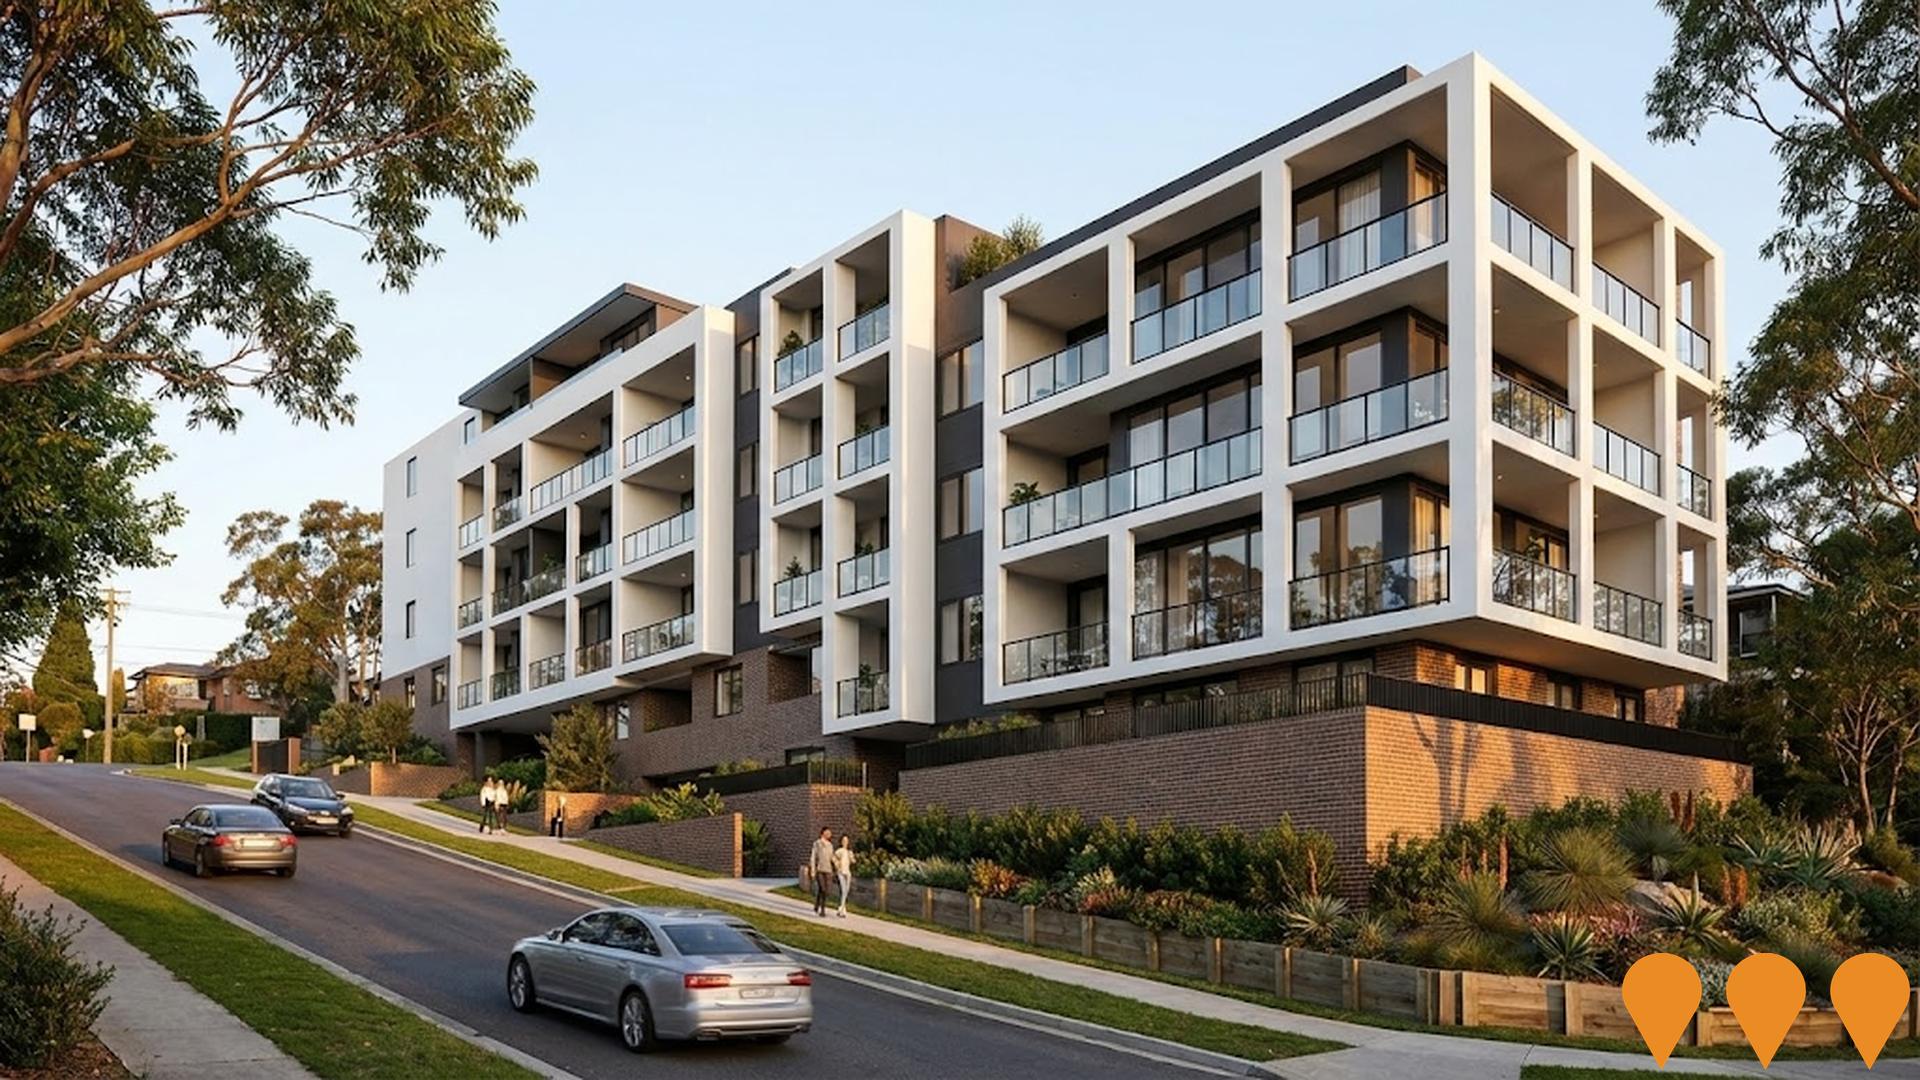
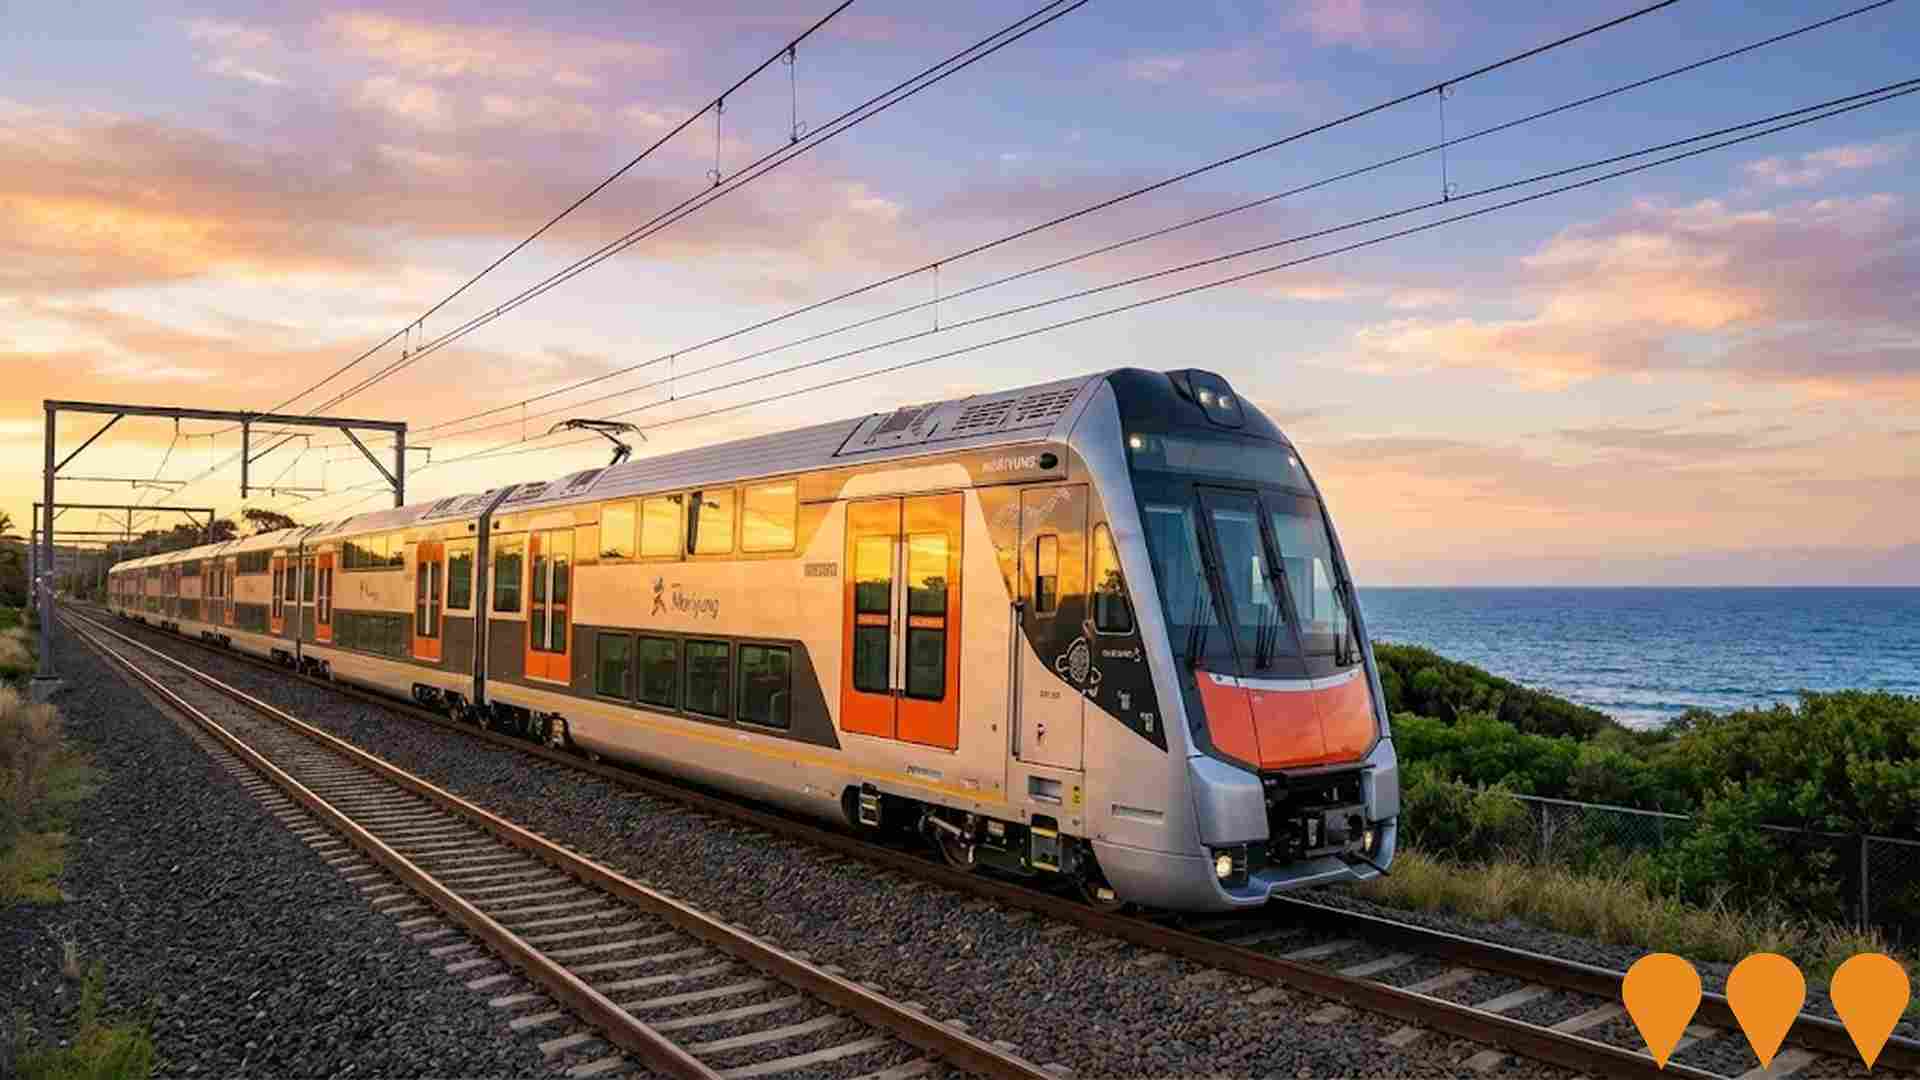
 Denotes AI-based impression for illustrative purposes only, not to be taken as definitive under any circumstances. Please follow links and conduct other investigations from the project's source for actual imagery. Developers and project owners wishing us to use original imagery please Contact Us and we will do so.
Frequently Asked Questions - Infrastructure
Greater Macarthur Growth Area
The Greater Macarthur Growth Area is one of NSW's priority growth areas, encompassing the Glenfield to Macarthur urban renewal corridor and new land release precincts at Gilead, Appin and West Appin. It is planned to deliver approximately 58,000 new homes and support around 40,000 new jobs over the next 20-30 years, with planning and infrastructure coordination and environmental conservation ongoing.
Wilton Growth Area
The Wilton Growth Area is a NSW Government Priority Growth Area planned to ultimately deliver around 19,000 new homes and support approximately 20,000 jobs over the next 30-40 years. It comprises multiple precincts being progressively rezoned and developed to create a series of connected, sustainable towns with housing diversity, schools, employment lands, open space and supporting infrastructure.
Illawarra Offshore Wind Zone
Commonwealth-declared offshore wind zone located 20-45 km off the Illawarra coast between Wombarra and Kiama, NSW. Covers 1,022 kmý with potential for approximately 2.9 GW of generation capacity. Declared on 15 June 2024. Feasibility licence applications closed 15 August 2024. As of December 2025, the Minister granted the first feasibility licence to Corio Generation Australia for the full 1,022 kmý area on 12 December 2025, marking the first offshore wind licence awarded in Australia.

Sydney Metro
Australia's biggest public transport infrastructure program, delivering four new metro railway lines (City & Southwest, West, Western Sydney Airport, and extensions). As of December 2025, the City & Southwest line (M1) is fully operational from Chatswood to Sy1 Sydenham-Bankstown conversion is under construction with target opening 2026-2027. Sydney Metro West tunnelling is over 70% complete with all TBMs now at or past Parramatta, targeted for 2032 opening. Western Sydney Airport line civil works and station construction are progressing with services planned for airport opening in late 2026.

Low and Mid-Rise Housing Policy
State-wide NSW planning reforms via amendments to the State Environmental Planning Policy to enable more diverse low and mid-rise housing (dual occupancies, terraces, townhouses, manor houses and residential flat buildings up to 6 storeys) in well-located areas within 800 m of selected train, metro and light-rail stations and town centres. Stage 1 (dual occupancies in R2 zones statewide) commenced 1 July 2024. Stage 2 (mid-rise apartments, terraces and dual occupancies near stations) commenced 28 February 2025. Expected to facilitate up to 112,000 additional homes over the next five years.
Mariyung Fleet (New Intercity Fleet)
The Mariyung Fleet is a 610-carriage double-deck electric train fleet being delivered by RailConnect NSW (UGL, Hyundai Rotem, Mitsubishi Electric Australia) for Transport for NSW. Named after the Darug word for emu, the fleet commenced passenger services on the Central Coast & Newcastle Line on 3 December 2024, followed by the Blue Mountains Line on 13 October 2025. Services on the South Coast Line are scheduled to commence in 2026. The fleet features modern amenities including spacious 2x2 seating, charging ports, improved accessibility with wheelchair spaces and accessible toilets, CCTV emergency help points, and dedicated spaces for luggage, prams and bicycles. The trains operate in flexible 4-car, 6-car, 8-car or 10-car formations. The fleet replaces aging V-set trains that entered service in the 1970s and serves approximately 26 million passenger journeys annually across the electrified intercity network. Supporting infrastructure includes the new Kangy Angy Maintenance Facility, platform extensions, and signaling upgrades at multiple stations.
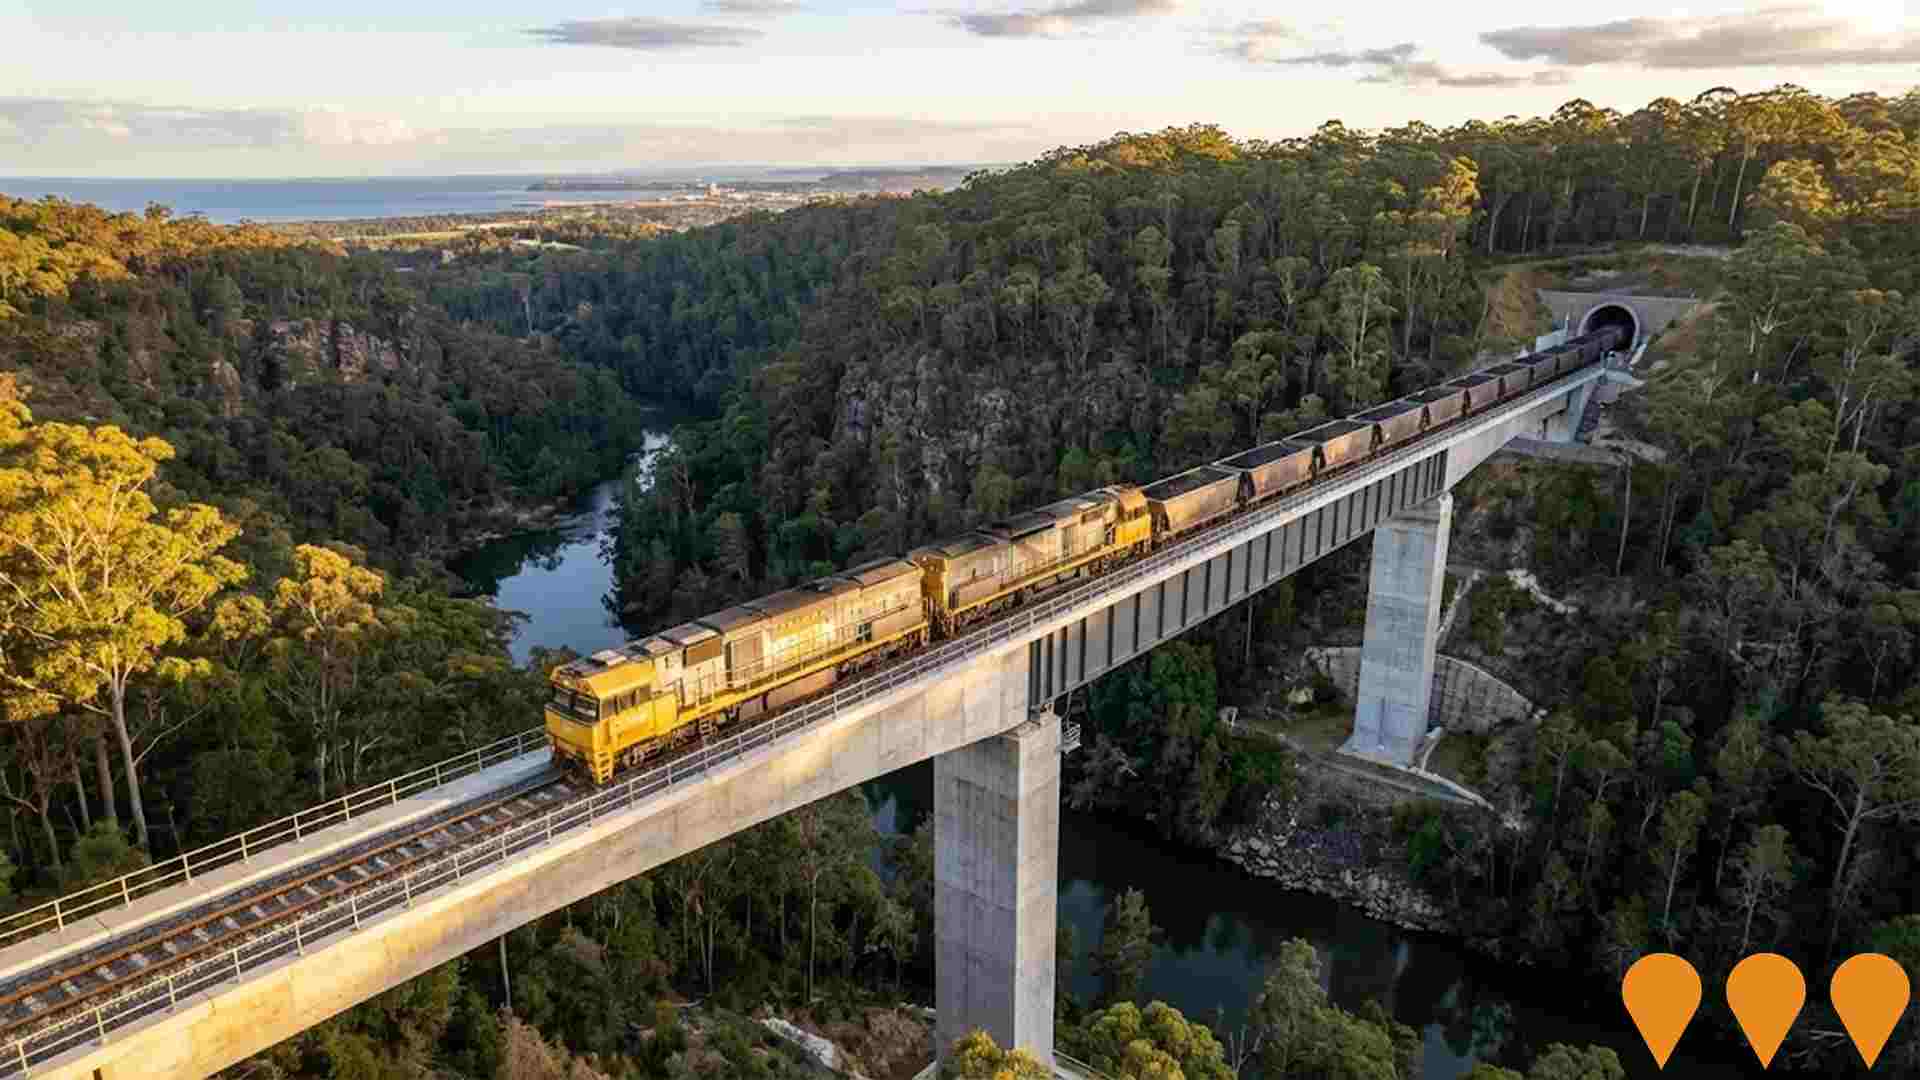
Maldon to Dombarton Freight Rail Line
Proposed 35 km single-track freight rail link connecting Maldon (on the Main South Line near Picton) to Dombarton (near Port Kembla). The project includes a 4 km tunnel under the Avon escarpment and major bridges over the Nepean and Cordeaux Rivers. Partial earthworks were completed in the 1980s before construction was halted in 1988. The corridor remains reserved. Renewed advocacy since 2024 (branded SWIRL - South West Illawarra Rail Link) seeks to connect Port Kembla with south-west Sydney and Western Sydney International Airport, but no funding has been committed in the 2025-26 NSW Budget or Federal Infrastructure Investment Pipeline.
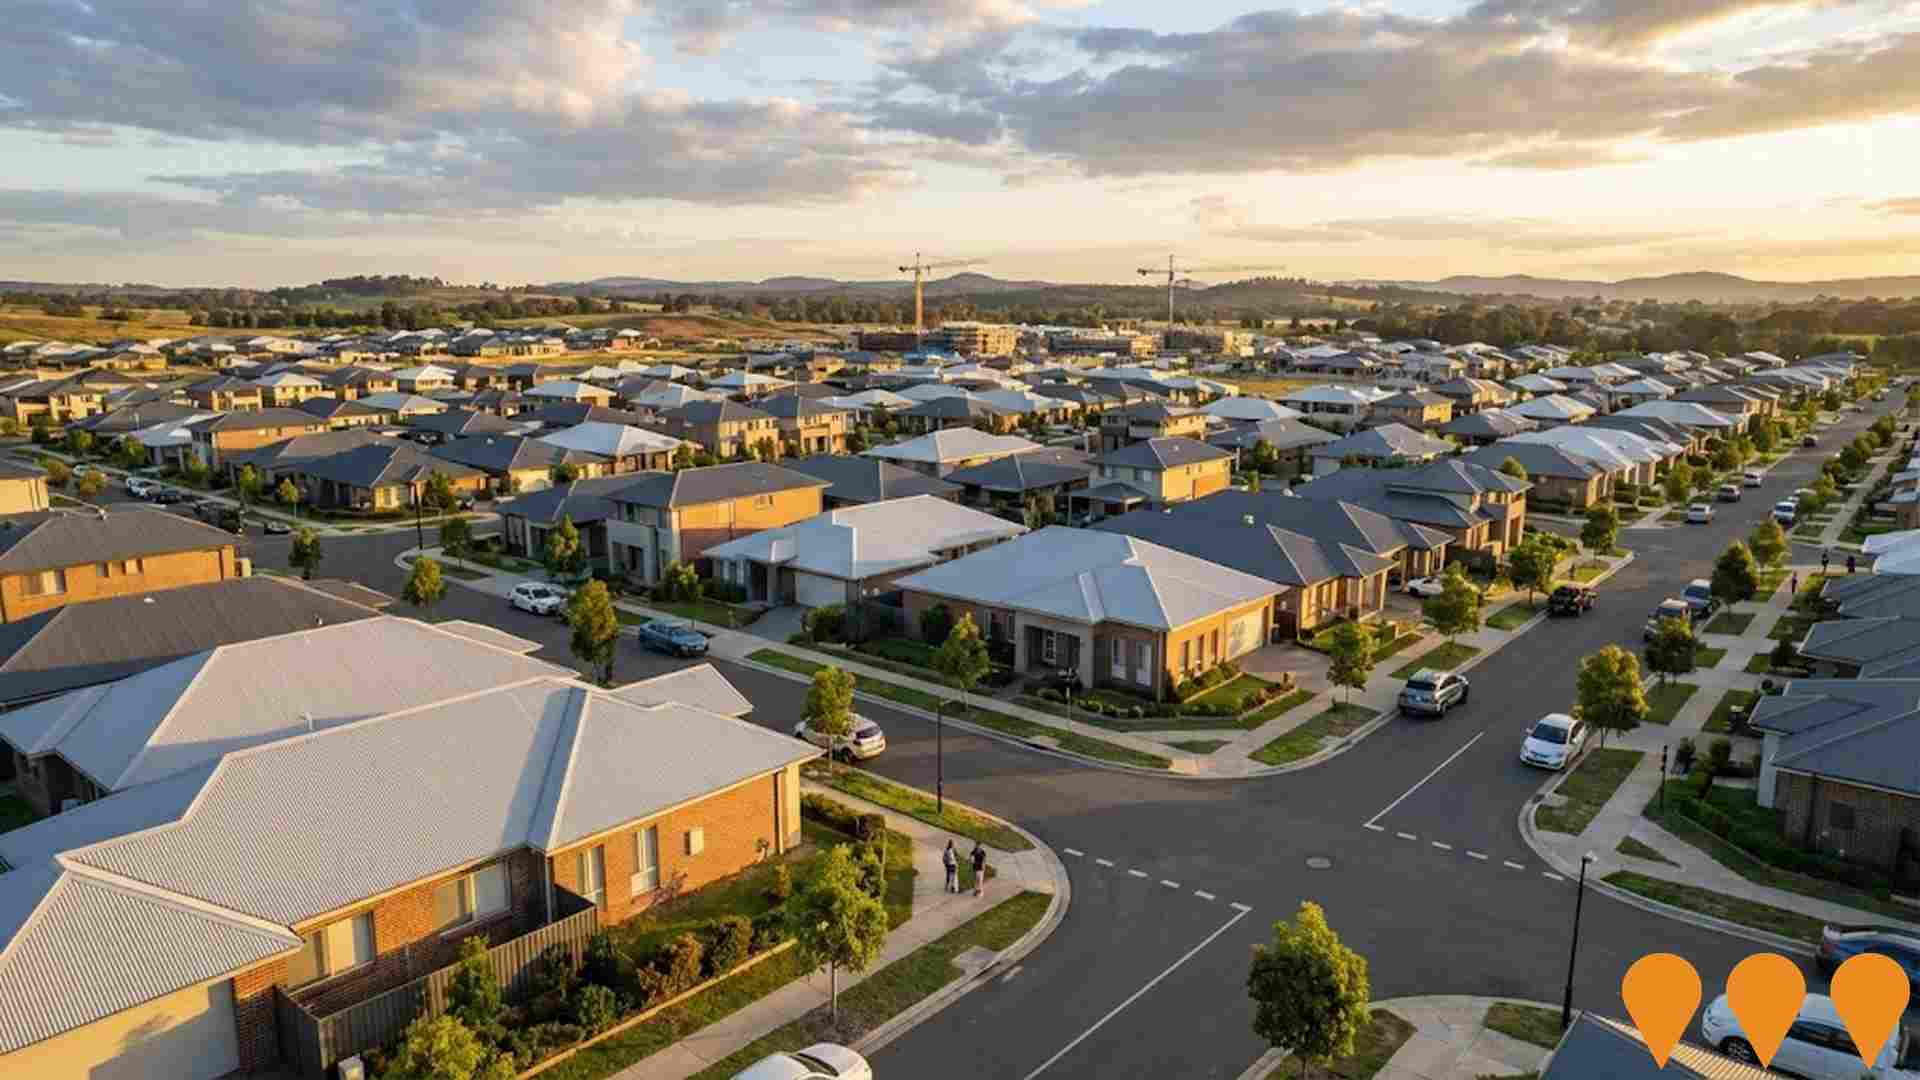
Wilton Growth Area - North Wilton Precinct
Large-scale residential release area delivering thousands of new homes as part of the broader Wilton Growth Area, with multiple developers active and first residents already moved in.
Employment
Bargo ranks among the top 25% of areas assessed nationally for overall employment performance
Bargo has a balanced workforce with representation across white and blue collar jobs. The construction sector is notable, with an unemployment rate of 2.7% and estimated employment growth of 5.2% in the past year as of September 2025.
There are 3,511 residents employed, with an unemployment rate of 1.4% below Greater Sydney's rate of 4.2%. Workforce participation is similar to Greater Sydney's 60.0%. Key industries include construction, health care & social assistance, and retail trade. Construction employment is particularly high, at 1.8 times the regional level.
Conversely, professional & technical services have lower representation at 4.0% compared to the regional average of 11.5%. Employment opportunities locally may be limited, as indicated by Census data comparing working population to resident population. Between September 2024 and September 2025, employment levels increased by 5.2%, while labour force also grew by 5.2%, keeping the unemployment rate relatively stable at 2.7%. In comparison, Greater Sydney recorded employment growth of 2.1% and labour force growth of 2.4%, with unemployment rising to 4.2%. State-level data from NSW as of 25-Nov-25 shows employment contracted by 0.03%, with the state unemployment rate at 3.9%, compared to the national rate of 4.3%. National employment forecasts from Jobs and Skills Australia, covering May-25 to May-30 and May-35, suggest overall growth of 6.6% over five years and 13.7% over ten years. Applying these projections to Bargo's employment mix indicates local employment should increase by 5.9% over five years and 12.5% over ten years, assuming constant population projections for illustrative purposes.
Frequently Asked Questions - Employment
Income
The economic profile demonstrates above-average performance, with income metrics exceeding national benchmarks based on AreaSearch comparative assessment
The Bargo SA2 had a median taxpayer income of $52,574 and an average of $64,201 in the financial year 2022, according to postcode level ATO data aggregated by AreaSearch. This is comparable to national averages but lower than Greater Sydney's median income of $56,994 and average income of $80,856. By September 2025, estimates suggest the median income will be approximately $59,204 and the average will be around $72,297, based on a 12.61% growth in wages since financial year 2022. In Bargo, incomes ranked modestly between the 41st and 55th percentiles according to the 2021 Census figures. The income distribution shows that 31.8% of locals (1,996 people) fell within the $1,500 - 2,999 category. Housing costs consumed 16.8% of income, but disposable income remained at the 55th percentile. The area's SEIFA income ranking placed it in the 5th decile.
Frequently Asked Questions - Income
Housing
Bargo is characterized by a predominantly suburban housing profile, with above-average rates of outright home ownership
In Bargo, as per the latest Census, 91.3% of dwellings were houses, with the remaining 8.8% being semi-detached, apartments, or other types. This compares to Sydney metropolitan areas where 94.1% were houses and 5.9% were other dwellings. Home ownership in Bargo stood at 35.2%, with mortgaged dwellings at 48.3% and rented ones at 16.5%. The median monthly mortgage repayment was $2,167, lower than the Sydney metro average of $2,318. The median weekly rent in Bargo was $415, matching the Sydney metro figure. Nationally, Bargo's mortgage repayments exceeded the Australian average of $1,863, and rents were higher than the national figure of $375.
Frequently Asked Questions - Housing
Household Composition
Bargo features high concentrations of family households, with a fairly typical median household size
Family households constitute 78.3% of all households, including 37.6% couples with children, 28.8% couples without children, and 11.2% single parent families. Non-family households comprise the remaining 21.7%, with lone person households at 20.4% and group households making up 1.3%. The median household size is 2.9 people, aligning with Greater Sydney's average.
Frequently Asked Questions - Households
Local Schools & Education
Educational outcomes in Bargo fall within the lower quartile nationally, indicating opportunities for improvement in qualification attainment
The area has university qualification rates of 12.7%, significantly lower than the Greater Sydney average of 38.0%. Bachelor degrees are most common at 8.8%, followed by postgraduate qualifications (2.2%) and graduate diplomas (1.7%). Vocational credentials are prominent, with 44.2% of residents aged 15+ holding them - advanced diplomas at 9.7% and certificates at 34.5%. Educational participation is high, with 28.7% of residents currently enrolled in formal education, including 11.4% in primary, 9.0% in secondary, and 2.4% in tertiary education.
Educational participation is notably high, with 28.7% of residents currently enrolled in formal education. This includes 11.4% in primary education, 9.0% in secondary education, and 2.4% pursuing tertiary education.
Frequently Asked Questions - Education
Schools Detail
Nearby Services & Amenities
Transport
Transport servicing is good compared to other areas nationally based on assessment of service frequency, route connectivity and accessibility
Bargo has 204 active public transport stops, serving a mix of train and bus services. These stops are covered by 39 different routes, offering a total of 2,043 weekly passenger trips. The average distance from residents to the nearest stop is 158 meters, indicating excellent accessibility.
On average, there are 291 trips per day across all routes, translating to about 10 weekly trips per individual stop.
Frequently Asked Questions - Transport
Transport Stops Detail
Health
Health performance in Bargo is lower than average with common health conditions somewhat prevalent across both younger and older age cohorts
Bargo faces significant health challenges.
Common health conditions are prevalent across both younger and older age cohorts. The rate of private health cover is approximately 52%, higher than the average SA2 area. This covers about 3,258 people. The most common medical conditions in the area are arthritis and asthma, impacting 10.0% and 8.5% of residents respectively. 65.2% of residents declare themselves completely clear of medical ailments, compared to 68.7% across Greater Sydney. As of 2016, 19.7% of residents are aged 65 and over (1,235 people), higher than the 16.5% in Greater Sydney. Health outcomes among seniors present some challenges, broadly in line with the general population's health profile.
Frequently Asked Questions - Health
Cultural Diversity
Bargo is considerably less culturally diverse than average when assessed alongside AreaSearch's national rankings for language and cultural background related metrics
Bargo had a lower than average cultural diversity, with 88.3% of its population born in Australia and 92.3% being citizens. English was the language spoken at home by 94.2%. Christianity was the predominant religion in Bargo, making up 63.1%, which is similar to Greater Sydney's 63.0%.
The top three ancestry groups were Australian (32.7%), English (29.0%), and Irish (7.0%). Notably, Maltese, Hungarian, and Macedonian ethnicities had higher representations in Bargo compared to the regional averages: Maltese at 2.7% vs 2.3%, Hungarian at 0.5% vs 0.3%, and Macedonian at 0.4% vs 0.2%.
Frequently Asked Questions - Diversity
Age
Bargo's population is slightly older than the national pattern
Bargo has a median age of 40, which is slightly higher than Greater Sydney's figure of 37 and Australia's figure of 38. The 65-74 age cohort is notably over-represented in Bargo at 10.6%, compared to the Greater Sydney average, while the 25-34 age group is under-represented at 9.5%. Between 2021 and present, the 15-24 age group has grown from 12.8% to 14.2% of the population, while the 75-84 cohort increased from 6.0% to 7.1%. Conversely, the 5-14 age group has declined from 14.6% to 13.8%. By 2041, demographic modeling suggests significant changes in Bargo's age profile. The 85+ age cohort is projected to increase by 177 people (139%), from 127 to 305. Notably, the combined 65+ age groups are expected to account for 87% of total population growth, reflecting the area's aging demographic trend. Meanwhile, the 45-54 and 0-4 age cohorts are projected to experience population declines.
