Chart Color Schemes
This analysis uses ABS Statistical Areas Level 2 (SA2) boundaries, which can materially differ from Suburbs and Localities (SAL) even when sharing similar names.
SA2 boundaries are defined by the Australian Bureau of Statistics and are designed to represent communities for statistical reporting (e.g., census and ERP).
Suburbs and Localities (SAL) represent commonly-used suburb/locality names (postal-style areas) and may use different geographic boundaries. For comprehensive analysis, consider reviewing both boundary types if available.
est. as @ -- *
ABS ERP | -- people | --
2021 Census | -- people
Sales Activity
Curious about local property values? Filter the chart to assess the volume and appreciation (including resales) trends and regional comparisons, or scroll to the map below view this information at an individual property level.
Find a Recent Sale
Sales Detail
Population
Yarra Valley is positioned among the lower quartile of areas assessed nationally for population growth based on AreaSearch's assessment of recent, and medium term trends
Yarra Valley's population, as per AreaSearch's analysis, is approximately 17,151 as of November 2025. This figure represents an increase of 352 people, a growth rate of 2.1%, since the 2021 Census which recorded a population of 16,799. The change is inferred from the estimated resident population of 17,059 in June 2024 and an additional 103 validated new addresses since the Census date. This results in a population density ratio of 23 persons per square kilometer. Yarra Valley's growth rate since the census (2.1%) is within 1.2 percentage points of the SA3 area's growth rate (3.3%), indicating competitive growth fundamentals. Natural growth contributed approximately 64.6% of overall population gains during recent periods.
AreaSearch adopts ABS/Geoscience Australia projections for each SA2 area, released in 2024 with a base year of 2022. For areas not covered by this data, AreaSearch uses the VIC State Government's Regional/LGA projections released in 2023, adjusting using a method of weighted aggregation of population growth from LGA to SA2 levels. Growth rates by age group are applied across all areas for years 2032 to 2041. Future trends suggest lower quartile growth, with the area expected to expand by 219 persons to 2041 based on the latest annual ERP population numbers, reflecting a total gain of 0.7% over the 17-year period.
Frequently Asked Questions - Population
Development
AreaSearch assessment of residential development drivers sees a low level of activity in Yarra Valley, placing the area among the bottom 25% of areas assessed nationally
Yarra Valley averaged approximately 39 new dwelling approvals per year. Over the past five financial years, from FY21 to FY25199 homes were approved, with an additional 14 approved so far in FY26. On average, around 0.5 new residents arrived annually for each new home over these five years, indicating that new construction is meeting or exceeding demand.
The average construction value of new properties was $307,000, aligning with regional trends. In FY26, commercial approvals totaled $16.9 million, suggesting balanced commercial development activity. Comparatively, Yarra Valley has about two-thirds the rate of new dwelling approvals per person compared to Greater Melbourne. Nationally, it ranks in the 25th percentile for areas assessed, offering limited choices for buyers and supporting demand for existing homes.
New building activity consists of 92% detached dwellings and 8% townhouses or apartments, maintaining the area's low-density character focused on family homes. With an estimated 644 people per dwelling approval, Yarra Valley's development environment is quiet and low-activity. By 2041, it is projected to grow by 127 residents, with current development patterns suggesting that new housing supply should meet demand, providing good conditions for buyers and potentially facilitating population growth beyond current projections.
Frequently Asked Questions - Development
Infrastructure
Yarra Valley has emerging levels of nearby infrastructure activity, ranking in the 31stth percentile nationally
Changes to local infrastructure significantly impact an area's performance. AreaSearch identified six projects expected to affect this region. Notable ones are Healesville Sanctuary Precinct Redevelopment (Stage 2), Graceburn Gardens Estate, Maroondah Highway & Don Road Interchange Upgrade, and The Memo Healesville Redevelopment. Below is a list of those most relevant.
Professional plan users can use the search below to filter and access additional projects.
INFRASTRUCTURE SEARCH
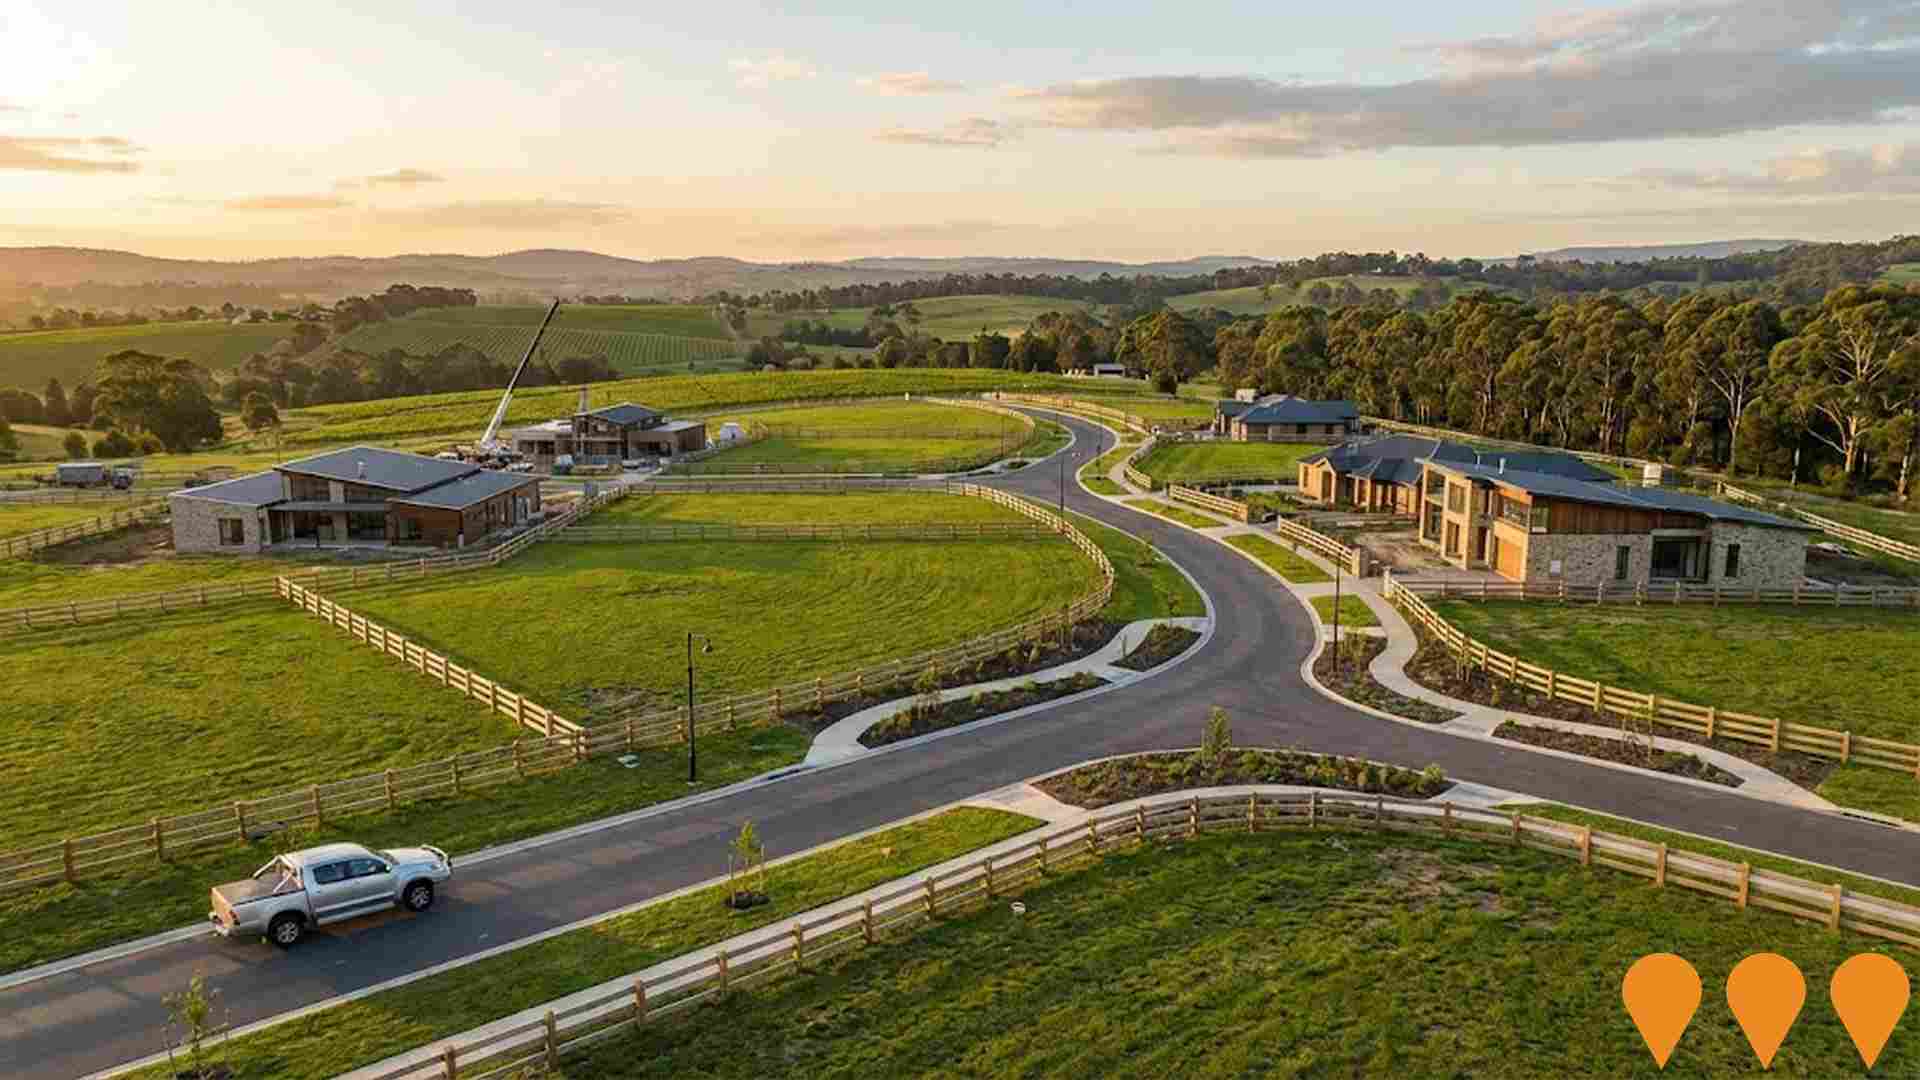
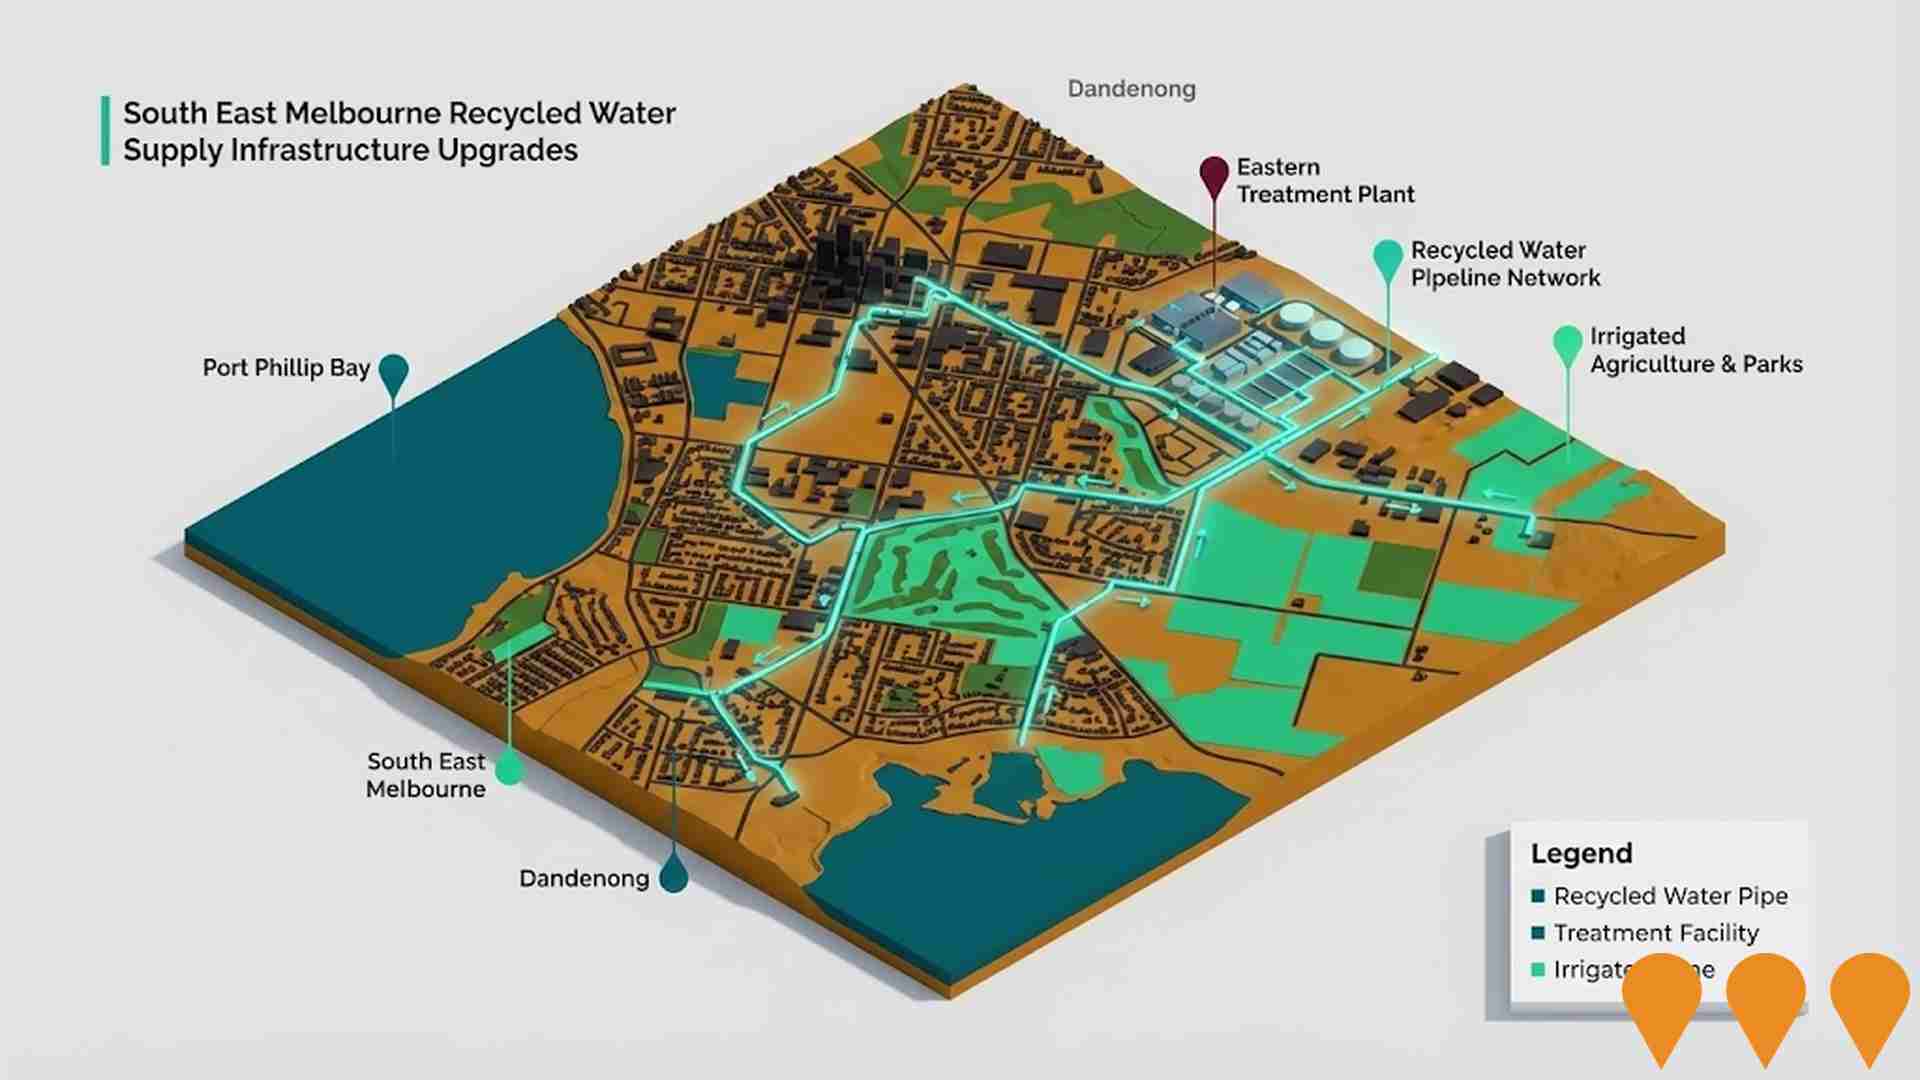
 Denotes AI-based impression for illustrative purposes only, not to be taken as definitive under any circumstances. Please follow links and conduct other investigations from the project's source for actual imagery. Developers and project owners wishing us to use original imagery please Contact Us and we will do so.
Frequently Asked Questions - Infrastructure
North East Link
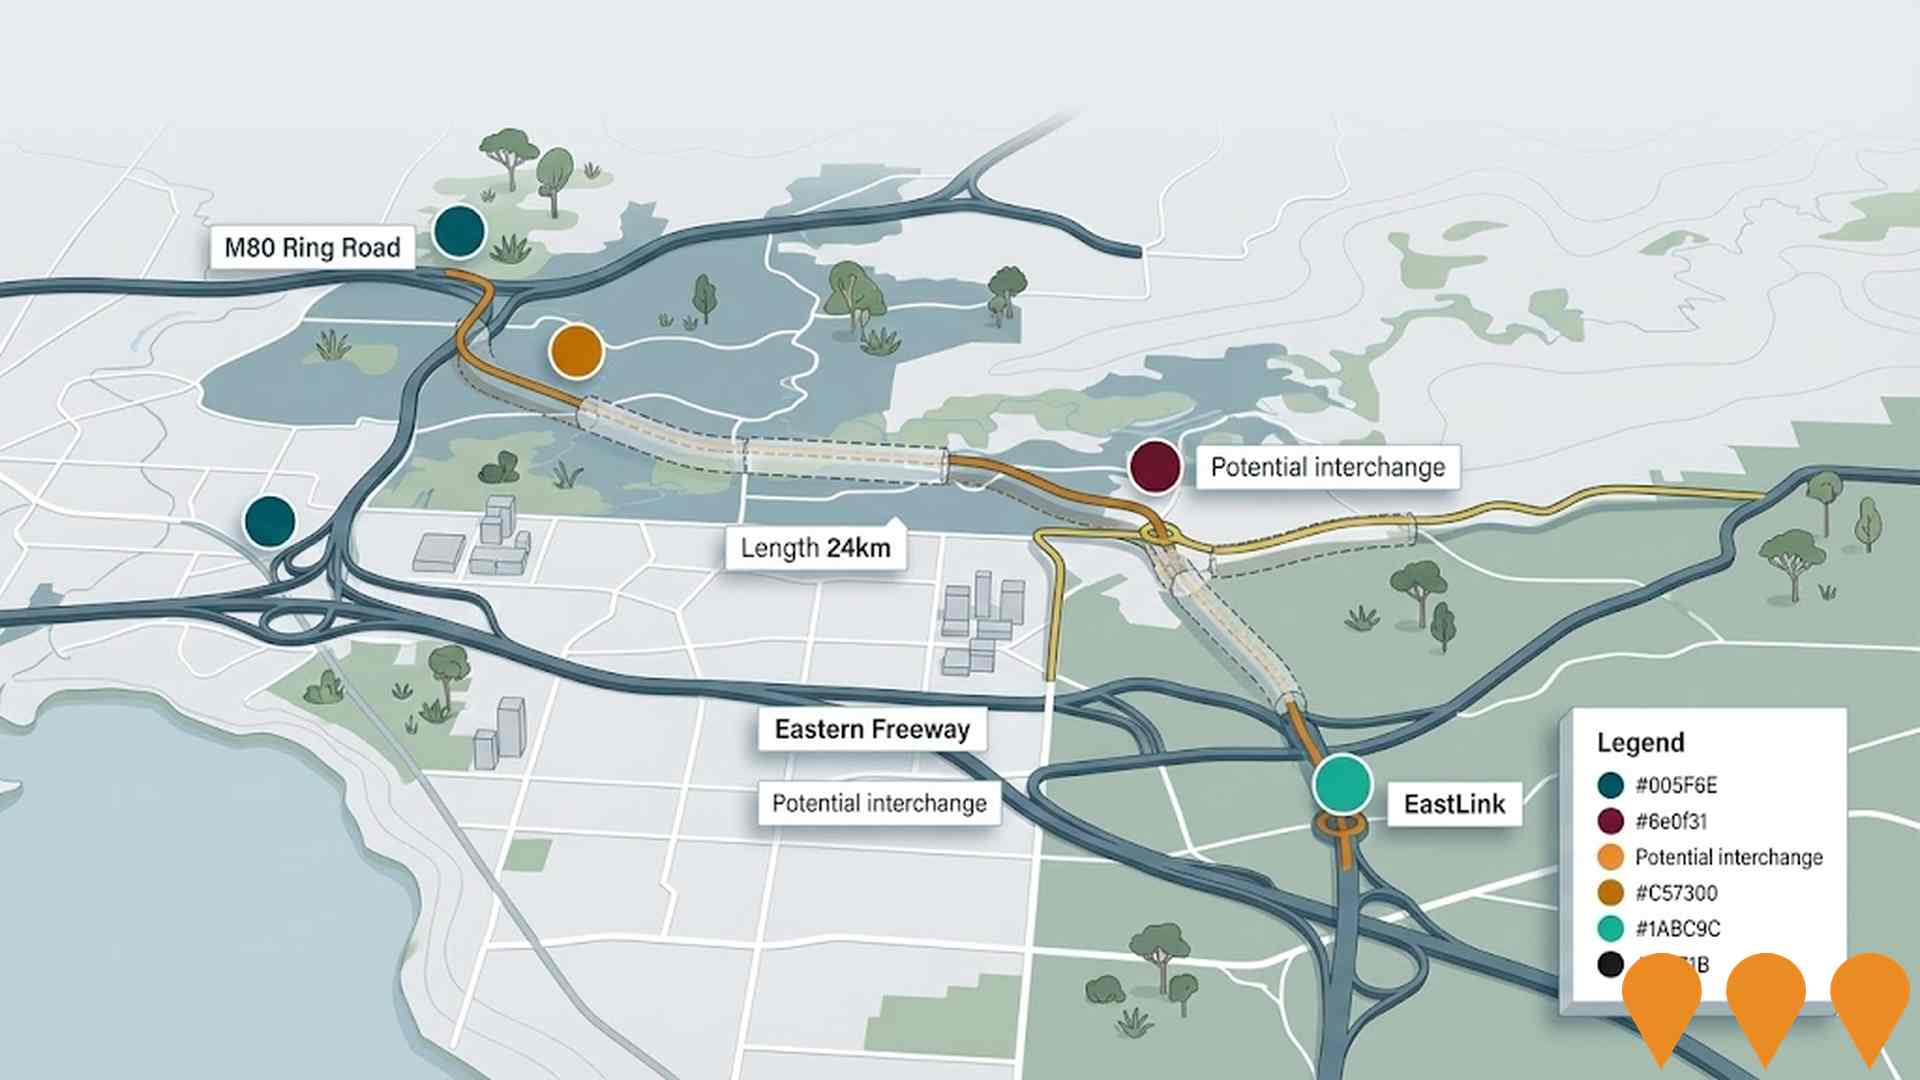
North East Link is Victoria's largest road transport project, delivering Australia's longest road tunnels: twin 6.5km three-lane tunnels connecting the M80 Ring Road at Greensborough/Watsonia to the Eastern Freeway at Bulleen, completing the Melbourne orbital freeway network. The $26.1 billion project (Spark Consortium PPP) will remove 15,000 trucks from local roads daily, cut travel times by up to 35 minutes for 135,000 vehicles per day, and includes major Eastern Freeway upgrades with new express lanes, Melbourne's first dedicated busway, new interchanges, a 2-hectare green bridge, wetlands, over 34km of new/upgraded walking and cycling paths, extensive parklands, and intelligent transport systems. Tunnelling commenced in 2024 with TBMs Zelda and Gillian; first permanent section (Bulleen Road Interchange) opened July 2025. Project on track for completion in 2028.
Healesville Sanctuary Precinct Redevelopment (Stage 2)
Major expansion and modernisation of Healesville Sanctuary to enhance visitor experiences and support critical wildlife conservation efforts. Recent works include new facilities for critically endangered species like the Mountain Pygmy Possum and threatened frogs, a Threatened Species Quarantine facility, a Raptor Recovery Flight Aviary, and an upgraded Australian Wildlife Health Centre Visitor Gallery. The overall redevelopment also focuses on improving visitor facilities and native animal exhibits.
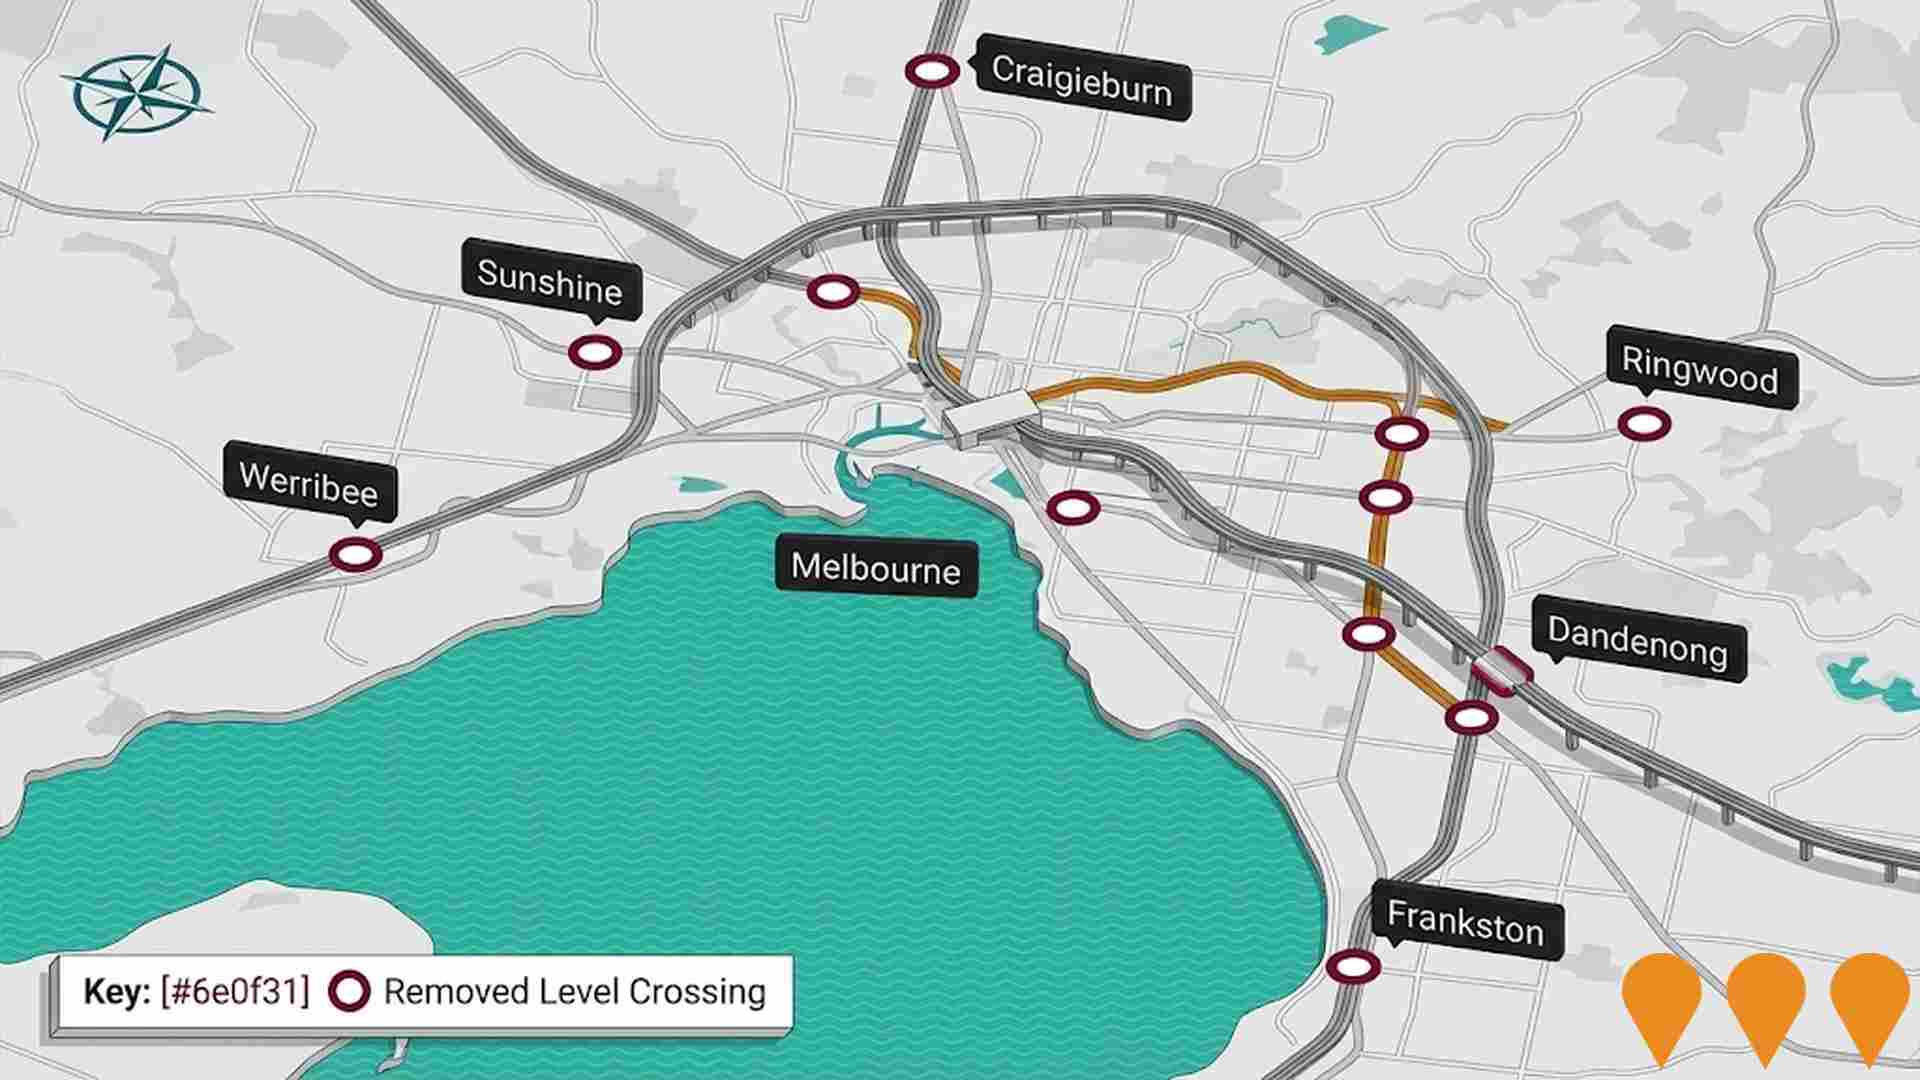
Level Crossing Removal Project (Melbourne)
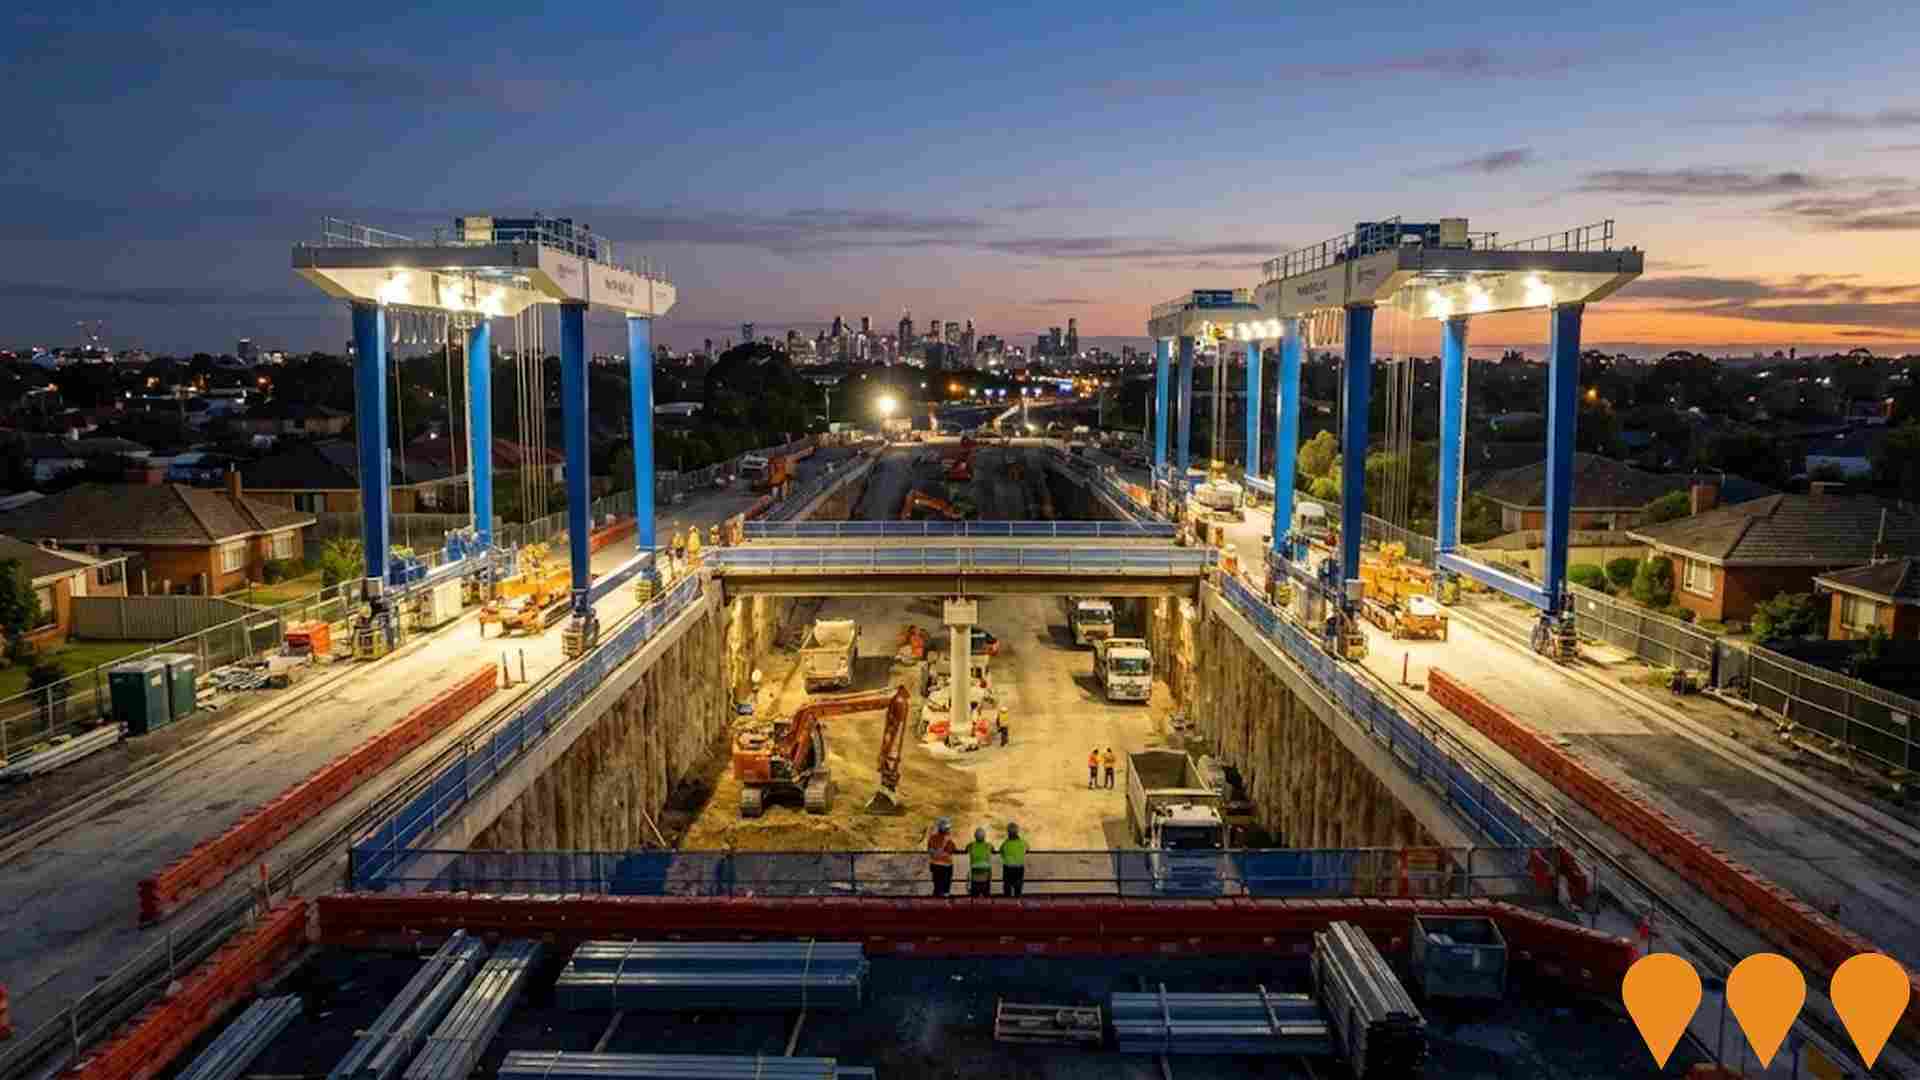
Program to remove 110 dangerous and congested level crossings across metropolitan Melbourne by 2030, with new or upgraded stations and open space created under elevated rail where suitable. 87 crossings were listed as removed as of late July 2025. The works are delivered under Victorias Big Build by the Victorian Infrastructure Delivery Authority (VIDA) through the Level Crossing Removal Project (LXRP).
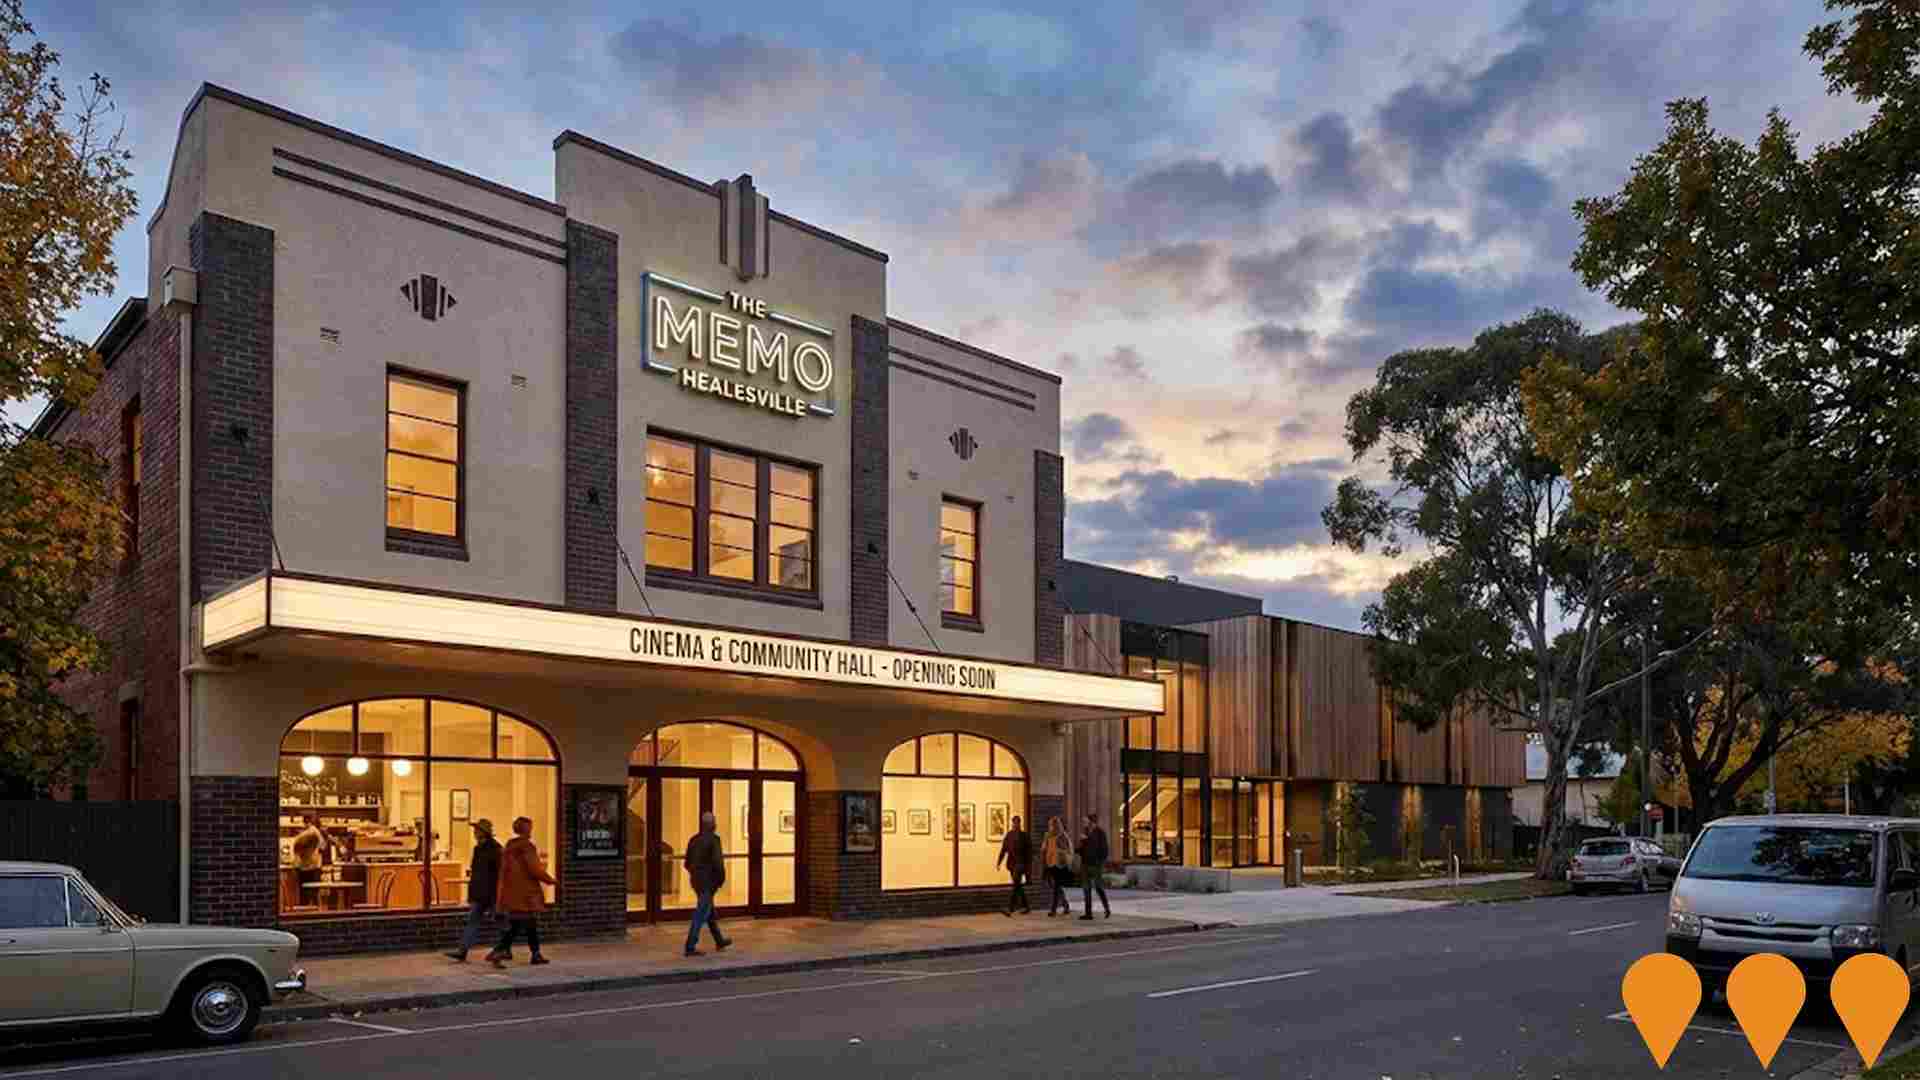
The Memo Healesville Redevelopment
Restoration and expansion of the historic 1930s art-deco cinema and community hall into a modern multi-purpose performing arts and function centre. The venue includes a retractable seating bank auditorium, a hydraulic orchestra pit lift, a gallery space, and multi-purpose hire rooms (Nan Francis Room, Billiard Room, Meeting Room).
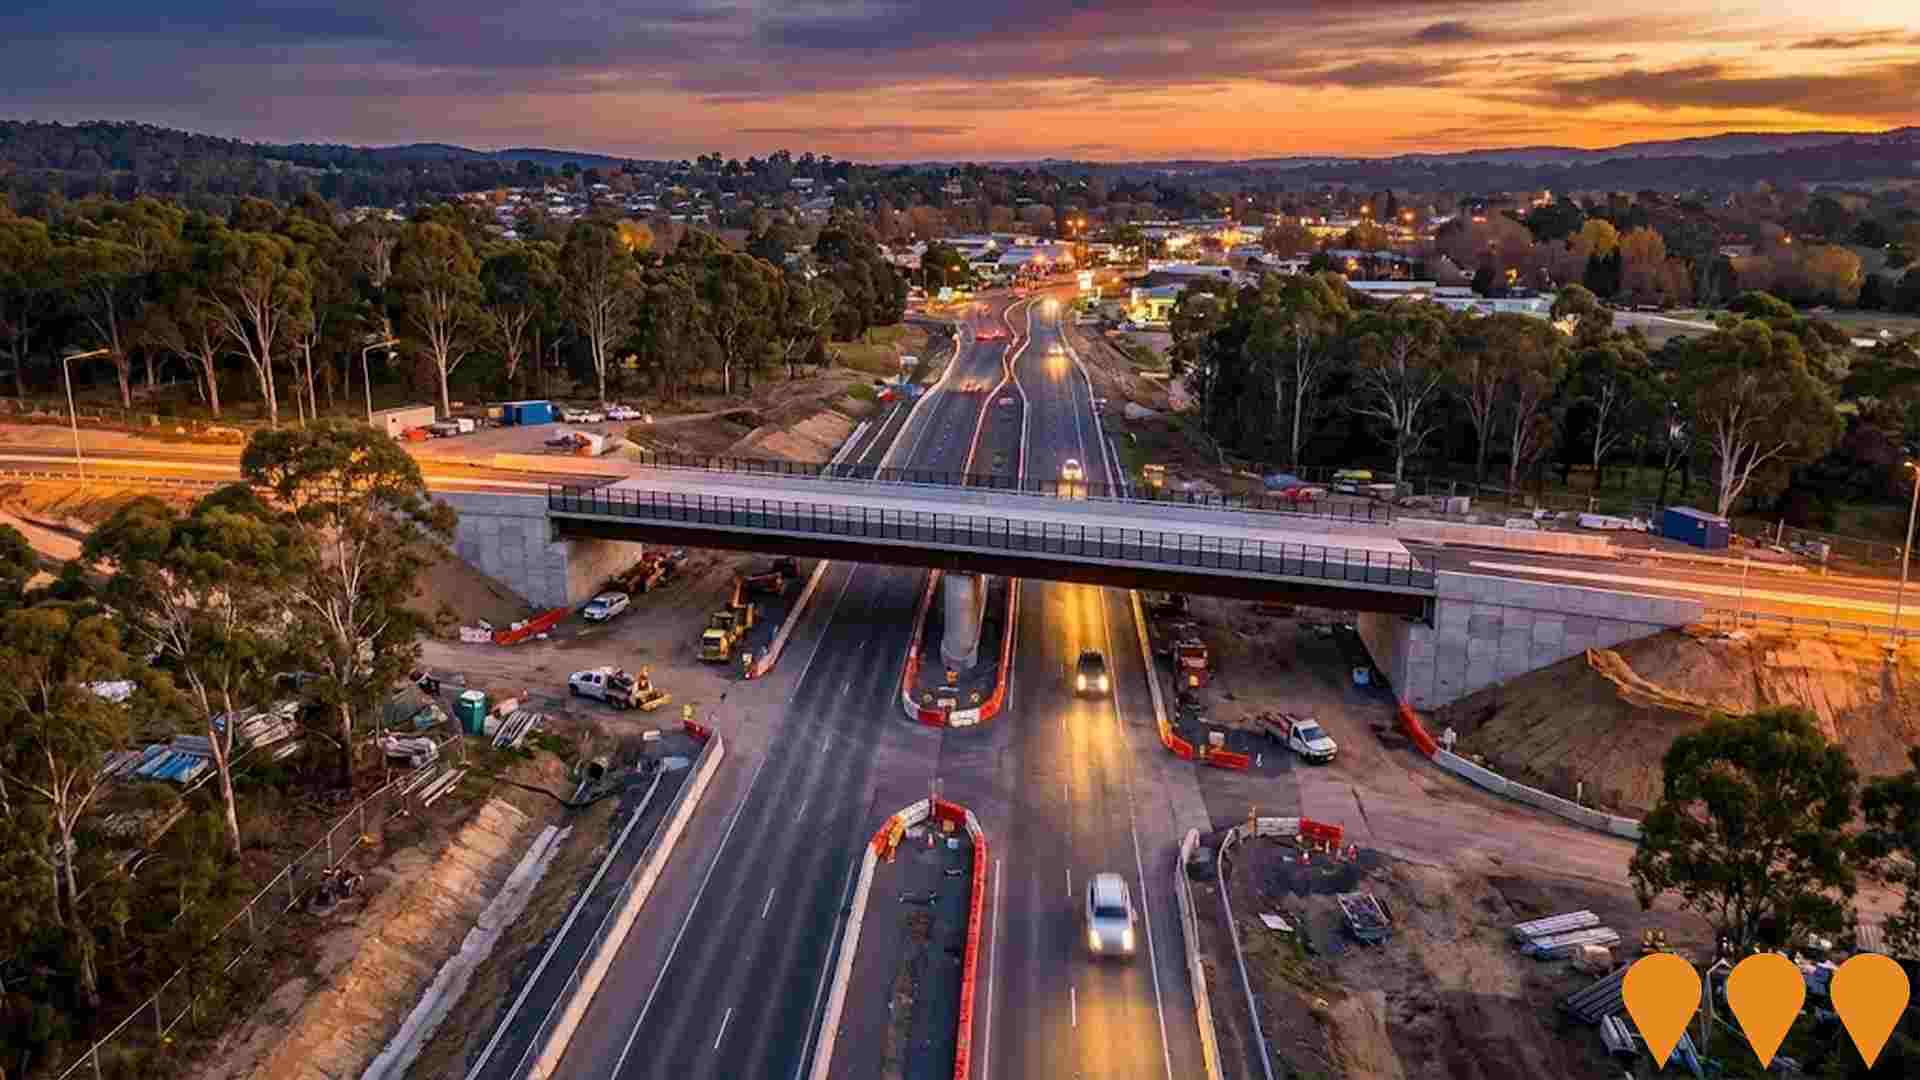
Maroondah Highway & Don Road Interchange Upgrade
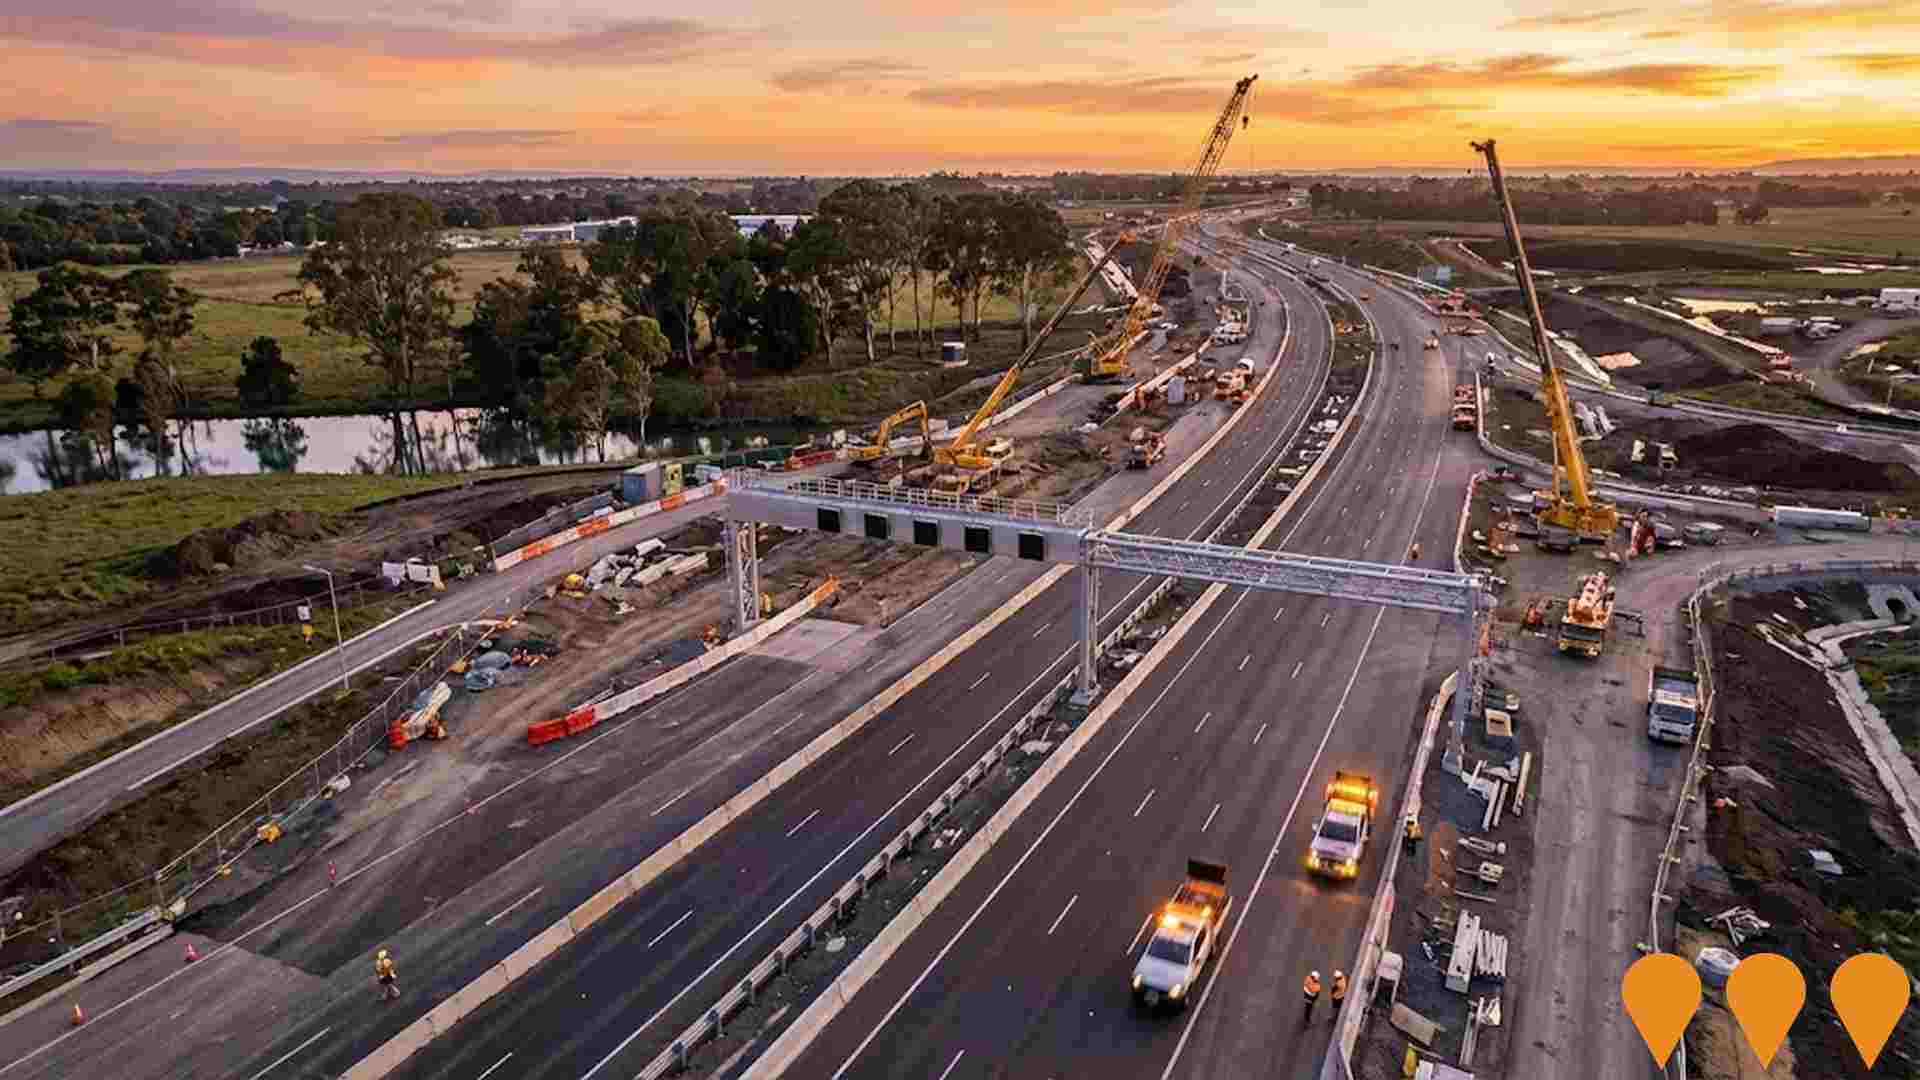
Major new interchange replacing the existing roundabout with a bridge over Maroondah Highway, which is intended to improve safety and traffic flow at one of Healesville's busiest intersections. Construction is expected to be completed in 2026.
Yarra Valley Railway Heritage Line Restoration
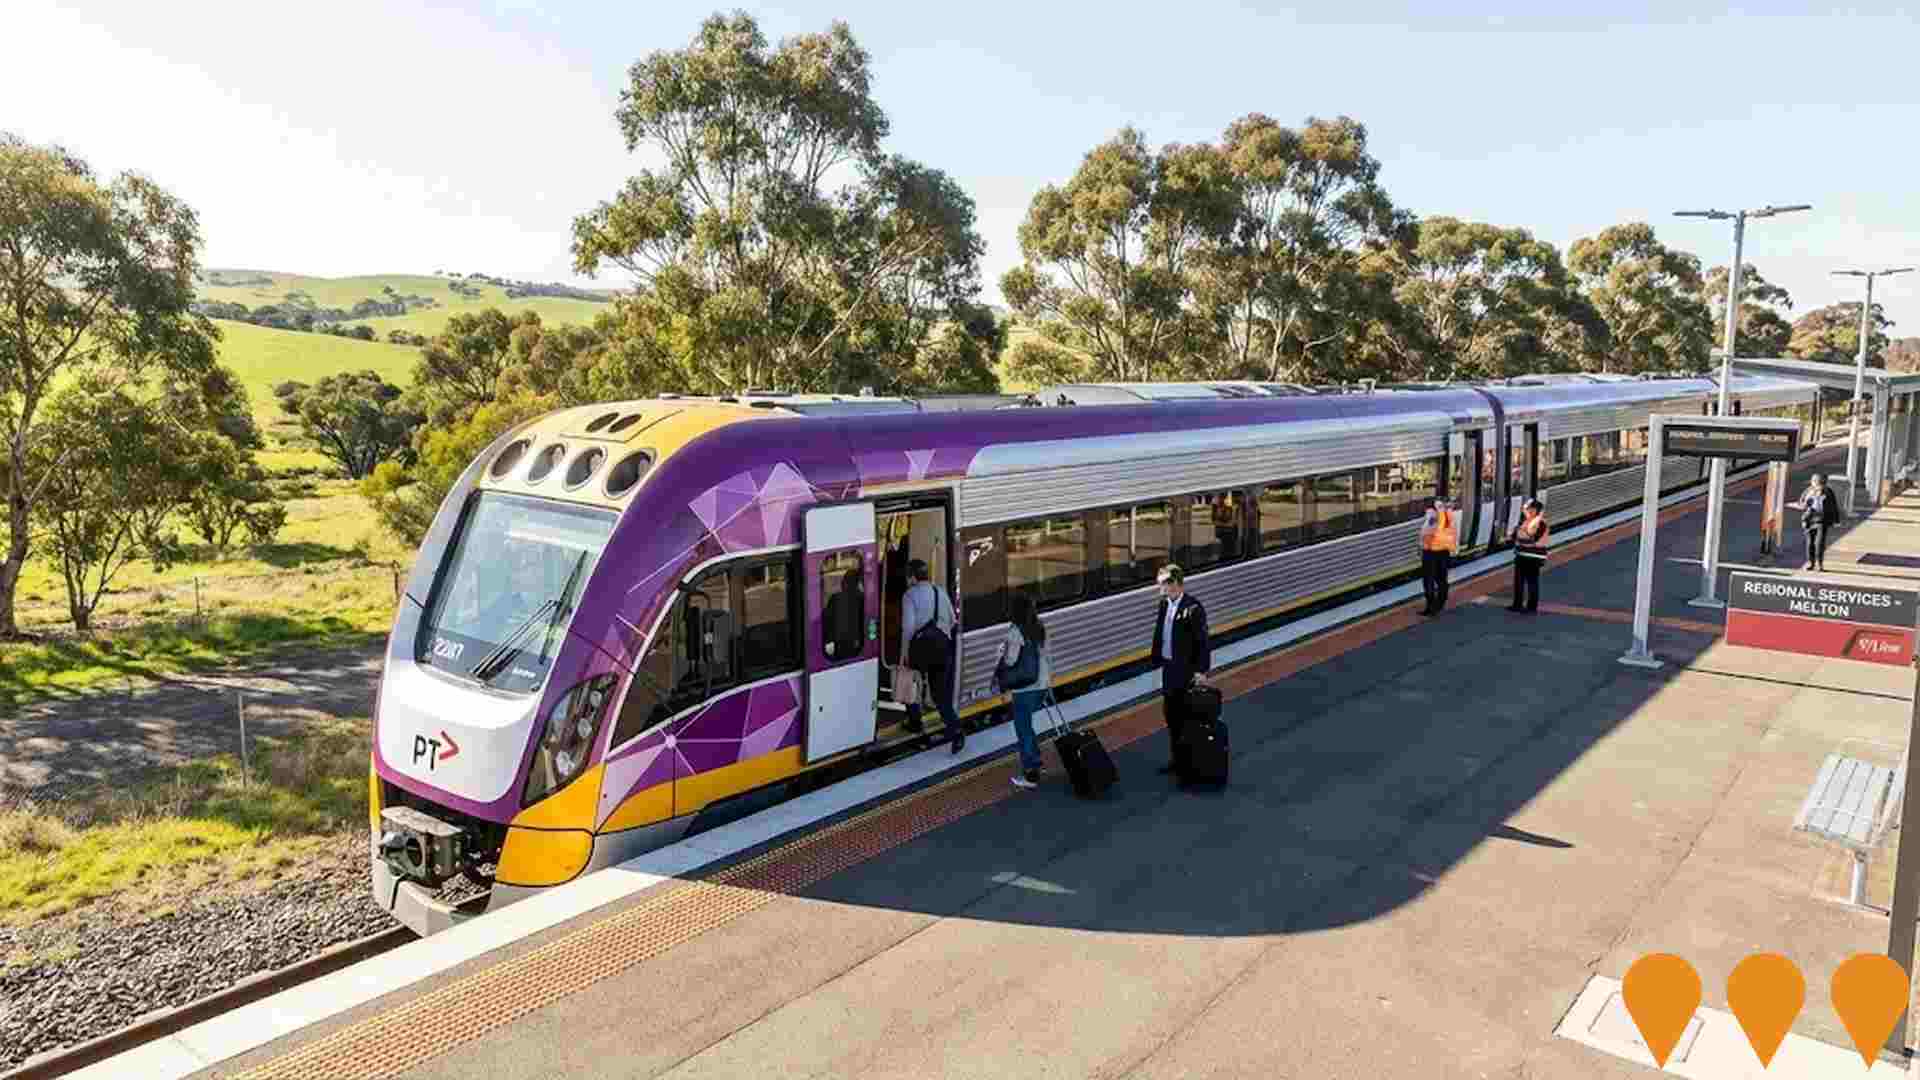
Restoration of historic railway line between Healesville and Yarra Glen for heritage tourism operations. Includes track restoration, station buildings, rolling stock maintenance, and tourist services to showcase regional railway heritage.
Graceburn Gardens Estate
Premium residential land estate offering large lifestyle blocks with Yarra Valley views. The project has been completed in stages, with lots likely fully released by 2024.
South East Melbourne Recycled Water Supply Infrastructure Upgrades
Upgrades to recycle more water in South East Melbourne for irrigation, improving water security and reducing demand for potable water amidst climate change and population growth.
Employment
Employment performance in Yarra Valley has been below expectations when compared to most other areas nationally
Yarra Valley's workforce is balanced across white and blue collar jobs. The construction sector has significant representation with an unemployment rate of 5.6% and estimated employment growth of 2.0% in the past year.
As of September 2025, 8,495 residents are employed, with an unemployment rate of 5.6%, which is 0.9% higher than Greater Melbourne's rate of 4.7%. Workforce participation in Yarra Valley is lower at 58.6% compared to Greater Melbourne's 64.1%. Leading industries include construction, health care & social assistance, and manufacturing. Construction is particularly strong with an employment share 1.9 times the regional level.
However, professional & technical services are under-represented at 4.4%, compared to 10.1% in Greater Melbourne. Employment opportunities appear limited locally based on Census data comparisons. Between September 2024 and September 2025, employment levels increased by 2.0% while the labour force grew by 0.8%, reducing the unemployment rate by 1.1 percentage points. In contrast, Greater Melbourne saw employment growth of 3.0% and a labour force increase of 3.3%, with a slight rise in unemployment. State-level data from VIC to 25-Nov-25 shows employment grew by 1.13% year-on-year, adding 41,950 jobs, with an unemployment rate of 4.7%. National forecasts suggest total employment will grow by 6.6% over five years and 13.7% over ten years. Applying these projections to Yarra Valley's employment mix indicates local growth should be around 6.0% over five years and 12.7% over ten years, assuming constant population projections.
Frequently Asked Questions - Employment
Income
Income levels sit below national averages according to AreaSearch assessment
In AreaSearch's latest postcode level ATO data for financial year 2022, Yarra Valley SA2 had a median income among taxpayers of $47,576 and an average of $57,366. This was lower than the national average. For comparison, Greater Melbourne had a median income of $54,892 and an average of $73,761. Based on Wage Price Index growth of 12.16% since financial year 2022, current estimates suggest approximately $53,361 (median) and $64,342 (average) as of September 2025. Census data indicates that household, family, and personal incomes in Yarra Valley rank modestly, between the 24th and 31st percentiles. Income distribution shows that the $1,500 - 2,999 earnings band captures 33.7% of the community (5,779 individuals), similar to the broader area where this cohort also represents 32.8%. Housing affordability pressures are severe in Yarra Valley, with only 83.7% of income remaining after housing costs, ranking at the 31st percentile.
Frequently Asked Questions - Income
Housing
Yarra Valley is characterized by a predominantly suburban housing profile, with above-average rates of outright home ownership
Yarra Valley's dwelling structures, as per the latest Census, comprised 95.6% houses and 4.5% other dwellings. In comparison, Melbourne metro had 93.8% houses and 6.3% other dwellings. Home ownership in Yarra Valley was at 37.6%, with mortgaged dwellings at 50.0% and rented ones at 12.5%. The median monthly mortgage repayment was $1,690, lower than Melbourne metro's $1,950 and the national average of $1,863. Median weekly rent in Yarra Valley was $315, substantially below Melbourne metro's $380 and the national figure of $375.
Frequently Asked Questions - Housing
Household Composition
Yarra Valley has a typical household mix, with a lower-than-average median household size
Family households constitute 70.9% of all households, including 30.0% couples with children, 27.8% couples without children, and 12.2% single parent families. Non-family households account for the remaining 29.1%, with lone person households at 26.7% and group households comprising 2.4%. The median household size is 2.5 people, which is smaller than the Greater Melbourne average of 2.7.
Frequently Asked Questions - Households
Local Schools & Education
Yarra Valley shows below-average educational performance compared to national benchmarks, though pockets of achievement exist
The area's university qualification rate is 16.5%, significantly lower than Greater Melbourne's average of 37.0%. This disparity presents both a challenge and an opportunity for targeted educational initiatives. Bachelor degrees are the most common university qualifications in the area at 11.1%, followed by postgraduate qualifications (2.7%) and graduate diplomas (2.7%). Vocational credentials are prevalent among residents aged 15 and above, with 44.1% holding such qualifications, including advanced diplomas (11.9%) and certificates (32.2%).
Educational participation is high, with 28.2% of residents currently enrolled in formal education. This includes primary education (10.5%), secondary education (8.6%), and tertiary education (2.8%).
Frequently Asked Questions - Education
Schools Detail
Nearby Services & Amenities
Transport
Transport servicing is low compared to other areas nationally based on assessment of service frequency, route connectivity and accessibility
The analysis of public transport in the Yarra Valley shows that there are currently 79 active transport stops operating. These stops serve a mix of bus routes, with two individual routes providing service. Together, these routes facilitate 266 weekly passenger trips.
The accessibility of transport is rated as limited, with residents typically situated 705 meters away from the nearest transport stop. On average, there are 38 trips per day across all routes, which equates to approximately three weekly trips per individual stop.
Frequently Asked Questions - Transport
Transport Stops Detail
Health
Health performance in Yarra Valley is lower than average with common health conditions somewhat prevalent across both younger and older age cohorts
Yarra Valley faces significant health challenges with common health conditions prevalent across both younger and older age cohorts. The rate of private health cover is very low at approximately 48% of the total population, around 8,283 people, compared to 52.4% across Greater Melbourne and the national average of 55.3%. The most common medical conditions are mental health issues affecting 10.3% of residents and arthritis impacting 9.6%, while 64.6% declare themselves completely clear of medical ailments, compared to 66.9% in Greater Melbourne.
The area has 21.2% of residents aged 65 and over, around 3,630 people, which is higher than the 19.4% in Greater Melbourne.
Frequently Asked Questions - Health
Cultural Diversity
Yarra Valley is considerably less culturally diverse than average when assessed alongside AreaSearch's national rankings for language and cultural background related metrics
Yarra Valley, surveyed in June 2016, had a population with 89.0% being citizens, 86.6% born in Australia, and 96.5% speaking English only at home. Christianity was the predominant religion, accounting for 34.1%. Judaism, though small at 0.1%, was proportionally represented compared to Greater Melbourne's 0.1%.
The top three ancestry groups were English (33.2%), Australian (30.9%), and Irish (8.6%). Notably, Dutch (3.1%) and Scottish (8.2%) were slightly overrepresented compared to regional averages of 3.2% and 8.0%, respectively. German ancestry was also somewhat higher at 3.8% versus the region's 3.6%.
Frequently Asked Questions - Diversity
Age
Yarra Valley's median age exceeds the national pattern
The median age in Yarra Valley is 43 years, which is higher than Greater Melbourne's average of 37 years and also exceeds the national average of 38 years. The age profile shows that those aged 65-74 years make up 12.3% of the population, while those aged 25-34 years constitute 10.7%. Since 2021, the 75 to 84 age group has increased from 5.4% to 7.0% of the population. Conversely, the 45 to 54 age group has decreased from 14.3% to 12.7%, and the 5 to 14 age group has dropped from 12.4% to 11.1%. By 2041, demographic projections indicate that the 75 to 84 age cohort will increase by 467 people (39%), rising from 1,202 to 1,670. Notably, the combined age groups of 65 and above will account for 95% of total population growth, reflecting Yarra Valley's aging demographic profile. Conversely, the 25 to 34 and 35 to 44 age cohorts are expected to experience population declines.

