Chart Color Schemes
This analysis uses ABS Statistical Areas Level 2 (SA2) boundaries, which can materially differ from Suburbs and Localities (SAL) even when sharing similar names.
SA2 boundaries are defined by the Australian Bureau of Statistics and are designed to represent communities for statistical reporting (e.g., census and ERP).
Suburbs and Localities (SAL) represent commonly-used suburb/locality names (postal-style areas) and may use different geographic boundaries. For comprehensive analysis, consider reviewing both boundary types if available.
est. as @ -- *
ABS ERP | -- people | --
2021 Census | -- people
Sales Activity
Curious about local property values? Filter the chart to assess the volume and appreciation (including resales) trends and regional comparisons, or scroll to the map below view this information at an individual property level.
Find a Recent Sale
Sales Detail
Population
Mooroolbark has seen population growth performance typically on par with national averages when looking at short and medium term trends
Mooroolbark's population, as of November 2025, is approximately 24,402. This figure reflects a growth of 1,256 people since the 2021 Census, which reported a population of 23,146. The increase is inferred from ABS data: an estimated resident population of 24,296 as of June 2024 and an additional 312 validated new addresses since the Census date. This results in a population density of 1,945 persons per square kilometer, above the national average assessed by AreaSearch. Mooroolbark's growth rate of 5.4% since the 2021 census exceeded both the SA3 area (3.3%) and the SA4 region. Natural growth contributed approximately 54.4% of overall population gains during recent periods.
AreaSearch uses ABS/Geoscience Australia projections for each SA2 area, released in 2024 with a base year of 2022. For areas not covered by this data, AreaSearch utilises VIC State Government's Regional/LGA projections from 2023, adjusted using weighted aggregation methods to SA2 levels. Growth rates by age group are applied across all areas for years 2032 to 2041. Based on the latest annual ERP population numbers, Mooroolbark is expected to grow by approximately 2,574 persons by 2041, reflecting a total gain of 10.0% over the 17-year period.
Frequently Asked Questions - Population
Development
Recent residential development output has been above average within Mooroolbark when compared nationally
Mooroolbark has seen approximately 126 new homes approved annually. Between financial years FY-21 and FY-25, a total of 633 homes were approved, with an additional 34 approved so far in FY-26. Over these five years, an average of 0.7 people moved to the area per dwelling built.
New supply has kept pace with or exceeded demand, providing ample buyer choice and creating capacity for population growth beyond current forecasts. The average construction value of new properties is $300,000, aligning with regional patterns. In FY-26, commercial approvals totaled $66.5 million, indicating robust local business investment. Compared to Greater Melbourne, Mooroolbark has slightly more development, at 35.0% above the regional average per person over the past five years. This balance supports buyer choice while maintaining current property values.
New building activity comprises 41.0% detached houses and 59.0% medium and high-density housing, marking a shift from the area's existing housing composition of 95.0% houses. This change reflects decreasing availability of developable sites and evolving lifestyles that require more diverse, affordable housing options. Mooroolbark has a low density characteristic, with around 230 people per dwelling approval. Population forecasts indicate an increase of 2,430 residents by 2041, based on the latest AreaSearch quarterly estimate. Given current development patterns, new housing supply should readily meet demand, offering favorable conditions for buyers and potentially facilitating population growth beyond current projections.
Frequently Asked Questions - Development
Infrastructure
Mooroolbark has strong levels of nearby infrastructure activity, ranking in the top 40% nationally
A total of 37 infrastructure projects have been identified by AreaSearch as potentially impacting the area. These include notable developments such as Cloverlea Estate, Summerset Chirnside Park Retirement Village, Little Scribblers Mooroolbark Early Learning Centre, and the 270 Maroondah Highway Industrial Development. The following list details those projects likely to have the most relevance.
Professional plan users can use the search below to filter and access additional projects.
INFRASTRUCTURE SEARCH
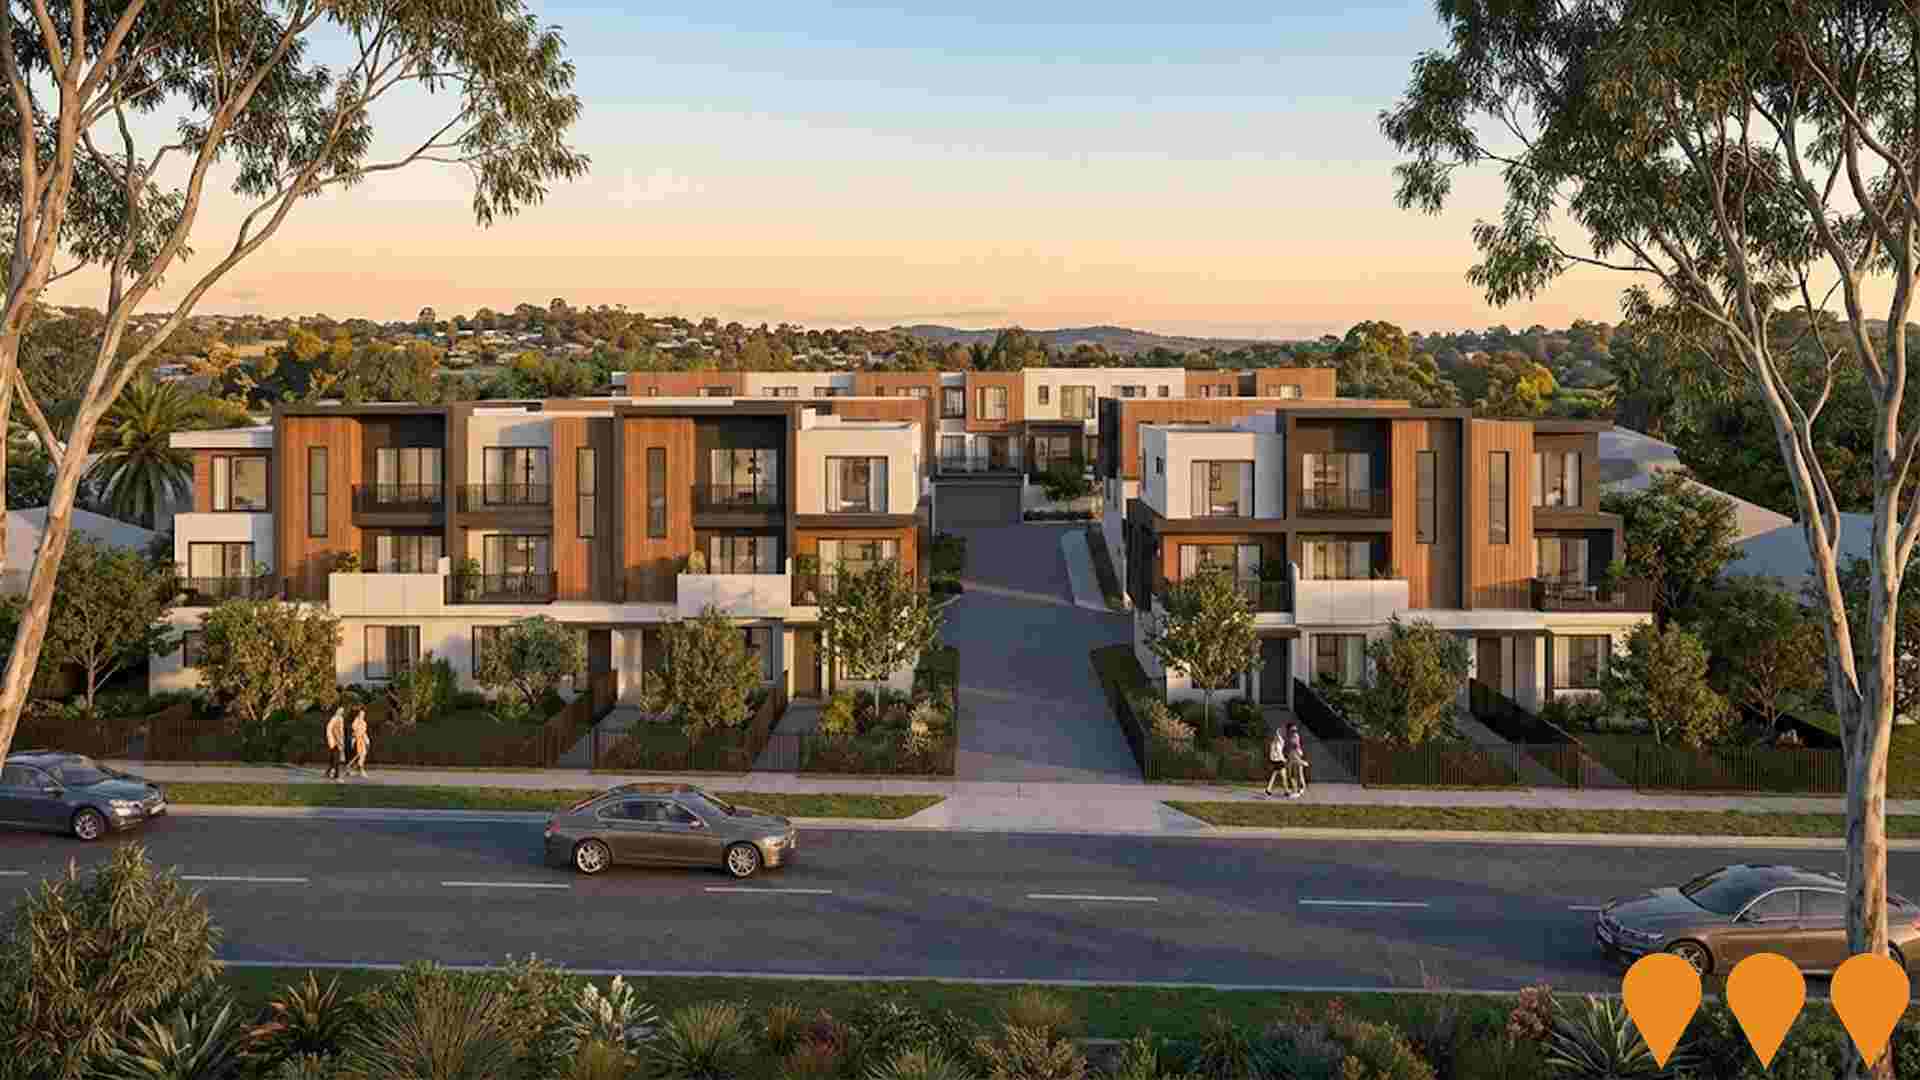
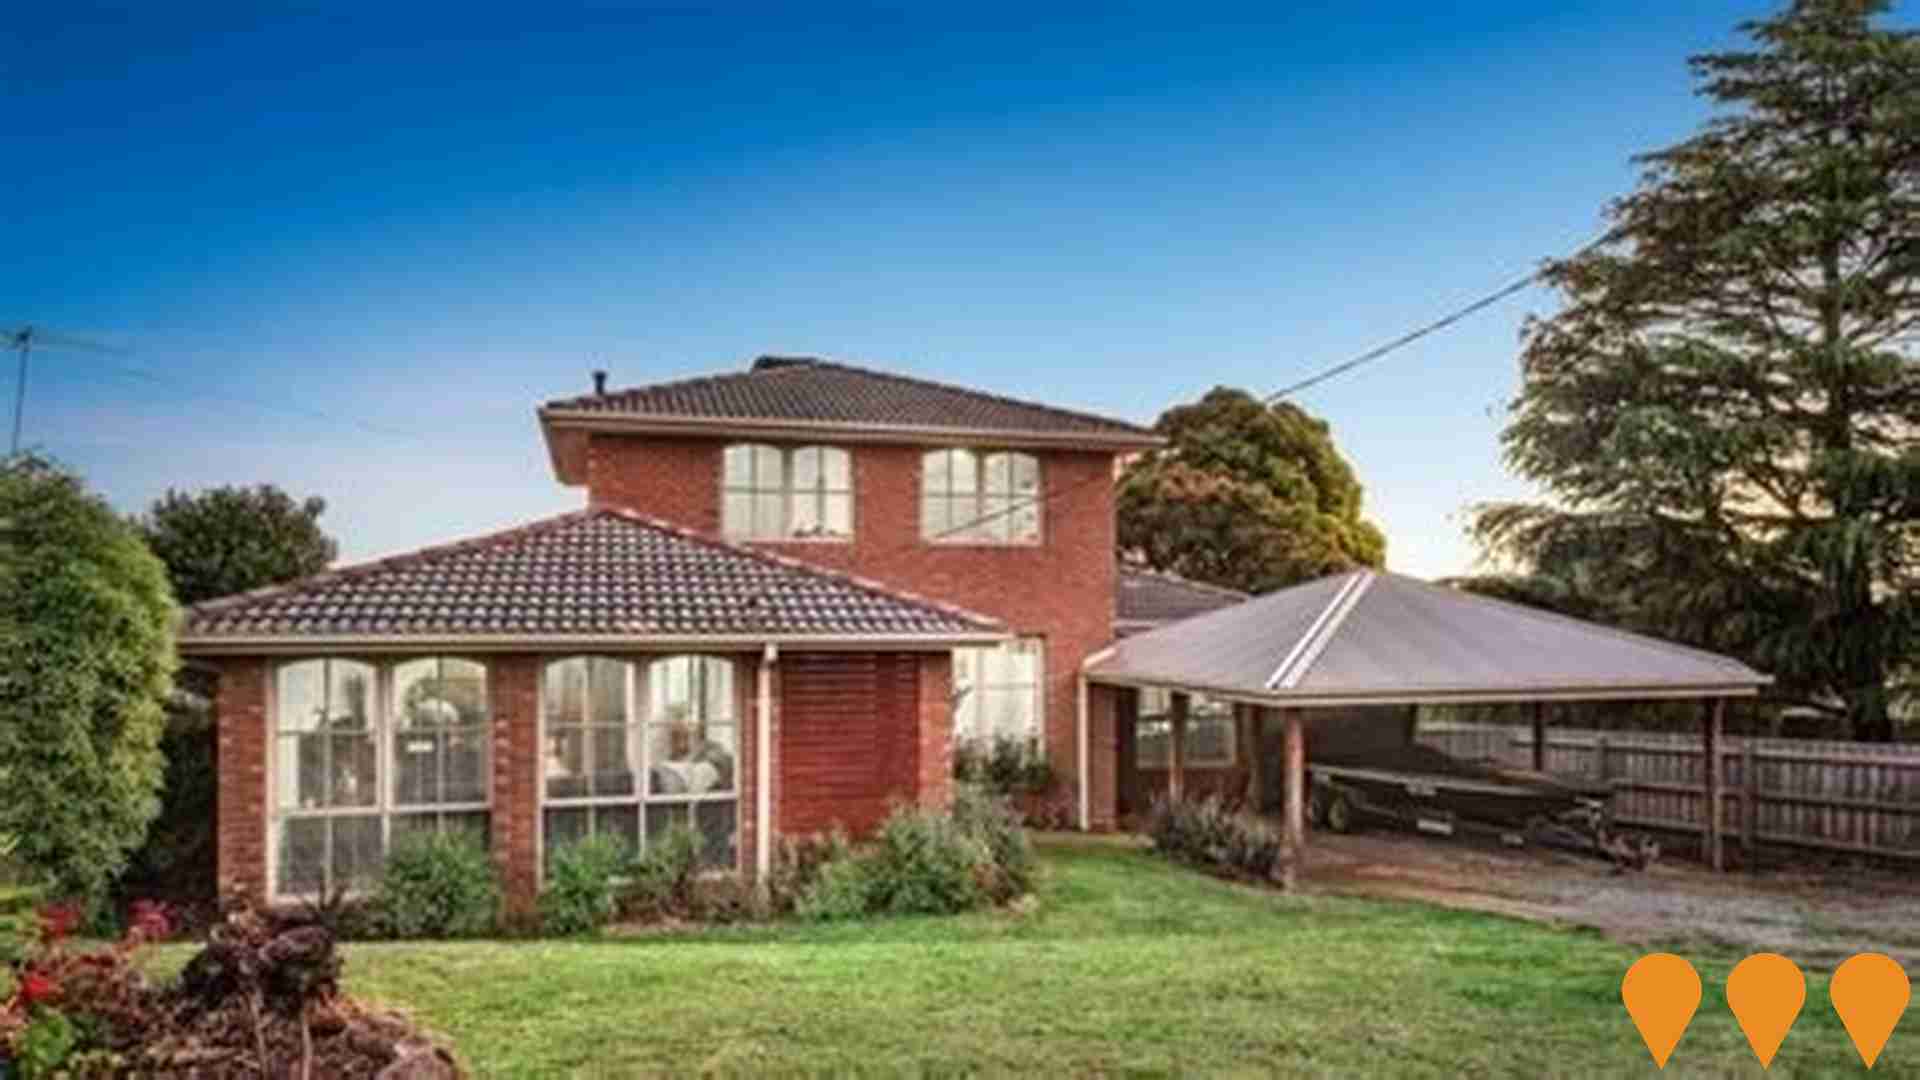
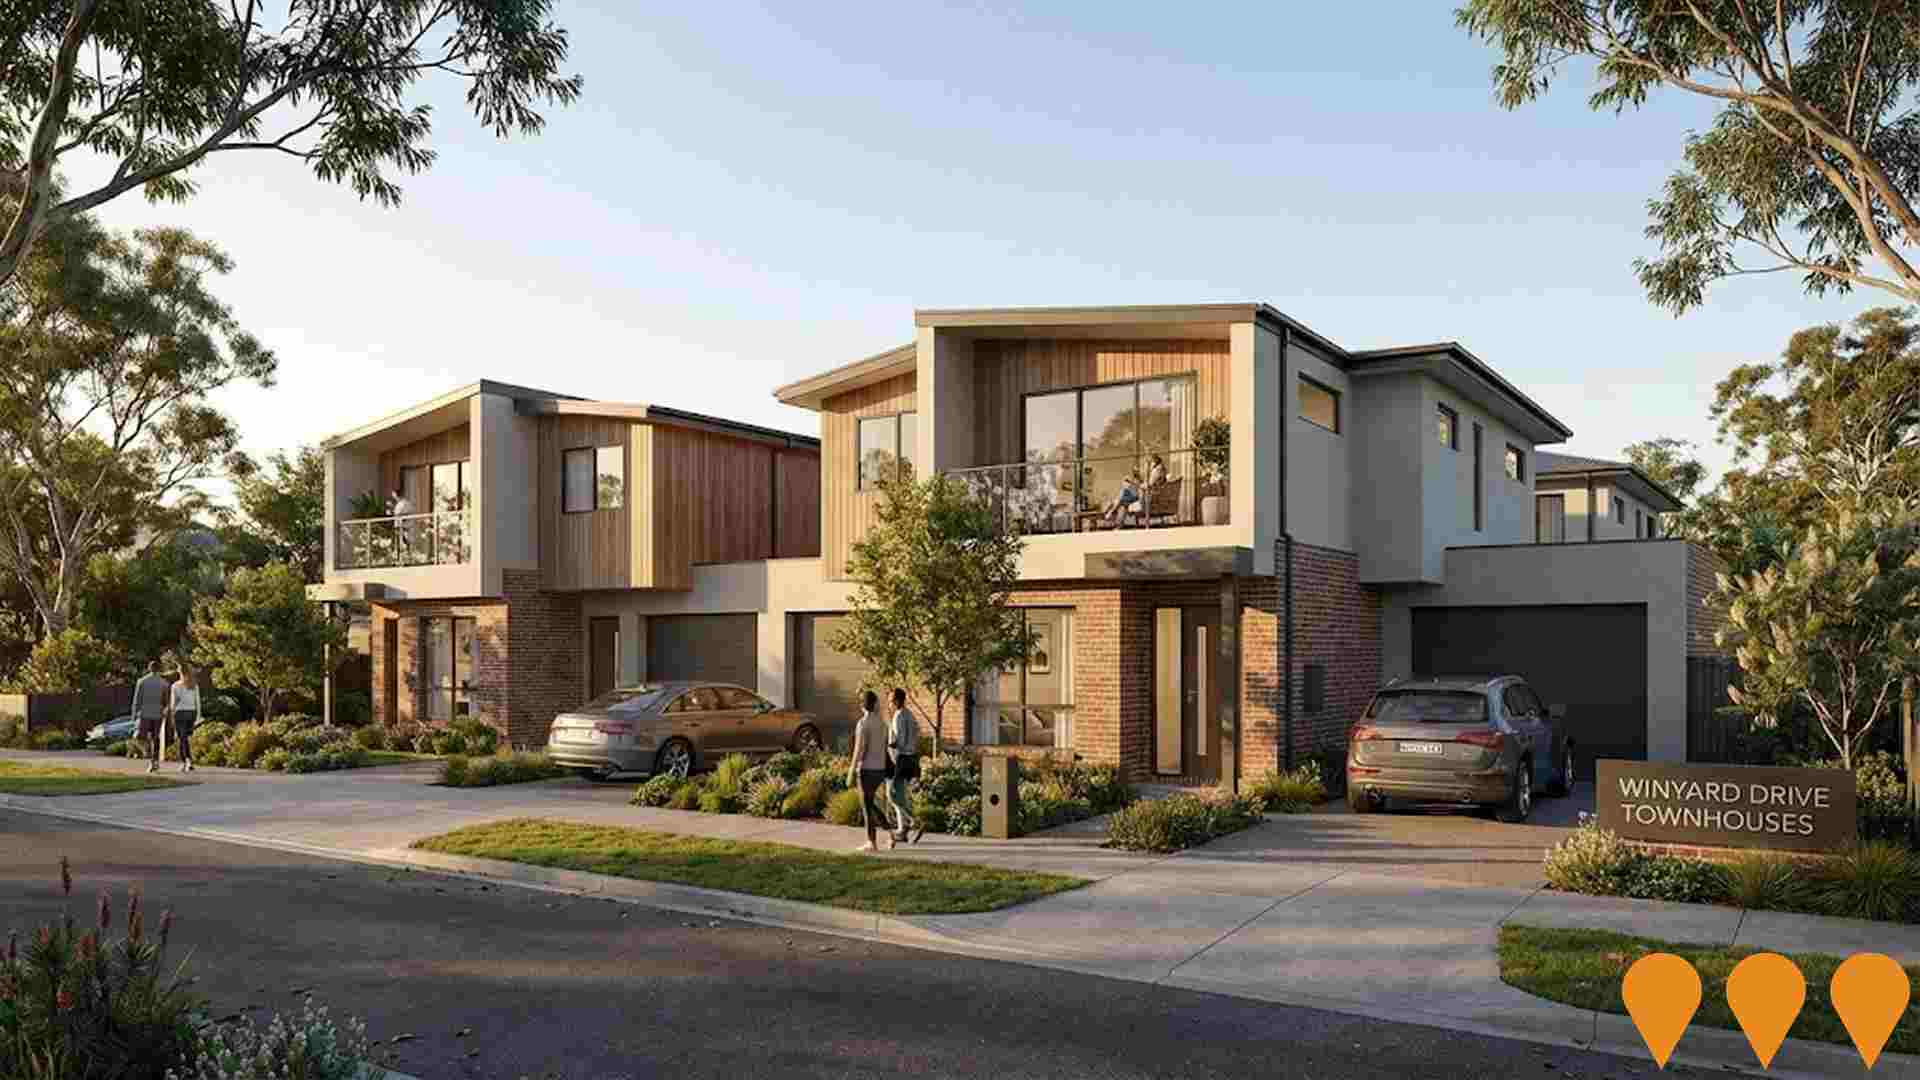
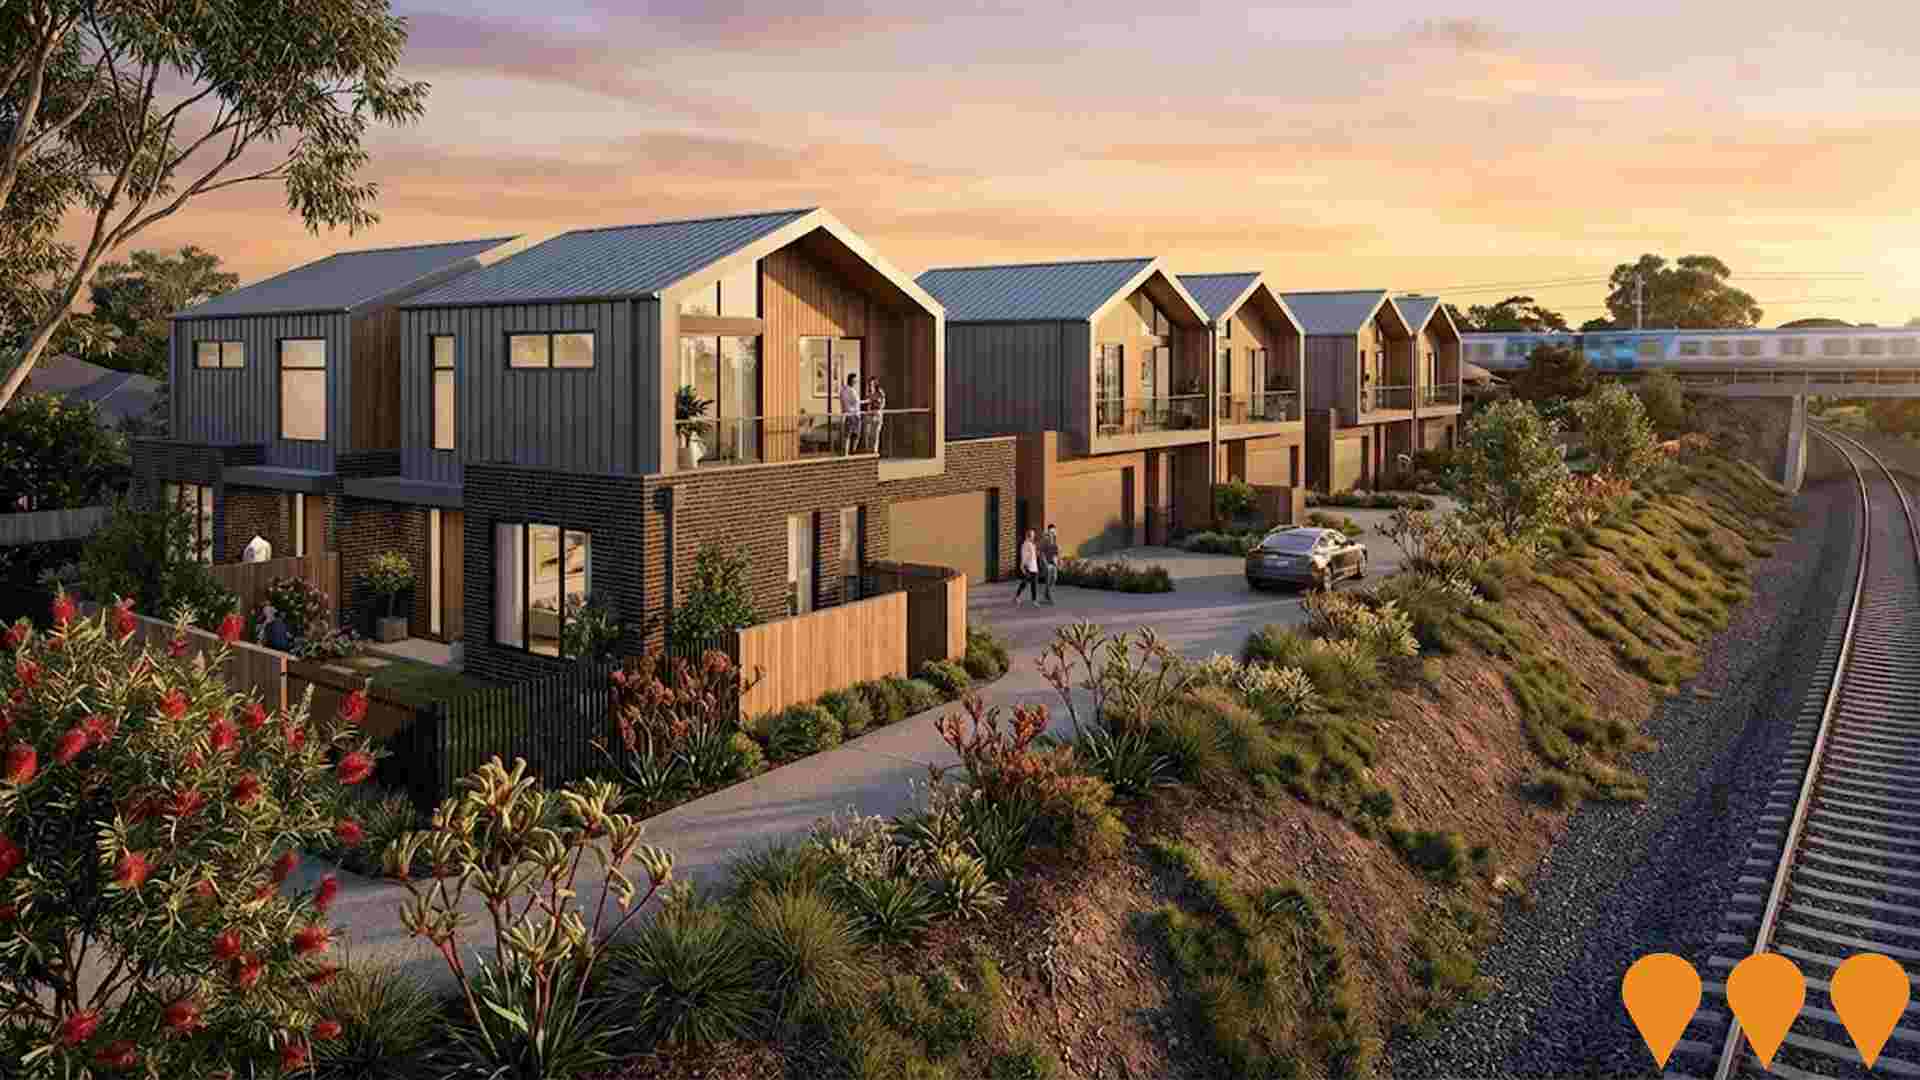
 Denotes AI-based impression for illustrative purposes only, not to be taken as definitive under any circumstances. Please follow links and conduct other investigations from the project's source for actual imagery. Developers and project owners wishing us to use original imagery please Contact Us and we will do so.
Frequently Asked Questions - Infrastructure
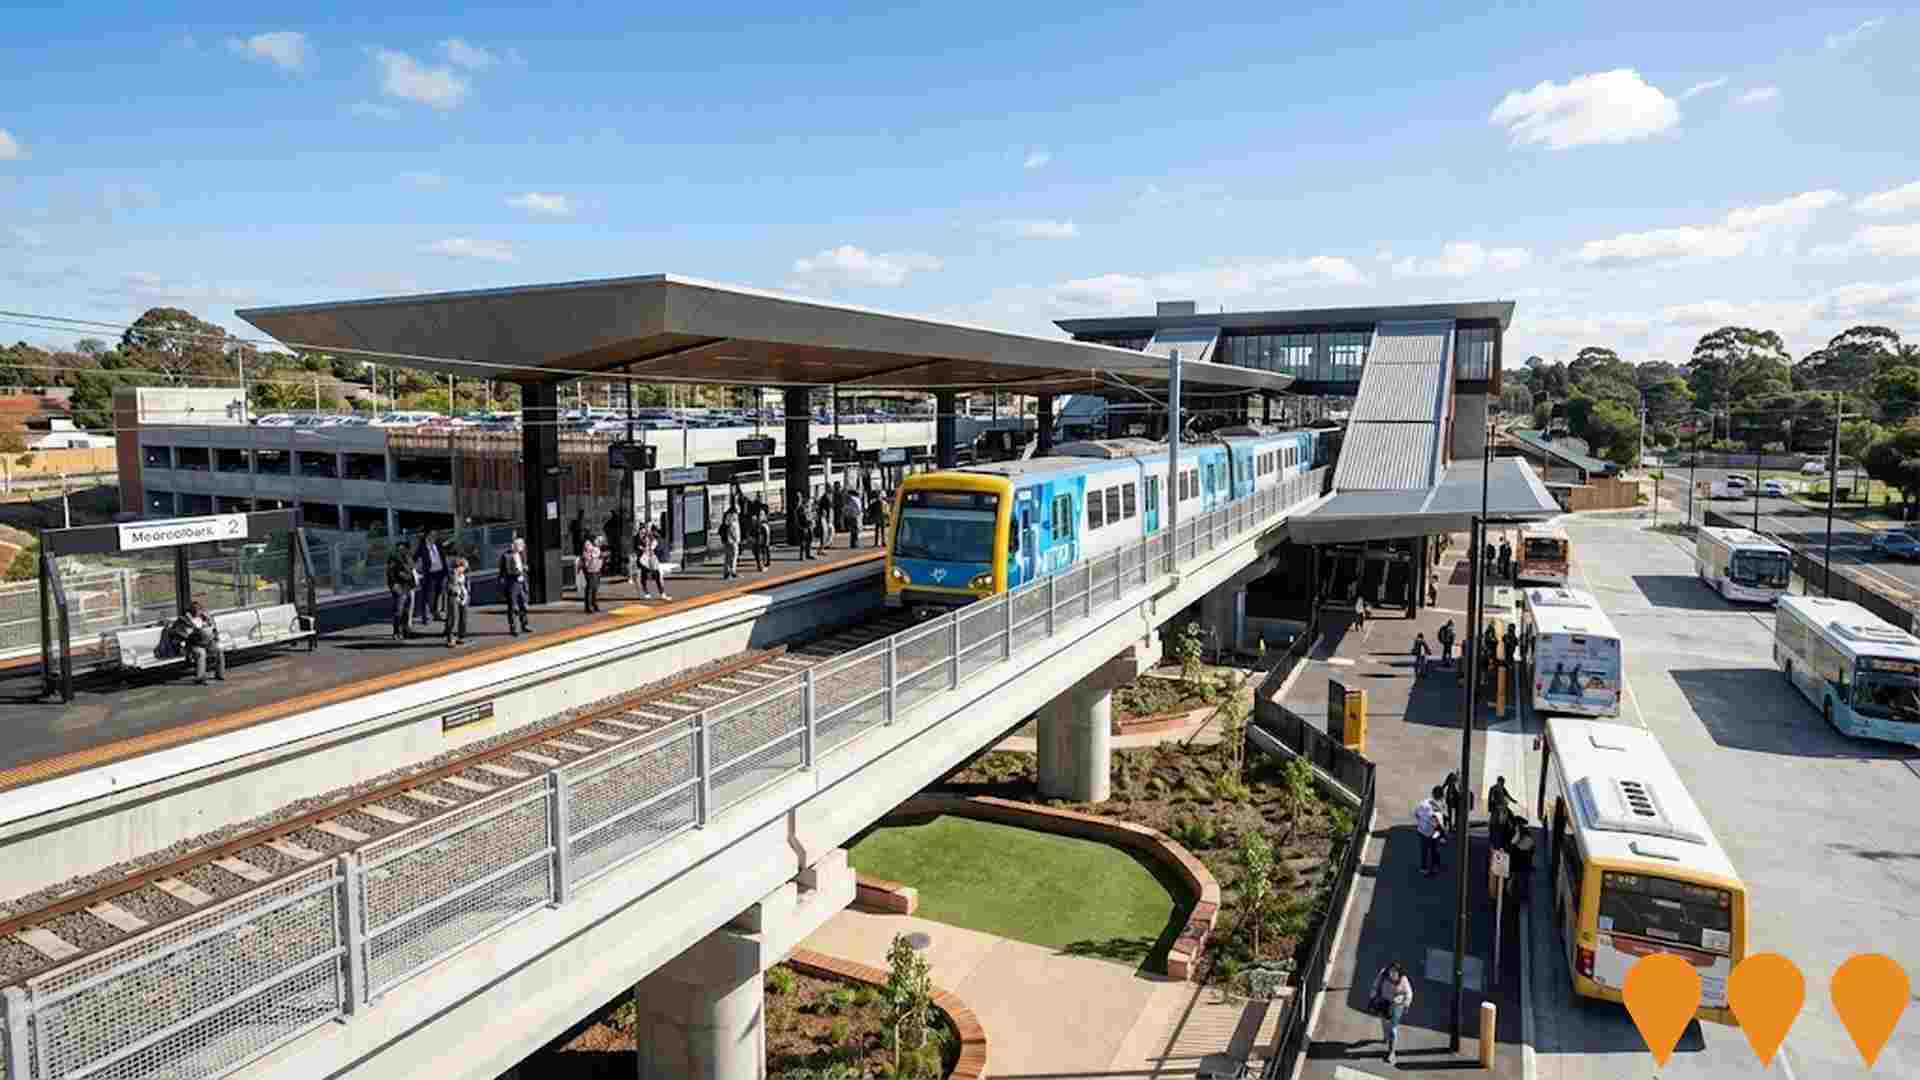
Mooroolbark and Lilydale Level Crossing Removal - Mooroolbark Station
Major infrastructure project that removed the Manchester Road level crossing and Maroondah Highway level crossing (Lilydale) by building new elevated stations and rail bridges. The Mooroolbark component features improved accessibility, 900 car parking spaces (doubled capacity), new bus interchange, community spaces under the rail bridge, and enhanced walking/cycling connections to Red Earth Community Park. Part of the Level Crossing Removal Project improving safety and traffic flow across both Mooroolbark and Lilydale. Completed in November 2021.
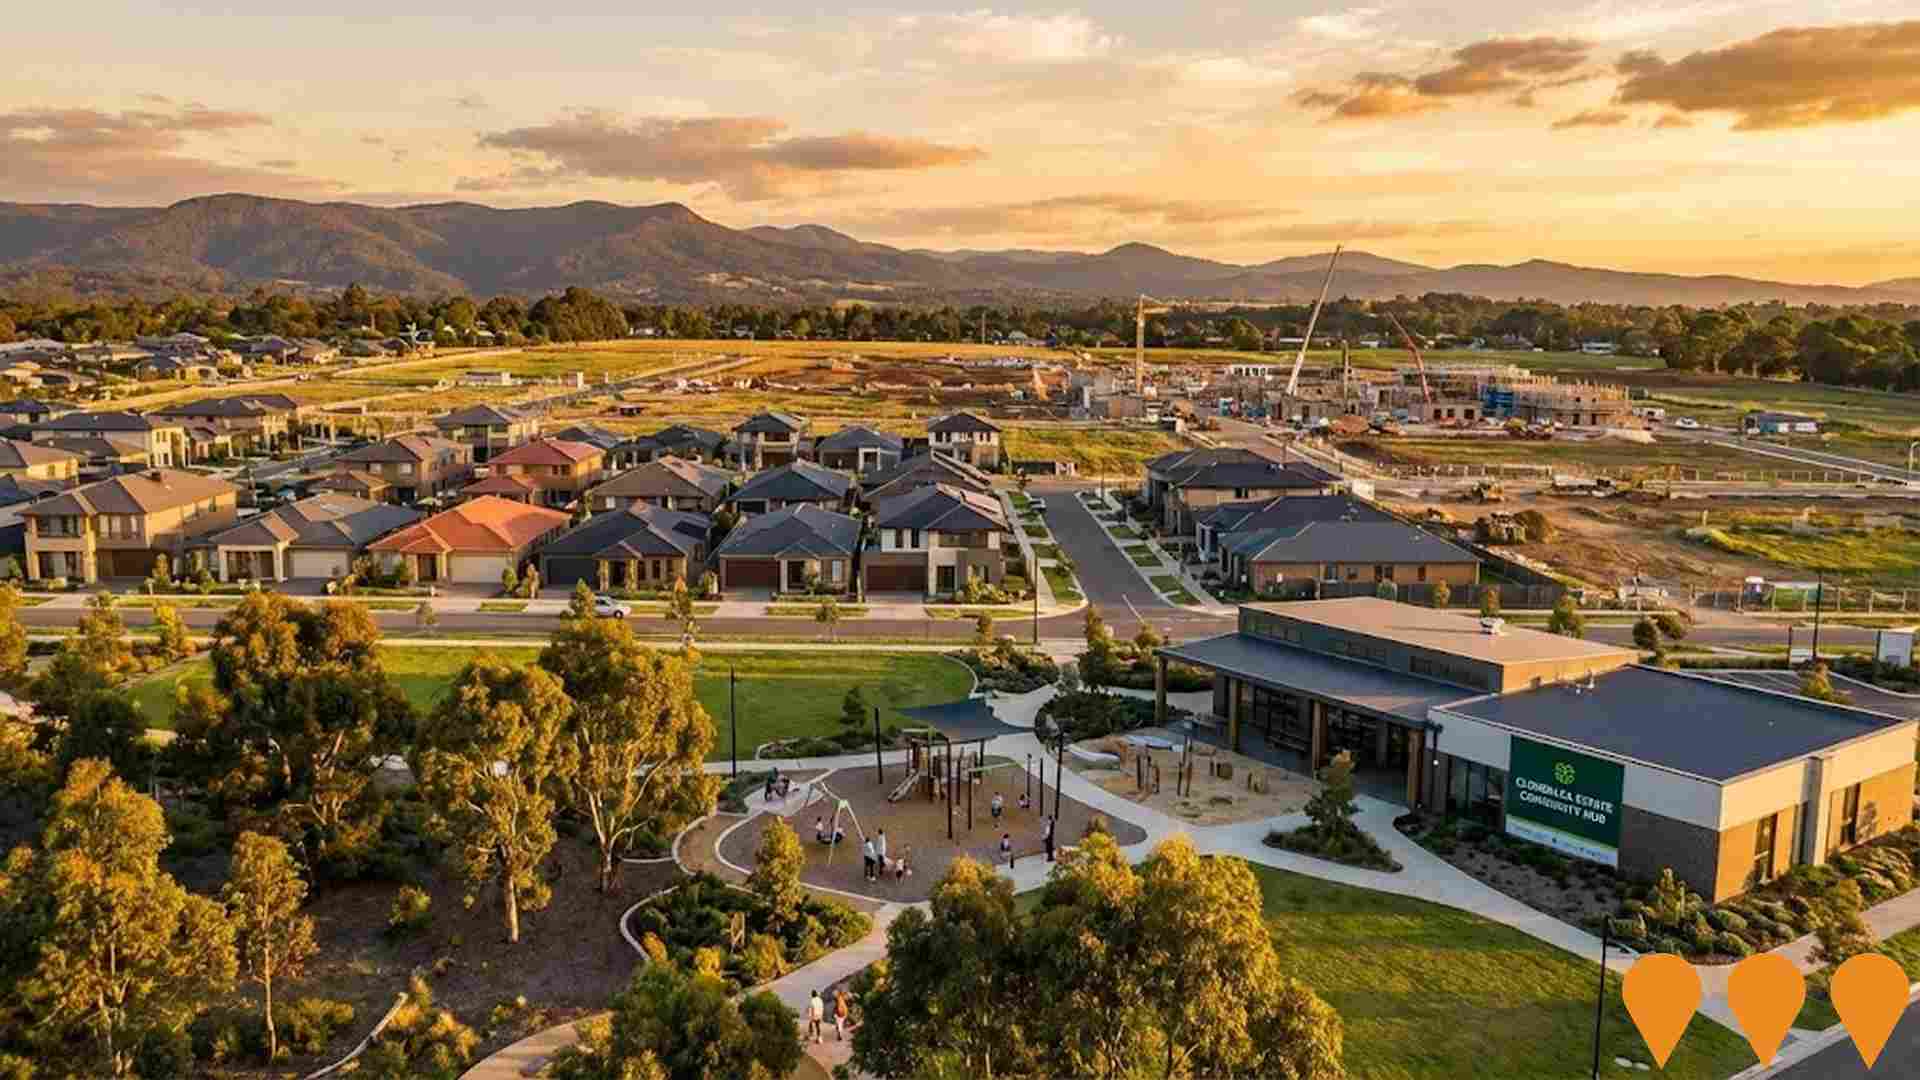
Cloverlea Estate
Large residential development built on the former Chirnside Park Country Club Golf Course site. Multi-stage development with completed dwellings in north-eastern corner and ongoing construction. Includes parks, playgrounds, and community facilities.
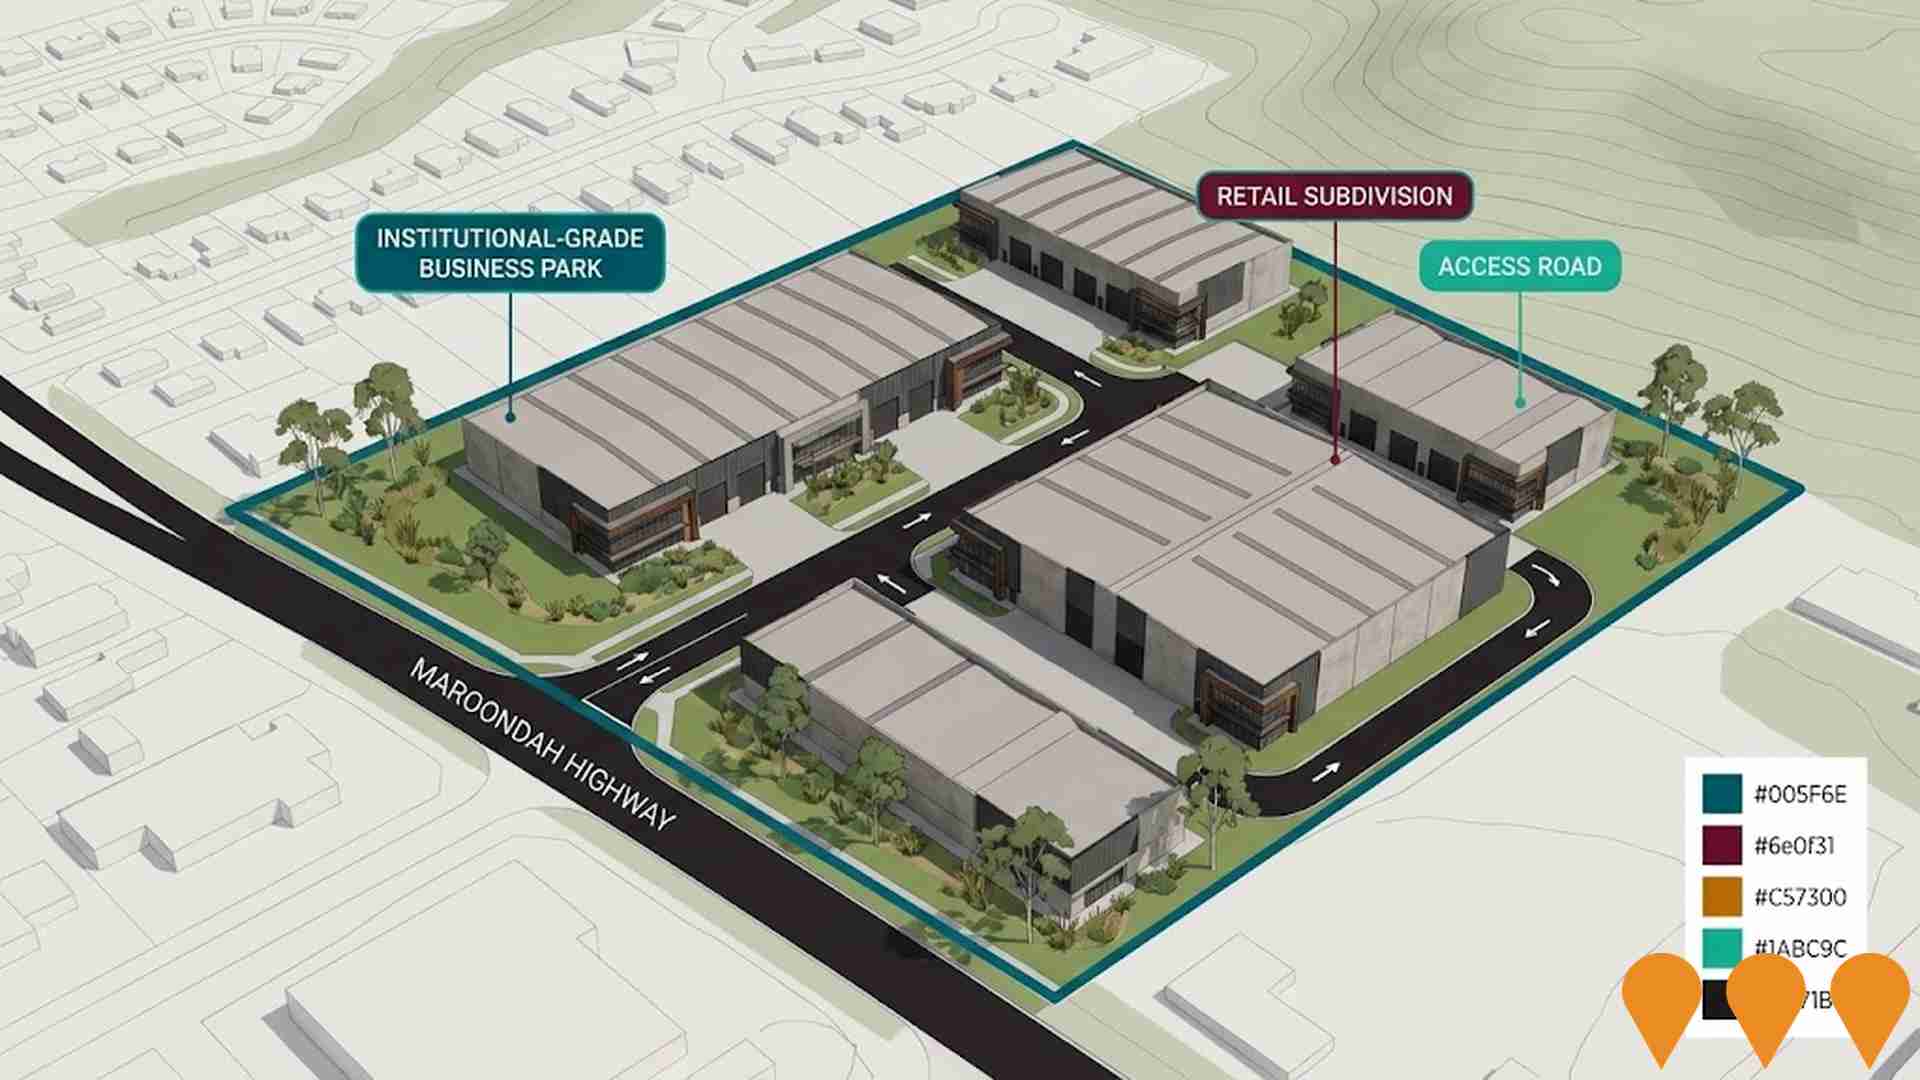
270 Maroondah Highway Industrial Development
5.64 hectare industrial zoned greenfield site with prime development potential for institutional-grade business park, retail land allotment subdivision, or small format industrial development. Strategic location along Maroondah Highway with superior accessibility.
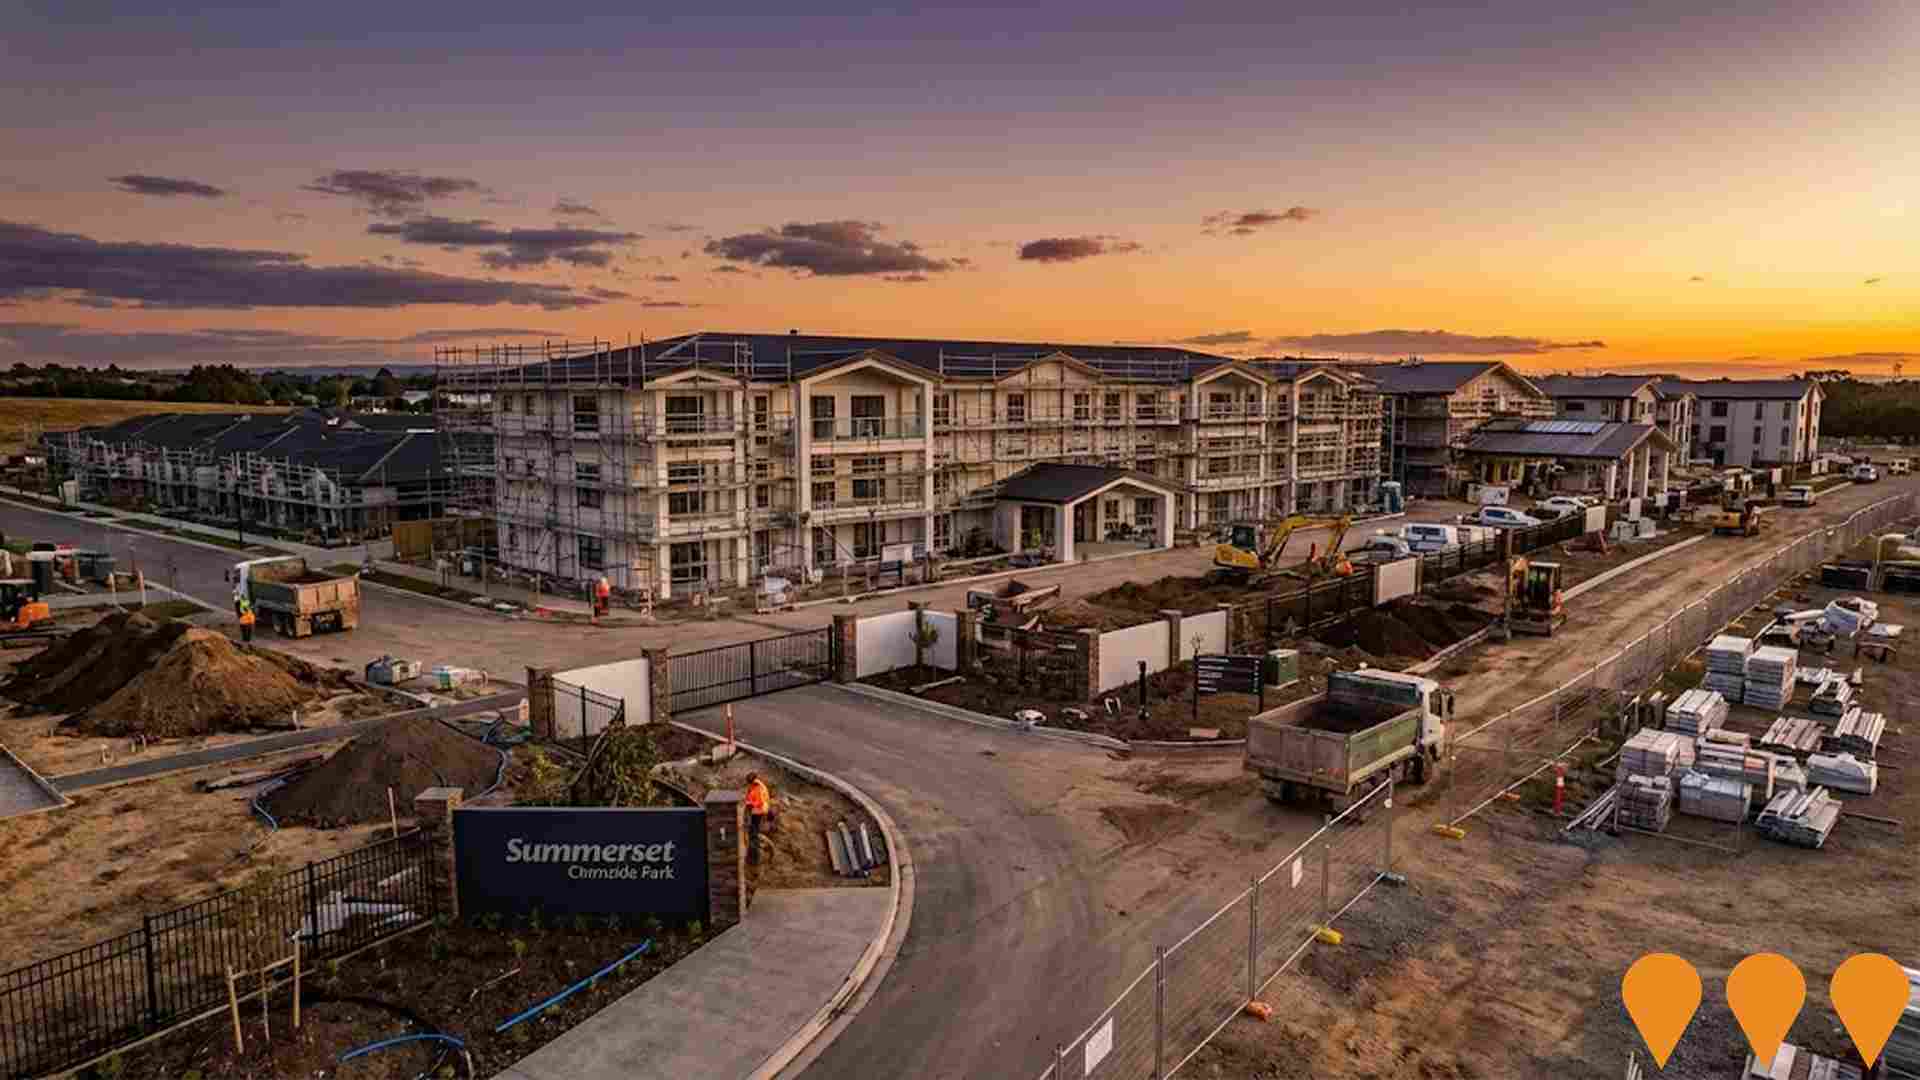
Summerset Chirnside Park Retirement Village
Continuum-of-care retirement village delivering independent living villas and cottages, assisted living apartments, and an on-site care home with resort-style amenities (pool, lounge, cinema, cafe, salon, bowling green). Civil works are nearing completion, first villas targeted for late 2025, with village opening expected in 2026.
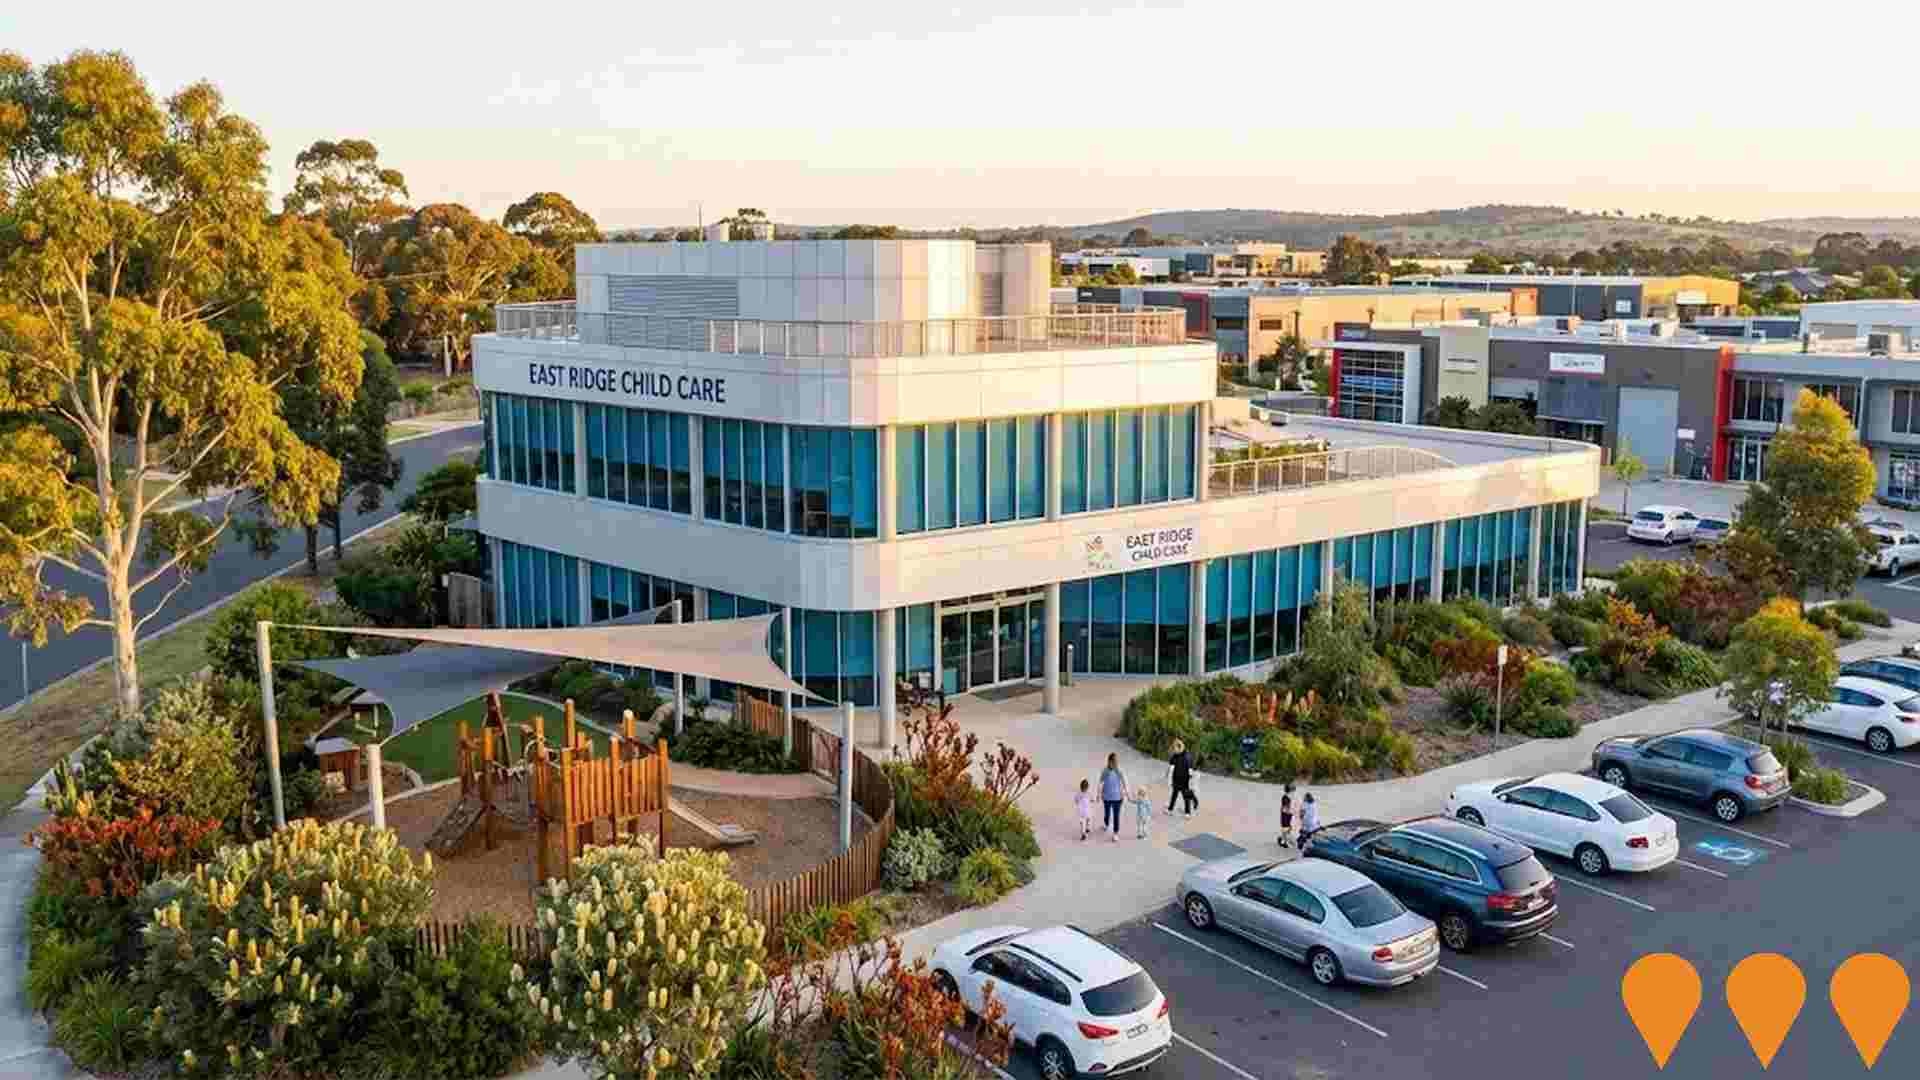
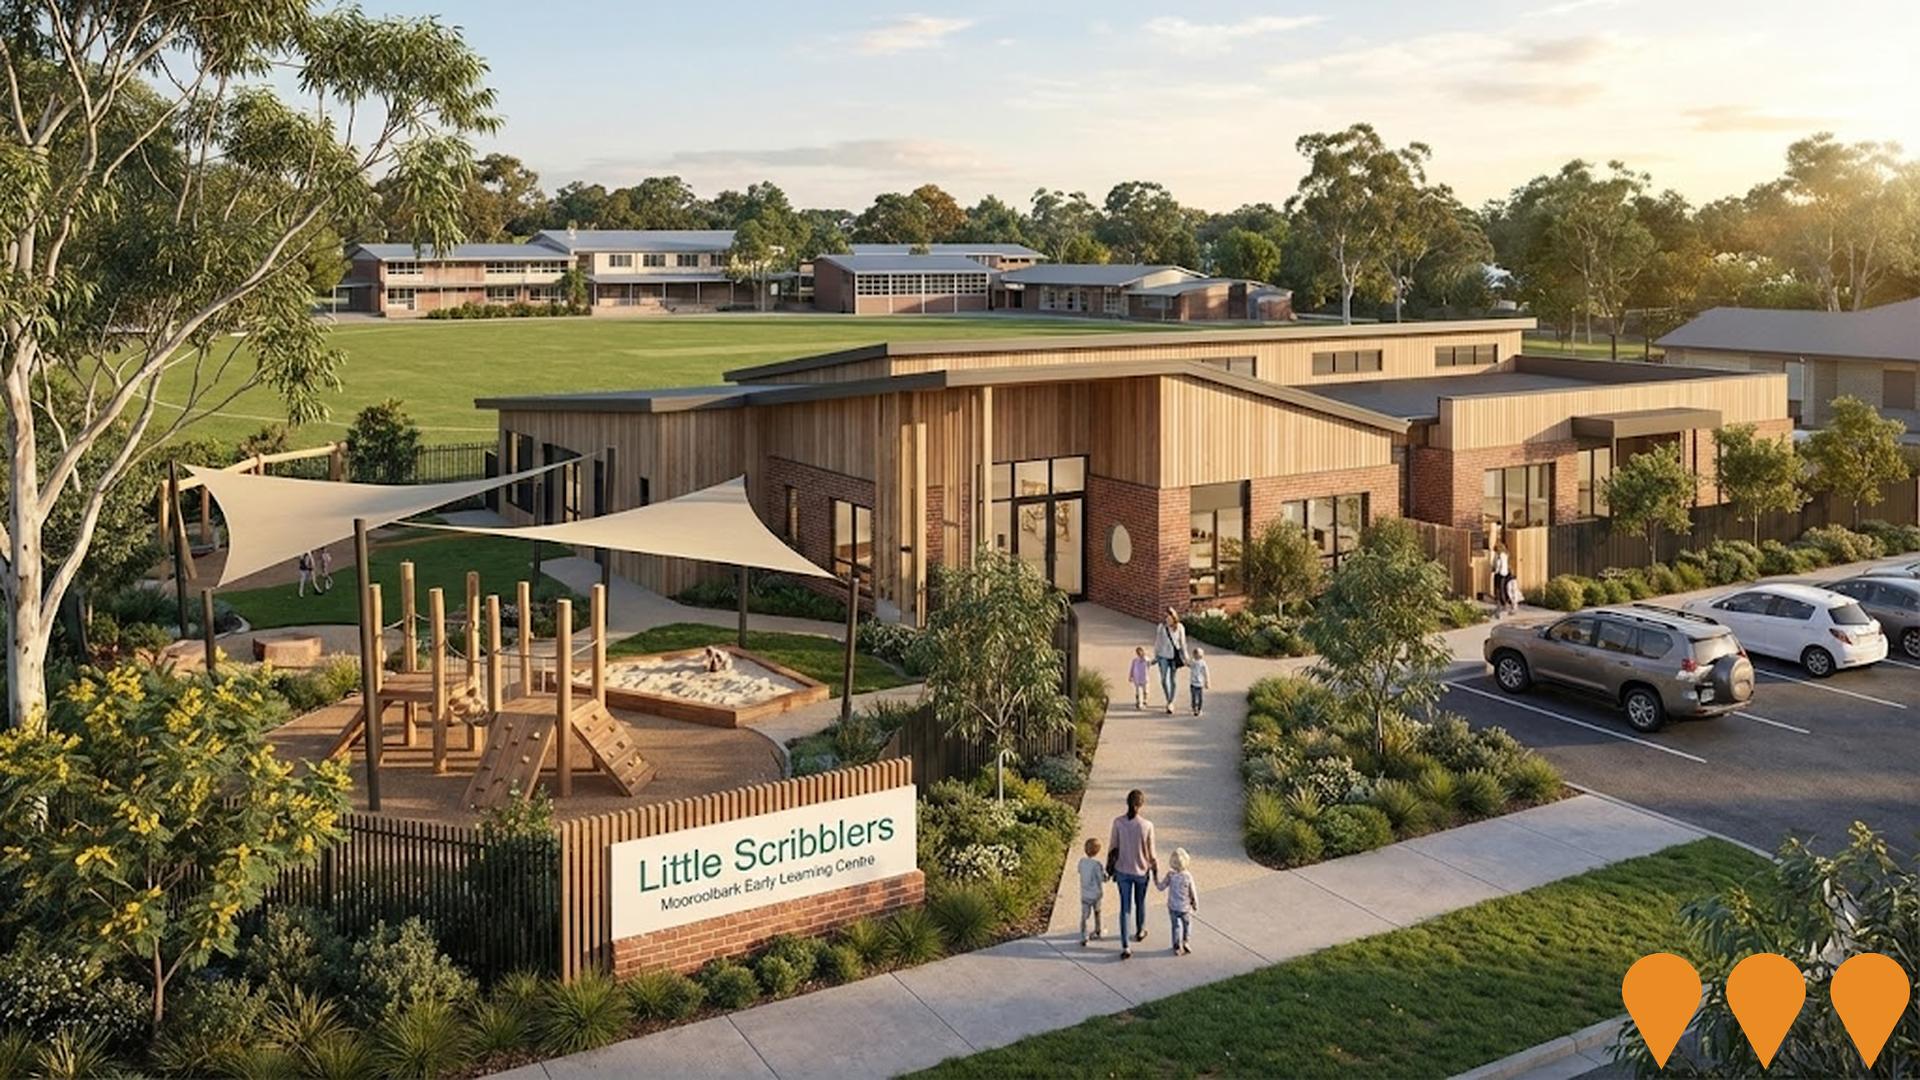
Little Scribblers Mooroolbark Early Learning Centre
A high-quality early learning centre with 120-127 approved places featuring bespoke renovation and design, state-of-the-art facilities, thoughtfully designed indoor and outdoor play areas, tailored programs for children aged 0-5 years, and experienced educators. The centre will be co-located with Mooroolbark Grammar primary school on a 2.814 hectare site.
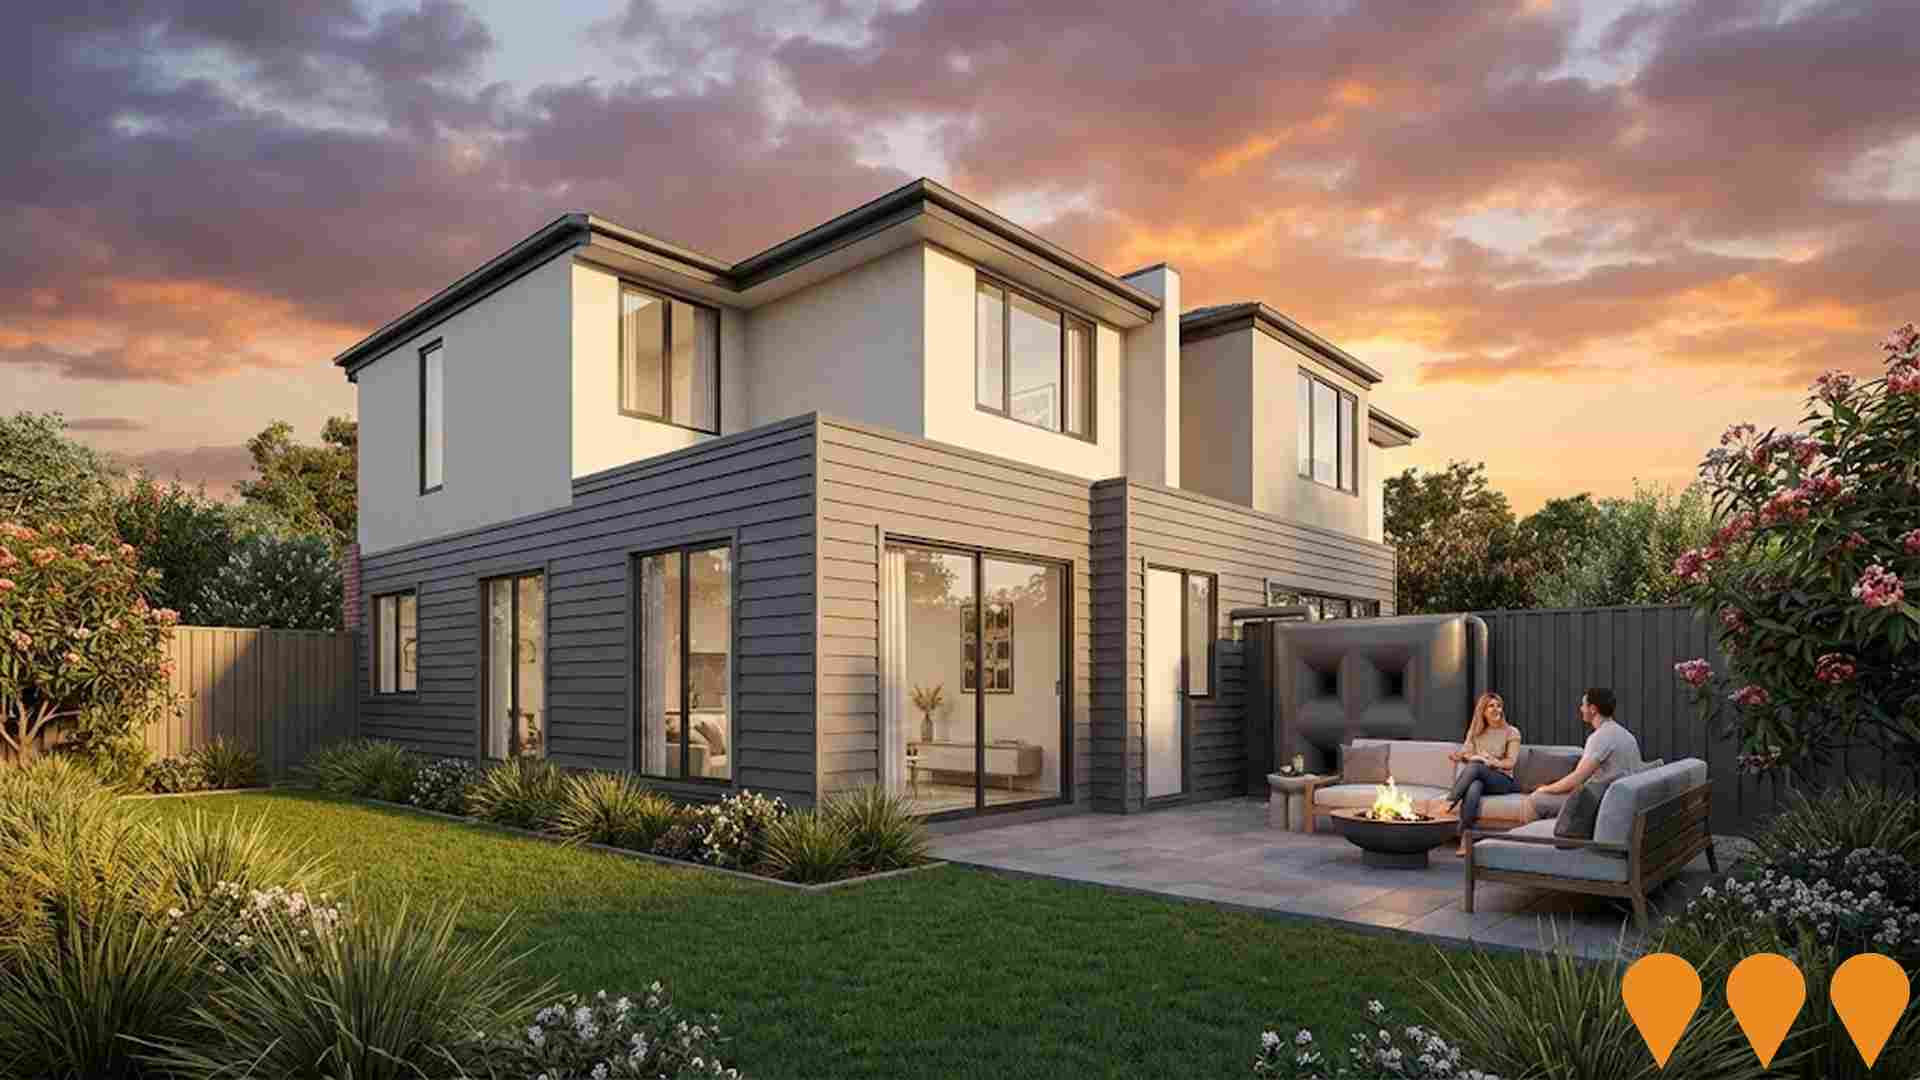
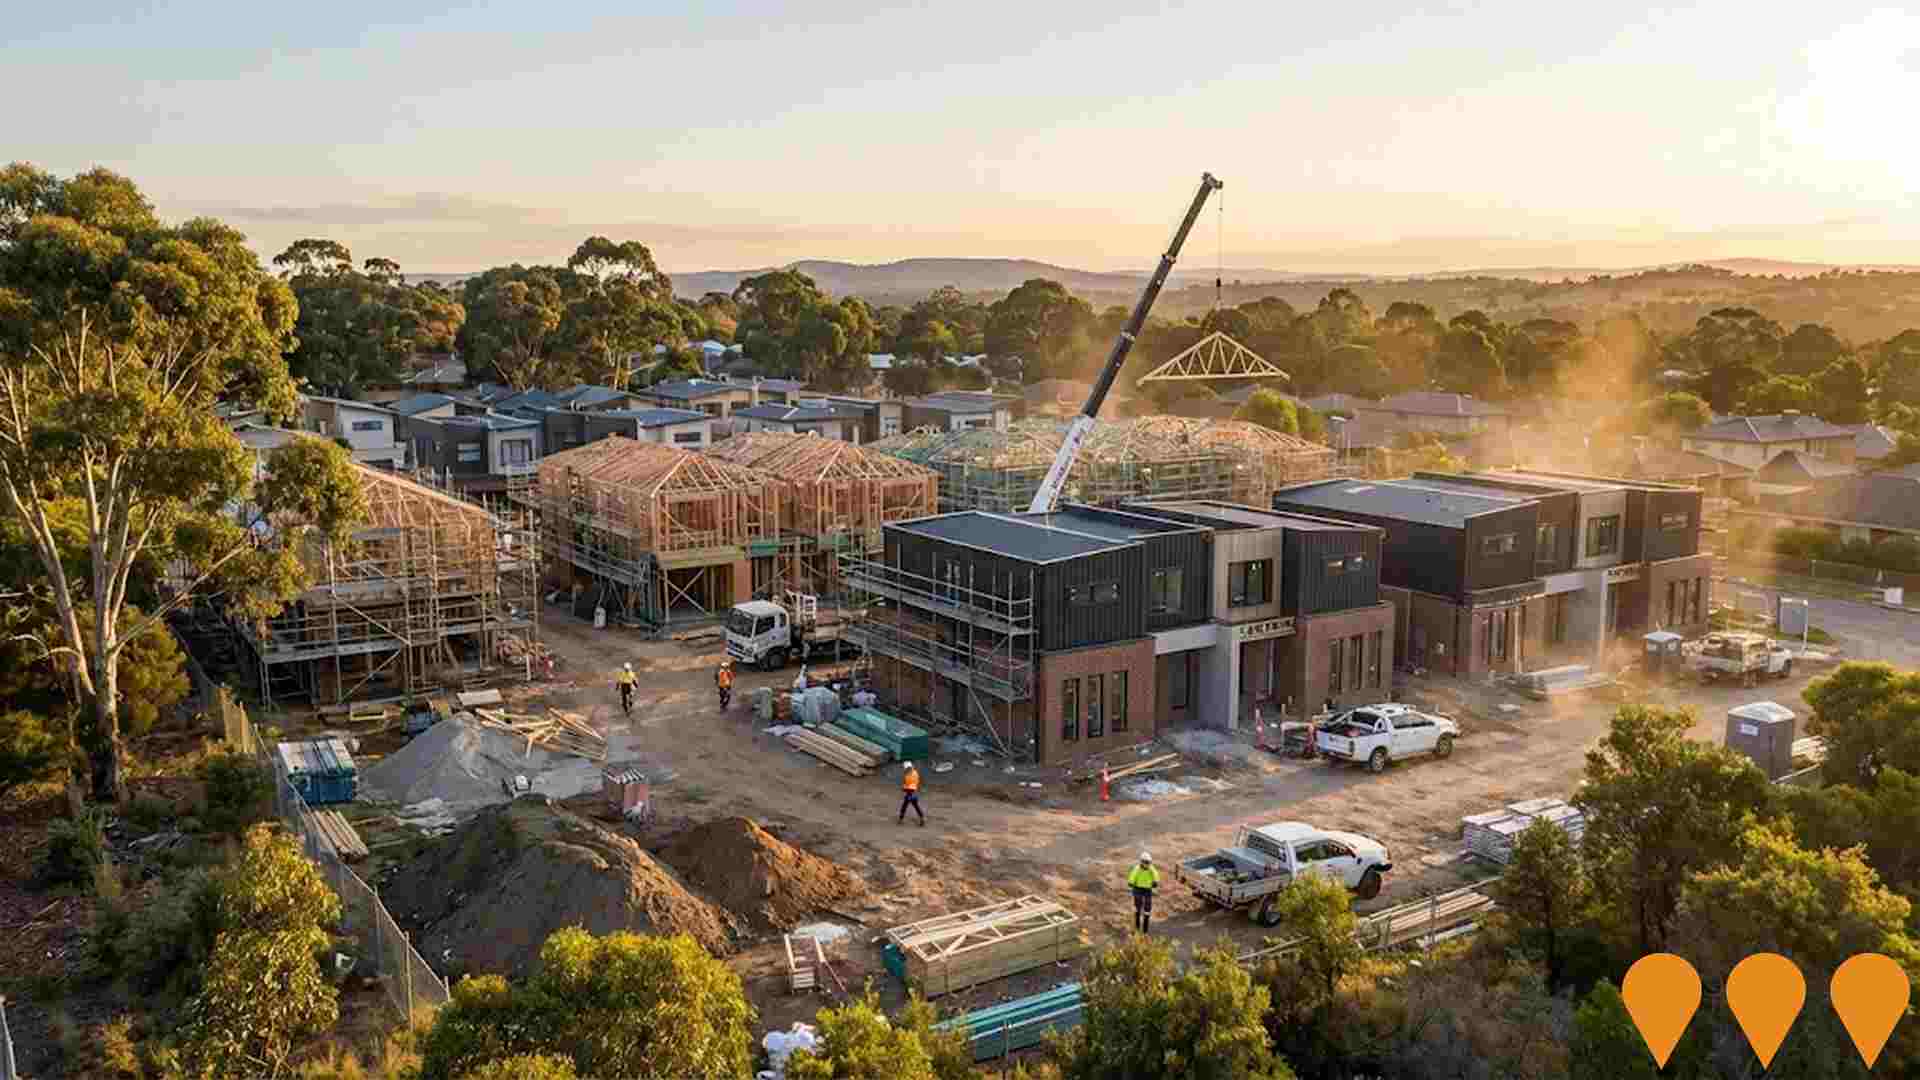
The Outlook Croydon North
New residential estate of 48 architect designed townhomes in Croydon North, delivering modern family living close to local schools, parks and shopping. As of late 2025 the project is under construction with completion expected in 2026.
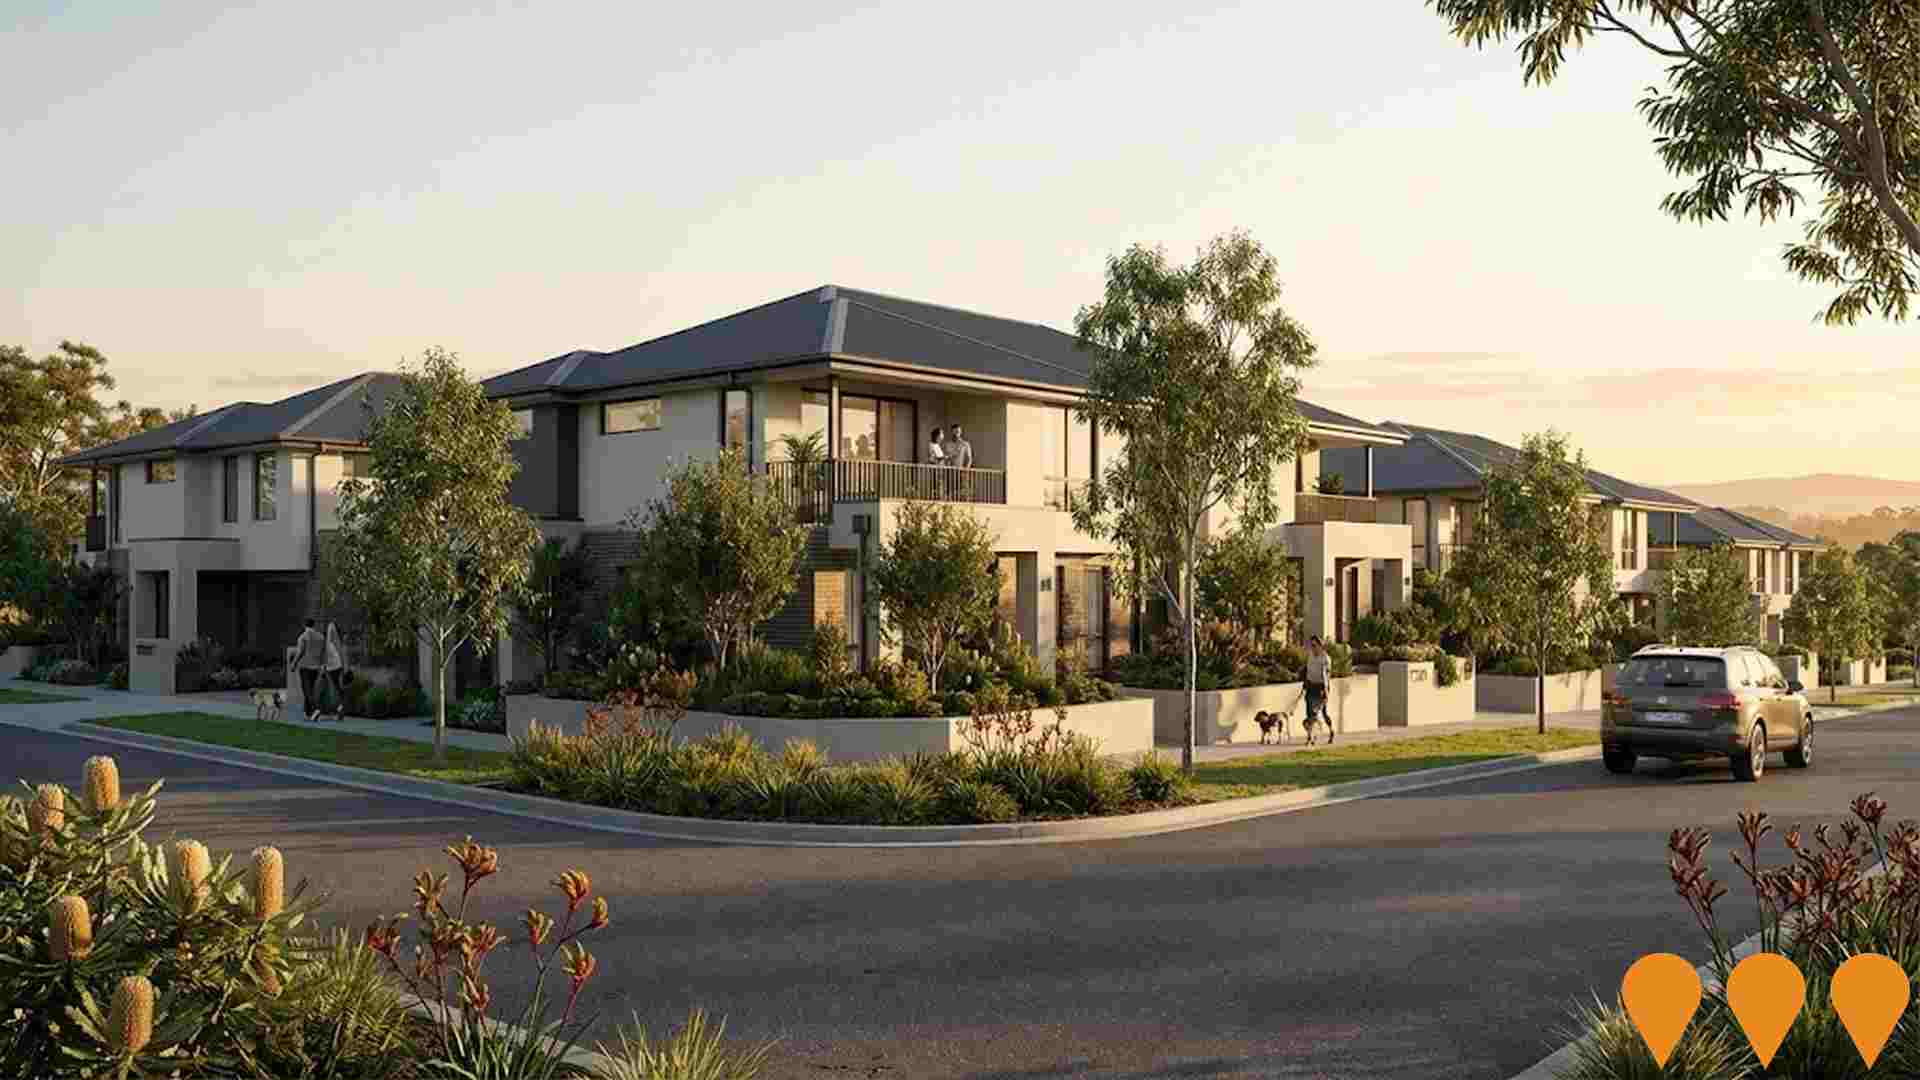
Mt View Residences
A boutique residential development featuring 26 beautifully designed townhomes with 2 to 4 bedrooms, spanning three levels with premium inclusions and sleek flowing floorplans. Designed by renowned John Patrick Architects with landscaping that captures views of Mt. Dandenong, featuring private outdoor spaces and connective common areas with raised planters and canopy trees. Located in a quiet pocket near Mooroolbark Train Station with easy access to transport, education, shopping, and parks.
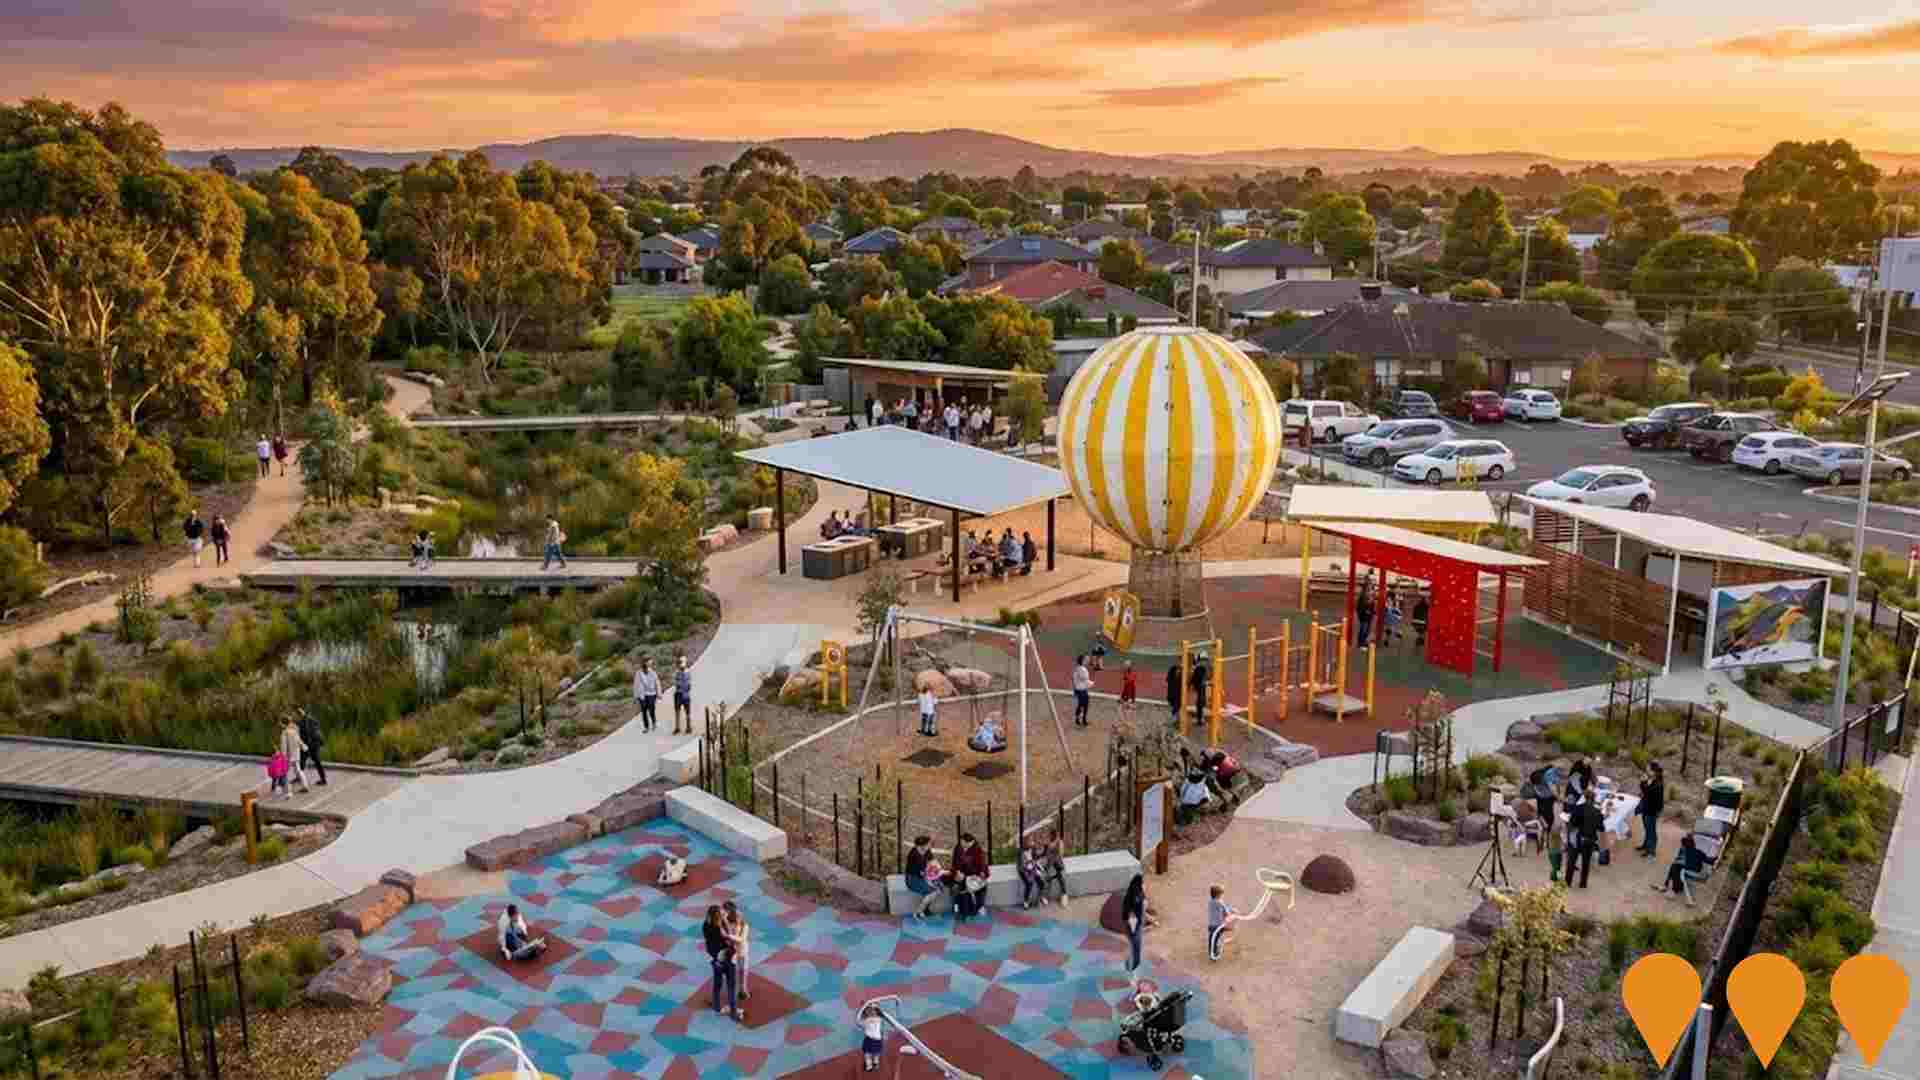
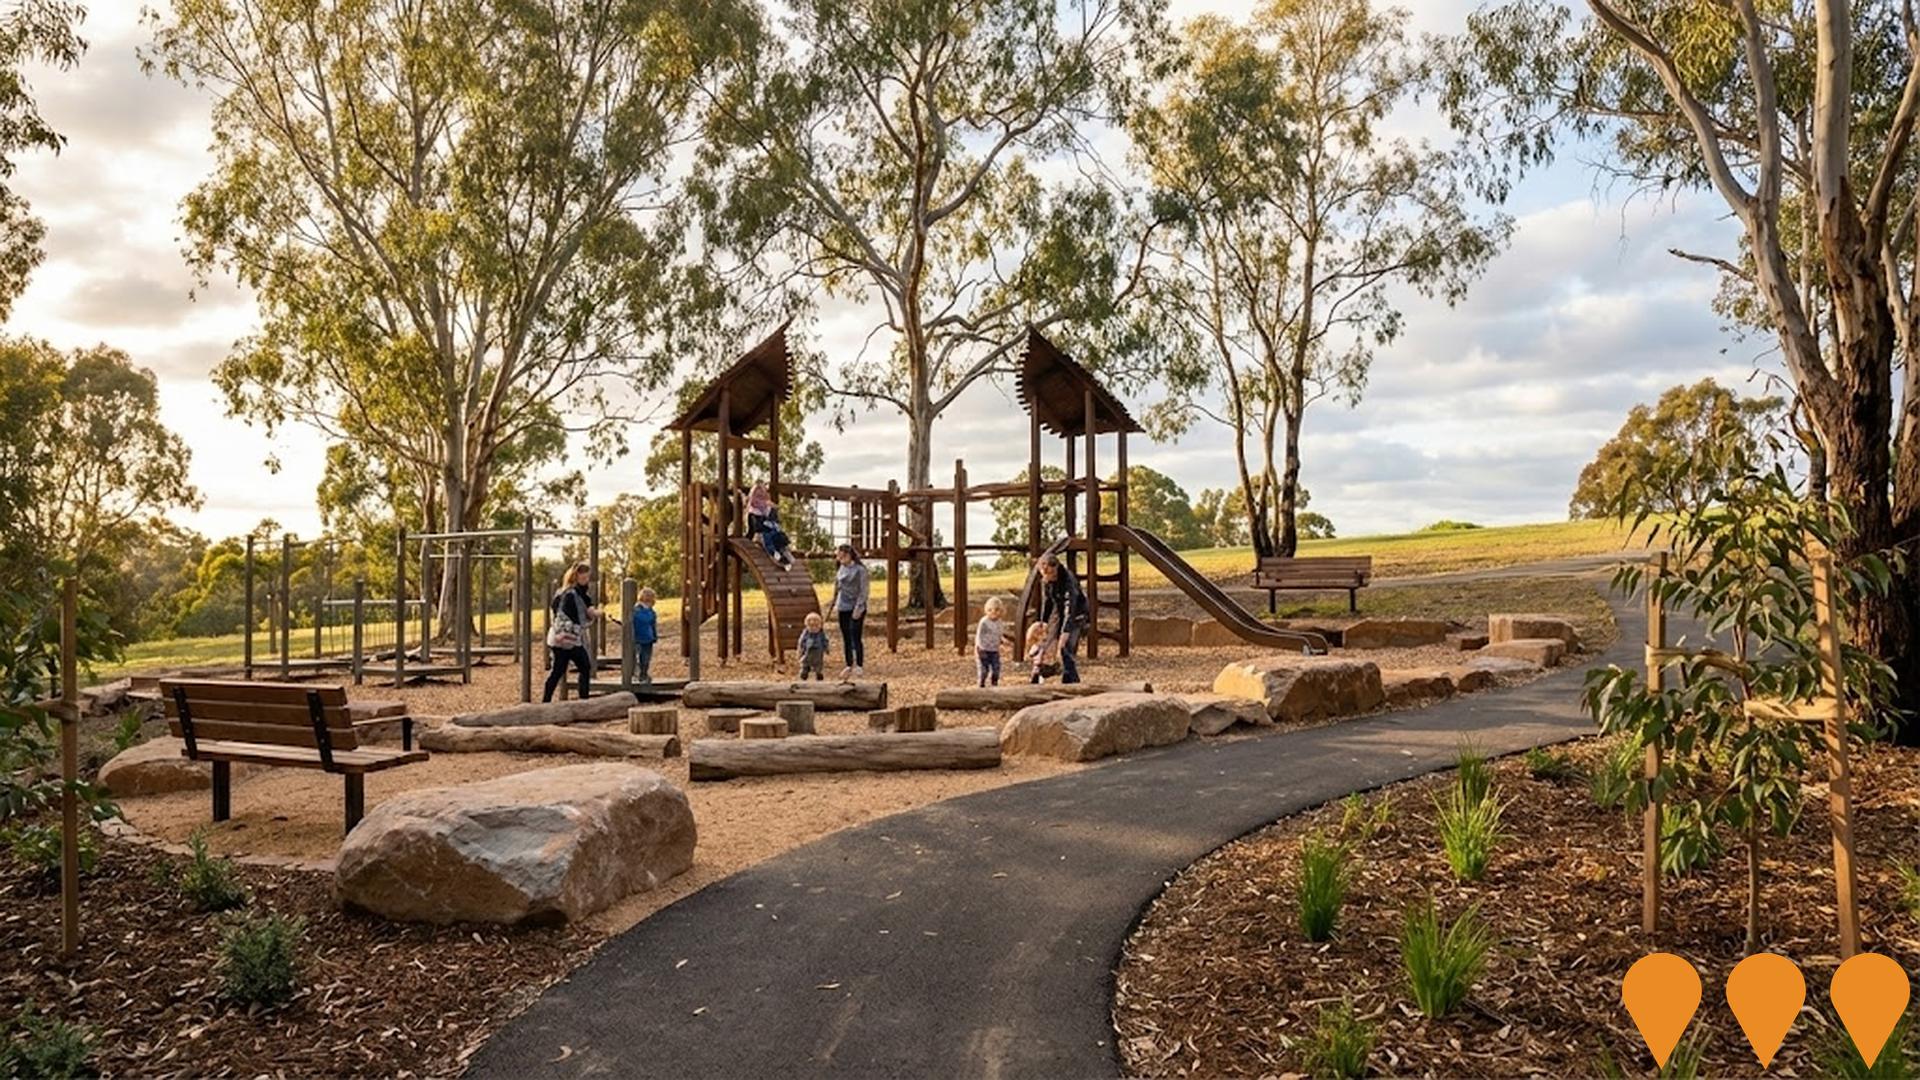
Bimbadeen Reserve Playspace Renewal
Renewal of playspaces at Bimbadeen Reserve to create one formal timber-themed playspace at the top of the hill with rope climbing and timber frames, and a smaller nature-based area near the preschool with logs, rocks, and seating. Includes new sealed paths, relocated furniture, and plantings for shade.
Employment
The employment landscape in Mooroolbark shows performance that lags behind national averages across key labour market indicators
Mooroolbark's workforce is skilled with notable representation in construction. The unemployment rate was 5.2% as of September 2024.
Employment growth over the past year was estimated at 0.8%. As of September 2025, 13,027 residents are employed, with an unemployment rate of 5.2%, compared to Greater Melbourne's 4.7%. Workforce participation is 67.4% in Mooroolbark. Leading industries include construction, health care & social assistance, and retail trade.
Construction shows strong specialization at 1.5 times the regional level. Professional & technical services have lower representation at 6.9%, compared to the regional average of 10.1%. Limited local employment opportunities are indicated by Census data on working population vs resident population. Between September 2024 and September 2025, employment increased by 0.8% while labour force increased by 0.9%, with unemployment remaining essentially unchanged. By comparison, Greater Melbourne recorded employment growth of 3.0%. State-level data to 25-Nov-25 shows Victoria's employment grew by 1.13% year-on-year, with an unemployment rate of 4.7%. National employment forecasts from May-25 suggest a 6.6% increase over five years and 13.7% over ten years. Applying these projections to Mooroolbark's employment mix indicates local employment should increase by 6.3% over five years and 13.2% over ten years.
Frequently Asked Questions - Employment
Income
Income analysis reveals strong economic positioning, with the area outperforming 60% of locations assessed nationally by AreaSearch
AreaSearch's latest postcode level ATO data for financial year 2022 shows median income in Mooroolbark SA2 was $54,116 and average income was $64,722. This is similar to national averages but lower than Greater Melbourne's median of $54,892 and average of $73,761. Based on Wage Price Index growth of 12.16% from financial year 2022 to September 2025, estimated median income in Mooroolbark would be approximately $60,697 and average income $72,592. Census 2021 data indicates incomes in Mooroolbark cluster around the 60th percentile nationally. Income brackets show 36.0% of individuals earn between $1,500 - 2,999, aligning with metropolitan region's 32.8%. High housing costs consume 15.1% of income but strong earnings place disposable income at the 66th percentile nationally. Mooroolbark's SEIFA income ranking places it in the 6th decile.
Frequently Asked Questions - Income
Housing
Mooroolbark is characterized by a predominantly suburban housing profile, with a higher proportion of rental properties than the broader region
In Mooroolbark, as per the latest Census, 95.4% of dwellings were houses while 4.6% comprised semi-detached homes, apartments, and other types. This compares to Melbourne metro's figures of 93.8% houses and 6.2% other dwellings. Home ownership in Mooroolbark stood at 32.2%, with mortgaged properties accounting for 47.1% and rented dwellings making up 20.7%. The median monthly mortgage repayment was $2,000, higher than Melbourne metro's average of $1,950. The median weekly rent in Mooroolbark was $400, compared to Melbourne metro's $380. Nationally, Mooroolbark's mortgage repayments exceeded the Australian average of $1,863, while rents were higher than the national figure of $375.
Frequently Asked Questions - Housing
Household Composition
Mooroolbark features high concentrations of family households, with a higher-than-average median household size
Family households constitute 78.6% of all households, including 38.8% couples with children, 26.1% couples without children, and 12.7% single parent families. Non-family households make up the remaining 21.4%, with lone person households at 19.3% and group households comprising 2.1% of the total. The median household size is 2.8 people, which is larger than the Greater Melbourne average of 2.7.
Frequently Asked Questions - Households
Local Schools & Education
Educational attainment in Mooroolbark aligns closely with national averages, showing typical qualification patterns and performance metrics
The area's university qualification rate is 23.5%, significantly lower than Greater Melbourne's average of 37.0%. Bachelor degrees are the most common at 16.1%, followed by postgraduate qualifications (4.4%) and graduate diplomas (3.0%). Vocational credentials are held by 38.1% of residents aged 15 and above, with advanced diplomas at 11.8% and certificates at 26.3%. Educational participation is high, with 28.1% of residents currently enrolled in formal education.
This includes 9.9% in primary education, 7.7% in secondary education, and 3.8% pursuing tertiary education.
Frequently Asked Questions - Education
Schools Detail
Nearby Services & Amenities
Transport
Transport servicing is moderate compared to other areas nationally based on assessment of service frequency, route connectivity and accessibility
Mooroolbark has 46 operational public transport stops offering a mix of train and bus services. These stops are served by 22 distinct routes that together facilitate 3,656 weekly passenger trips. The accessibility to these stops is rated as moderate, with residents generally situated 422 meters from the nearest stop.
On average, there are 522 daily trips across all routes, which amounts to approximately 79 weekly trips per individual stop.
Frequently Asked Questions - Transport
Transport Stops Detail
Health
Mooroolbark's residents are relatively healthy in comparison to broader Australia with common health conditions slightly more prevalent than average across both younger and older age cohorts
Mooroolbark's health metrics closely align with national benchmarks.
Common health conditions are slightly more prevalent than average across both younger and older age cohorts, with mental health issues impacting 9.2% of residents and asthma affecting 8.7%. Approximately 52% of the total population (~12,664 people) have private health cover, slightly higher than the average SA2 area. Around 68.2% of residents declare themselves completely clear of medical ailments, compared to 66.9% across Greater Melbourne. The area has 16.5% of residents aged 65 and over (4,026 people), which is lower than the 19.4% in Greater Melbourne. Overall, Mooroolbark's health profile broadly aligns with that of the general population.
Frequently Asked Questions - Health
Cultural Diversity
The level of cultural diversity witnessed in Mooroolbark was found to be slightly above average when compared nationally for a number of language and cultural background related metrics
Mooroolbark had a cultural diversity index above the average, with 22.1% of its population born overseas and 15.7% speaking a language other than English at home. Christianity was the dominant religion in Mooroolbark, comprising 46.4% of the population. Notably, the 'Other' religious category had a higher representation in Mooroolbark at 0.8%, compared to Greater Melbourne's 0.7%.
In terms of ancestry, the top three groups were English (28.5%), Australian (27.4%), and Other (9.0%). There were also notable differences in the representation of certain ethnic groups: Dutch was overrepresented at 2.7% (vs regional 3.2%), Sri Lankan at 0.4% (vs 0.3%), and South African at 0.5% (vs 0.4%).
Frequently Asked Questions - Diversity
Age
Mooroolbark's population is slightly younger than the national pattern
Mooroolbark's median age is 37 years, matching Greater Melbourne's figure of 37 years and remaining comparable to Australia's median age of 38 years. The 5-14 age group comprises 13.0%, higher than Greater Melbourne's percentage, while the 25-34 cohort stands at 13.8%. Between 2021 and present, the 75-84 age group has grown from 4.9% to 6.0% of Mooroolbark's population, with the 35-44 cohort increasing from 14.5% to 15.5%. Conversely, the 25-34 cohort has decreased from 14.6% to 13.8%. By 2041, demographic projections indicate significant shifts in Mooroolbark's age structure. Notably, the 45-54 group is projected to grow by 25%, adding 736 people to reach a total of 3,701 from its previous figure of 2,964. Meanwhile, both the 5-14 and 0-4 age groups are expected to decrease in number.
