Chart Color Schemes
est. as @ -- *
ABS ERP | -- people | --
2021 Census | -- people
Sales Activity
Curious about local property values? Filter the chart to assess the volume and appreciation (including resales) trends and regional comparisons, or scroll to the map below view this information at an individual property level.
Find a Recent Sale
Sales Detail
Population
Miandetta - Don has seen population growth performance typically on par with national averages when looking at short and medium term trends
Miandetta - Don's population is around 3,897 as of November 2025. This reflects an increase from the 2021 Census figure of 3,661 people, marking a growth of 236 individuals (6.4%). AreaSearch inferred this change using the estimated resident population of 3,786 in June 2024 and validated new addresses since the Census date. This results in a population density ratio of 168 persons per square kilometer. Miandetta - Don's growth rate exceeded both its SA4 region (4.7%) and state averages during this period. Natural growth accounted for approximately 68.9% of overall population gains recently.
AreaSearch uses ABS/Geoscience Australia projections for each SA2 area, released in 2024 with a base year of 2022. For areas not covered by this data and post-2032 estimates, Tasmania State Government's Regional/LGA projections from 2022 using a 2021 base year are adopted with adjustments made employing weighted aggregation methods. Projected demographic shifts indicate an overall population decline of 77 persons by 2041. However, specific age cohorts like the 75 to 84 group are expected to grow by 66 people during this period.
Frequently Asked Questions - Population
Development
Residential development activity is lower than average in Miandetta - Don according to AreaSearch's national comparison of local real estate markets
Miandetta - Don has received around 13 dwelling approvals per year over the past five financial years, totalling 65 homes. In FY-26 so far, there have been 5 approvals. On average, 1.3 people moved to the area annually for each dwelling built between FY-21 and FY-25. The average construction cost of new properties is $289,000.
This year has seen $3.0 million in commercial approvals, indicating a primarily residential area. Compared to the rest of Tasmania, Miandetta - Don has approximately two-thirds the rate of new dwelling approvals per person and ranks among the 54th percentile nationally. Recent building activity consists solely of detached houses, maintaining low density character and appealing to families seeking space. With around 293 people per approval, Miandetta - Don reflects a transitioning market.
Stable or declining population forecasts suggest less housing pressure, creating favourable conditions for buyers.
Frequently Asked Questions - Development
Infrastructure
Miandetta - Don has limited levels of nearby infrastructure activity, ranking in the 11thth percentile nationally
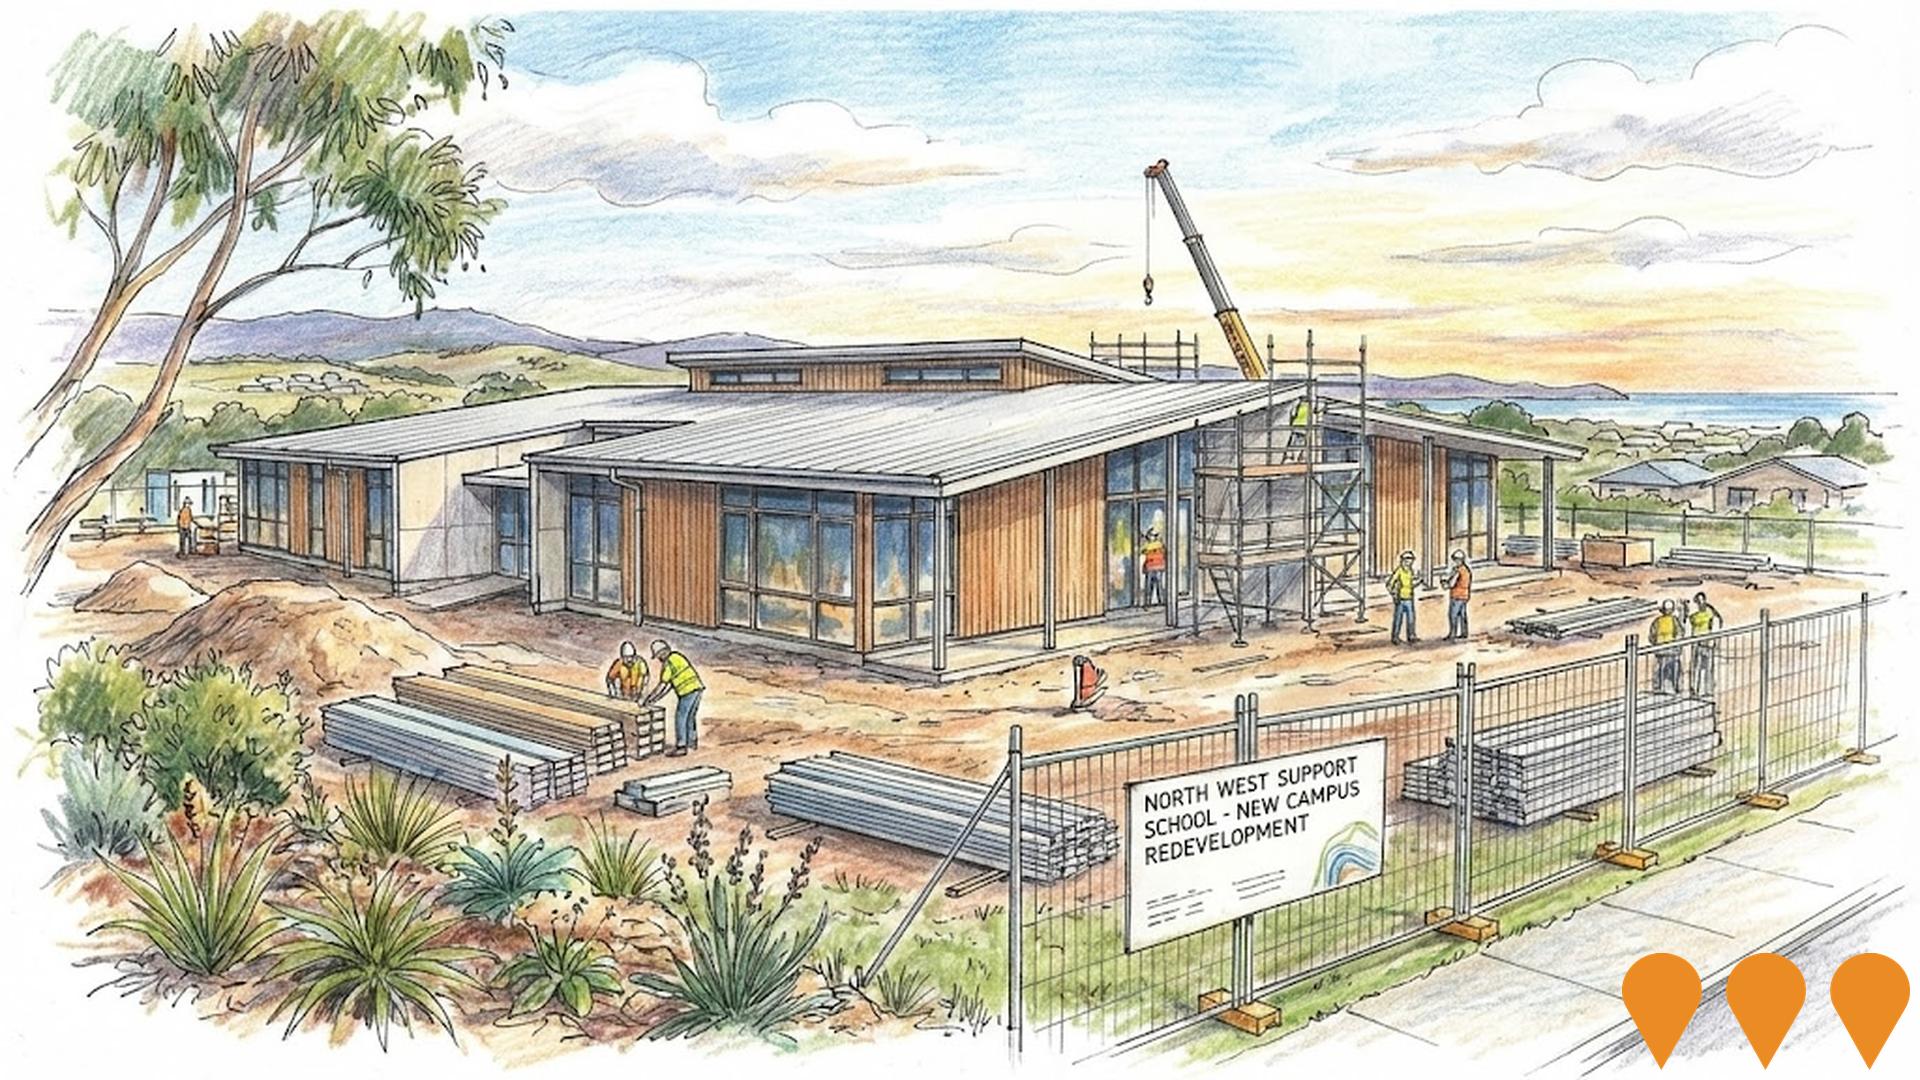
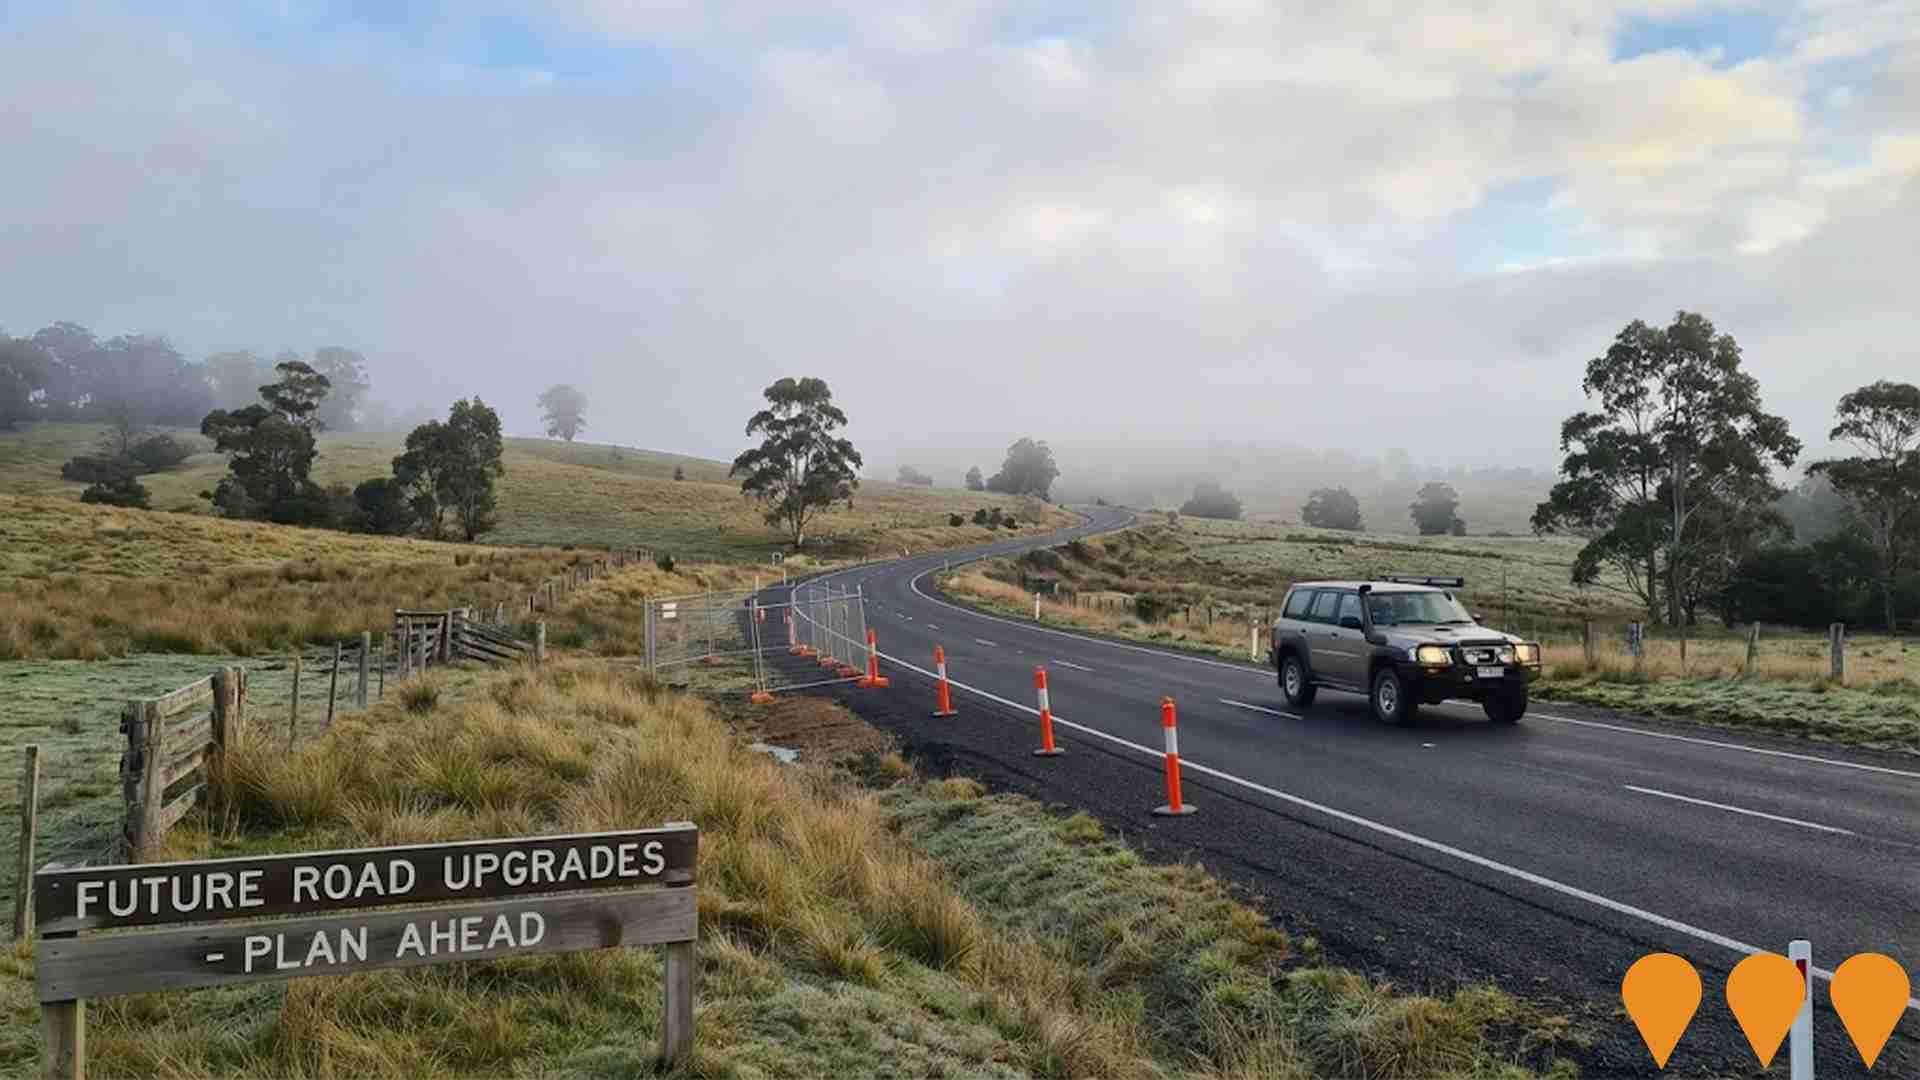
Changes to local infrastructure significantly influence an area's performance. AreaSearch has identified 19 projects that could impact this area. Notable projects include Devonport Oval Sports Complex, North West Support School Devonport, Devonport to Cradle Mountain Corridor - Planning, and Devonport Mental Health Hub. The following list details those most likely relevant.
Professional plan users can use the search below to filter and access additional projects.
INFRASTRUCTURE SEARCH
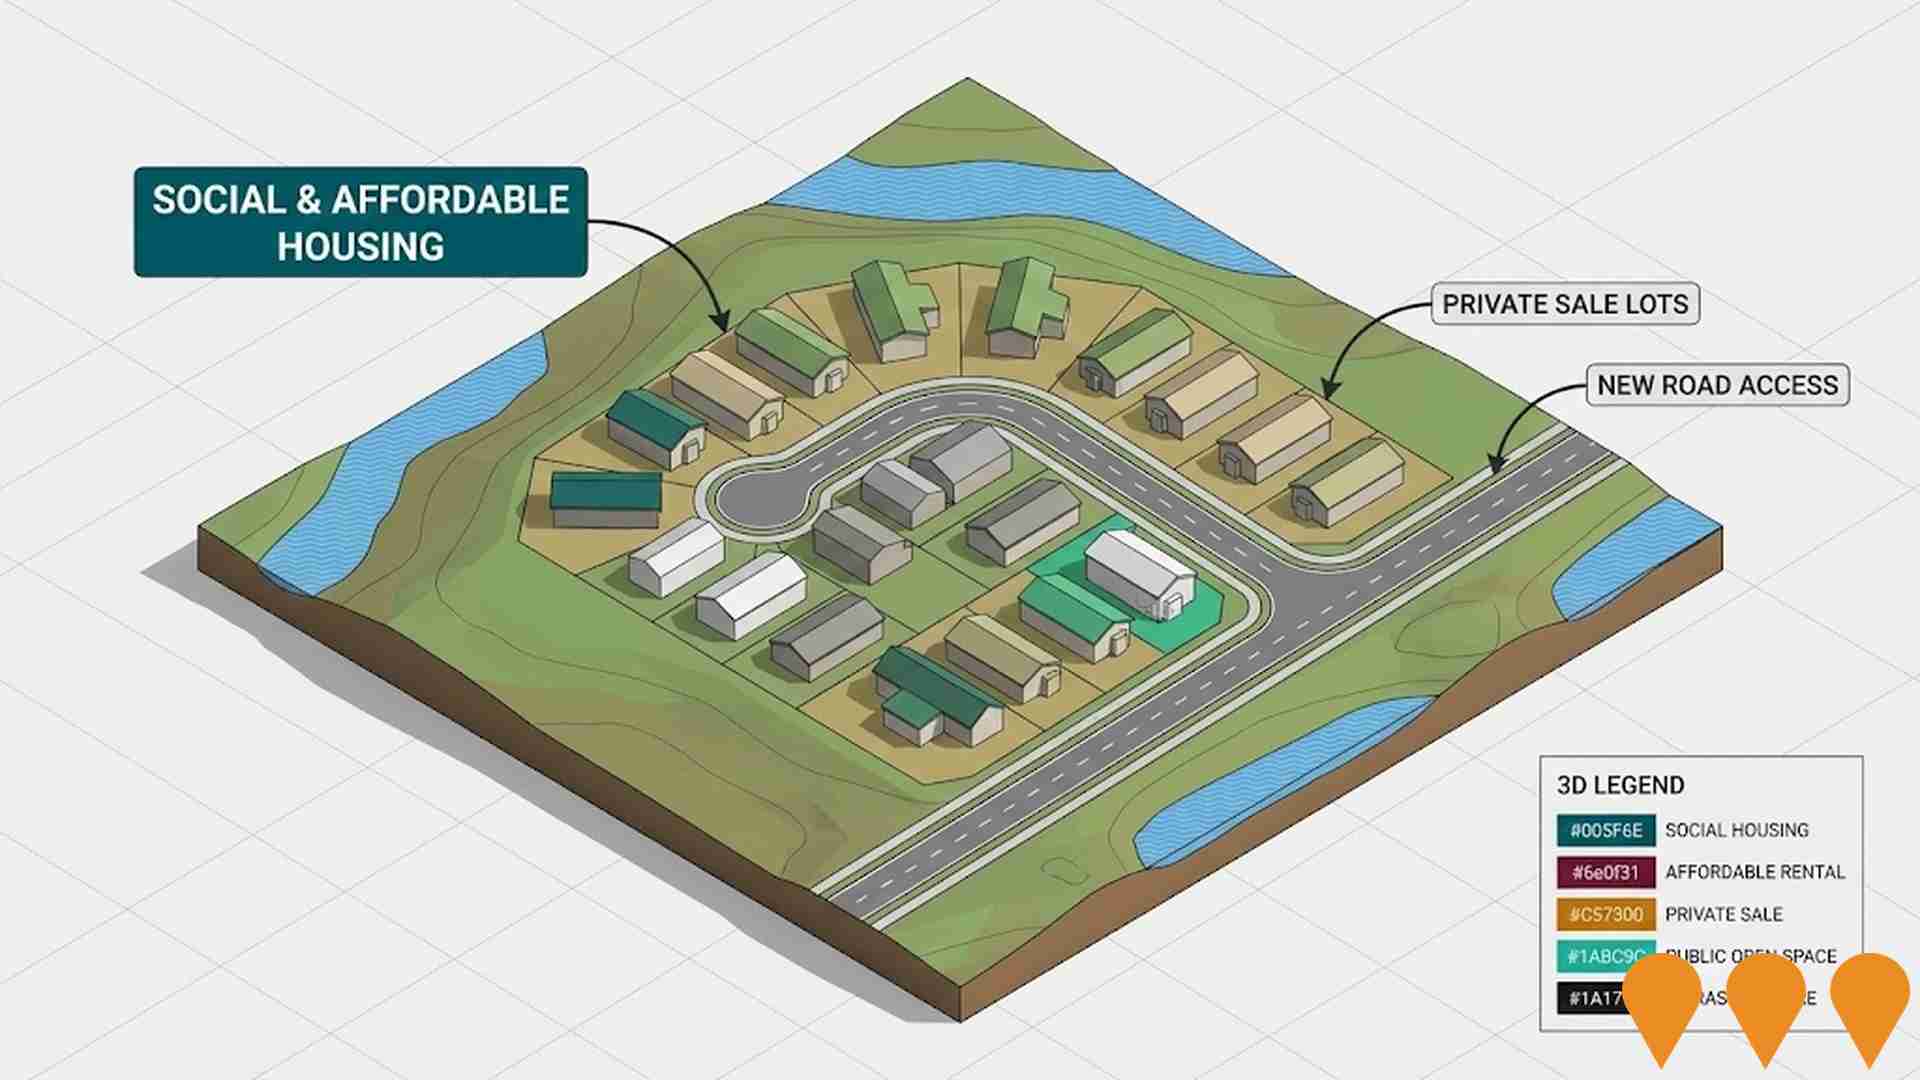
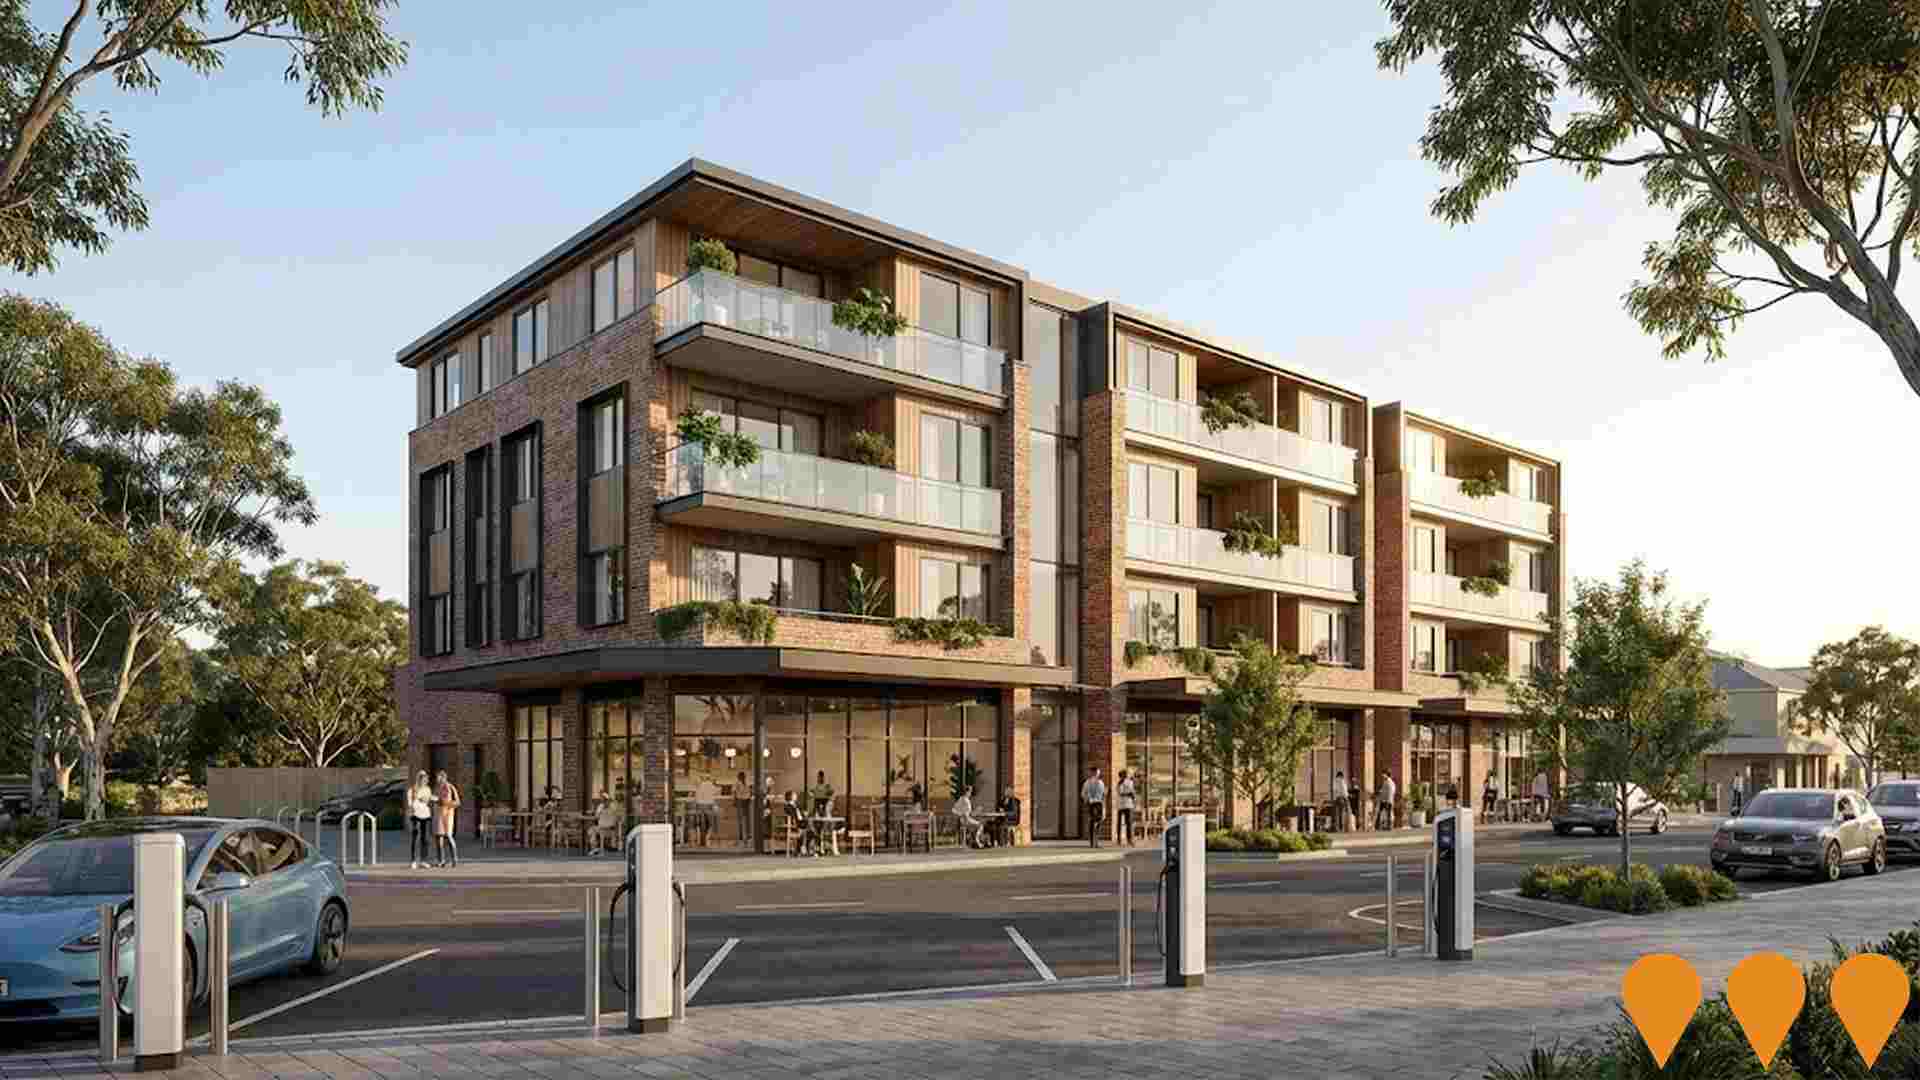
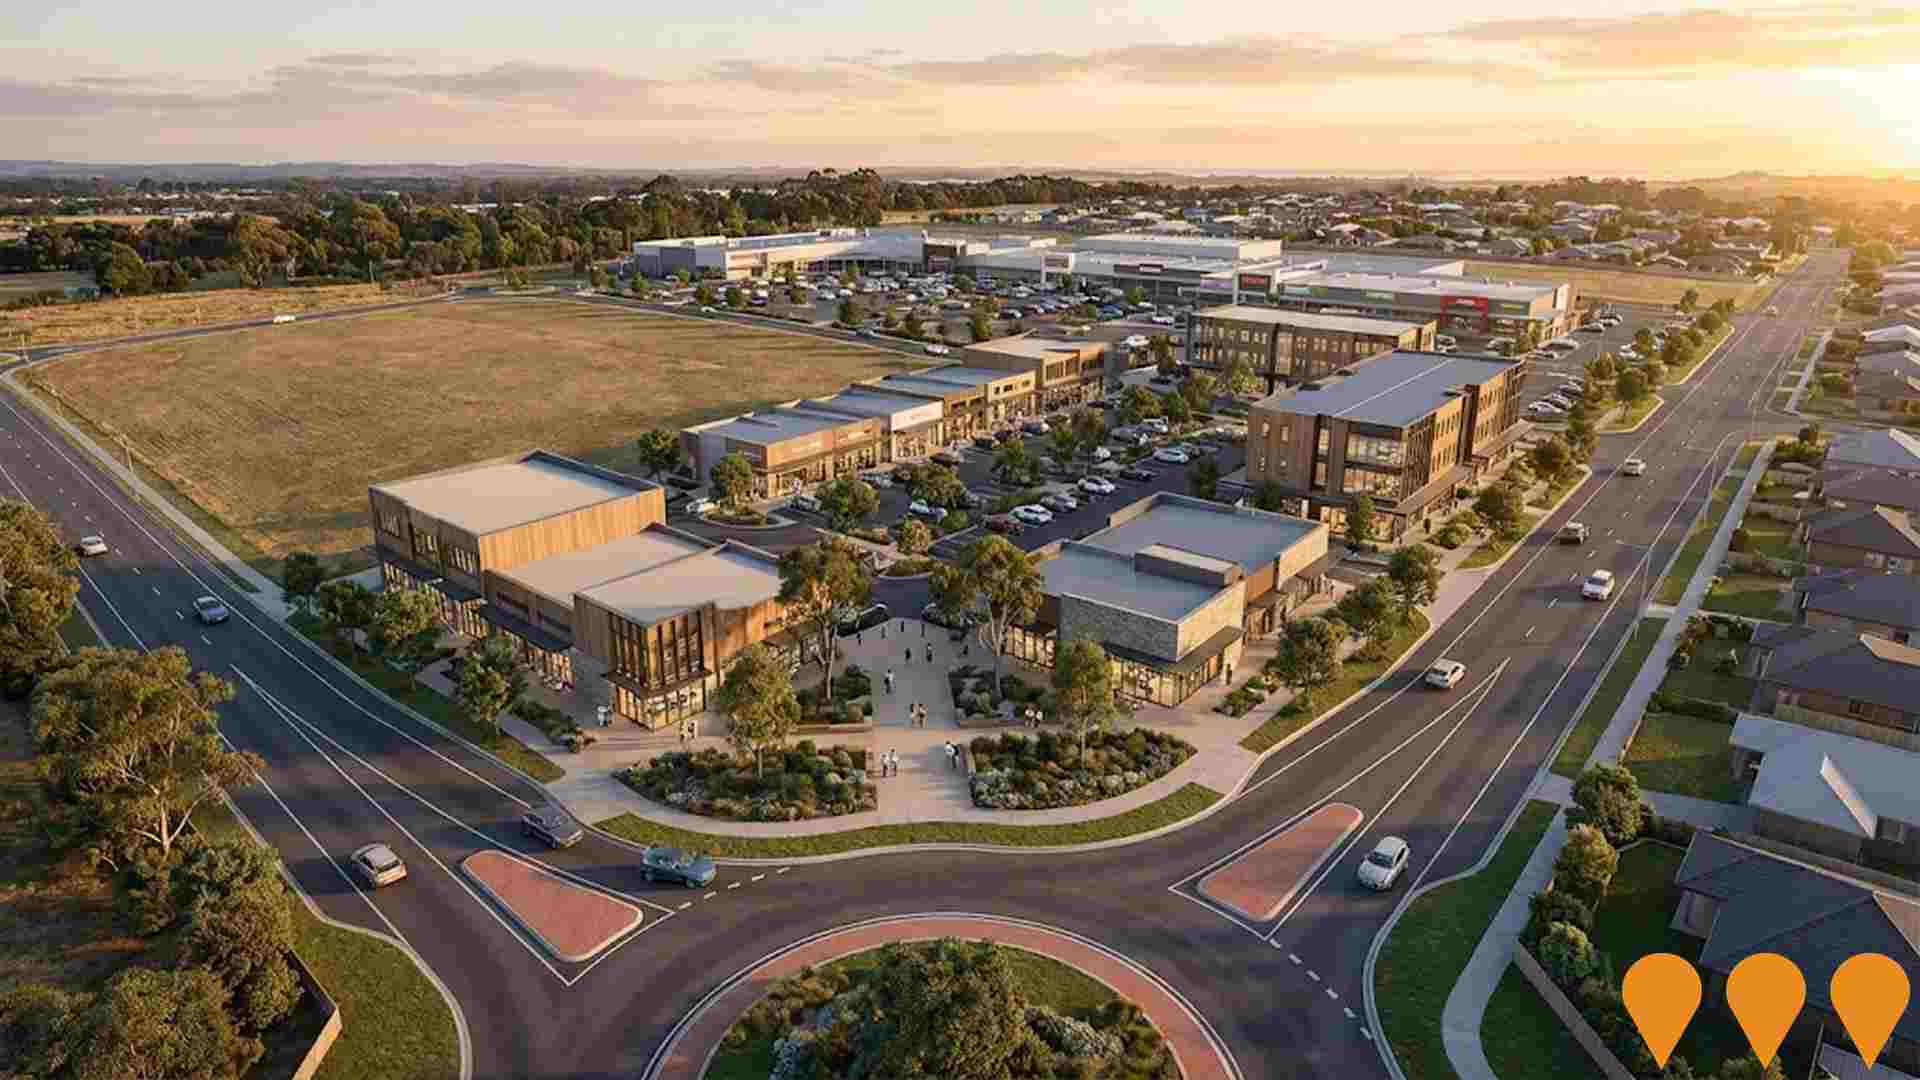
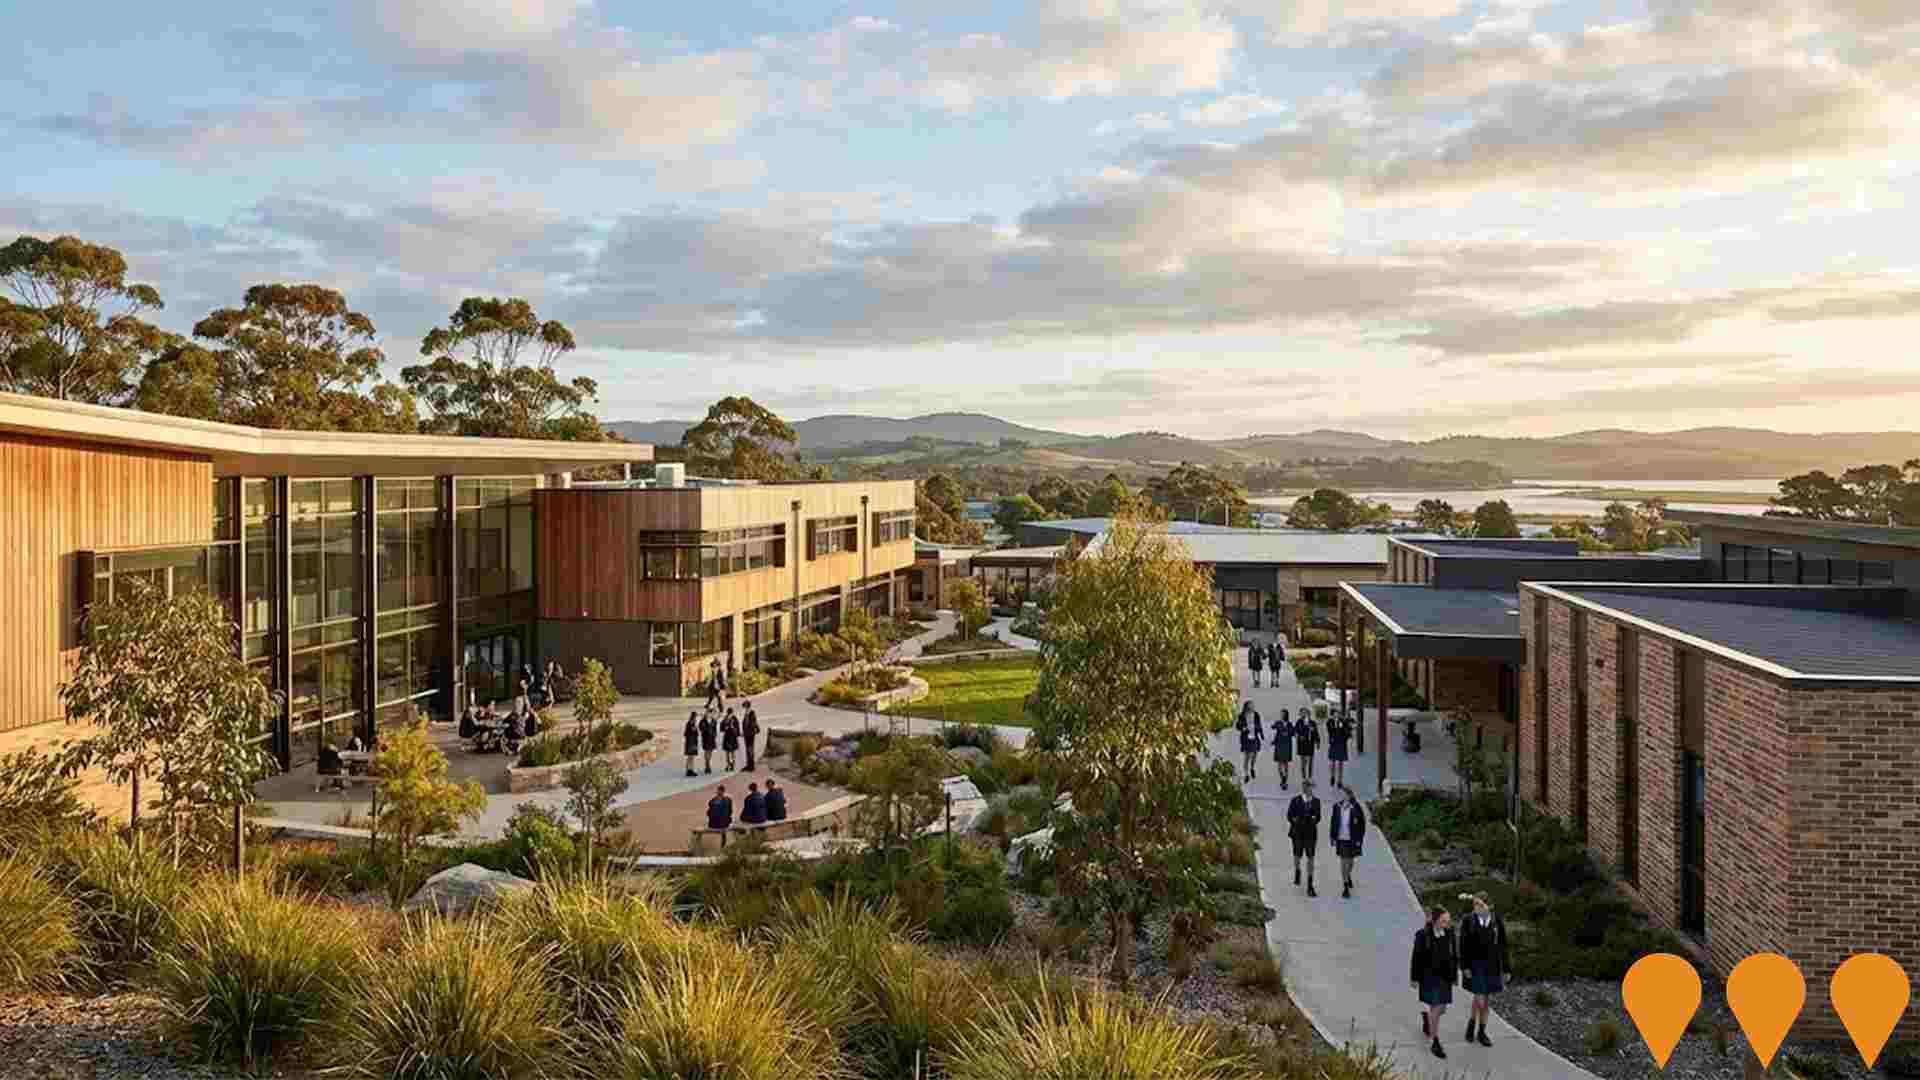
 Denotes AI-based impression for illustrative purposes only, not to be taken as definitive under any circumstances. Please follow links and conduct other investigations from the project's source for actual imagery. Developers and project owners wishing us to use original imagery please Contact Us and we will do so.
Frequently Asked Questions - Infrastructure
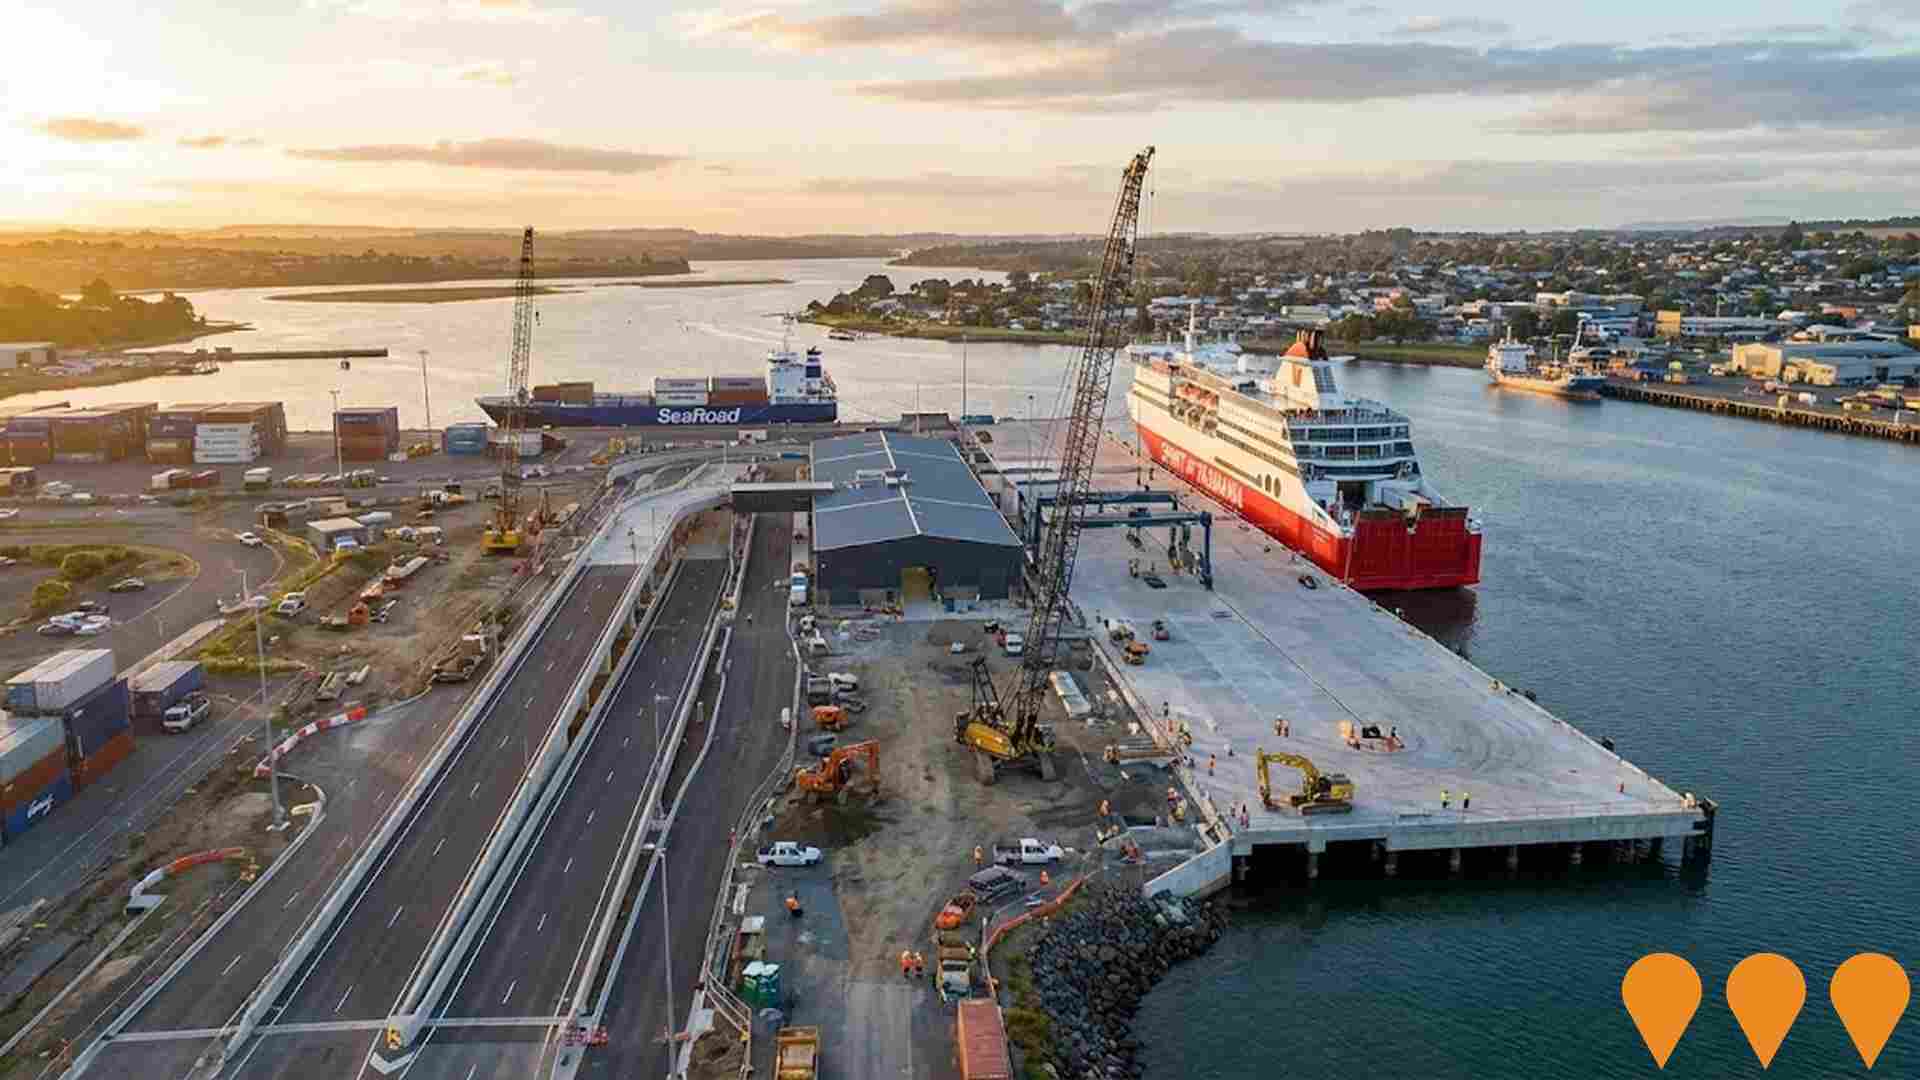
Spirit of Tasmania New Vessels and Port Upgrade
The project involves two new, larger vessels, **Spirit of Tasmania IV** and **Spirit of Tasmania V**, to replace the existing fleet, as well as the associated **QuayLink port infrastructure upgrades** in Devonport, Tasmania. The new vessels have significantly enhanced capacity, accommodating up to 1,800 passengers and 4,098 lane metres for vehicles. The new East Devonport terminal (Berth 3) and passenger terminal building are being constructed. **Spirit of Tasmania IV** has been delivered to TT-Line and is undergoing a final fit-out in Tasmania, while **Spirit of Tasmania V** is nearing completion with rectification works on its LNG system following sea trials. The expected in-service date for the new vessels is now aligned with the completion of the Devonport berth, anticipated to be in **October 2026** for the 2026-27 peak summer season.

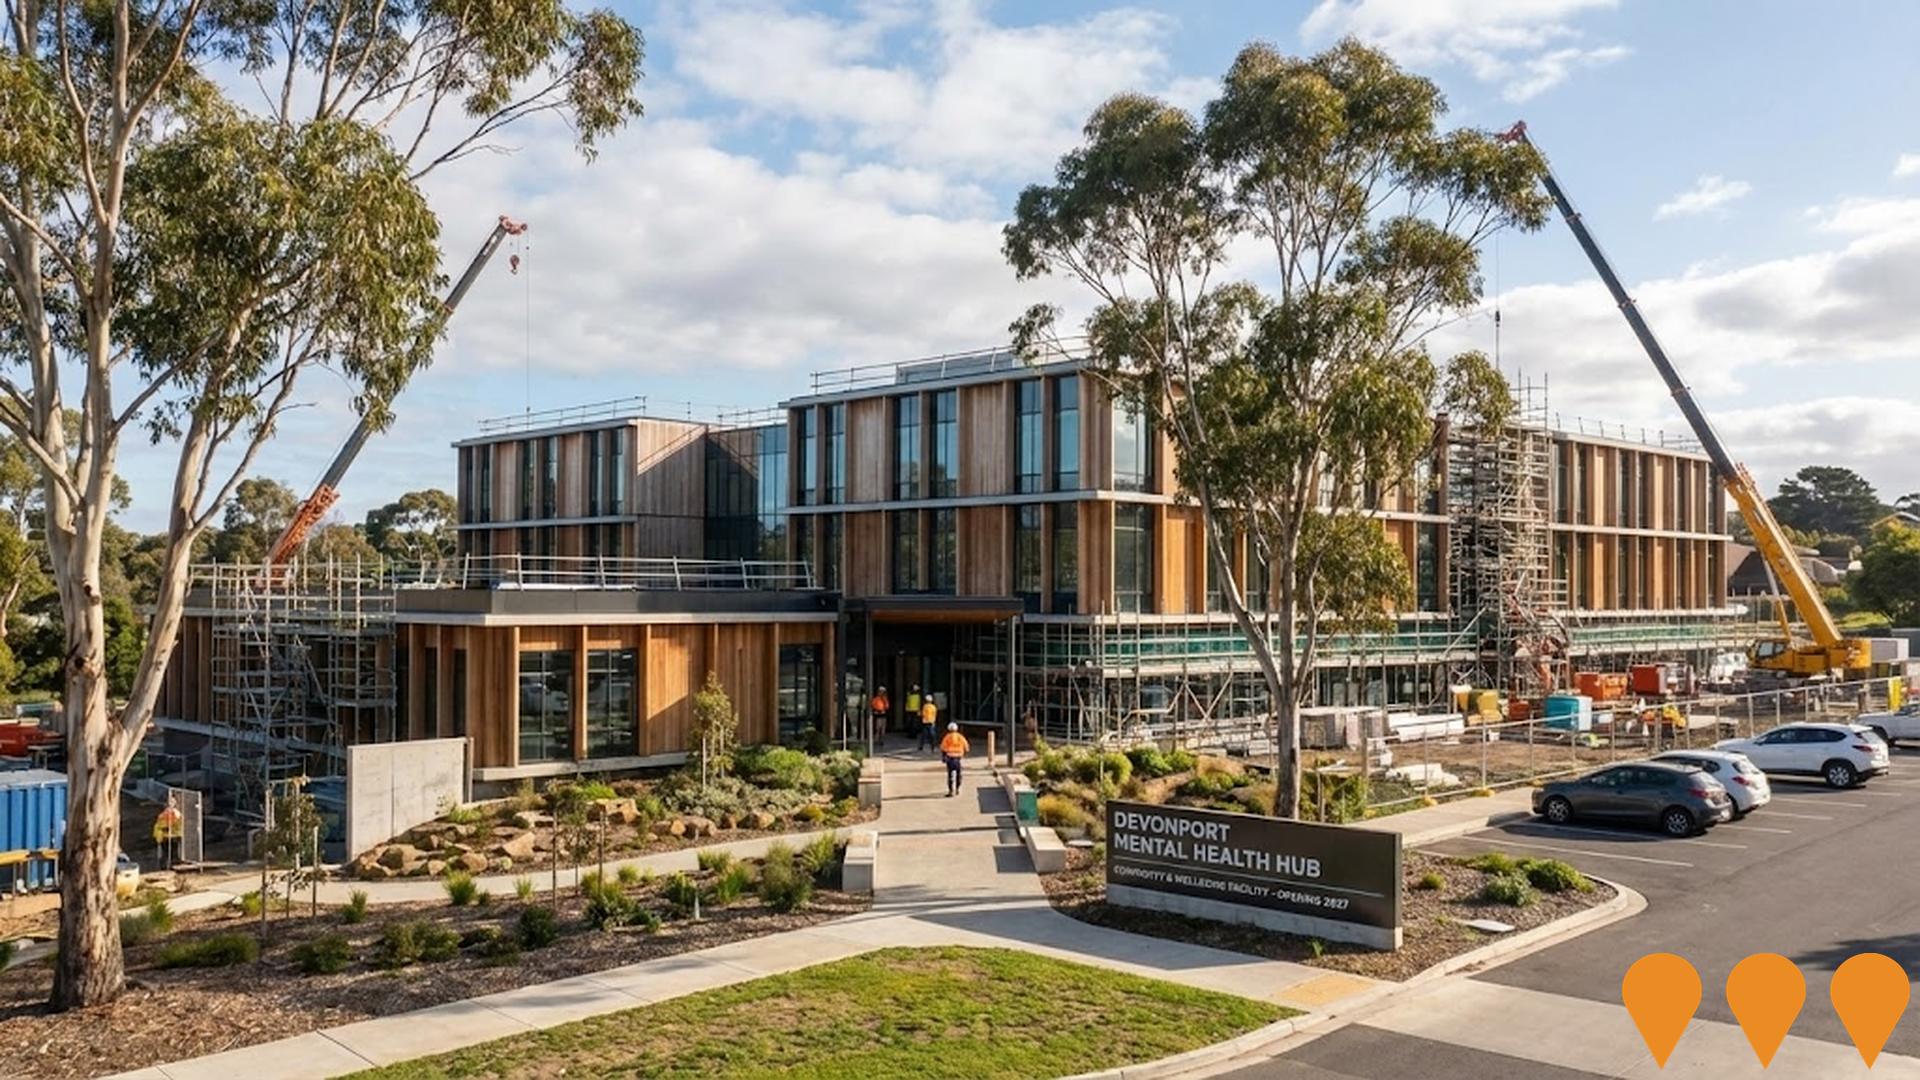
Devonport Mental Health Hub
A new $40 million purpose-built mental health facility for Tasmania's North West region. The hub includes a Safe Haven for people experiencing suicidal or situational distress, a Recovery College offering free peer-led education, and an Integration Hub providing brief interventions and navigation support. Construction commenced in early 2025 and the facility is on track for completion in late 2027.
TasPorts QuayLink Port Development
A once-in-a-generation infrastructure development project by TasPorts to upgrade the East Devonport port infrastructure. This $240 million investment will future-proof the Port of Devonport for the next 50 years, accommodating new, larger vessels. It's expected to increase freight capacity by 40% and facilitate an additional 160,000 passengers annually, creating over 2000 jobs during the peak construction phase. The works include marine and landside infrastructure improvements across Terminals 1, 2, and 3 for the operations of Spirit of Tasmania (TT-Line) and SeaRoad.
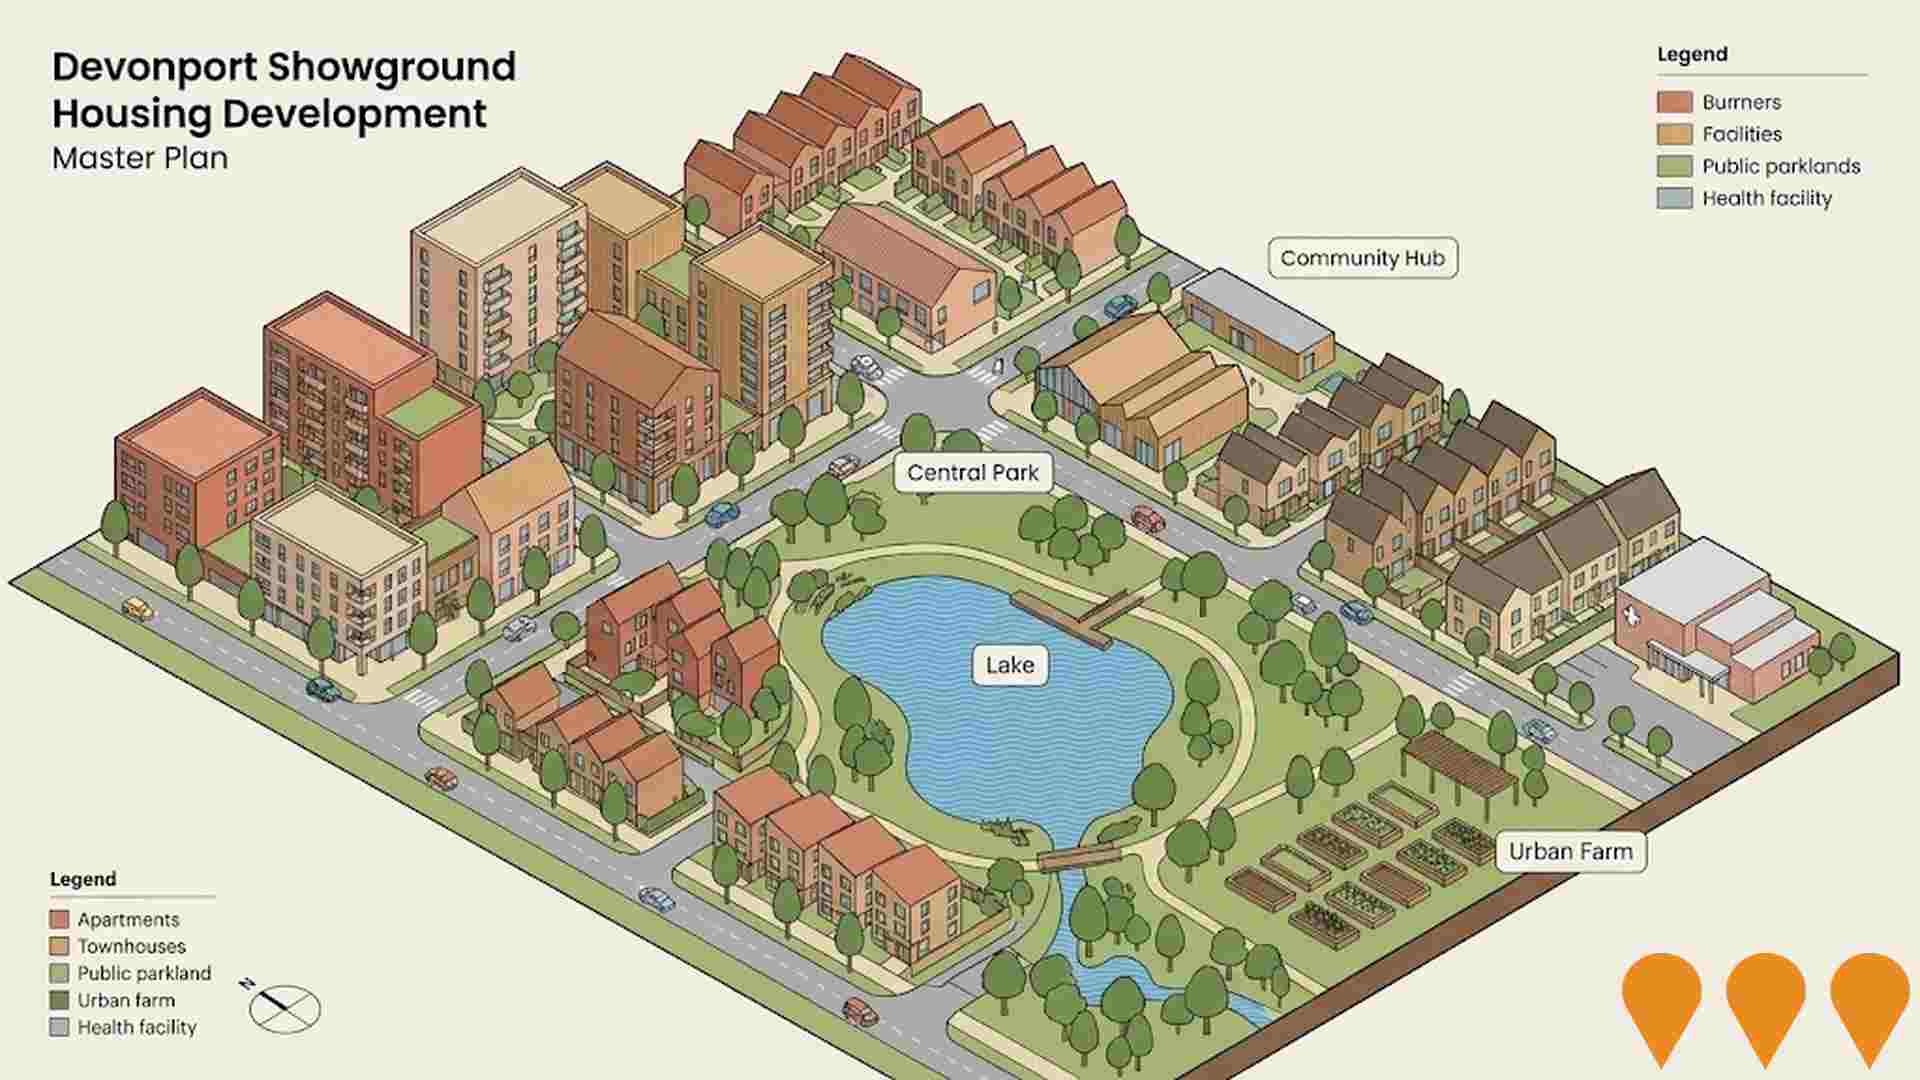
Devonport Showground Housing Development
Tasmania's largest private infill housing development on a 10ha CBD site, comprising approximately 200 homes of diverse and adaptable typologies (including affordable, aged care, and disability housing), a health facility, community facilities, a central lake, public parkland, and a large urban farm. The project follows rezoning approval in late 2022 and the first development application (a 'super lot' subdivision) was advertised for public exhibition in April 2024. The project is being developed to create a socially-inclusive, community-centered 'village in a city'.
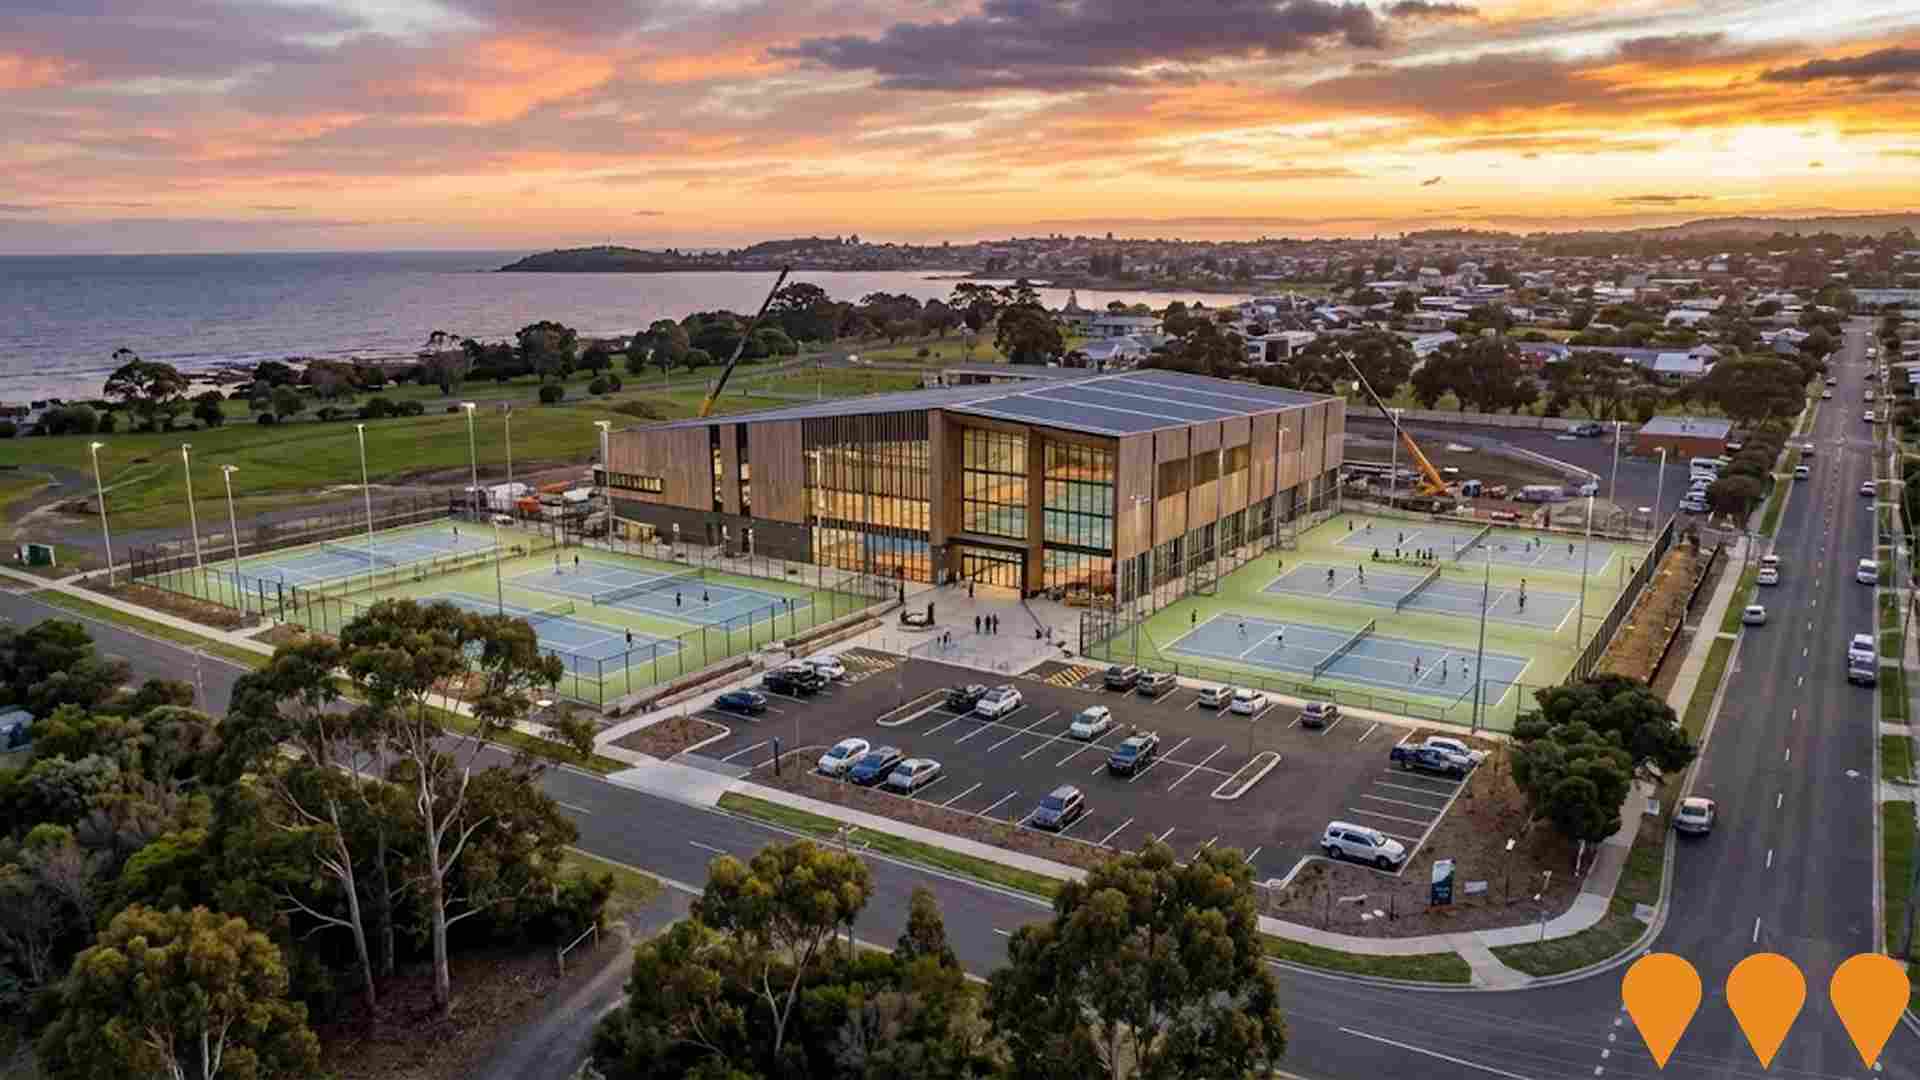
Devonport Oval Sports Complex
Six-court indoor sports venue with five outdoor courts, serving at least six major sporting codes. Includes shared social facilities, administration facilities, and high-performance training areas. Contractor: Fairbrother Pty Ltd.
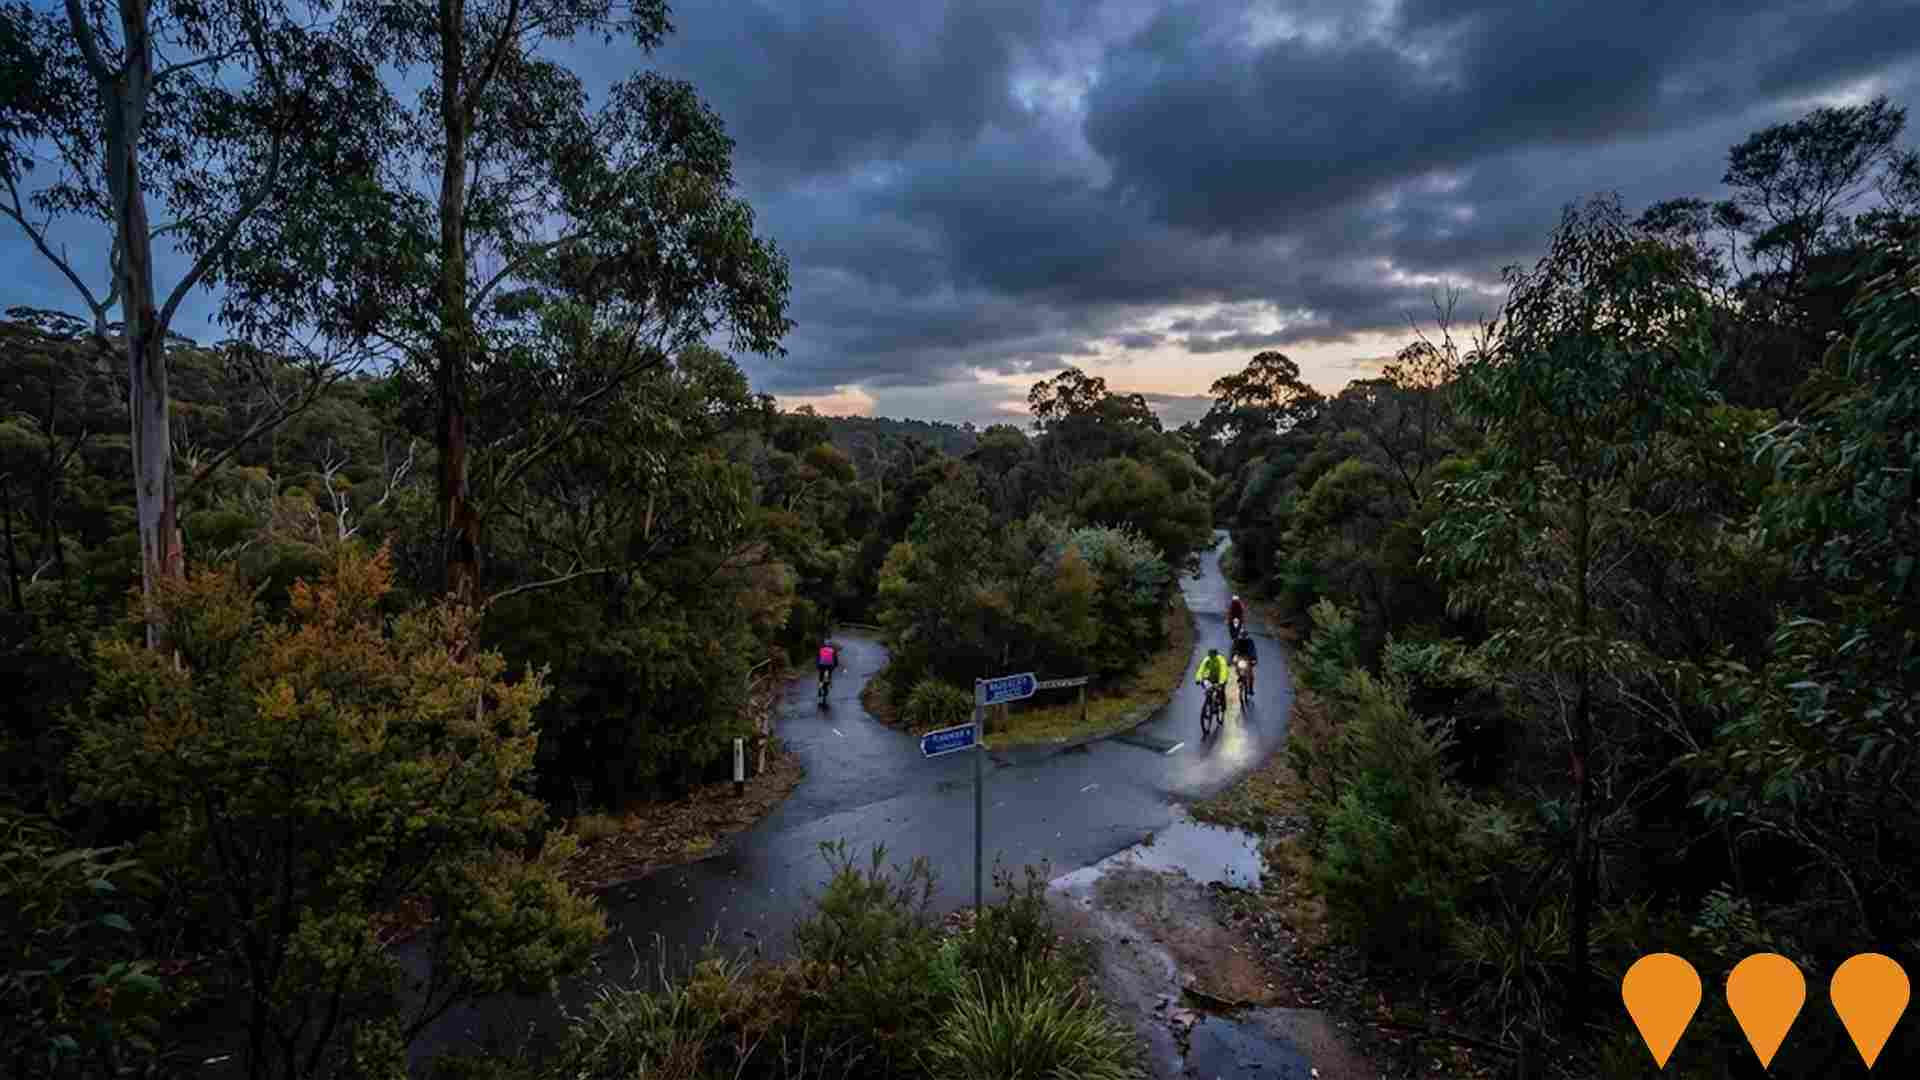
Don to Leith Coastal Pathway
110km cycle pathway linking towns and cities from Latrobe to Wynyard, connecting more than 85,000 residents. Devonport to Latrobe section complete, Devonport to Ulverstone under construction. Part of regional infrastructure initiative.
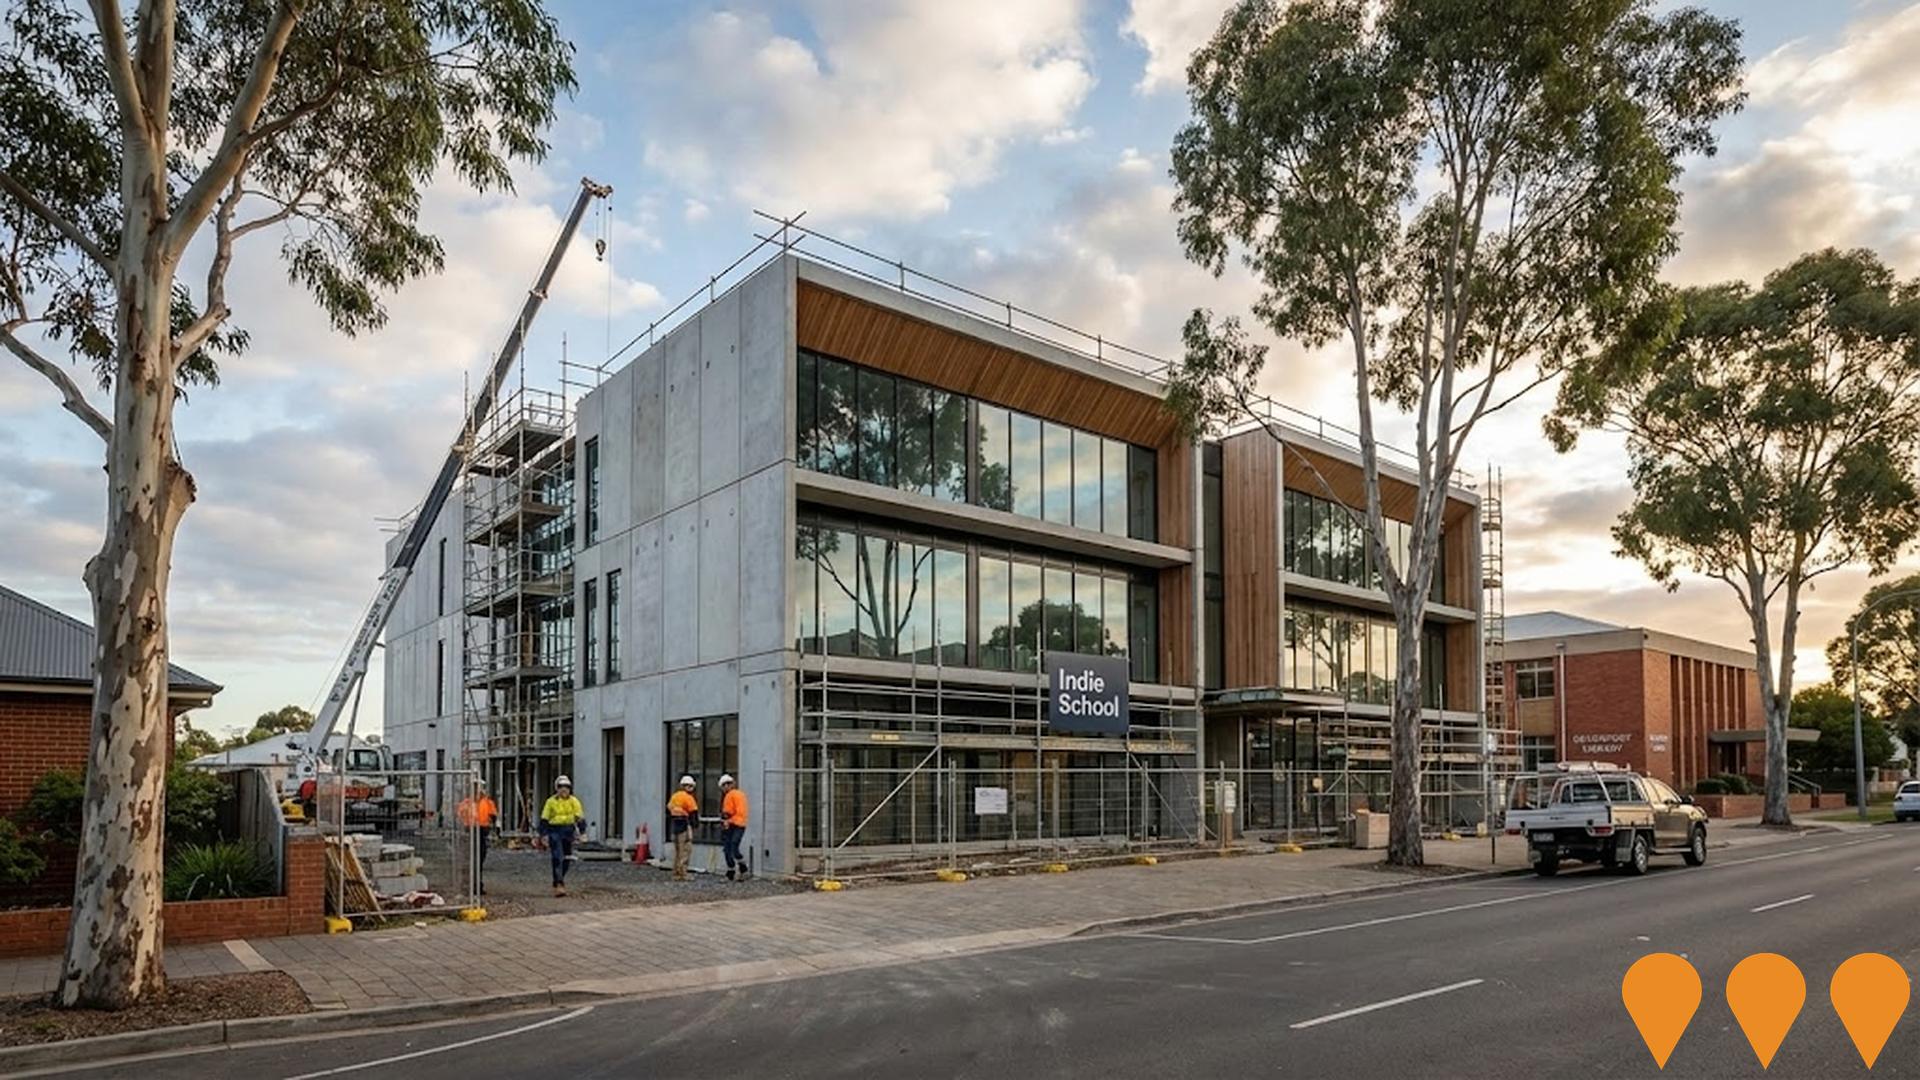
Indie Education School Development (Devonport)
Three storey education facility for Indie School at 29 Fenton Way, delivering two levels for school operations plus a third level for Indie Education head office functions. Contractor: Fairbrother Pty Ltd. Architect: NH Architecture. Construction commenced October 2024 with a target completion in February 2026. Works include flexible learning spaces, home economics facilities, staff areas and an outdoor rooftop terrace. The project supports Devonport's Living City initiative and is adjacent to the current campus in the former Devonport Library.
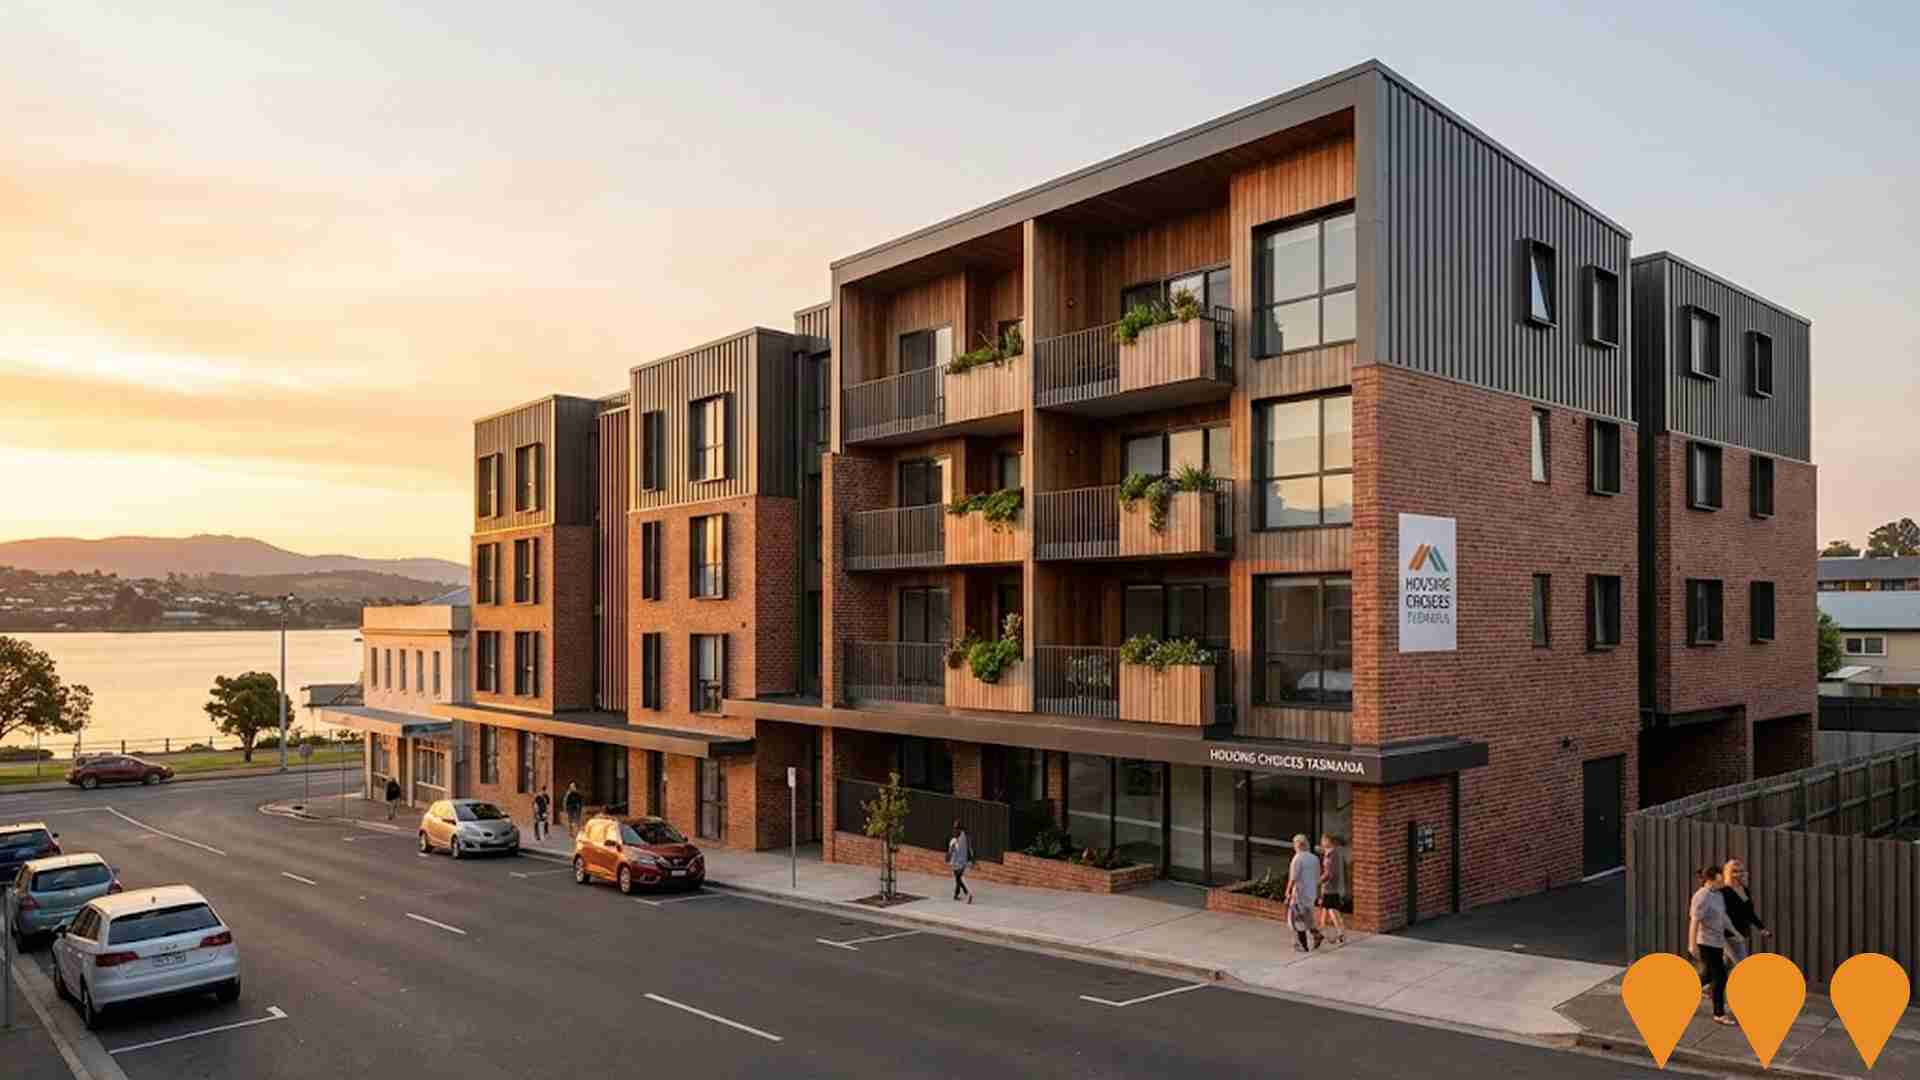
11 Fenton Street Social Housing Development
A multi-storey social and affordable housing development providing 30 apartments to address housing needs in Devonport's city centre. The project is part of Housing Choices Tasmania's ongoing commitment to deliver quality housing in the North West region.
Employment
Employment performance in Miandetta - Don exceeds national averages across key labour market indicators
Miandetta - Don has a skilled labor force with notable representation in essential services sectors. The unemployment rate as of June 2025 is 2.6%.
Over the past year, there has been an estimated employment growth of 1.6%. As of this date, 1,981 residents are employed while the unemployment rate is 1.3% lower than Rest of Tas.'s rate of 3.9%. Workforce participation stands at 63.3%, higher than Rest of Tas.'s 55.7%. Employment is concentrated in health care & social assistance, retail trade, and construction sectors.
The area has a particular employment specialization in transport, postal & warehousing, with an employment share of 1.5 times the regional level. Conversely, agriculture, forestry & fishing employs only 4.0% of local workers, lower than Rest of Tas.'s 8.4%. Over the year to June 2025, employment increased by 1.6%, while labor force increased by 2.2%, leading to a rise in unemployment rate by 0.5 percentage points. In contrast, Rest of Tas. saw a decrease in employment by 0.5% and a contraction in labor force by 0.6%. According to Jobs and Skills Australia's national employment forecasts from May 2025, national employment is projected to expand by 6.6% over five years and 13.7% over ten years. Applying these projections to Miandetta - Don's employment mix suggests local growth of approximately 6.0%% over five years and 12.9% over ten years.
Frequently Asked Questions - Employment
Income
Income levels align closely with national averages, indicating typical economic conditions for Australian communities according to AreaSearch analysis
AreaSearch's latest postcode level ATO data for financial year 2022 shows Miandetta - Don's median income among taxpayers is $56,218. The average income is $66,346. This places Miandetta - Don slightly above the national average. Rest of Tas., in comparison, has a median income of $47,358 and an average of $57,384. Based on Wage Price Index growth since financial year 2022, current estimates for Miandetta - Don's median income would be approximately $63,993 as of September 2025, with the average estimated at $75,522. According to 2021 Census figures, incomes in Miandetta - Don rank modestly, between the 39th and 40th percentiles for household, family, and personal incomes. Income distribution data shows that 33.3% of locals (1,297 people) fall into the $1,500 - 2,999 category, which aligns with regional levels at 28.5%. Housing costs are manageable with 88.5% retained, but disposable income is below average, ranking at the 45th percentile.
Frequently Asked Questions - Income
Housing
Miandetta - Don is characterized by a predominantly suburban housing profile, with ownership patterns similar to the broader region
Miandetta - Don's dwelling structures, as per the latest Census, were 96.6% houses and 3.4% other dwellings (semi-detached, apartments, 'other' dwellings). Non-Metro Tas., in comparison, had 90.3% houses and 9.7% other dwellings. Home ownership in Miandetta - Don was 39.5%, with mortgaged dwellings at 41.1% and rented ones at 19.3%. The median monthly mortgage repayment was $1,305, higher than Non-Metro Tas.'s average of $1,300. Median weekly rent in Miandetta - Don was $290, compared to Non-Metro Tas.'s $250. Nationally, mortgage repayments were significantly lower at $1,863 and rents substantially below the national figure of $375.
Frequently Asked Questions - Housing
Household Composition
Miandetta - Don has a typical household mix, with a higher-than-average median household size
Family households comprise 76.8% of all households, including 31.5% couples with children, 33.4% couples without children, and 11.2% single parent families. Non-family households make up 23.2%, consisting of lone person households at 20.9% and group households at 2.3%. The median household size is 2.6 people, larger than the Rest of Tas. average of 2.3.
Frequently Asked Questions - Households
Local Schools & Education
Educational outcomes in Miandetta - Don fall within the lower quartile nationally, indicating opportunities for improvement in qualification attainment
The area's university qualification rate is 17.6%, significantly lower than the Australian average of 30.4%. This disparity presents both a challenge and an opportunity for targeted educational initiatives. Bachelor degrees are the most prevalent at 12.6%, followed by postgraduate qualifications (3.0%) and graduate diplomas (2.0%). Vocational credentials are prominent, with 42.0% of residents aged 15+ holding such qualifications - advanced diplomas comprise 9.7% and certificates make up 32.3%.
Educational participation is high, with 26.6% of residents currently enrolled in formal education. This includes 10.3% in primary education, 8.2% in secondary education, and 2.4% pursuing tertiary education. The area has two schools serving 649 students: Miandetta Primary School and Devonport Christian School. These schools focus exclusively on primary education, with secondary options available in surrounding areas. The area demonstrates typical Australian school conditions (ICSEA: 986) with balanced educational opportunities.
Frequently Asked Questions - Education
Schools Detail
Nearby Services & Amenities
Transport
No public transport data available for this catchment area.
Frequently Asked Questions - Transport
Transport Stops Detail
Health
Health performance in Miandetta - Don is lower than average with common health conditions somewhat prevalent across both younger and older age cohorts
Miandetta - Don faces significant health challenges with common health conditions prevalent among both younger and older age cohorts. The rate of private health cover is approximately 52% of the total population (around 2,042 people), which is higher than the average SA2 area's rate of 48.3%.
The most common medical conditions are arthritis and asthma, affecting 10.4 and 9.0% of residents respectively. About 64.4% of residents report being free from medical ailments, compared to 61.1% in the rest of Tasmania. The area has 21.3% of residents aged 65 and over (830 people), which is lower than the 25.4% in the rest of Tasmania.
Frequently Asked Questions - Health
Cultural Diversity
Miandetta - Don is considerably less culturally diverse than average when assessed alongside AreaSearch's national rankings for language and cultural background related metrics
Miandetta-Don had below average cultural diversity, with 88.9% of its population born in Australia, 93.0% being citizens, and 95.0% speaking English only at home. Christianity was the main religion, comprising 42.6% of people. Hinduism, at 1.0%, was slightly overrepresented compared to Rest of Tas.'s 0.9%.
The top three ancestral groups were English (34.5%), Australian (33.6%), and Scottish (7.3%). Notably, Australian Aboriginal (4.6%) and Dutch (1.6%) were overrepresented compared to regional averages of 4.7% and 1.4%, respectively, while Welsh at 0.5% was also slightly higher than the region's 0.4%.
Frequently Asked Questions - Diversity
Age
Miandetta - Don's median age exceeds the national pattern
Miandetta - Don has a median age of 41, which is younger than the Rest of Tas figure of 45 but slightly higher than the national average of 38 years. The age profile shows that those aged 15-24 make up 12.0% of the population, while those aged 55-64 account for 12.1%. Since the Census in 2021, the percentage of people aged 85 and above has increased from 1.4% to 2.4%, whereas the proportion of those aged 5-14 has decreased from 13.3% to 12.0%. By 2041, demographic projections indicate significant shifts in Miandetta - Don's age structure. The 75-84 age group is expected to grow by 22%, reaching 324 people from the current figure of 266. Notably, all population growth will be accounted for by those aged 65 and above, reflecting the area's aging demographic trend. In contrast, the 45-54 and 25-34 age groups are projected to experience population declines.
