Chart Color Schemes
This analysis uses ABS Statistical Areas Level 2 (SA2) boundaries, which can materially differ from Suburbs and Localities (SAL) even when sharing similar names.
SA2 boundaries are defined by the Australian Bureau of Statistics and are designed to represent communities for statistical reporting (e.g., census and ERP).
Suburbs and Localities (SAL) represent commonly-used suburb/locality names (postal-style areas) and may use different geographic boundaries. For comprehensive analysis, consider reviewing both boundary types if available.
est. as @ -- *
ABS ERP | -- people | --
2021 Census | -- people
Sales Activity
Curious about local property values? Filter the chart to assess the volume and appreciation (including resales) trends and regional comparisons, or scroll to the map below view this information at an individual property level.
Find a Recent Sale
Sales Detail
Population
Kimba - Cleve - Franklin Harbour is positioned among the lower quartile of areas assessed nationally for population growth based on AreaSearch's assessment of recent, and medium term trends
As of November 2025, Kimba-Cleve-Franklin Harbour's population is approximately 4,420, showing a growth of 219 people since the 2021 Census. This increase represents a 5.2% rise from the previous census figure of 4,201. The estimated resident population in June 2024 was 4,349, with an additional 70 validated new addresses since the Census date contributing to this growth. This results in a population density ratio of 0.30 persons per square kilometer. Kimba-Cleve-Franklin Harbour's population growth rate of 5.2% is comparable to its SA4 region's growth rate of 5.3%. Interstate migration accounted for approximately 62.2% of the overall population gains in recent periods.
AreaSearch uses ABS/Geoscience Australia projections for each SA2 area, released in 2024 with a base year of 2022. For areas not covered and years post-2032, the SA State Government's Regional/LGA projections by age category are adopted, based on 2021 data and adjusted using a method of weighted aggregation from LGA to SA2 levels. By 2041, Kimba-Cleve-Franklin Harbour is projected to increase its population by 252 persons, reflecting an overall gain of 4.1% over the 17-year period based on the latest annual ERP population numbers.
Frequently Asked Questions - Population
Development
Residential development activity is lower than average in Kimba - Cleve - Franklin Harbour according to AreaSearch's national comparison of local real estate markets
Kimba - Cleve - Franklin Harbour has received approximately 11 dwelling approvals per year over the past five financial years, totalling 59 homes. In FY-26 so far, six approvals have been recorded. On average, 0.9 new residents have moved in annually for each dwelling constructed between FY-21 and FY-25. The average construction value of new properties is $300,000.
This financial year has seen $5.7 million in commercial approvals, indicating the area's primarily residential nature. Compared to Rest of SA, Kimba - Cleve - Franklin Harbour experiences 14.0% less building activity per person and ranks at the 50th percentile nationally. Recent building activity consists solely of detached dwellings, maintaining the area's low density with approximately 321 people per dwelling approval. By 2041, Kimba - Cleve - Franklin Harbour is projected to grow by 181 residents.
Based on current development patterns, new housing supply should meet demand, offering favourable conditions for buyers and potentially facilitating population growth beyond projections.
Frequently Asked Questions - Development
Infrastructure
Kimba - Cleve - Franklin Harbour has emerging levels of nearby infrastructure activity, ranking in the 22ndth percentile nationally
Changes to local infrastructure significantly influence an area's performance. AreaSearch identified 42 projects that could impact this region. Key projects include Yadnarie Solar and Energy Storage Project, South Australian Regional Bulk Port Development, Cape Hardy Advanced Fuels Precinct, and Northern Water. Below is a list of those likely to be most relevant.
Professional plan users can use the search below to filter and access additional projects.
INFRASTRUCTURE SEARCH
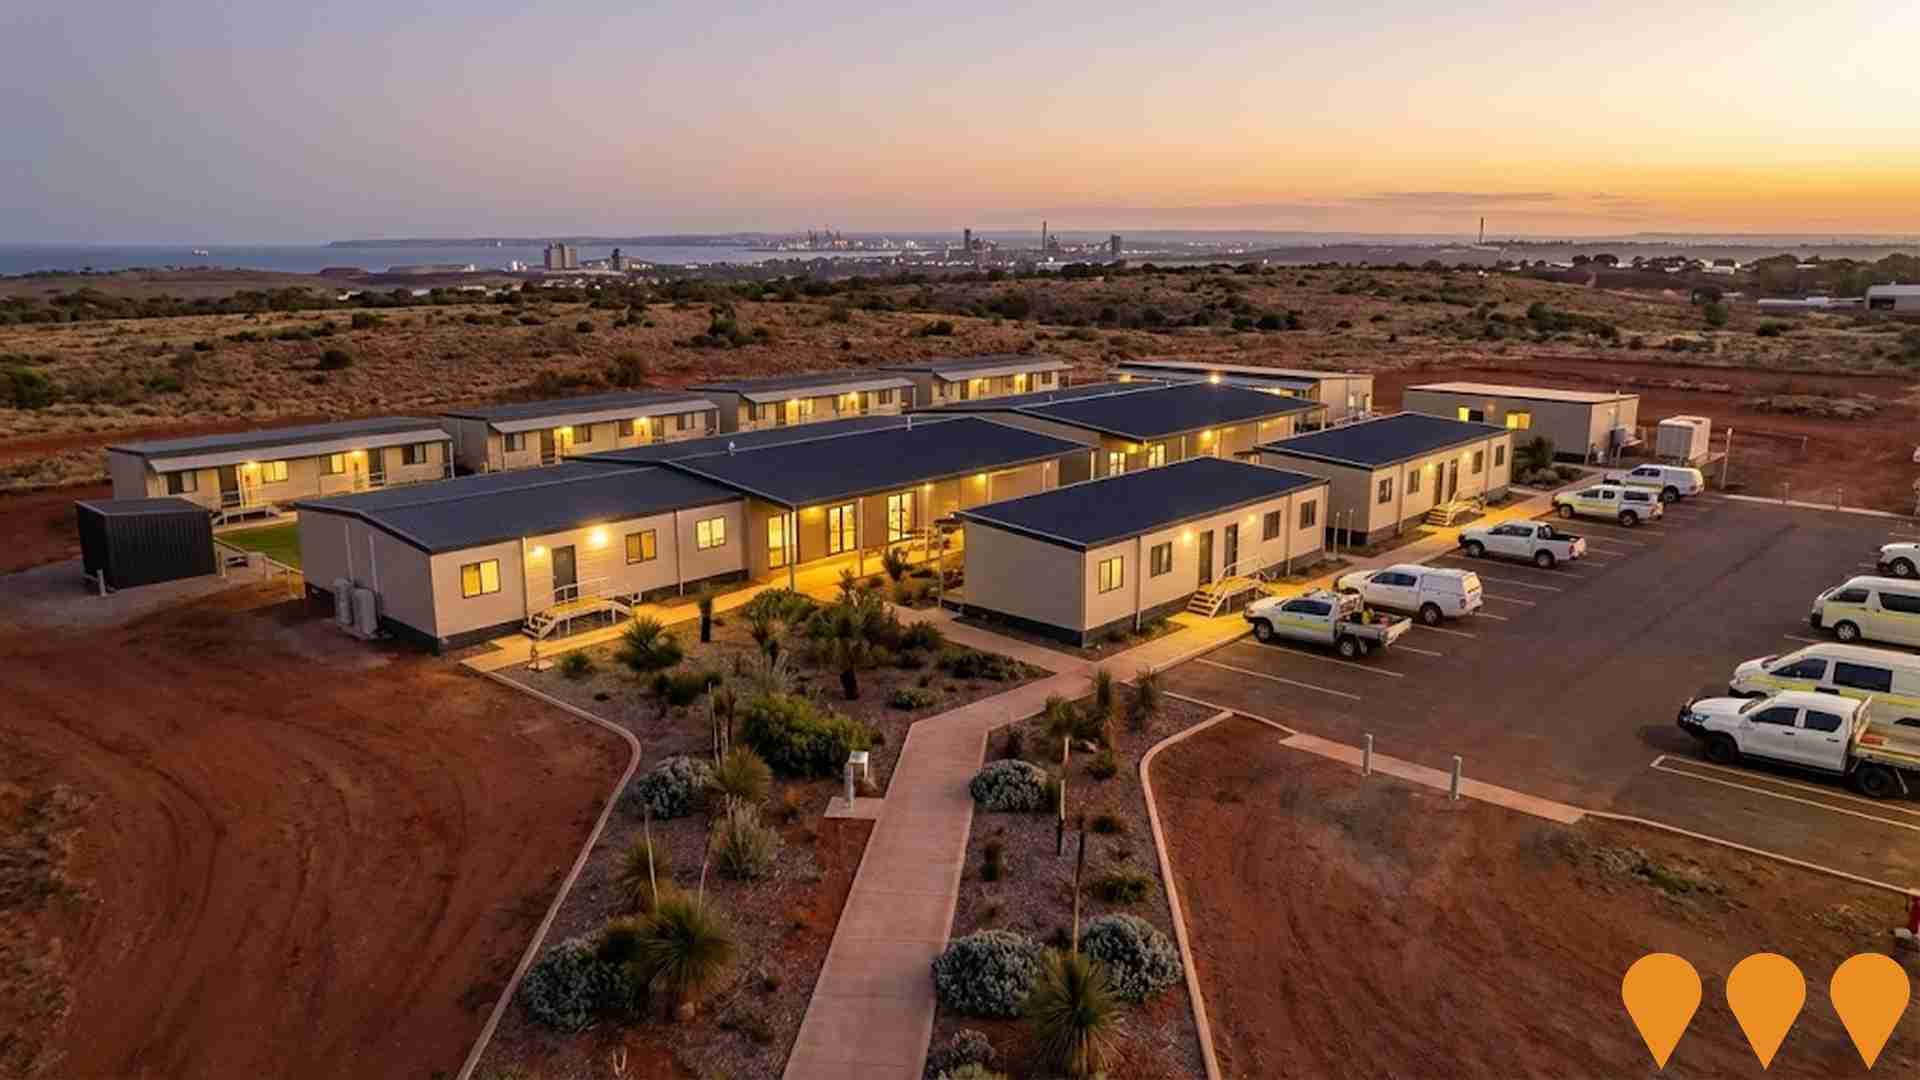
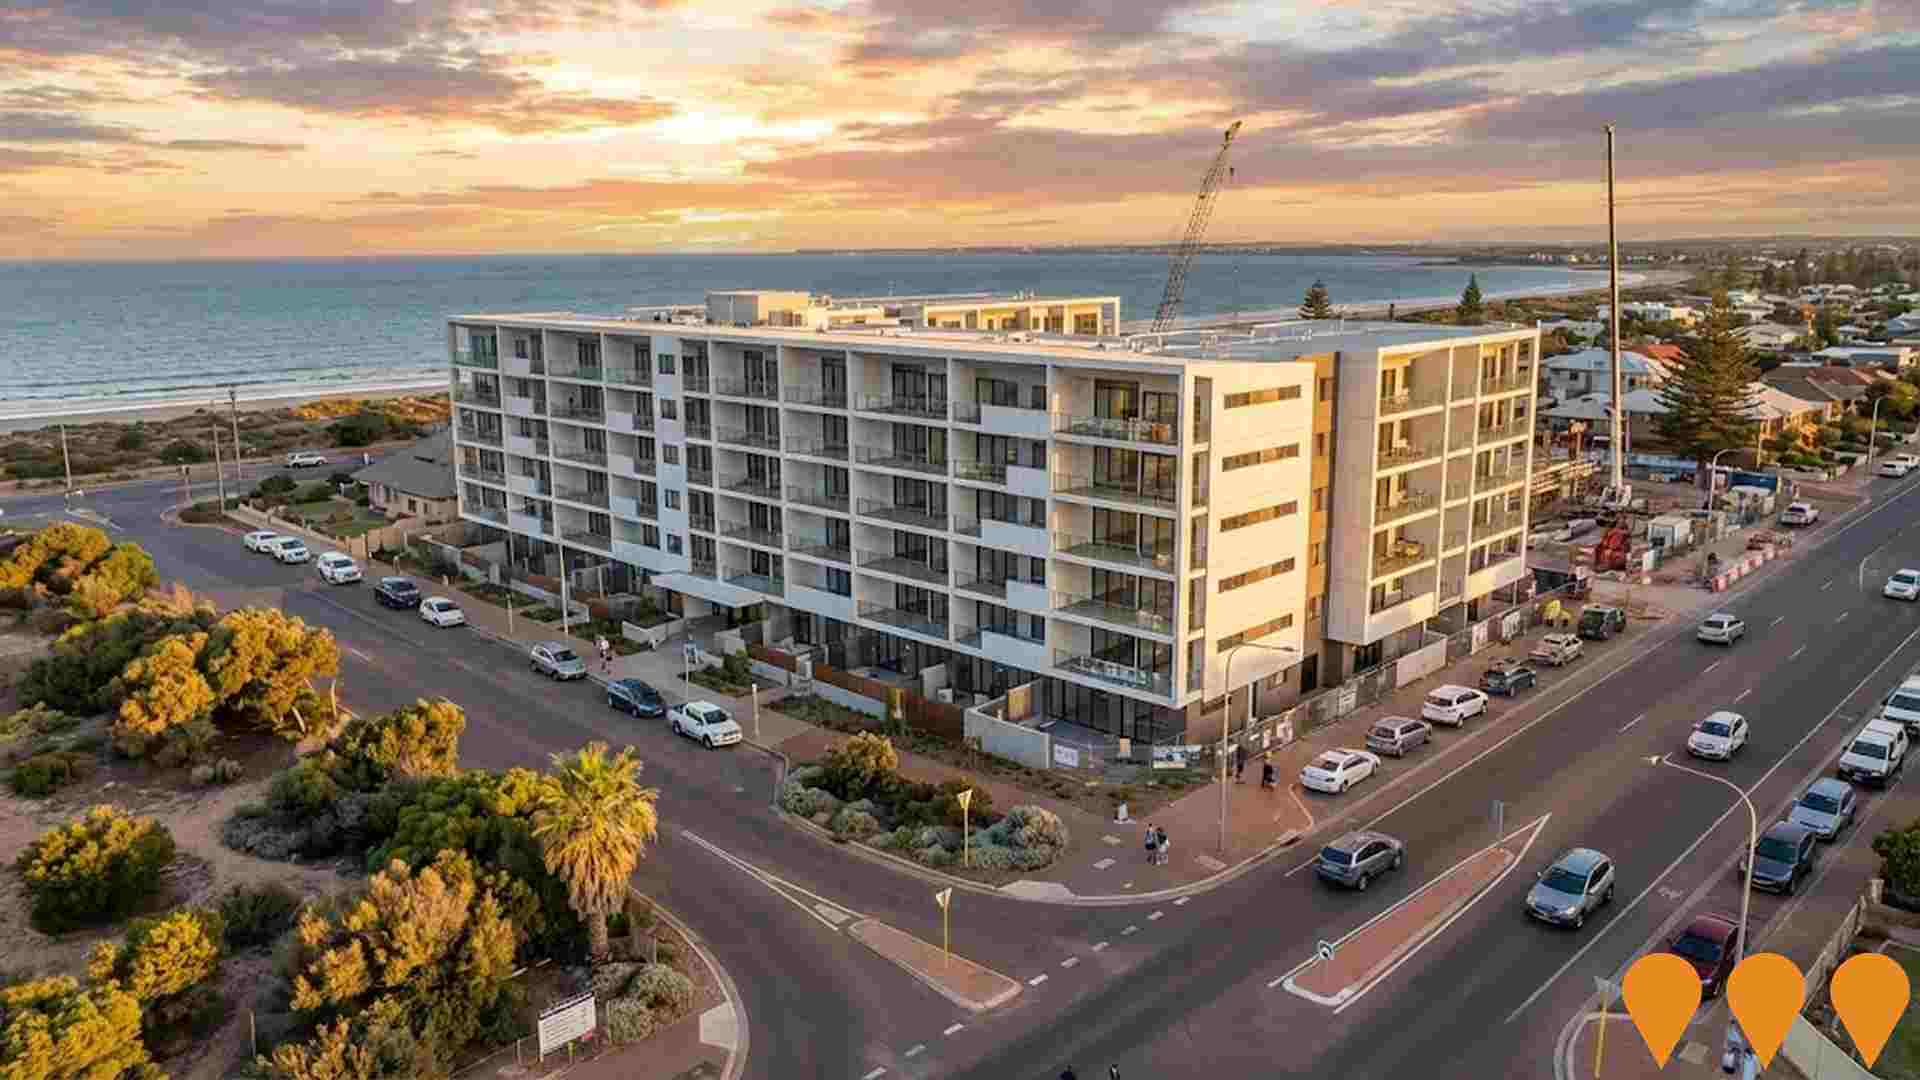
 Denotes AI-based impression for illustrative purposes only, not to be taken as definitive under any circumstances. Please follow links and conduct other investigations from the project's source for actual imagery. Developers and project owners wishing us to use original imagery please Contact Us and we will do so.
Frequently Asked Questions - Infrastructure
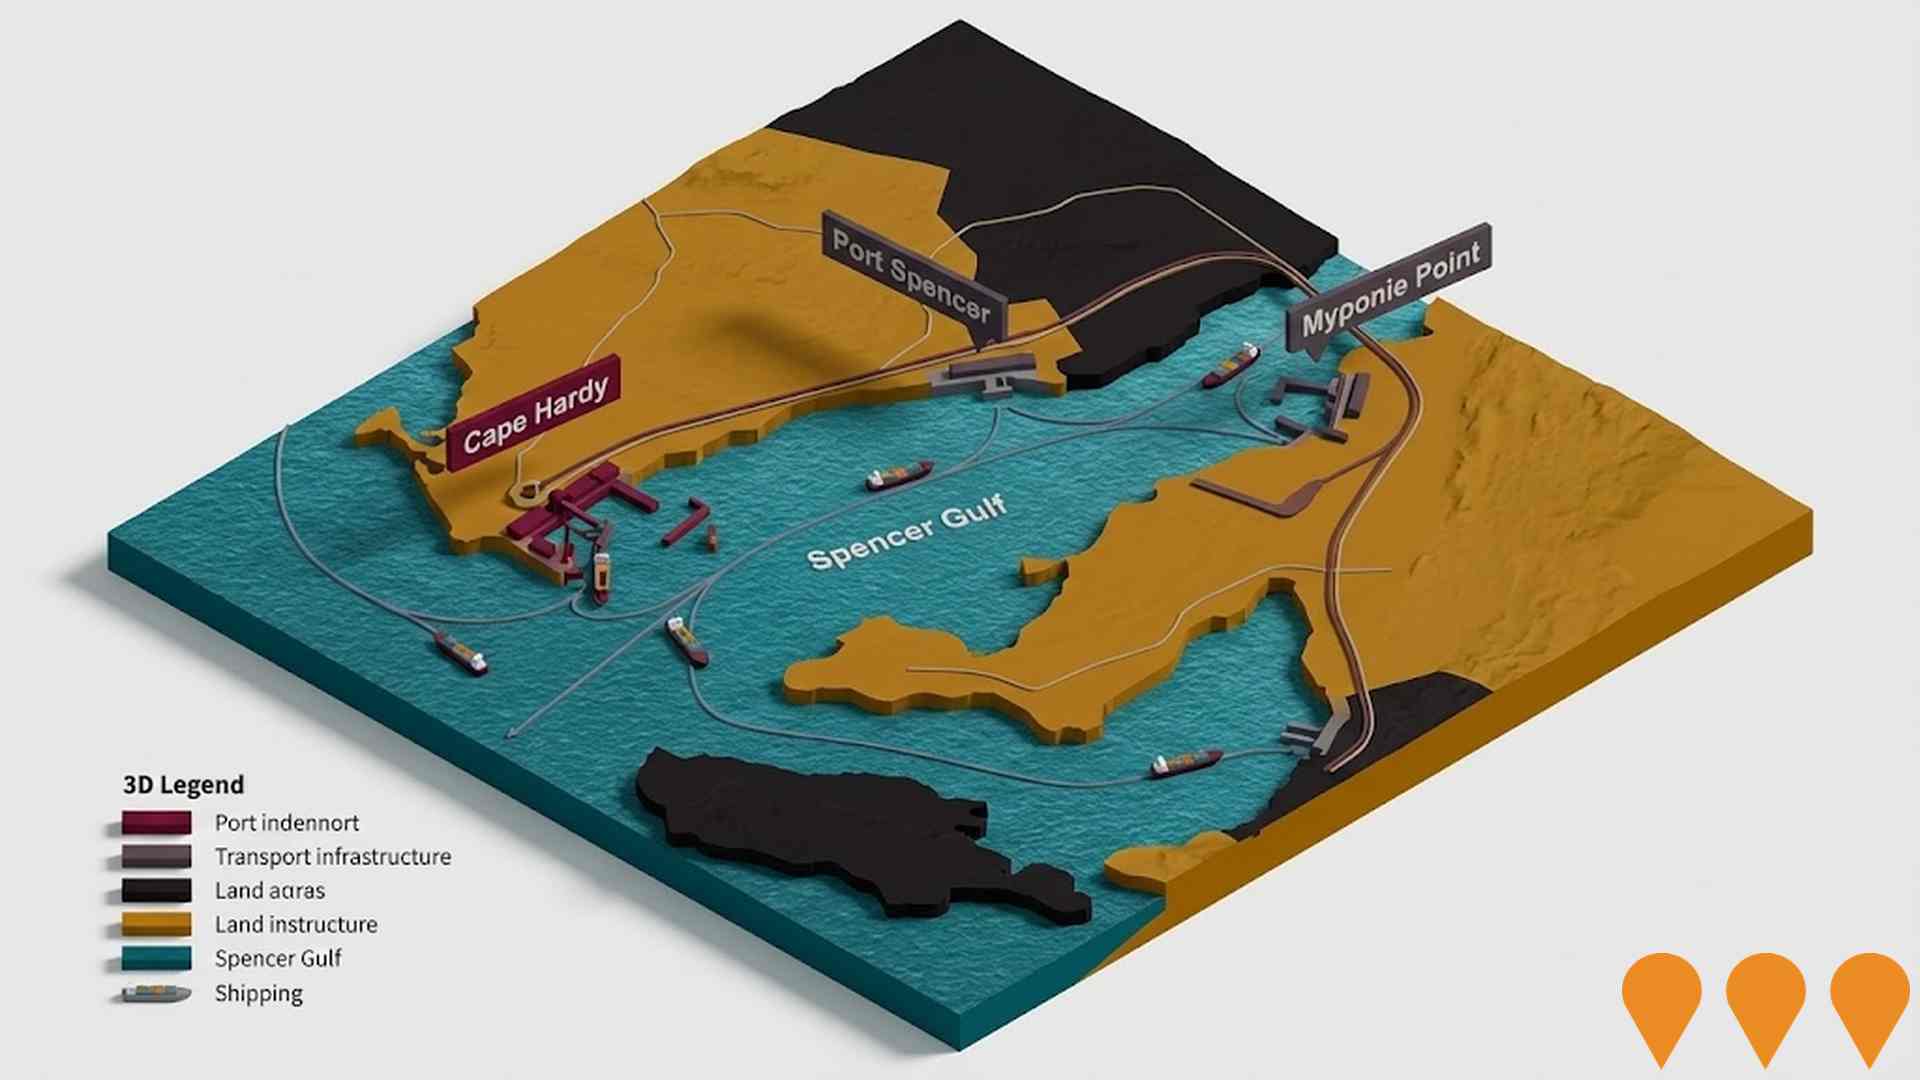
Cape Hardy Advanced Fuels Precinct
Large-scale green hydrogen and green ammonia production facility with integrated deep-water port. Stage 1 comprises 1.5 GW electrolyser capacity, renewable energy generation, hydrogen production, conversion to ammonia, and Australia's first dedicated green fuels export terminal at Cape Hardy. Developed in partnership by Iron Road Limited and Amp Energy.
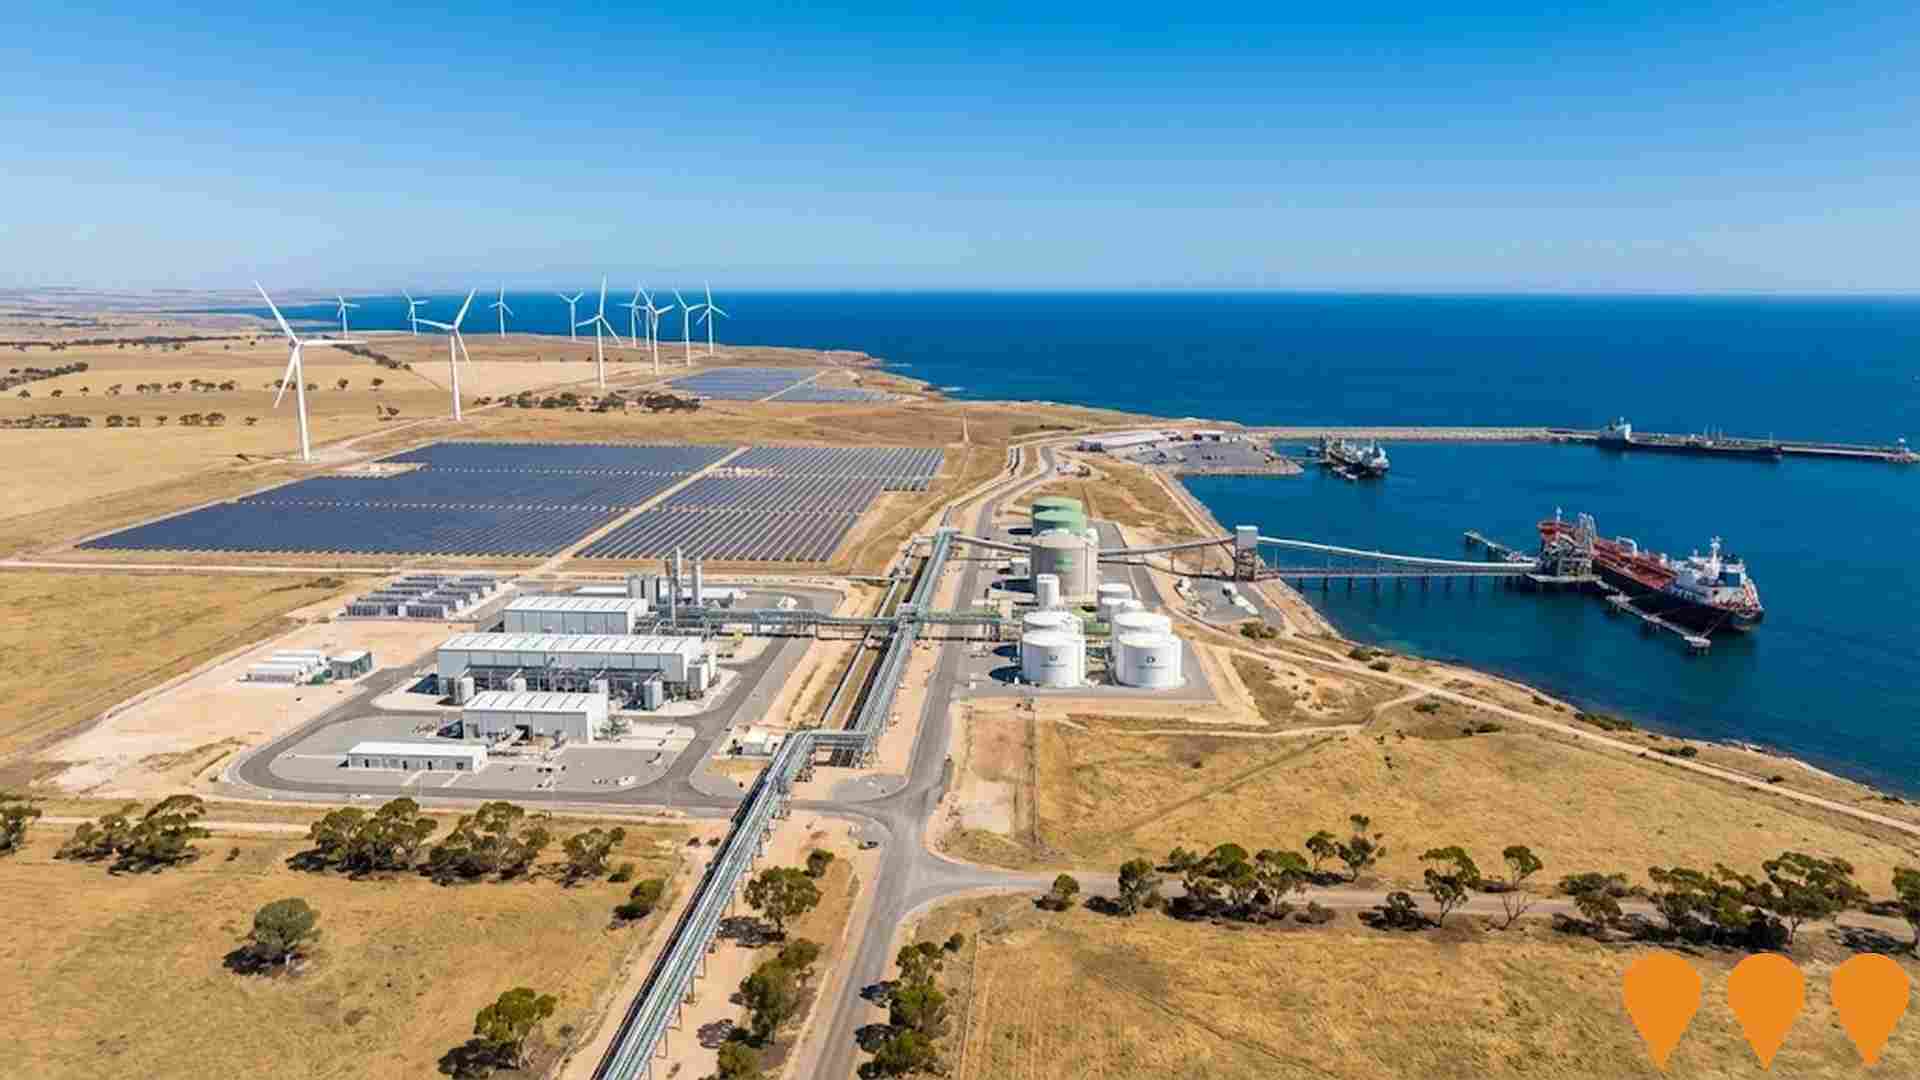
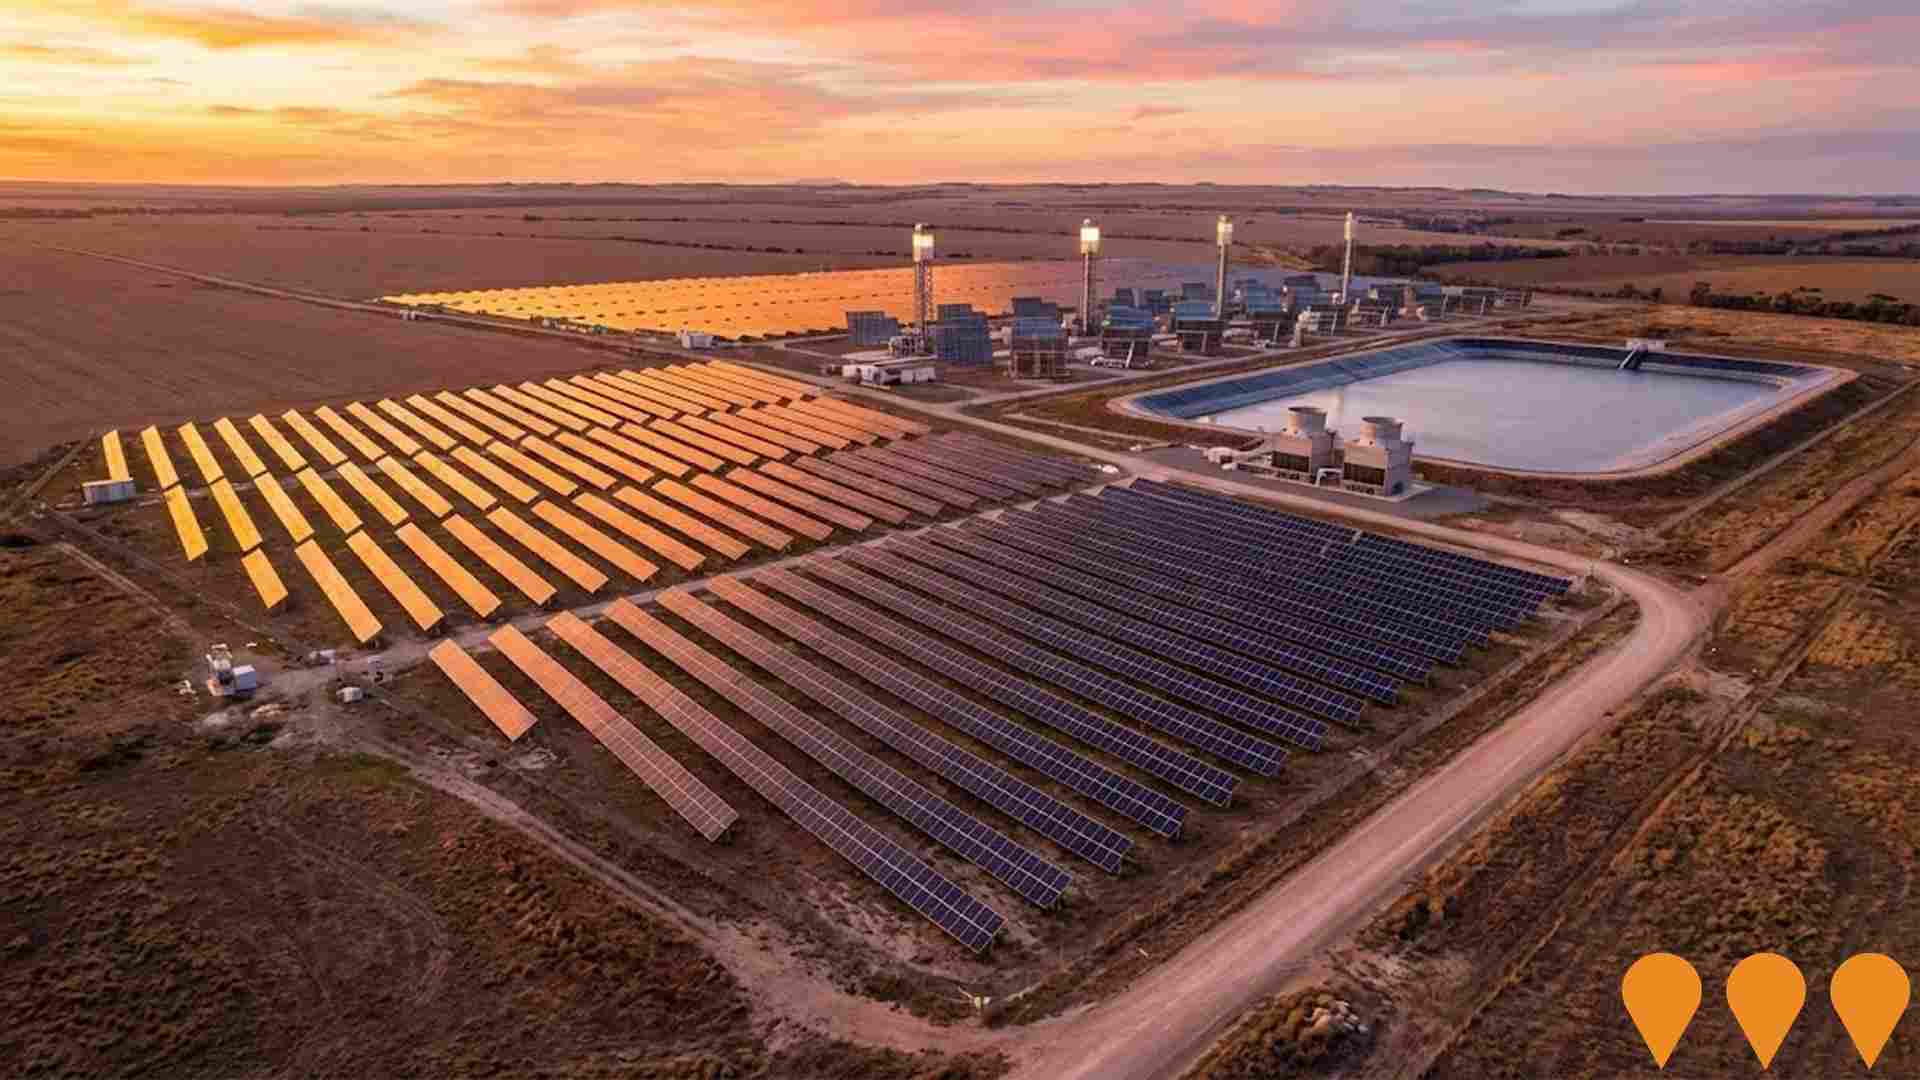
Yadnarie Solar and Energy Storage Project
A major hybrid renewable energy facility acquired by AGL Energy in July 2025. The project utilises RayGen's proprietary PV Ultra solar and Thermal Hydro storage technology. It will feature 150 MW of solar generation and 720 MWh (8 hours) of long-duration storage. Construction is planned in two stages, with Stage 1 (50 MW) operational by 2027 and Stage 2 (100 MW) by 2030.
Northern Water
Northern Water is an extensive water infrastructure and supply project aimed at securing an alternate, sustainable, climate-independent water source for eastern Eyre Peninsula, Upper Spencer Gulf, and the Far North of South Australia. The project supports current and future growth in the region and reduces reliance on River Murray, Great Artesian Basin, and local groundwater resources, servicing users such as mining operations, industry (including hydrogen), Department of Defence, remote communities, pastoralists, and SA Water. Key features include a 130-260 ML/day seawater reverse osmosis desalination plant, water intake and outlet pipes, a ~600km main trunk pipeline, lateral connections, six pump stations, six water storage areas, electricity transmission infrastructure, communications towers, and ancillary services.

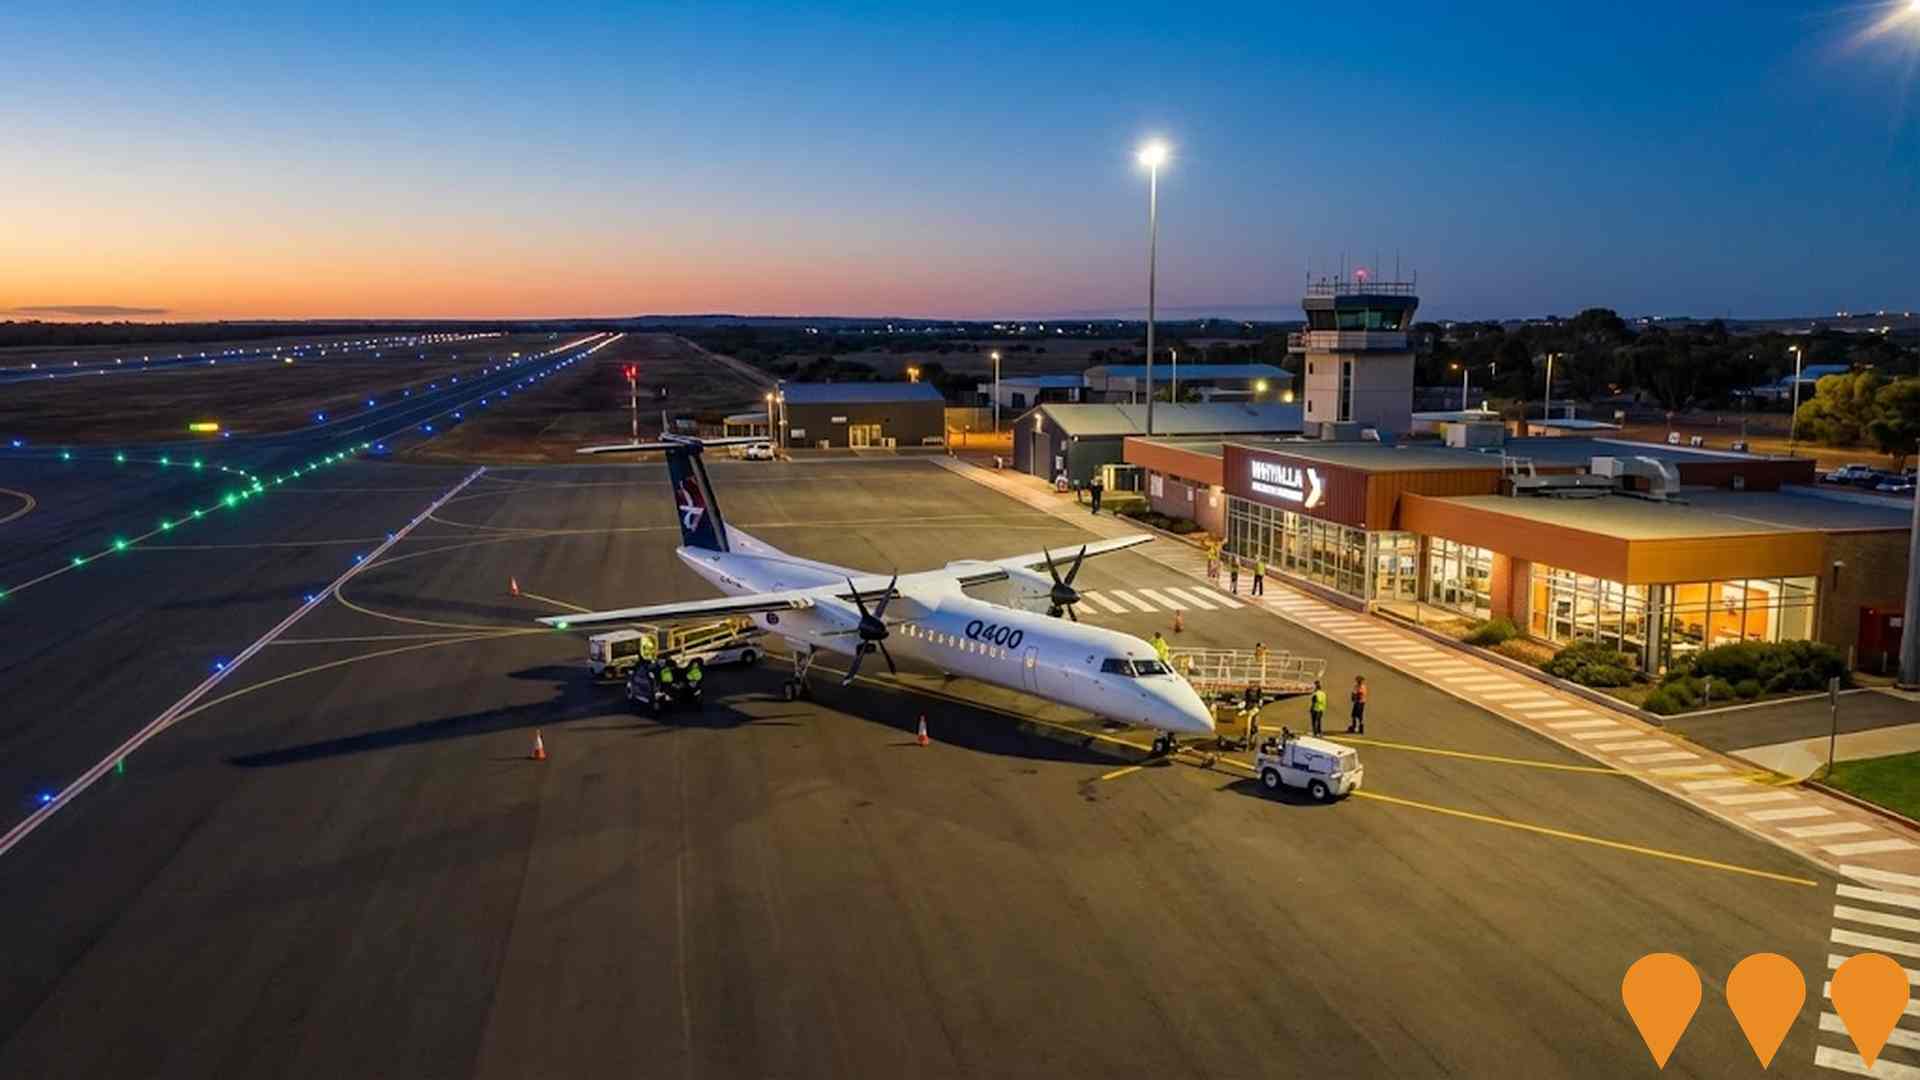
Whyalla Airport Upgrade
Major upgrade of the Whyalla Airport runway and airfield lighting system completed in June 2025. The project strengthened the runway to enable larger 74-seat Q400 aircraft to service the region, replacing the existing airfield lighting system. Delivered ahead of schedule and under budget by Fulton Hogan, the works used 90 percent local construction materials and employed approximately 234 people, with 110 of those being local workers. The upgrade ensures continuity of vital air services for more than 50,000 passengers annually and provides economic benefits to the region.
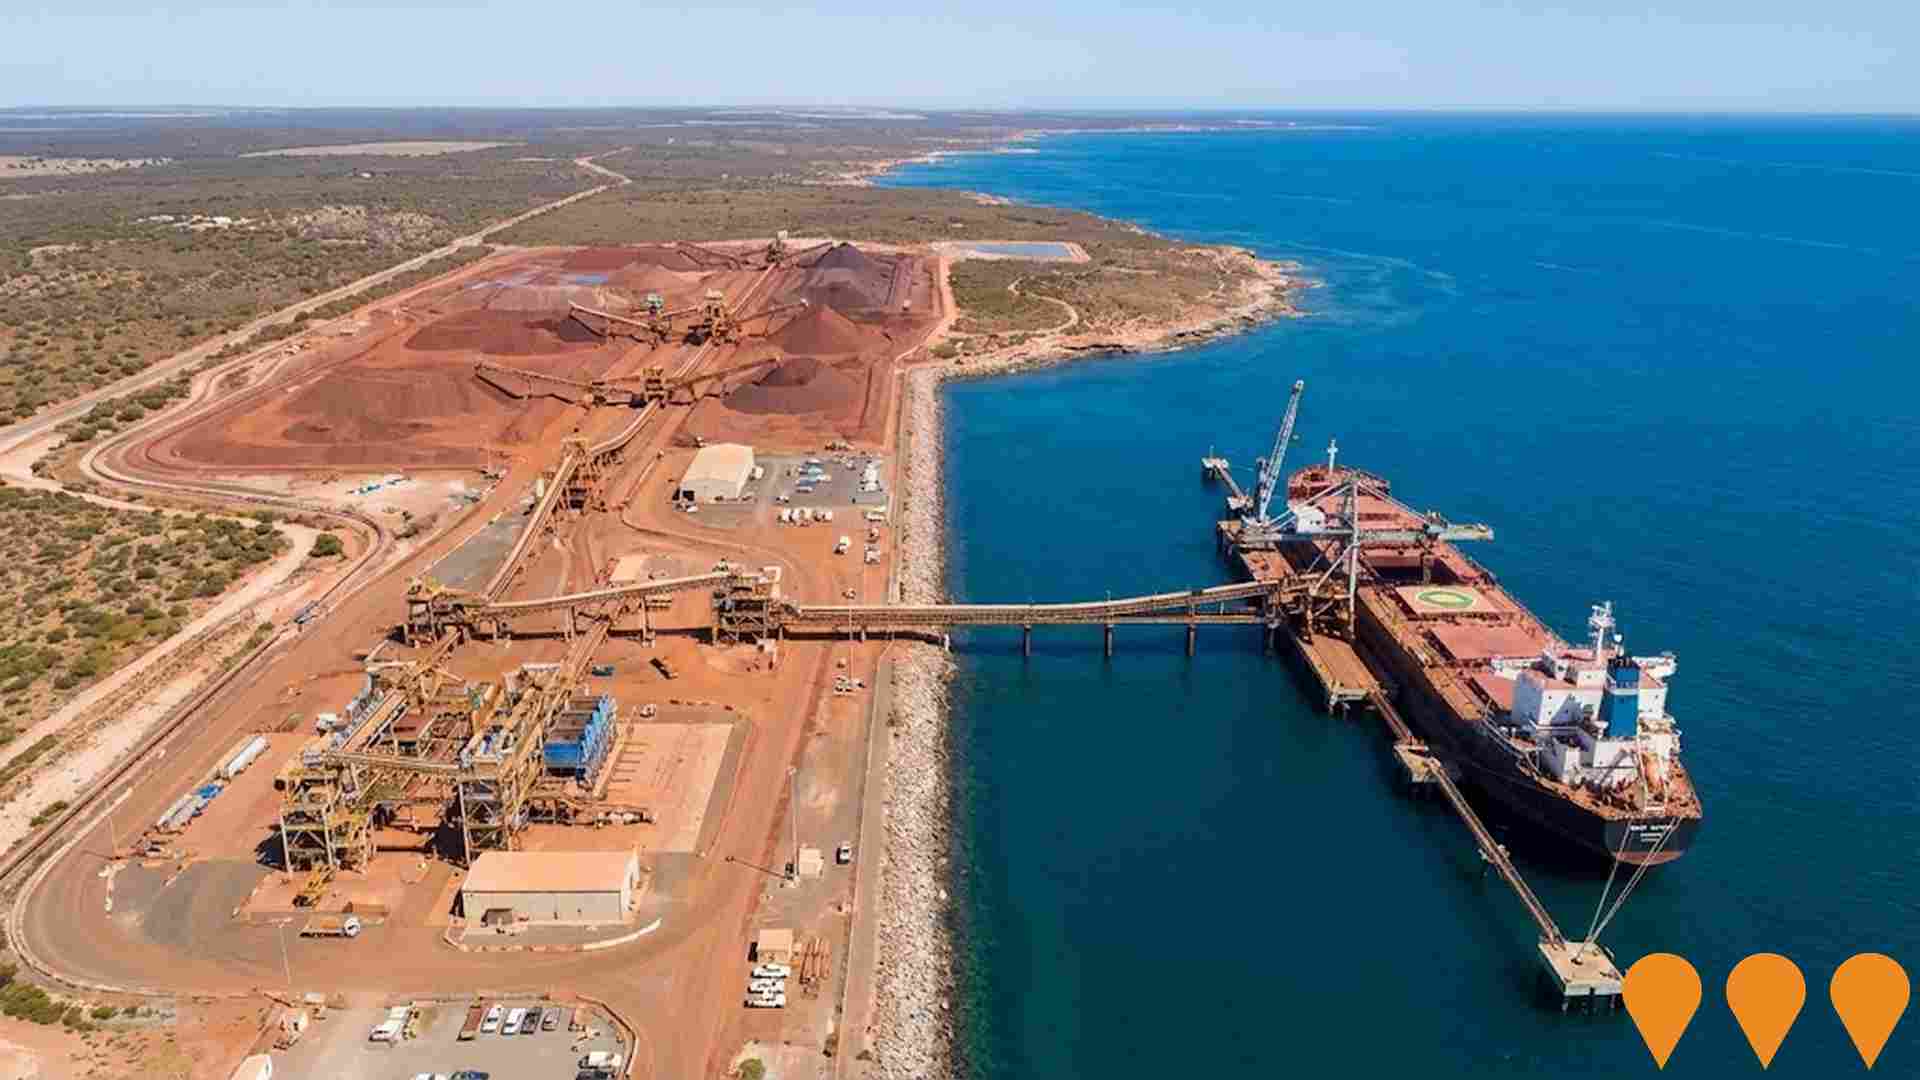
Myponie Point Port Facility (Hawsons Iron Project)
Port facility for exporting iron ore concentrate from the Hawsons Iron Project mine (NSW), including a 2.2 km jetty, ship loading wharf, ore dewatering plant, and stockpiling areas. The project is an essential part of the Hawsons Iron Project, which is currently undergoing an updated Pre-Feasibility Study (PFS) and is working towards a Definitive Feasibility Study (DFS). The port remains the preferred long-term export location, with initial focus on an 11 Mtpa production profile. Construction of the port and pipeline was previously estimated to create an additional 750-1,000 jobs.
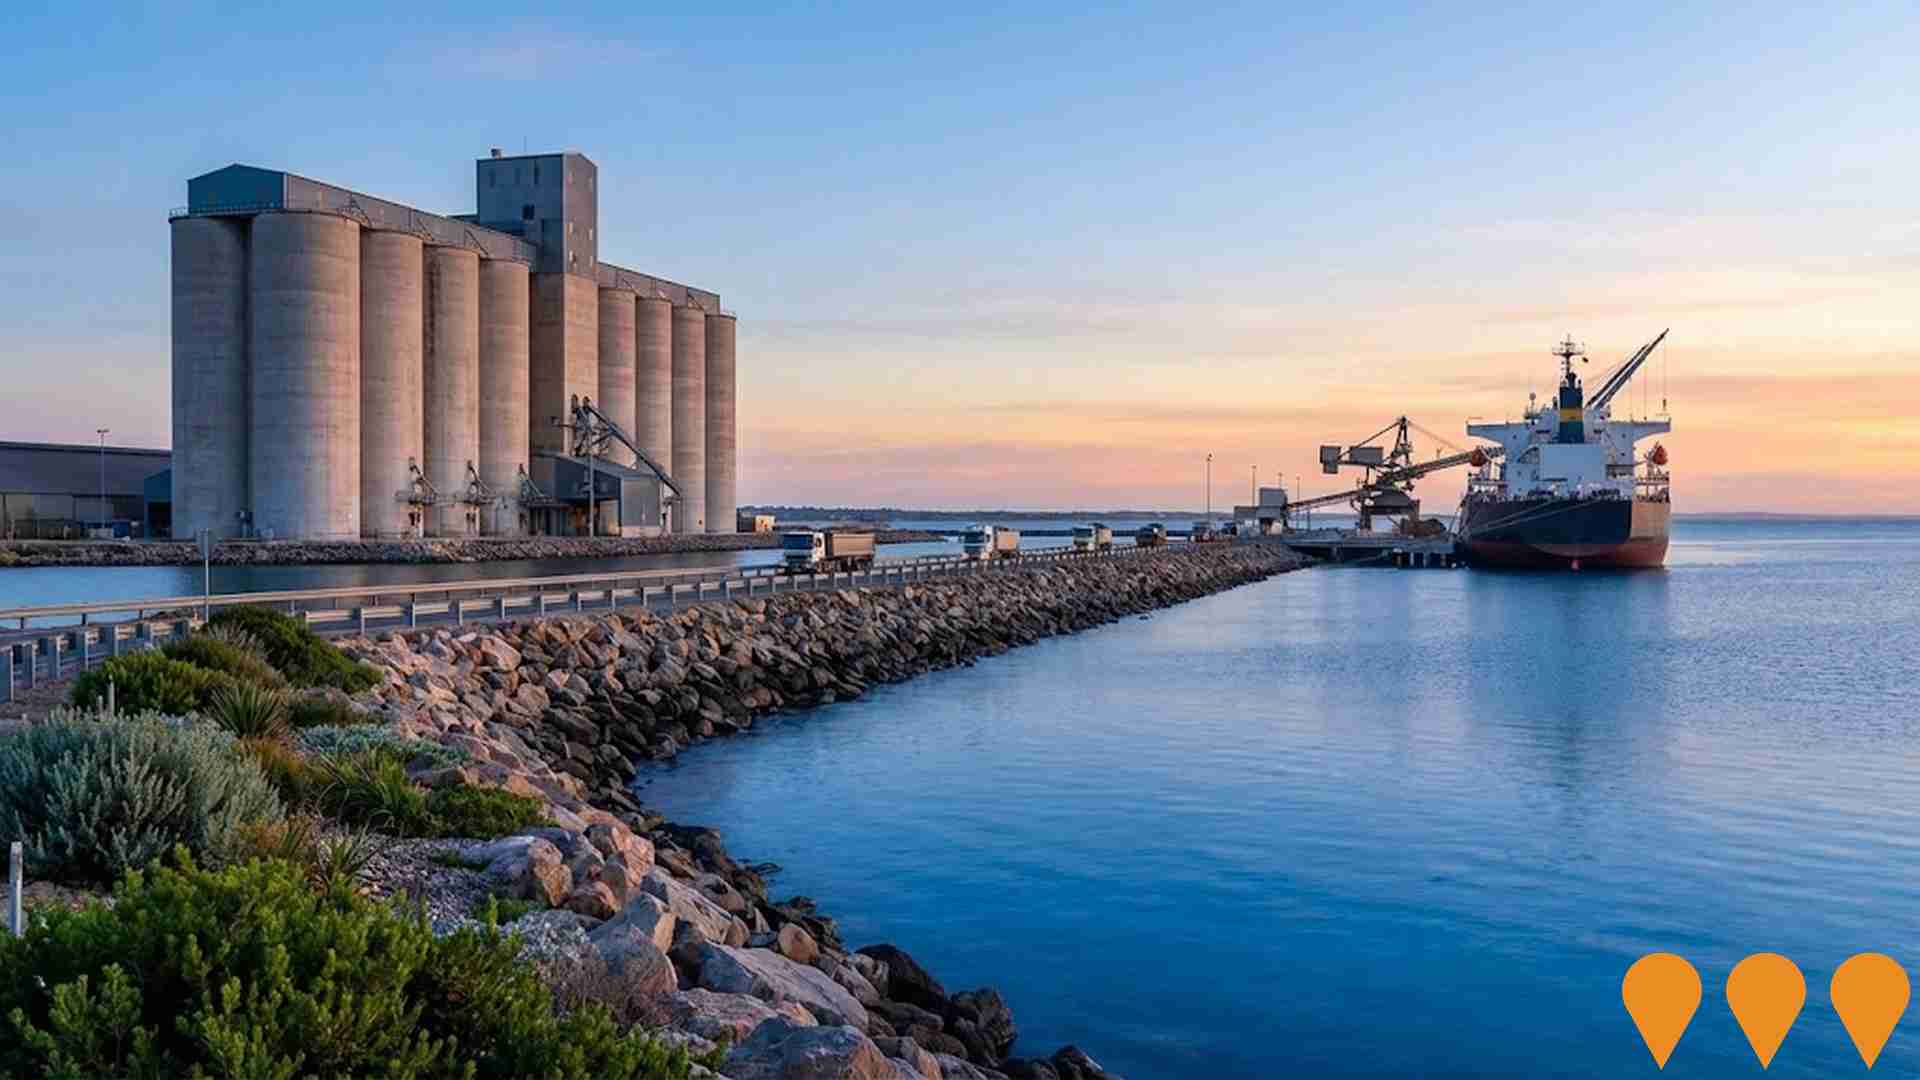
Wallaroo Grain Export Facility (Port Narungga)
Grain export facility, also known as Port Narungga, developed by T-Ports. It includes steel silos with 20,500 tonnes capacity, a 500-metre rock causeway with a ship loader, and a nearby bunker site with a total of 240,000 tonnes capacity (an earlier estimate of 340,000 tonnes was also published). The facility was built to improve efficiencies for local growers on the Yorke Peninsula and Mid North. The port silos and bunker storage were completed for grain receival in the 2022/2023 harvest, and the full build was completed in 2023.
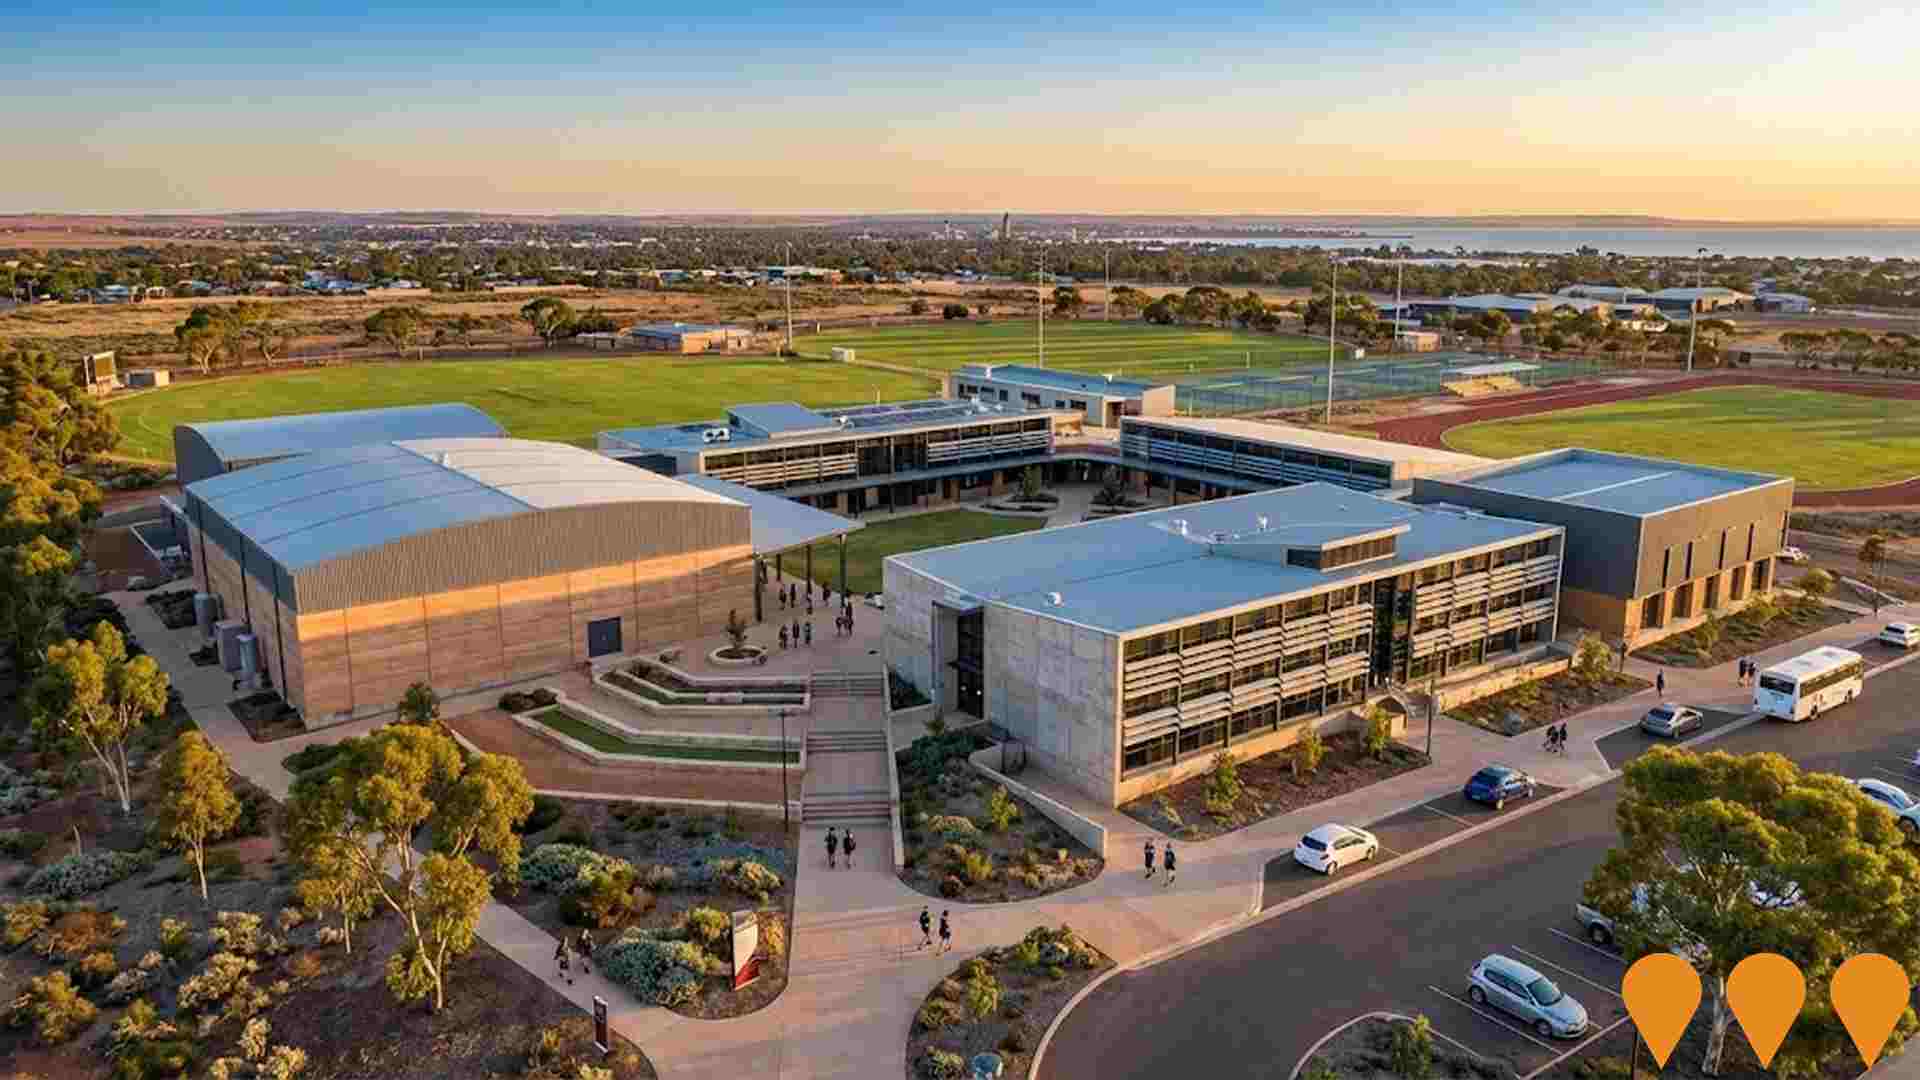
Whyalla Secondary College
State-of-the-art $100+ million secondary college accommodating 1500 students in years 7-12. Features contemporary STEM-focused learning spaces, multi-level outdoor learning areas, double court gymnasium, performing arts theatre, and expansive sporting fields. Combines three existing government high schools and includes 48 inclusive places for students with disability.
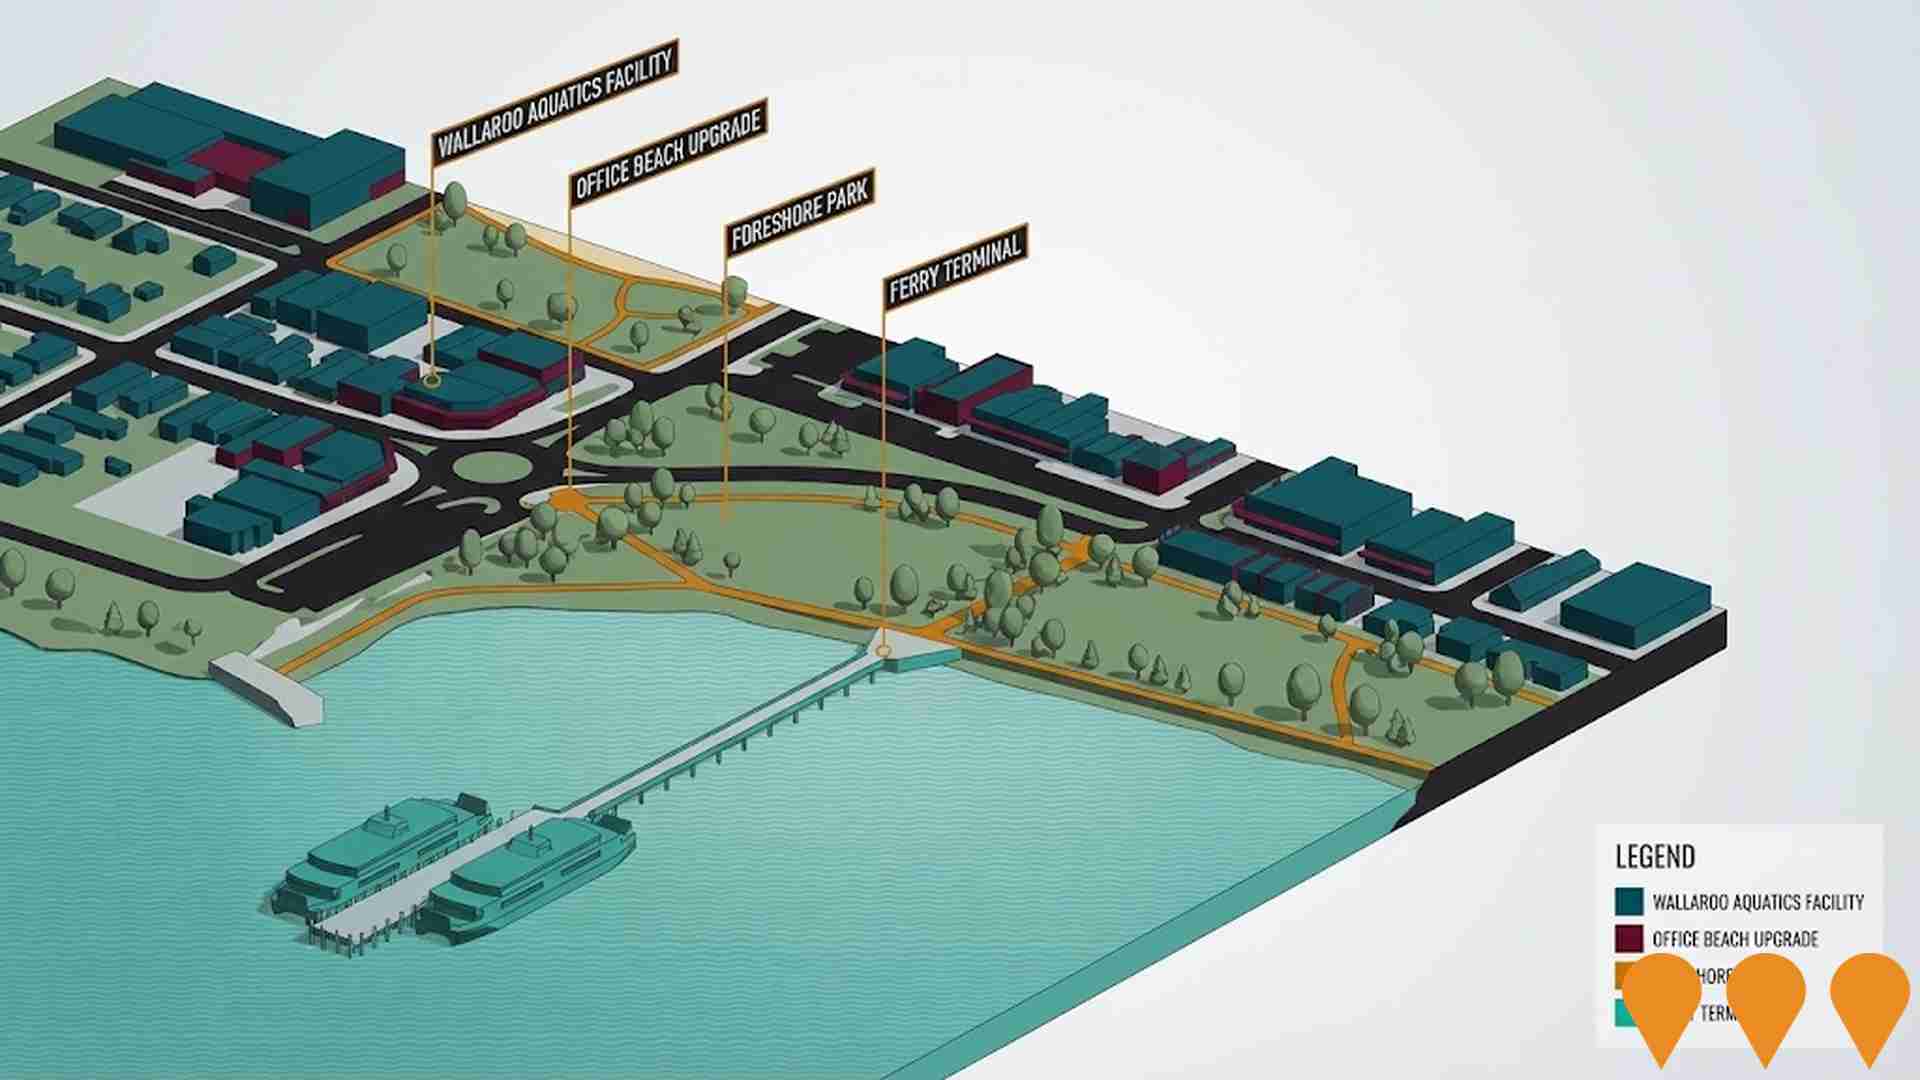
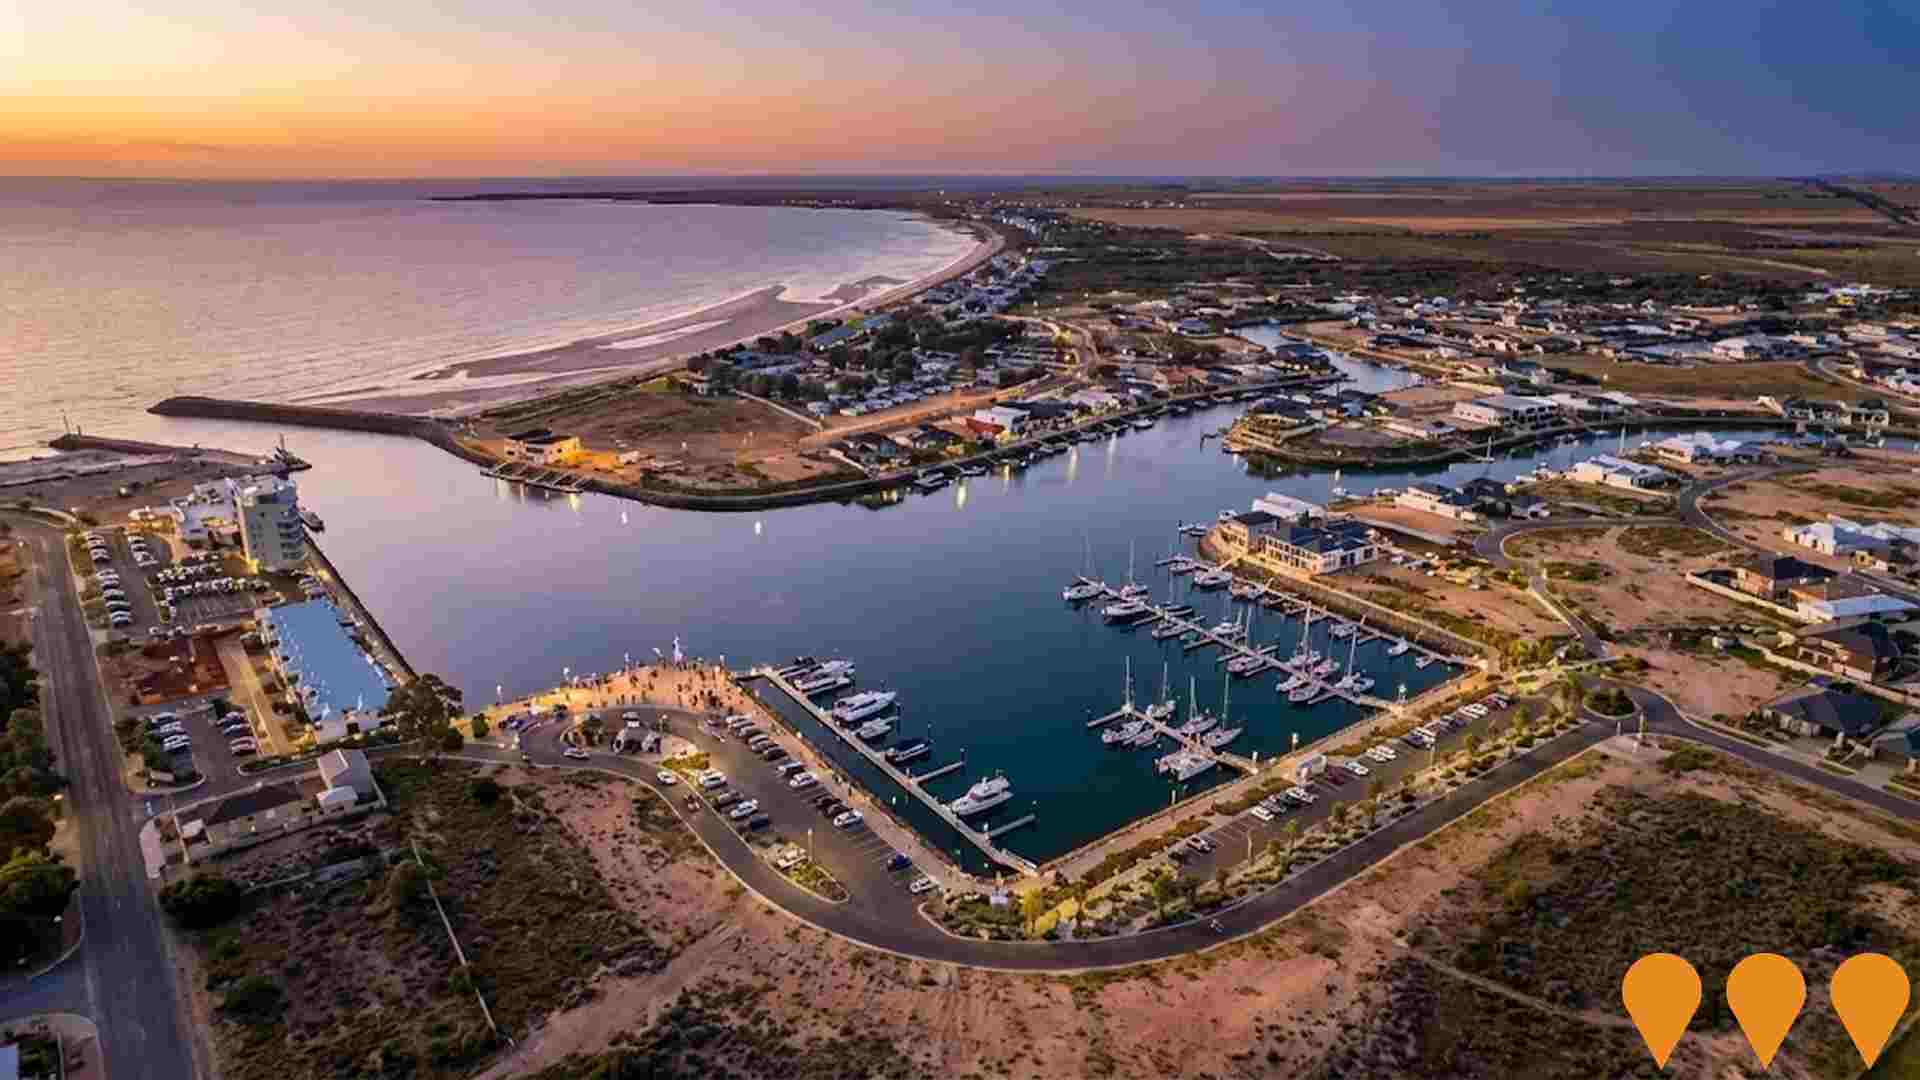
Copper Cove Marina Wallaroo
A world-class marina development in Wallaroo, SA, approved in 1999. The project includes approximately 500 housing allotments (275 waterfront), up to 154 marina berths, a resort area with restaurants and bars, medium-density cluster housing, a boat ramp, and a commercial precinct. Stage Six civil works began in late 2021 for a new road, services, and commercial/accommodation allotments. Further works on the commercial precinct (Stage Six) are planned, including an on-water fuel outlet, slipway, and dry-stack boat storage. A component of the project, 'Seapoint', is a residential development being overseen by Dellta Projects.
Employment
Employment performance in Kimba - Cleve - Franklin Harbour exceeds national averages across key labour market indicators
Kimba - Cleve - Franklin Harbour has a balanced workforce with diverse sector representation. As of September 2025, the unemployment rate is 2.9%, with an estimated employment growth of 2.9% over the past year.
The area's unemployment rate is 2.5% lower than Rest of SA's rate of 5.3%. Workforce participation stands at 57.9%, compared to Rest of SA's 54.1%. Dominant employment sectors include agriculture, forestry & fishing, health care & social assistance, and retail trade. The area specializes in agriculture, forestry & fishing with an employment share 2.5 times the regional level.
Manufacturing has limited presence at 1.8%, compared to 9.3% regionally. Many residents commute elsewhere for work based on Census working population data. Between September 2024 and September 2025, employment levels increased by 2.9% while labour force grew by 4.3%, causing the unemployment rate to rise by 1.3 percentage points. In comparison, Rest of SA recorded employment growth of 0.3%, labour force growth of 2.3%, with unemployment rising 1.9 percentage points. Jobs and Skills Australia's national employment forecasts from May-25 project national employment expansion at 6.6% over five years and 13.7% over ten years. Applying these projections to Kimba - Cleve - Franklin Harbour's employment mix suggests local employment should increase by 4.9% over five years and 11.1% over ten years, based on simple weighting extrapolation for illustrative purposes.
Frequently Asked Questions - Employment
Income
The area's income levels rank in the lower 15% nationally based on AreaSearch comparative data
AreaSearch's latest postcode level ATO data for financial year 2022 shows Kimba - Cleve - Franklin Harbour SA2 had a median income among taxpayers of $44,863 and an average of $51,726. This is lower than the national average. The Rest of SA region has a median income of $46,889 and an average of $56,582. Based on Wage Price Index growth of 12.83% since financial year 2022, estimated current incomes as of September 2025 are approximately $50,619 (median) and $58,362 (average). Census data indicates household, family and personal incomes in Kimba - Cleve - Franklin Harbour fall between the 11th and 25th percentiles nationally. Income analysis reveals 29.8% of the population (1,317 individuals) earn within the $800 - 1,499 range, differing from surrounding regions where the $1,500 - 2,999 category is prevalent at 27.5%. Housing costs are modest with 92.7% of income retained, but total disposable income ranks at just the 20th percentile nationally.
Frequently Asked Questions - Income
Housing
Kimba - Cleve - Franklin Harbour is characterized by a predominantly suburban housing profile, with above-average rates of outright home ownership
In Kimba-Cleve-Franklin Harbour, as per the latest Census evaluation, 92.2% of dwellings were houses, with the remaining 7.8% comprising semi-detached homes, apartments, and other types. This is in comparison to Non-Metro SA's 75.9% houses and 24.1% other dwellings. Home ownership in Kimba-Cleve-Franklin Harbour stood at 55.0%, with mortgaged properties at 25.5% and rented ones at 19.5%. The median monthly mortgage repayment was $936, lower than Non-Metro SA's average of $1,170. The median weekly rent in the area was $160, compared to Non-Metro SA's $195. Nationally, Kimba-Cleve-Franklin Harbour's monthly mortgage repayments were significantly lower at $936 than the Australian average of $1,863, and rents were substantially below the national figure of $375.
Frequently Asked Questions - Housing
Household Composition
Kimba - Cleve - Franklin Harbour has a typical household mix, with a fairly typical median household size
Family households account for 68.5% of all households, including 25.4% couples with children, 37.2% couples without children, and 5.5% single parent families. Non-family households constitute the remaining 31.5%, with lone person households at 29.8% and group households comprising 1.6%. The median household size is 2.3 people, which aligns with the average for the Rest of South Africa.
Frequently Asked Questions - Households
Local Schools & Education
Kimba - Cleve - Franklin Harbour faces educational challenges, with performance metrics placing it in the bottom quartile of areas assessed nationally
The area's university qualification rate is 12.7%, significantly lower than the Australian average of 30.4%. Bachelor degrees are most common among residents with university qualifications at 10.0%, followed by graduate diplomas (1.4%) and postgraduate qualifications (1.3%). Vocational credentials are prevalent, with 40.3% of residents aged 15 and above holding them. Advanced diplomas account for 8.9% while certificates represent 31.4%.
Educational participation is high, with 26.2% of residents currently enrolled in formal education. This includes primary education (14.0%), secondary education (6.9%), and tertiary education (1.1%).
Frequently Asked Questions - Education
Schools Detail
Nearby Services & Amenities
Transport
No public transport data available for this catchment area.
Frequently Asked Questions - Transport
Transport Stops Detail
Health
Health performance in Kimba - Cleve - Franklin Harbour is lower than average with common health conditions somewhat prevalent across both younger and older age cohorts
Kimba-Cleve-Franklin Harbour faces significant health challenges with common health conditions prevalent across both younger and older age cohorts. The rate of private health cover is extremely low at approximately 46% of the total population (around 2042 people), compared to 50.1% across the rest of South Australia and a national average of 55.3%. The most common medical conditions are arthritis and asthma, affecting 9.8% and 8.8% of residents respectively.
Sixty-six point nine percent of residents declared themselves completely clear of medical ailments, compared to 65.6% across the rest of South Australia. The area has 27.6% of residents aged 65 and over (1219 people), which is higher than the 22.1% in the rest of South Australia. Health outcomes among seniors are particularly strong, performing better than the general population in health metrics.
Frequently Asked Questions - Health
Cultural Diversity
The latest Census data sees Kimba - Cleve - Franklin Harbour placing among the least culturally diverse areas in the country when compared across a range of language and cultural background related metrics
Kimba-Cleve-Franklin Harbour showed cultural diversity below average levels, with 89.5% Australian citizens, 93.9% born in Australia, and 98.3% speaking English only at home. Christianity was the dominant religion, accounting for 50.7%, compared to 43.7% across Rest of SA. Ancestry wise, Australians topped at 38.2%, higher than regional average of 31.9%.
English followed with 33.4%, and German with 9.5%. Dutch was notably higher at 1.3% compared to regional 1.2%, South African also higher at 0.4% versus regional 0.2%.
Frequently Asked Questions - Diversity
Age
Kimba - Cleve - Franklin Harbour hosts an older demographic, ranking in the top quartile nationwide
The median age in Kimba - Cleve - Franklin Harbour is 48 years, similar to the Rest of South Australia's average of 47 years but well above the national norm of 38 years. Compared to the Rest of SA average, the 5-14 cohort is notably over-represented at 13.1% locally while those aged 15-24 are under-represented at 8.4%. Between 2021 and present, the 75-84 age group has grown from 7.8% to 10.1%, while the 15-24 cohort increased from 7.2% to 8.4%. Conversely, the 25-34 cohort has declined from 10.1% to 9.0%. Population forecasts for 2041 indicate substantial demographic changes in Kimba - Cleve - Franklin Harbour. The 75-84 cohort is projected to grow by 37%, adding 163 residents to reach 608. Senior residents aged 65+ will drive 78% of population growth, underscoring demographic aging trends. Conversely, both the 15-24 and 65-74 age groups are expected to see reduced numbers.
