Chart Color Schemes
This analysis uses ABS Statistical Areas Level 2 (SA2) boundaries, which can materially differ from Suburbs and Localities (SAL) even when sharing similar names.
SA2 boundaries are defined by the Australian Bureau of Statistics and are designed to represent communities for statistical reporting (e.g., census and ERP).
Suburbs and Localities (SAL) represent commonly-used suburb/locality names (postal-style areas) and may use different geographic boundaries. For comprehensive analysis, consider reviewing both boundary types if available.
est. as @ -- *
ABS ERP | -- people | --
2021 Census | -- people
Sales Activity
Curious about local property values? Filter the chart to assess the volume and appreciation (including resales) trends and regional comparisons, or scroll to the map below view this information at an individual property level.
Find a Recent Sale
Sales Detail
Population
An assessment of population growth drivers in Magnetic Island reveals an overall ranking slightly below national averages considering recent, and medium term trends
Magnetic Island's population was approximately 2,674 as of November 2025. This figure reflects a growth of 199 people since the 2021 Census, which reported a population of 2,475. The increase is inferred from an estimated resident population of 2,638 in June 2024 and 94 validated new addresses since the Census date. This results in a population density of 52 persons per square kilometer. Magnetic Island's growth rate of 8.0% exceeded both the SA4 region (6.9%) and SA3 area during this period, indicating it as a leading growth area. Interstate migration contributed approximately 71.8% to overall population gains recently.
AreaSearch uses ABS/Geoscience Australia projections for each SA2 area released in 2024 with a base year of 2022. For areas not covered and years post-2032, Queensland State Government's SA2 area projections from 2023 based on 2021 data are adopted. However, these state projections lack age category splits, so proportional growth weightings aligned with ABS Greater Capital Region projections released in 2023 using 2022 data are applied where utilized. Future demographic trends anticipate lower quartile growth for non-metropolitan areas nationally, with the area expected to grow by 109 persons to reach a total population of approximately 2,873 by 2041 based on the latest annual ERP population numbers, reflecting an overall gain of 2.7% over the 17-year period.
Frequently Asked Questions - Population
Development
Recent residential development output has been above average within Magnetic Island when compared nationally
Magnetic Island has seen approximately 26 new homes approved annually. Over the past five financial years, from FY-21 to FY-25131 homes were approved, with a further 6 approved so far in FY-26. On average, 1.6 people have moved to the area for each dwelling built over these years.
This has resulted in balanced supply and demand, creating stable market conditions. The average construction cost of new properties is $324,000, aligning with regional patterns. In FY-26, commercial approvals totaling $1.8 million have been registered, indicating a predominantly residential focus. Compared to the Rest of Qld, Magnetic Island has 149% more building activity per person, offering buyers greater choice.
New building activity comprises 95% detached houses and 5% medium and high-density housing, maintaining the area's low-density character with a focus on family homes. With around 104 people per dwelling approval, Magnetic Island exhibits characteristics of a growth area. Population forecasts indicate Magnetic Island will gain 73 residents by 2041. Based on current development patterns, new housing supply should meet demand, presenting good conditions for buyers and potentially facilitating population growth beyond current projections.
Frequently Asked Questions - Development
Infrastructure
Magnetic Island has strong levels of nearby infrastructure activity, ranking in the top 30% nationally
No infrastructure changes will influence an area's performance more than local ones. AreaSearch has identified zero projects that could impact this particular area. Key projects include Weststate Private Hospital, Douglas Water Treatment Plant Clarifiers Upgrade (scheduled for completion in 2021), Bruce Highway upgrade program between Townsville and Ingham (commenced on 15th June 2020), and Sunshine State Solar Farm and Battery project (expected to start construction in Q4 2021). The following list details projects likely to be most relevant.
Professional plan users can use the search below to filter and access additional projects.
INFRASTRUCTURE SEARCH
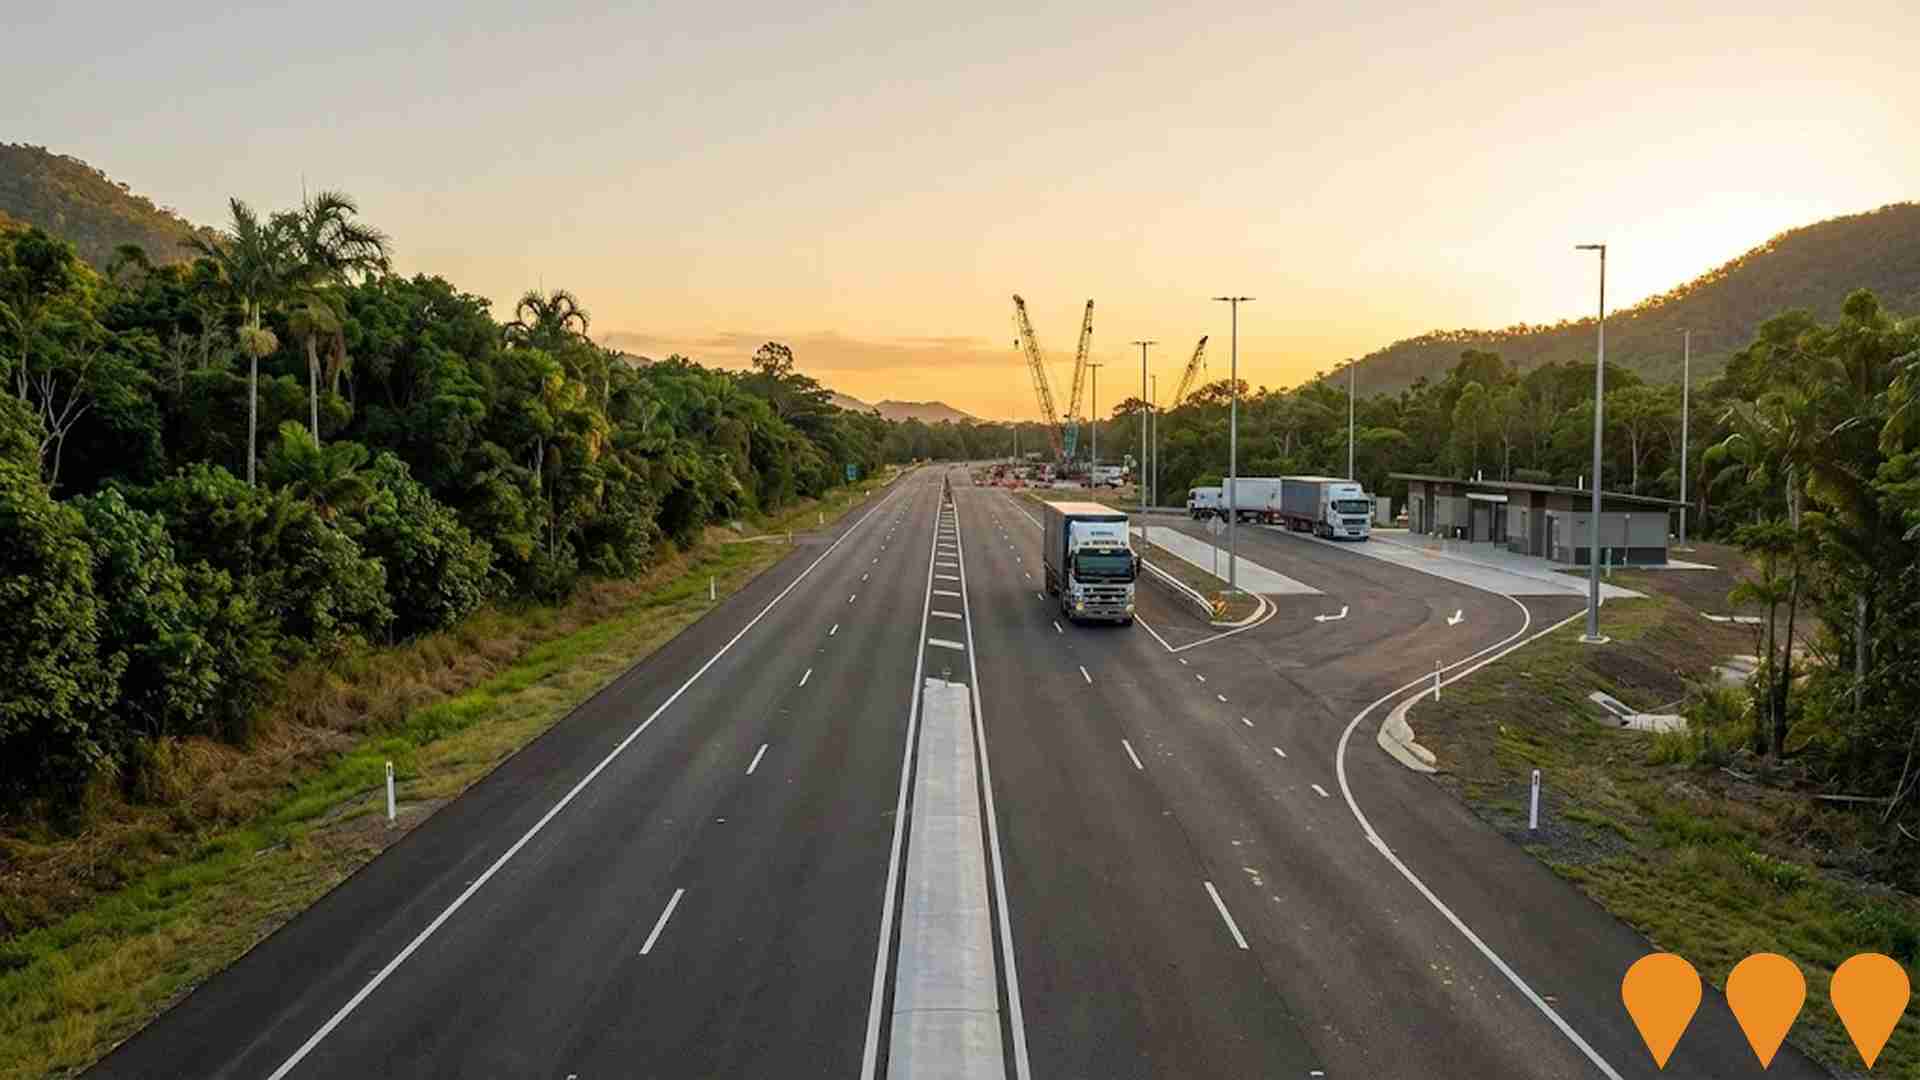
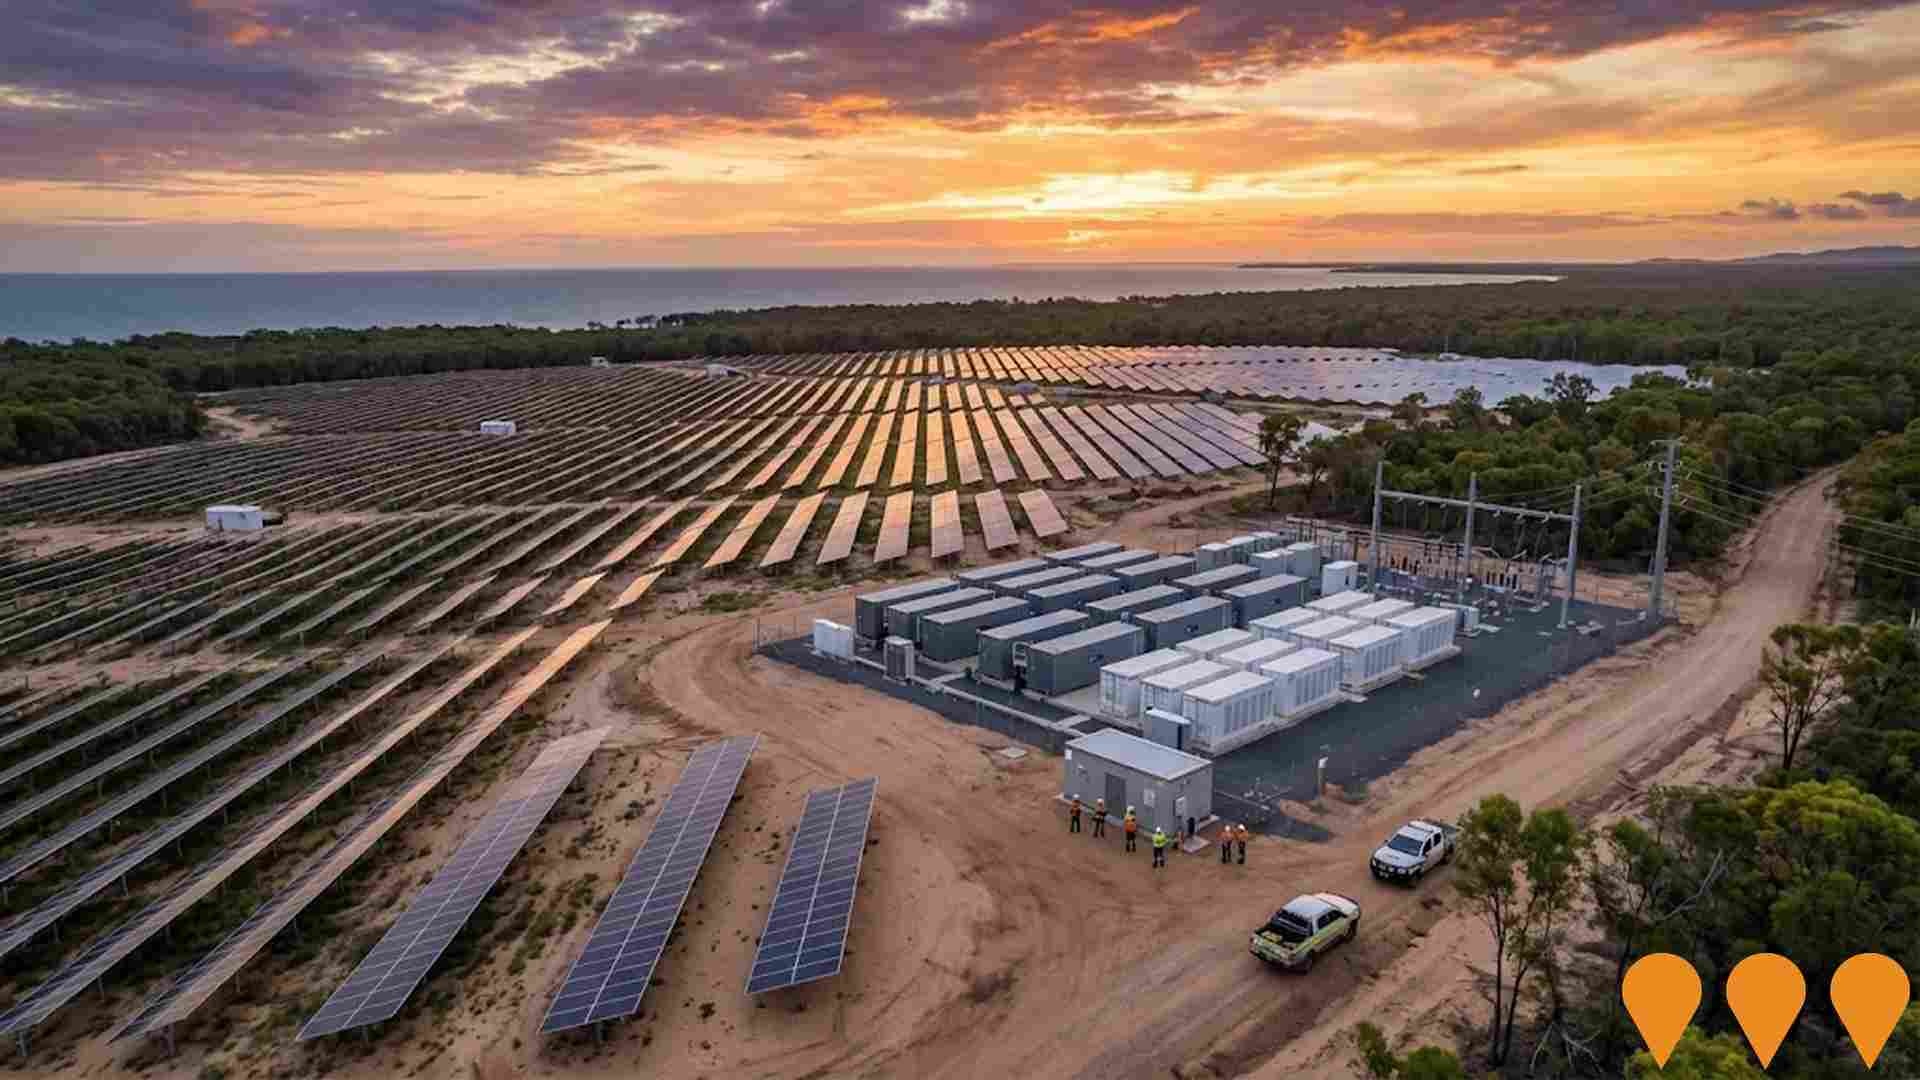
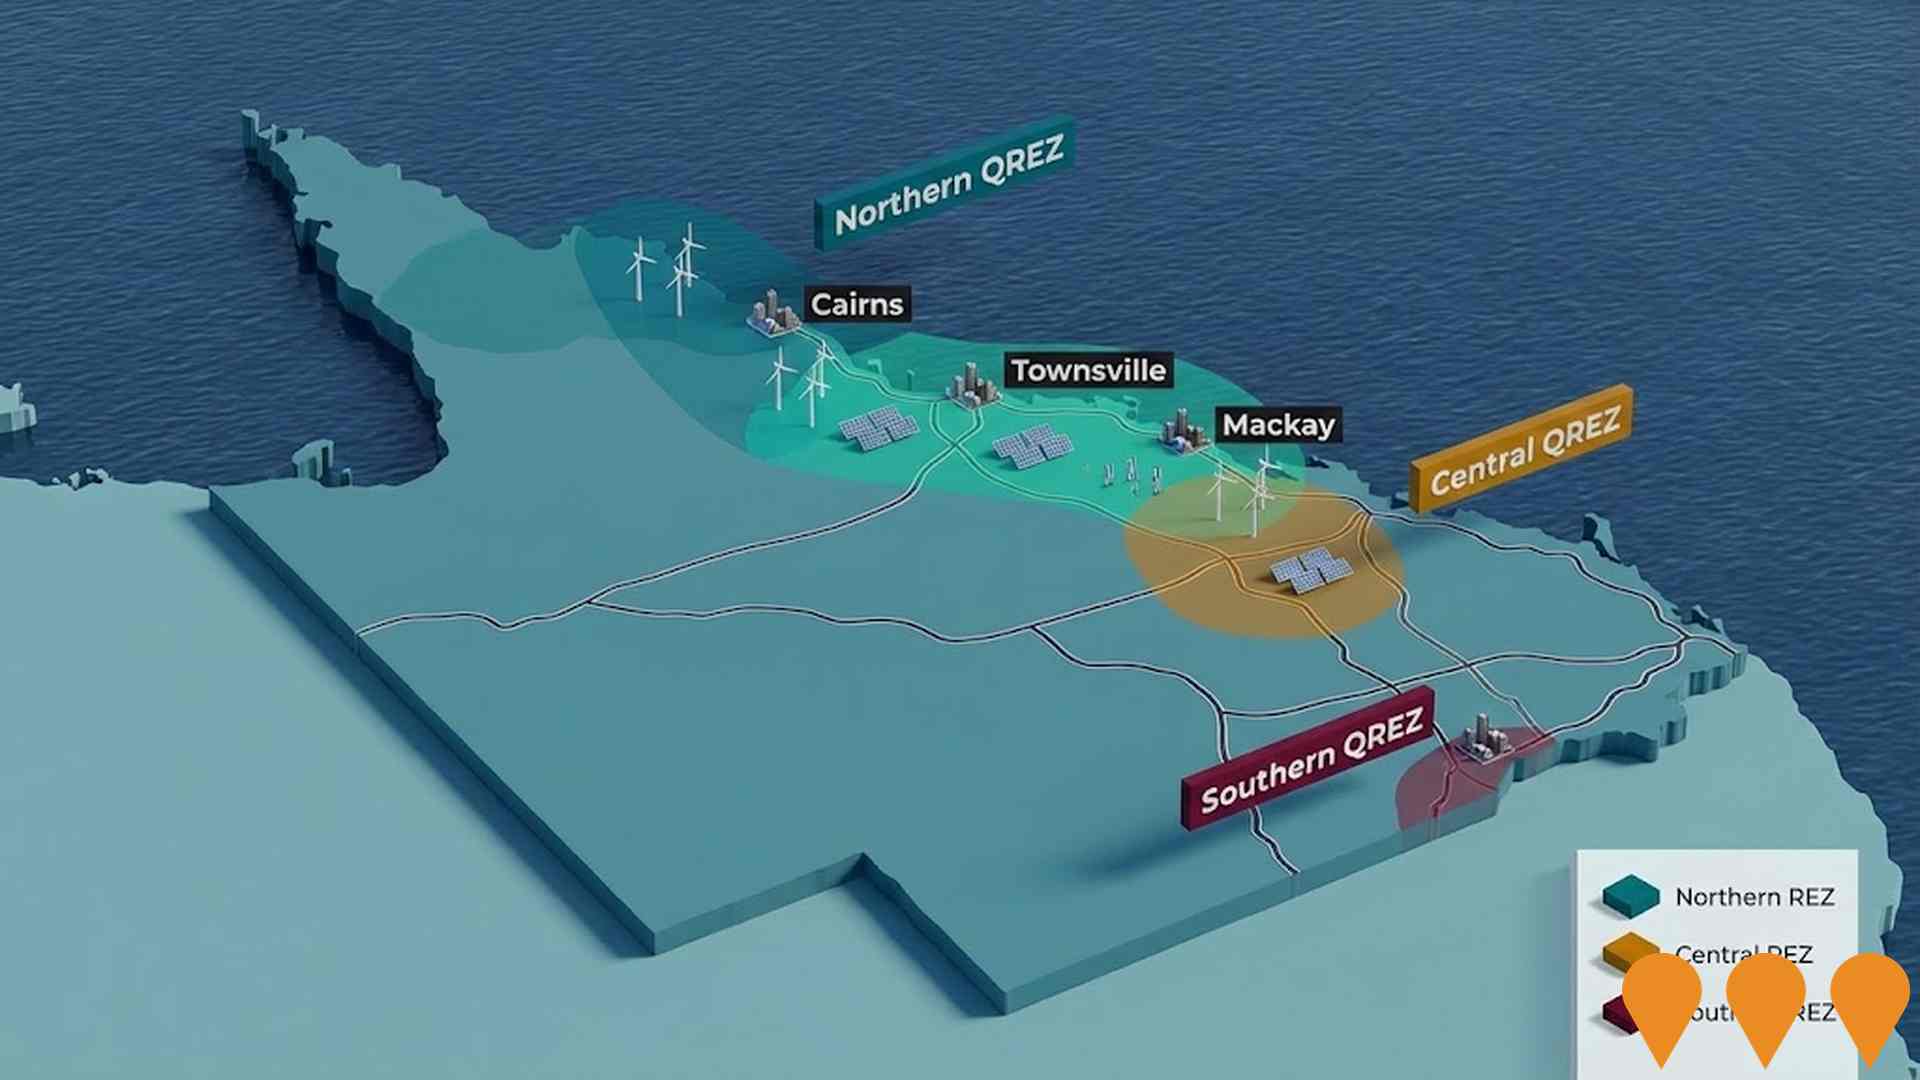
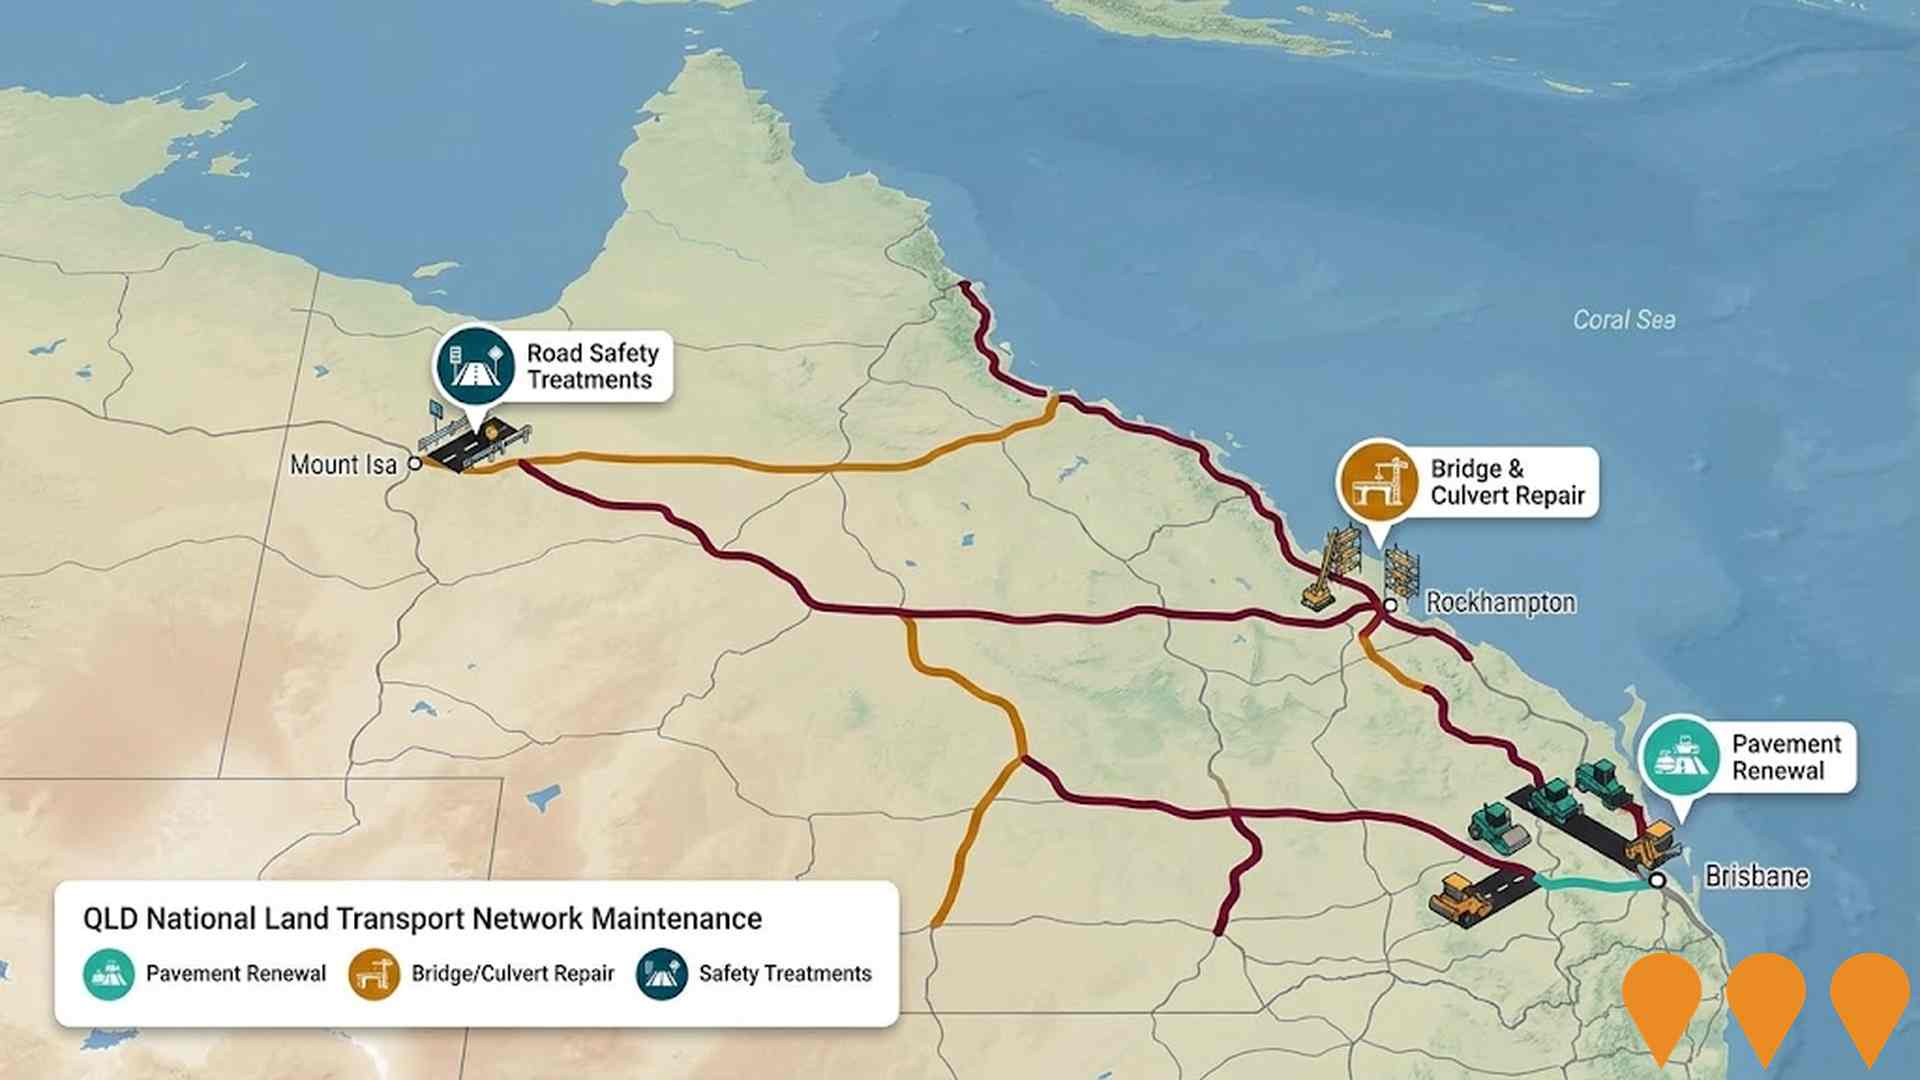
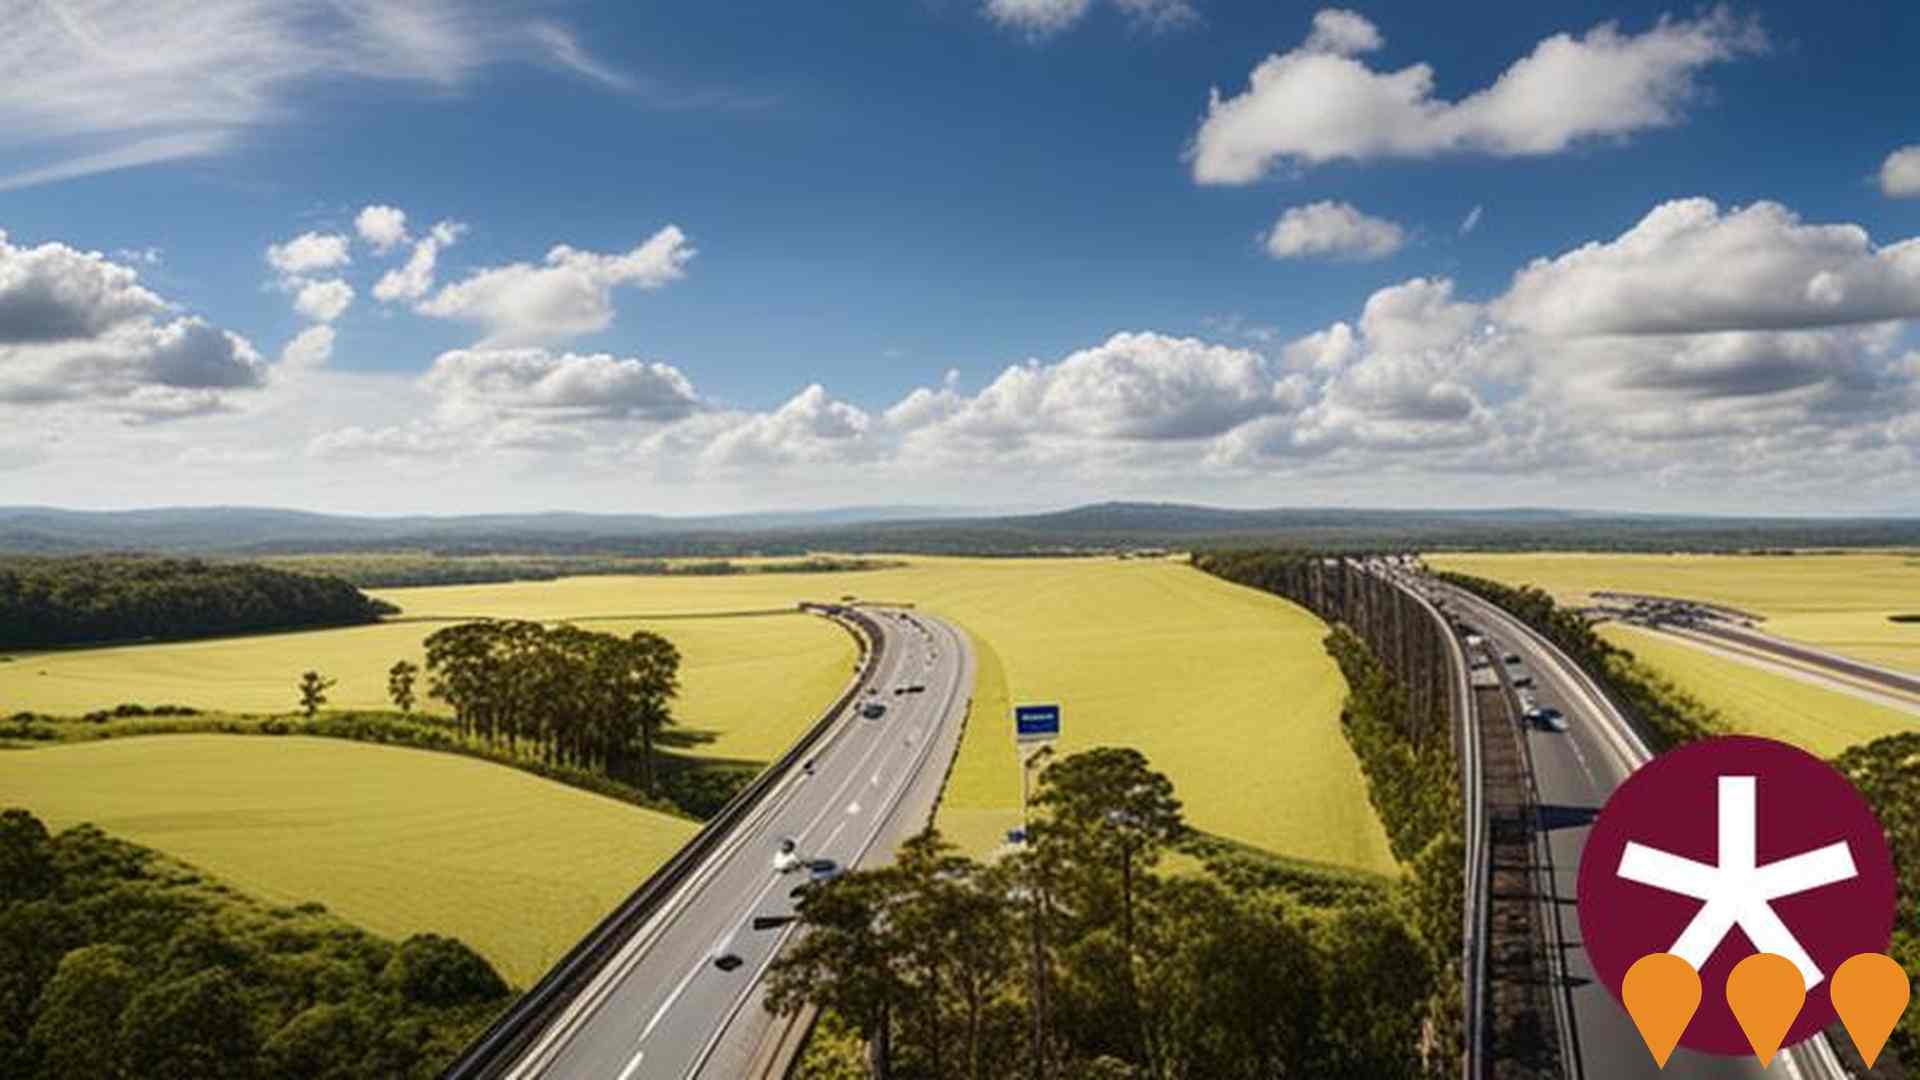
 Denotes AI-based impression for illustrative purposes only, not to be taken as definitive under any circumstances. Please follow links and conduct other investigations from the project's source for actual imagery. Developers and project owners wishing us to use original imagery please Contact Us and we will do so.
Frequently Asked Questions - Infrastructure
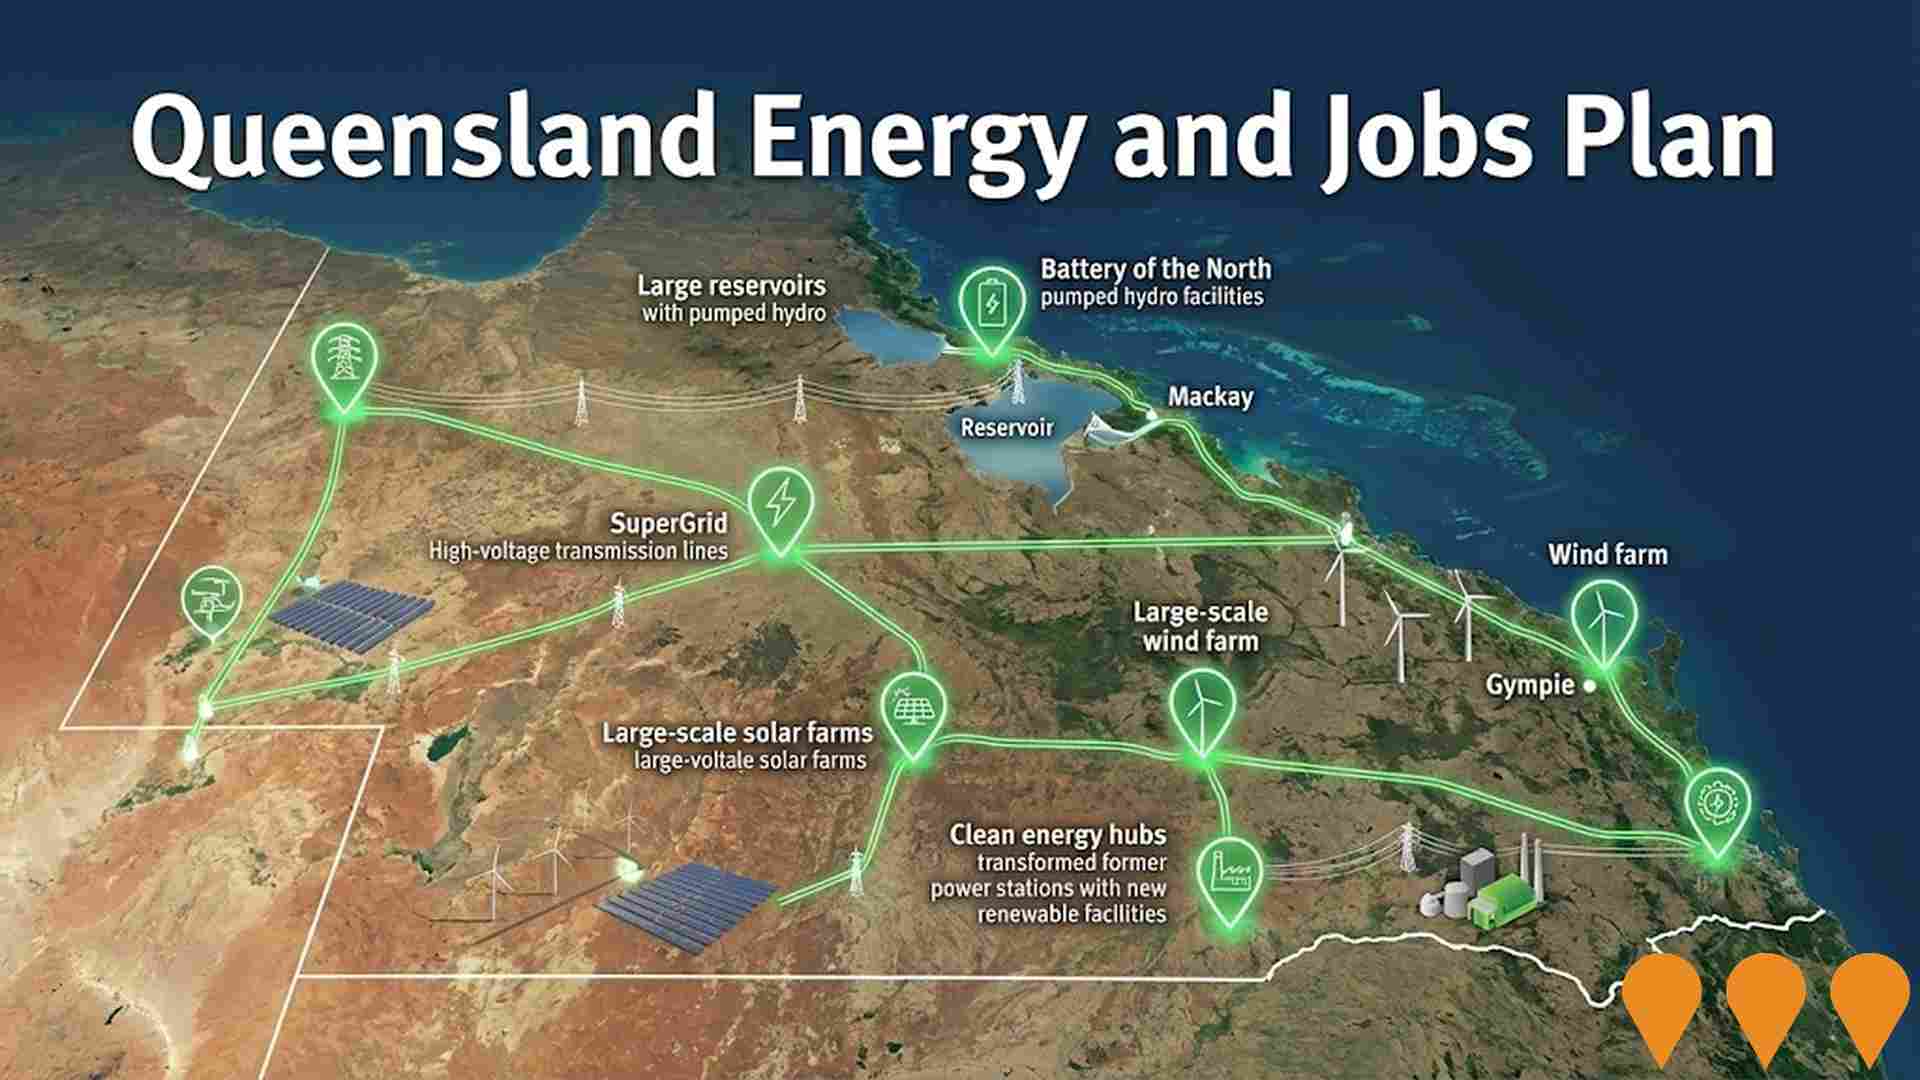
Queensland Energy and Jobs Plan
State-wide renewable energy transformation program delivering large-scale wind, solar, pumped hydro, battery storage and transmission infrastructure. Aims for 70% renewable energy by 2032 and 80% by 2035, supporting 100,000 jobs by 2040 across regional Queensland. Largest clean energy investment program in Australia.
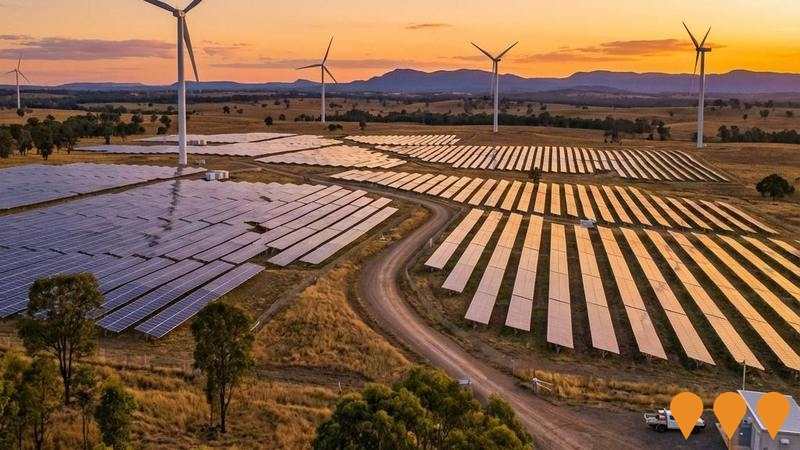
Queensland Energy and Jobs Plan SuperGrid
The Queensland Energy and Jobs Plan is delivering the Queensland SuperGrid and 22 GW of new renewable energy capacity through Renewable Energy Zones (REZs) across the state. Legislated targets are 50% renewables by 2030, 70% by 2032 and 80% by 2035. Key delivery mechanisms include the Energy (Renewable Transformation and Jobs) Act 2024, the SuperGrid Infrastructure Blueprint, the Queensland REZ Roadmap and the Priority Transmission Investments (PTI) framework. Multiple transmission projects are now in construction including CopperString 2032, Gladstone PTI (Central Queensland SuperGrid), Southern Queensland SuperGrid reinforcements, and numerous grid-scale batteries and pumped hydro projects under active development.
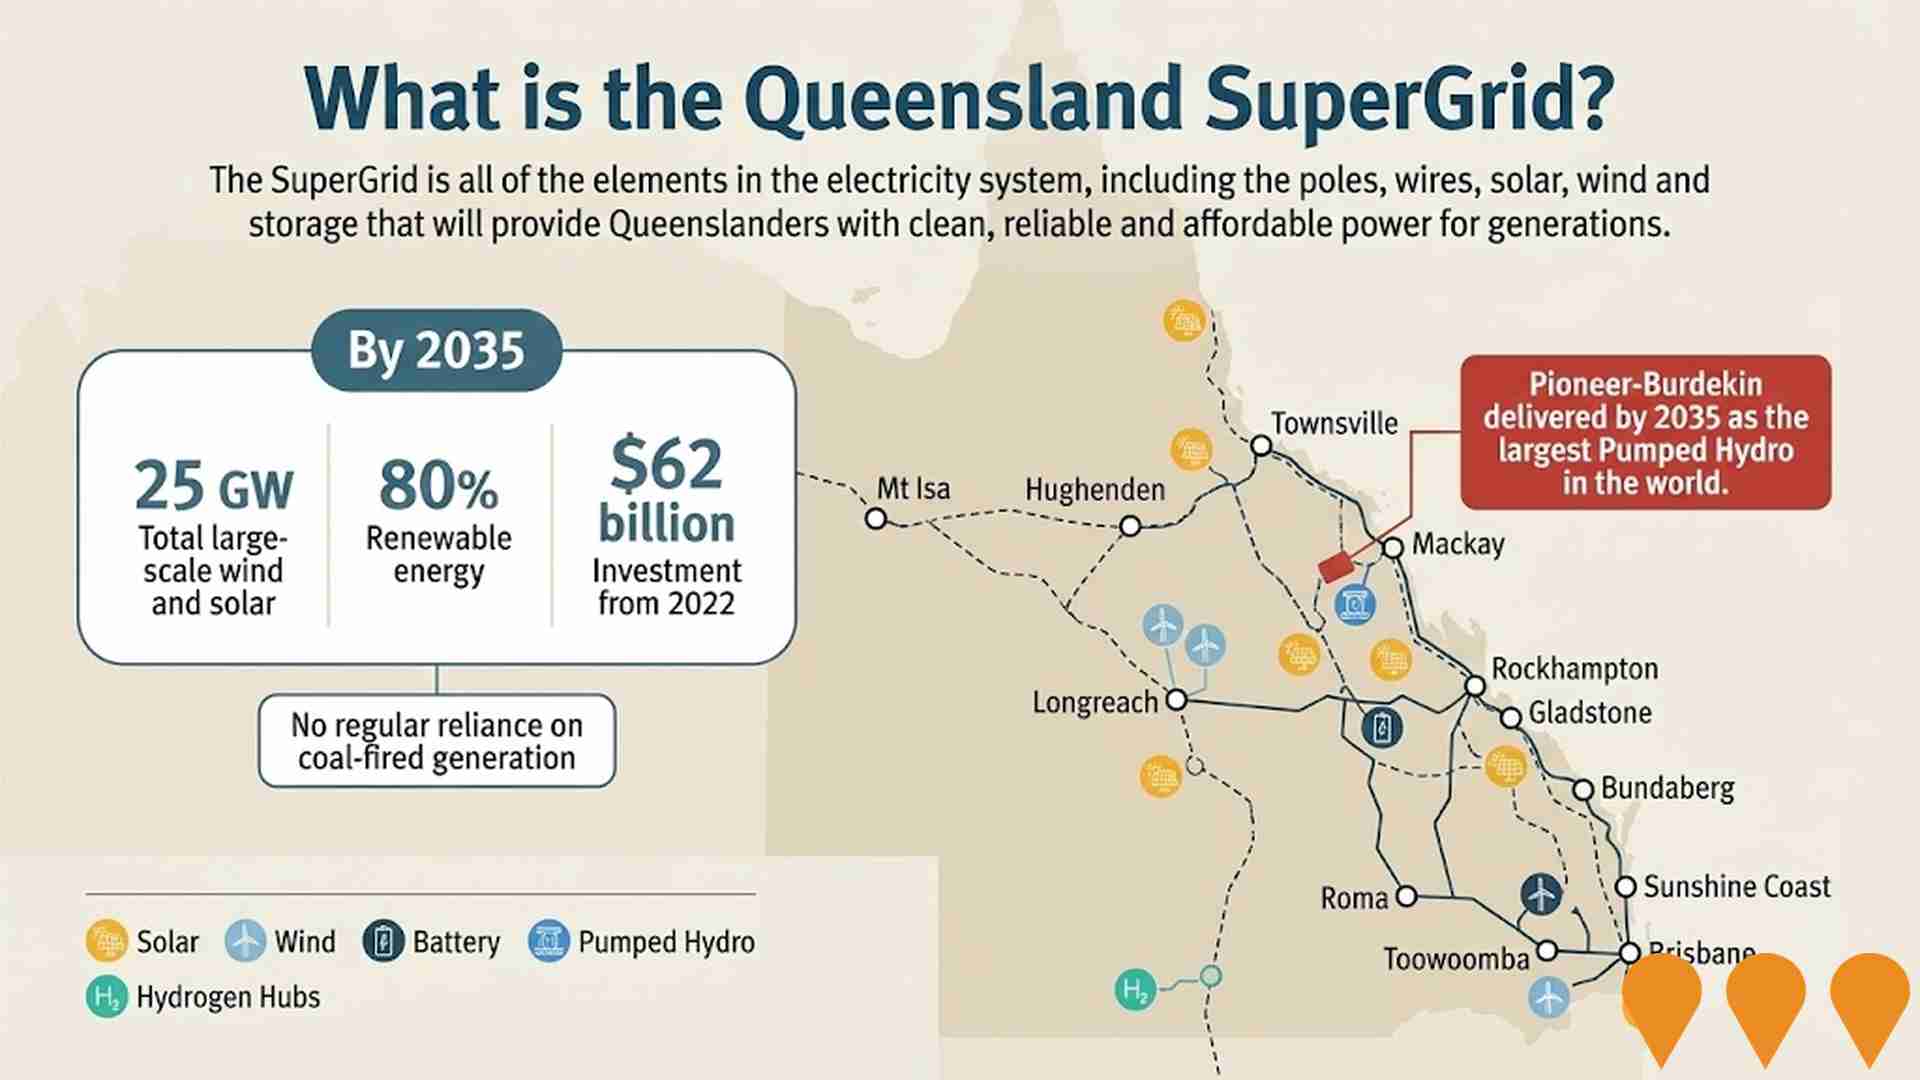
Queensland Energy and Jobs Plan
The Queensland Energy and Jobs Plan is a $62 billion+ statewide program to deliver publicly owned renewable energy generation, large-scale battery and pumped hydro storage, and the Queensland SuperGrid transmission backbone. Targets: 50% renewables by 2030, 70% by 2032, 80% by 2035. Multiple projects are now under construction including CopperString 2032, Pioneer-Burdekin Pumped Hydro, and numerous Renewable Energy Zones.
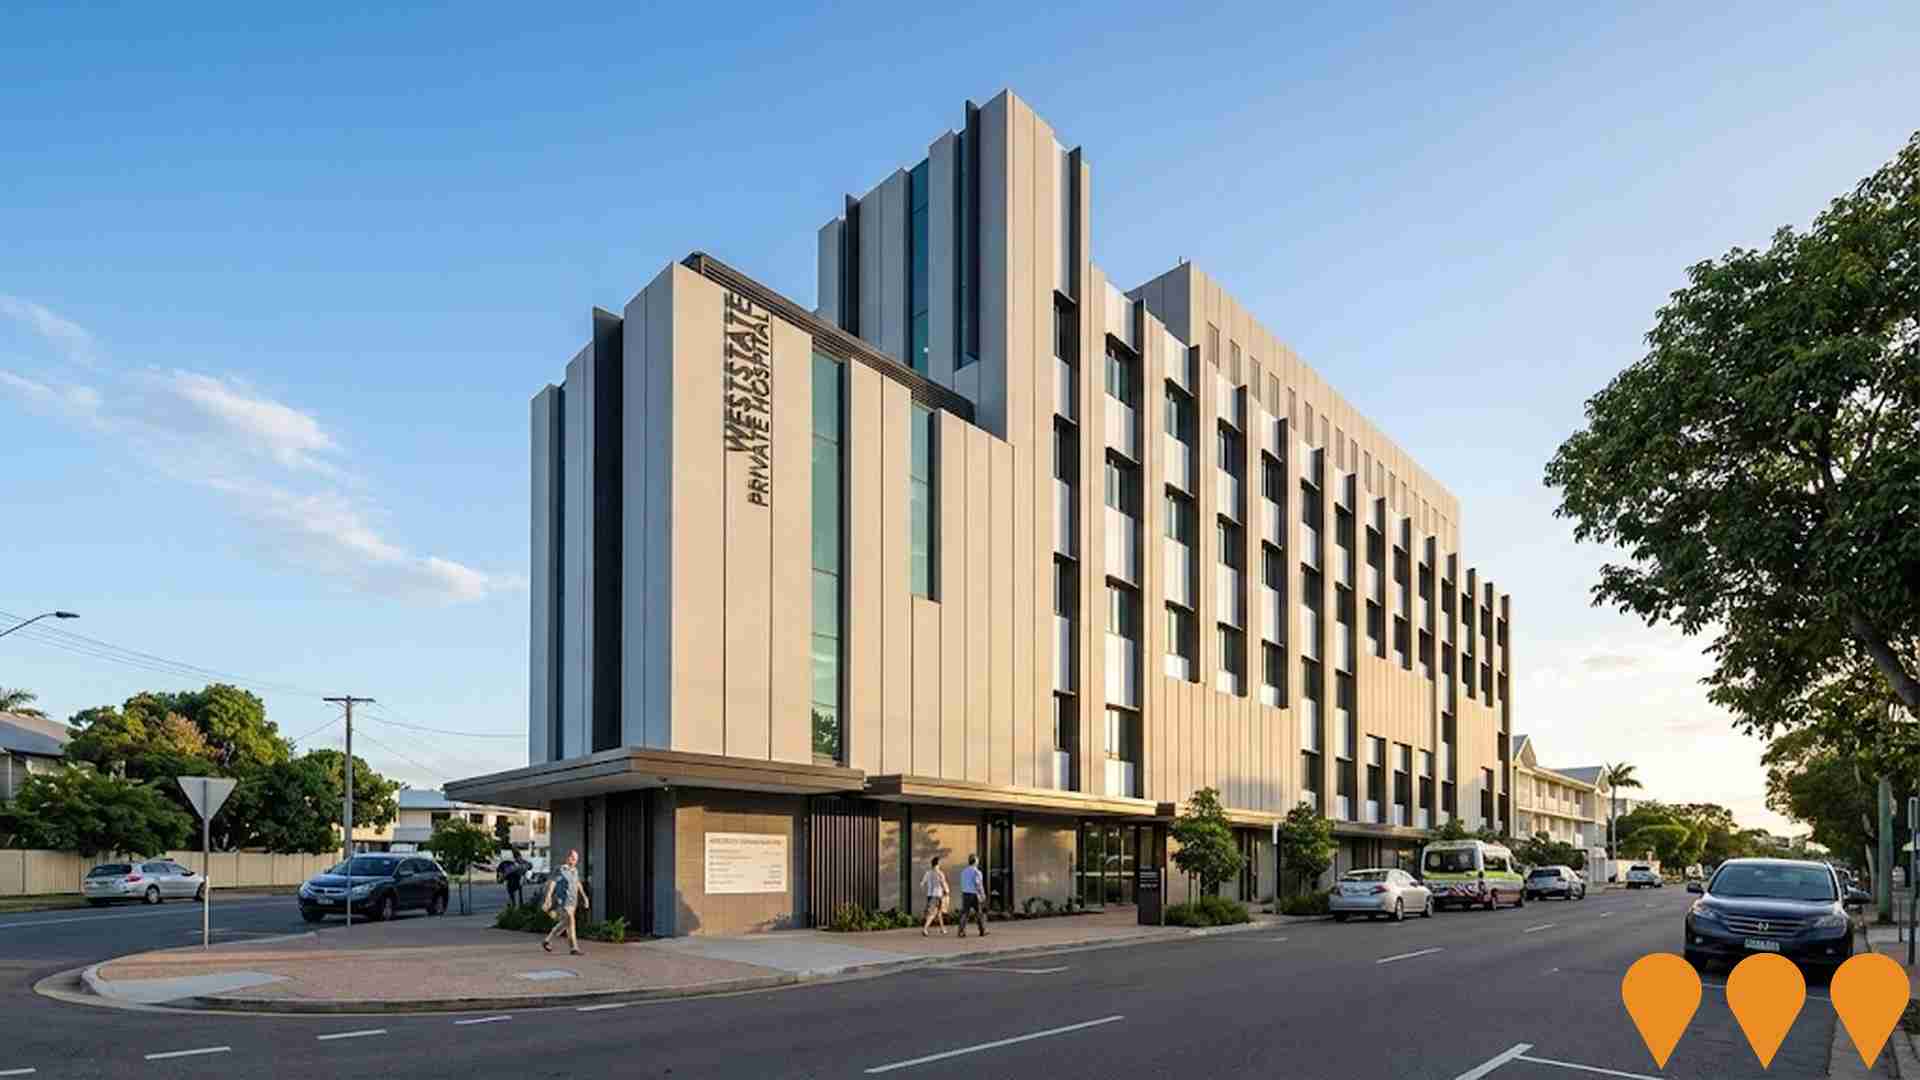
Weststate Private Hospital
New five-storey short-stay private hospital on the former West State School site in West End, Townsville. Features four operating theatres, one procedure room, 19 day-surgery beds and 26 overnight beds. Construction commenced February 2022. Despite reported disputes in 2024-2025 between fund-through developer Centuria Healthcare and operator partner, works remain active on site as of November 2025 with structural framing and facade installation progressing.
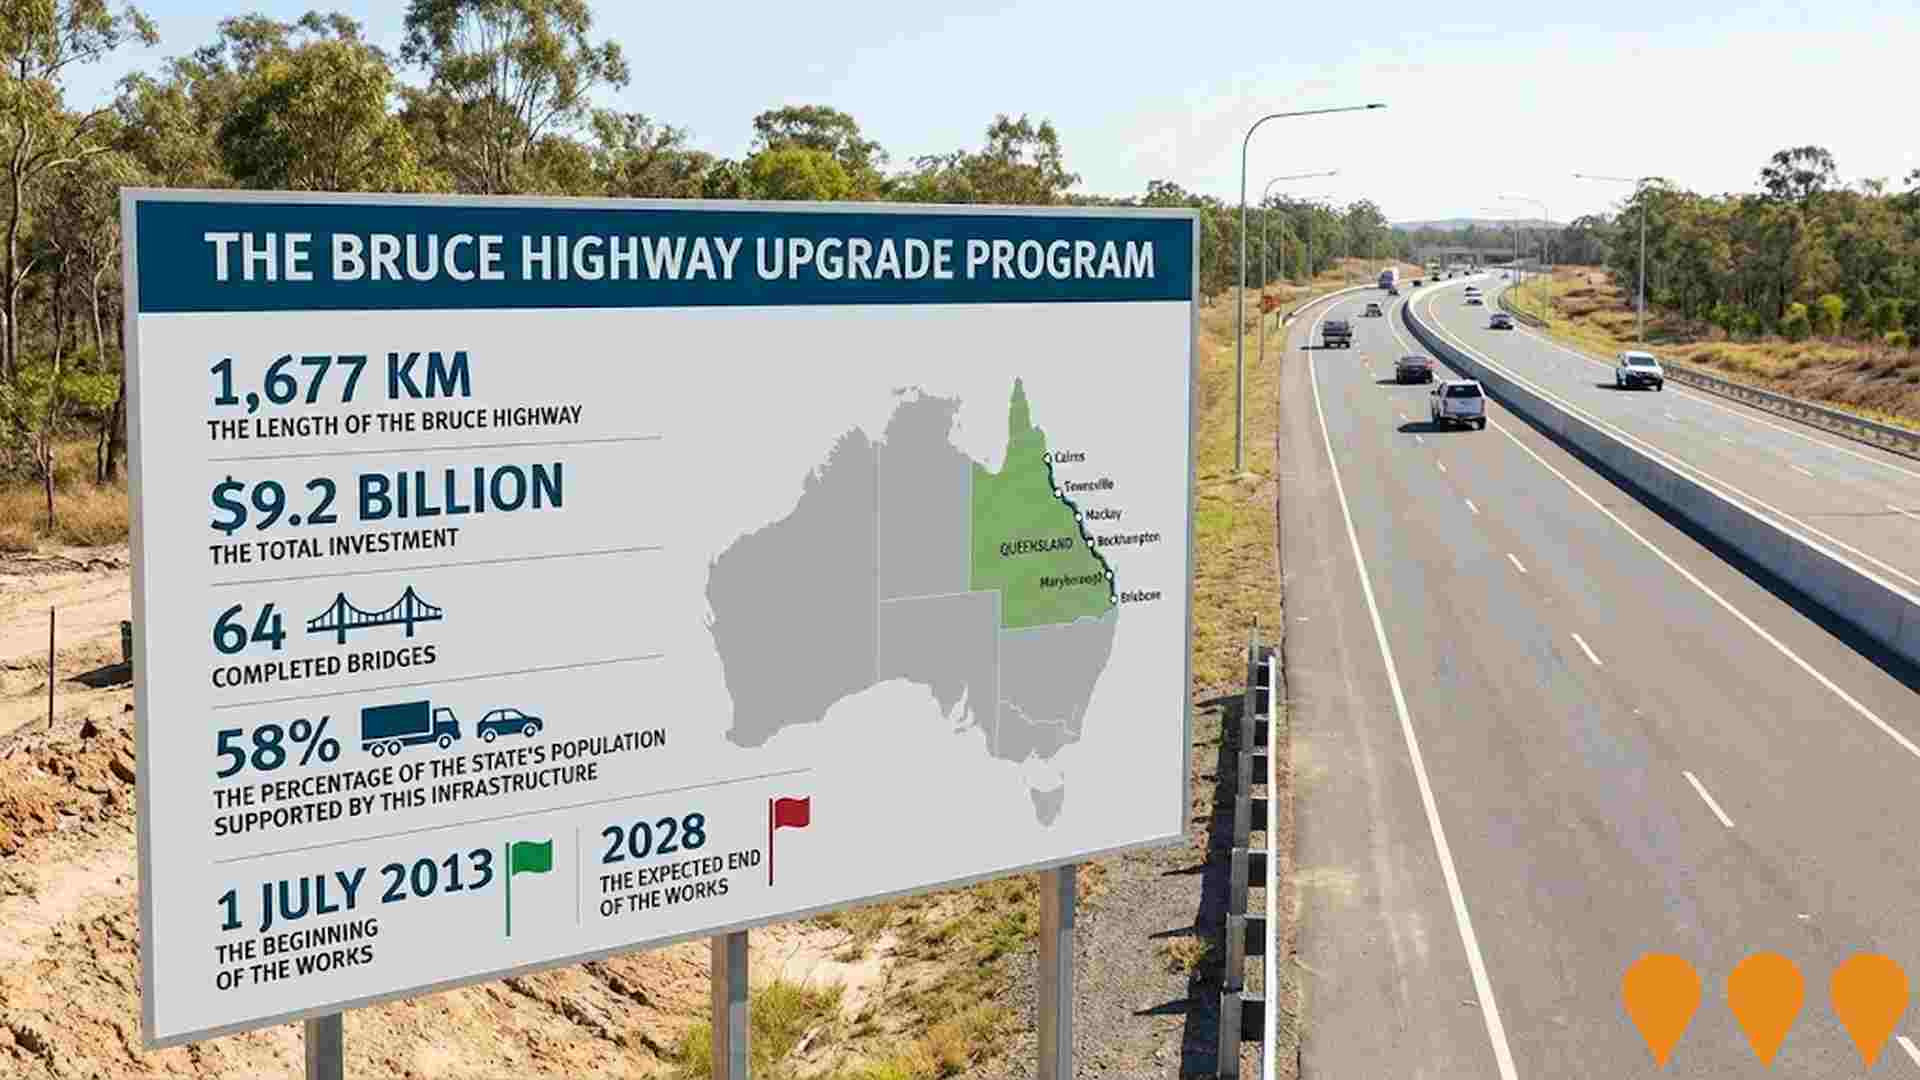
Bruce Highway Upgrade Program
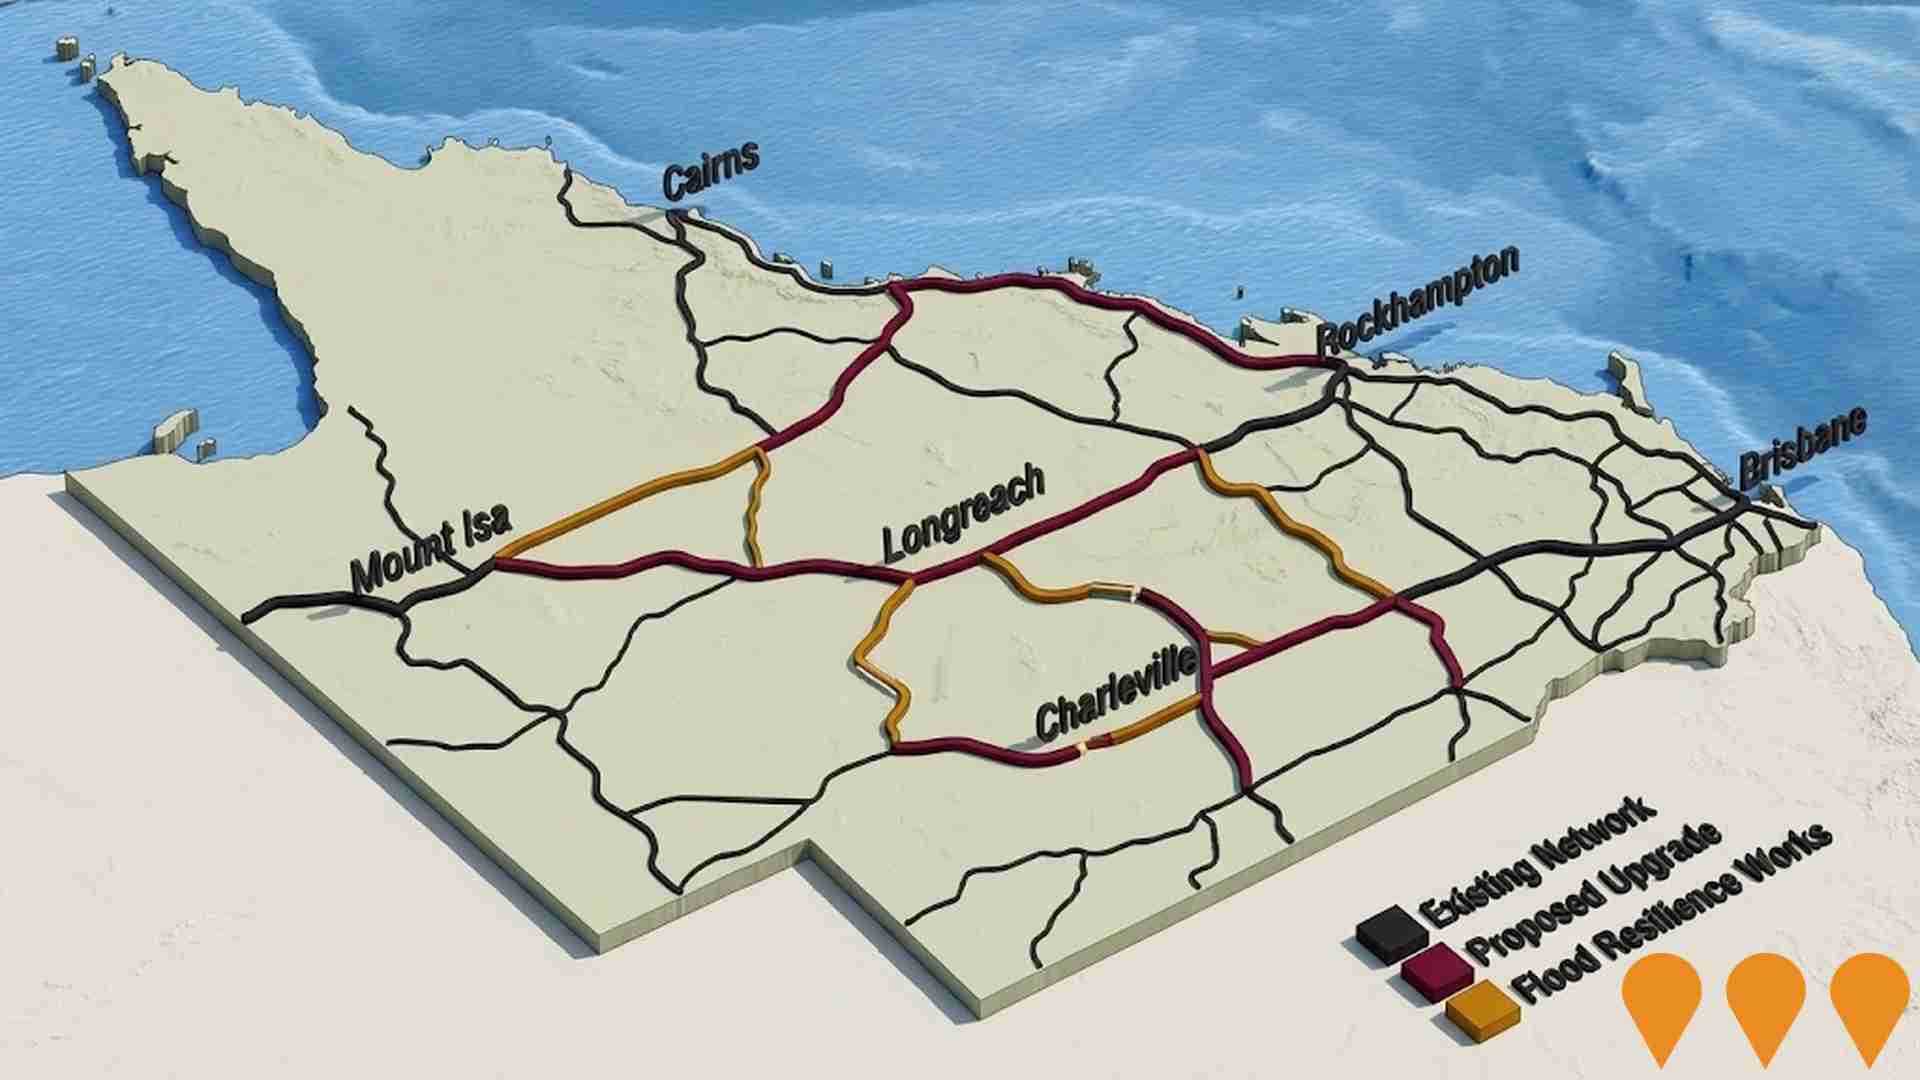
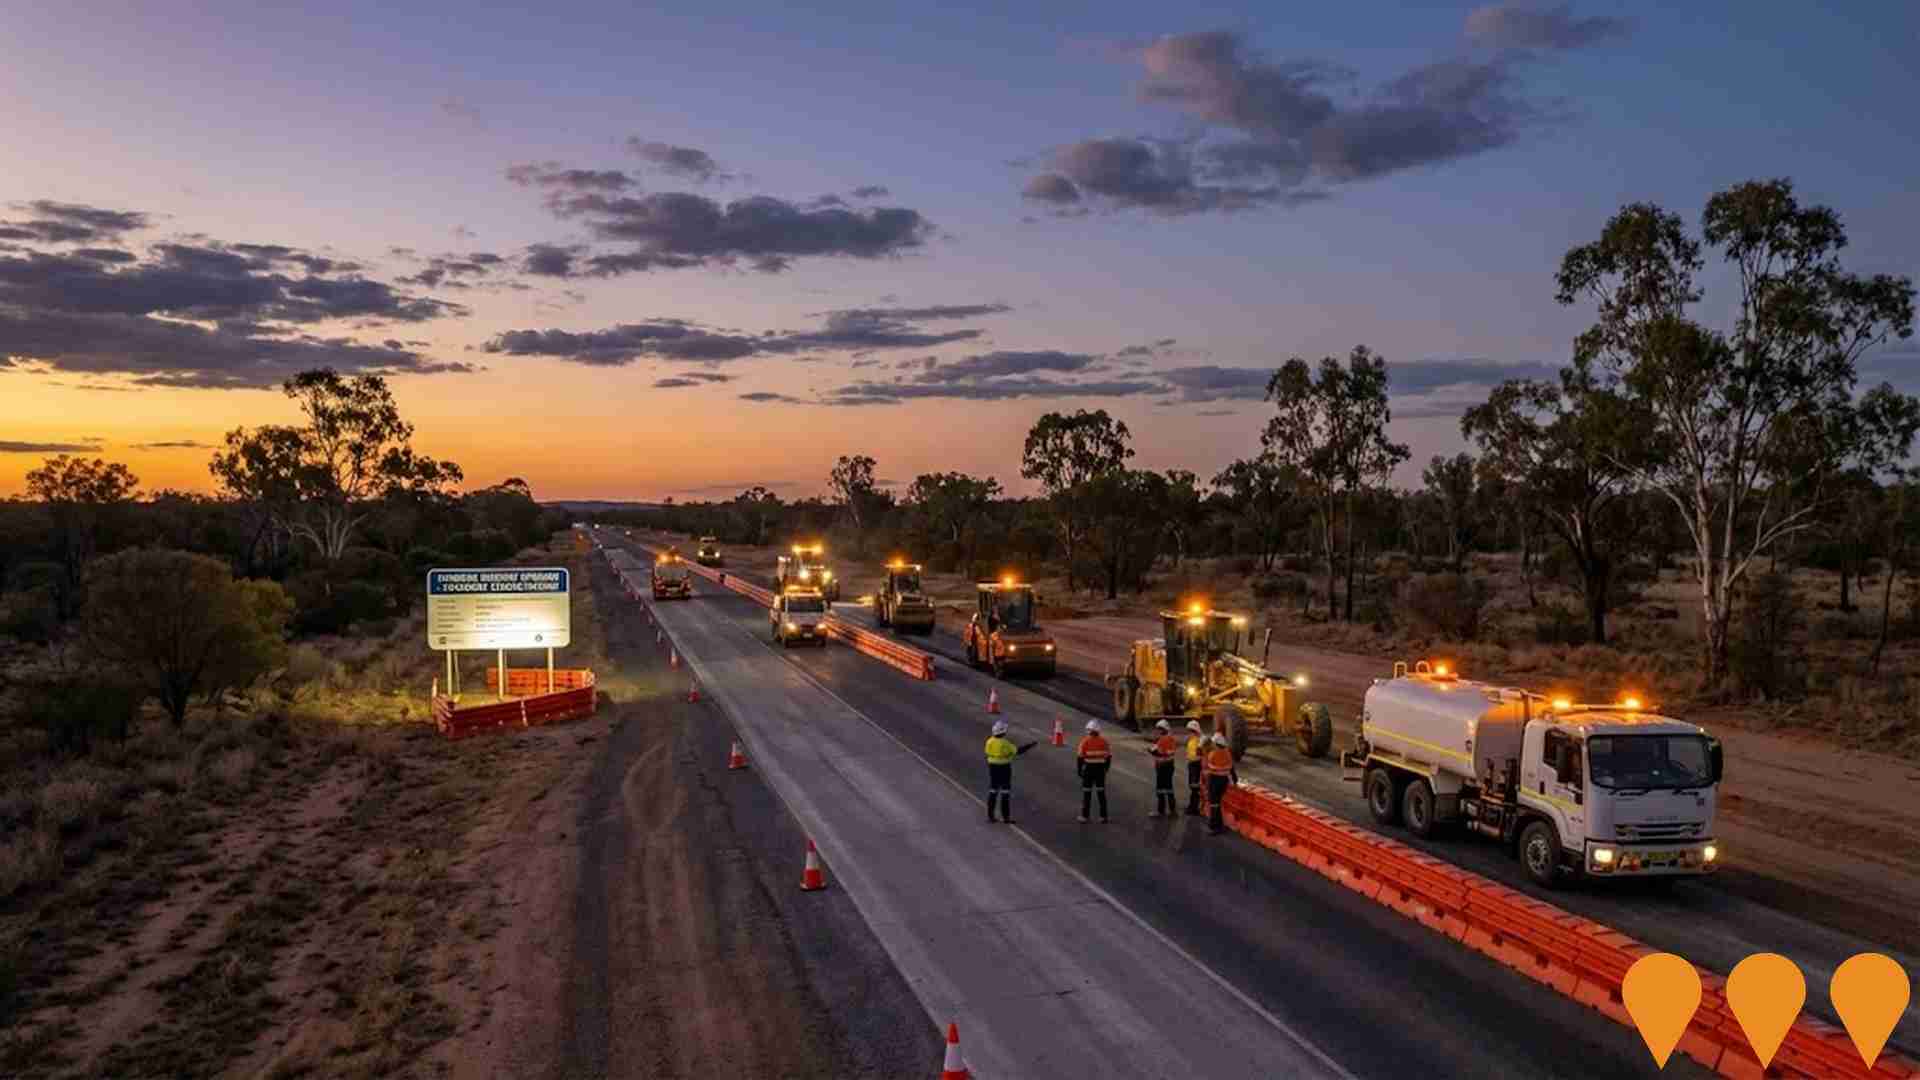
The Bruce Highway Upgrade Program is Queensland's largest road infrastructure initiative, delivering safety, flood resilience, and capacity improvements along the 1,677km corridor from Brisbane to Cairns. The massive investment program includes the $9 billion Targeted Safety Program, major bypass projects (including Gympie, Rockhampton, and Tiaro), bridge replacements, and wide centre line treatments. Jointly funded by the Australian and Queensland governments, works are progressing across multiple sections simultaneously.
CopperString 2032
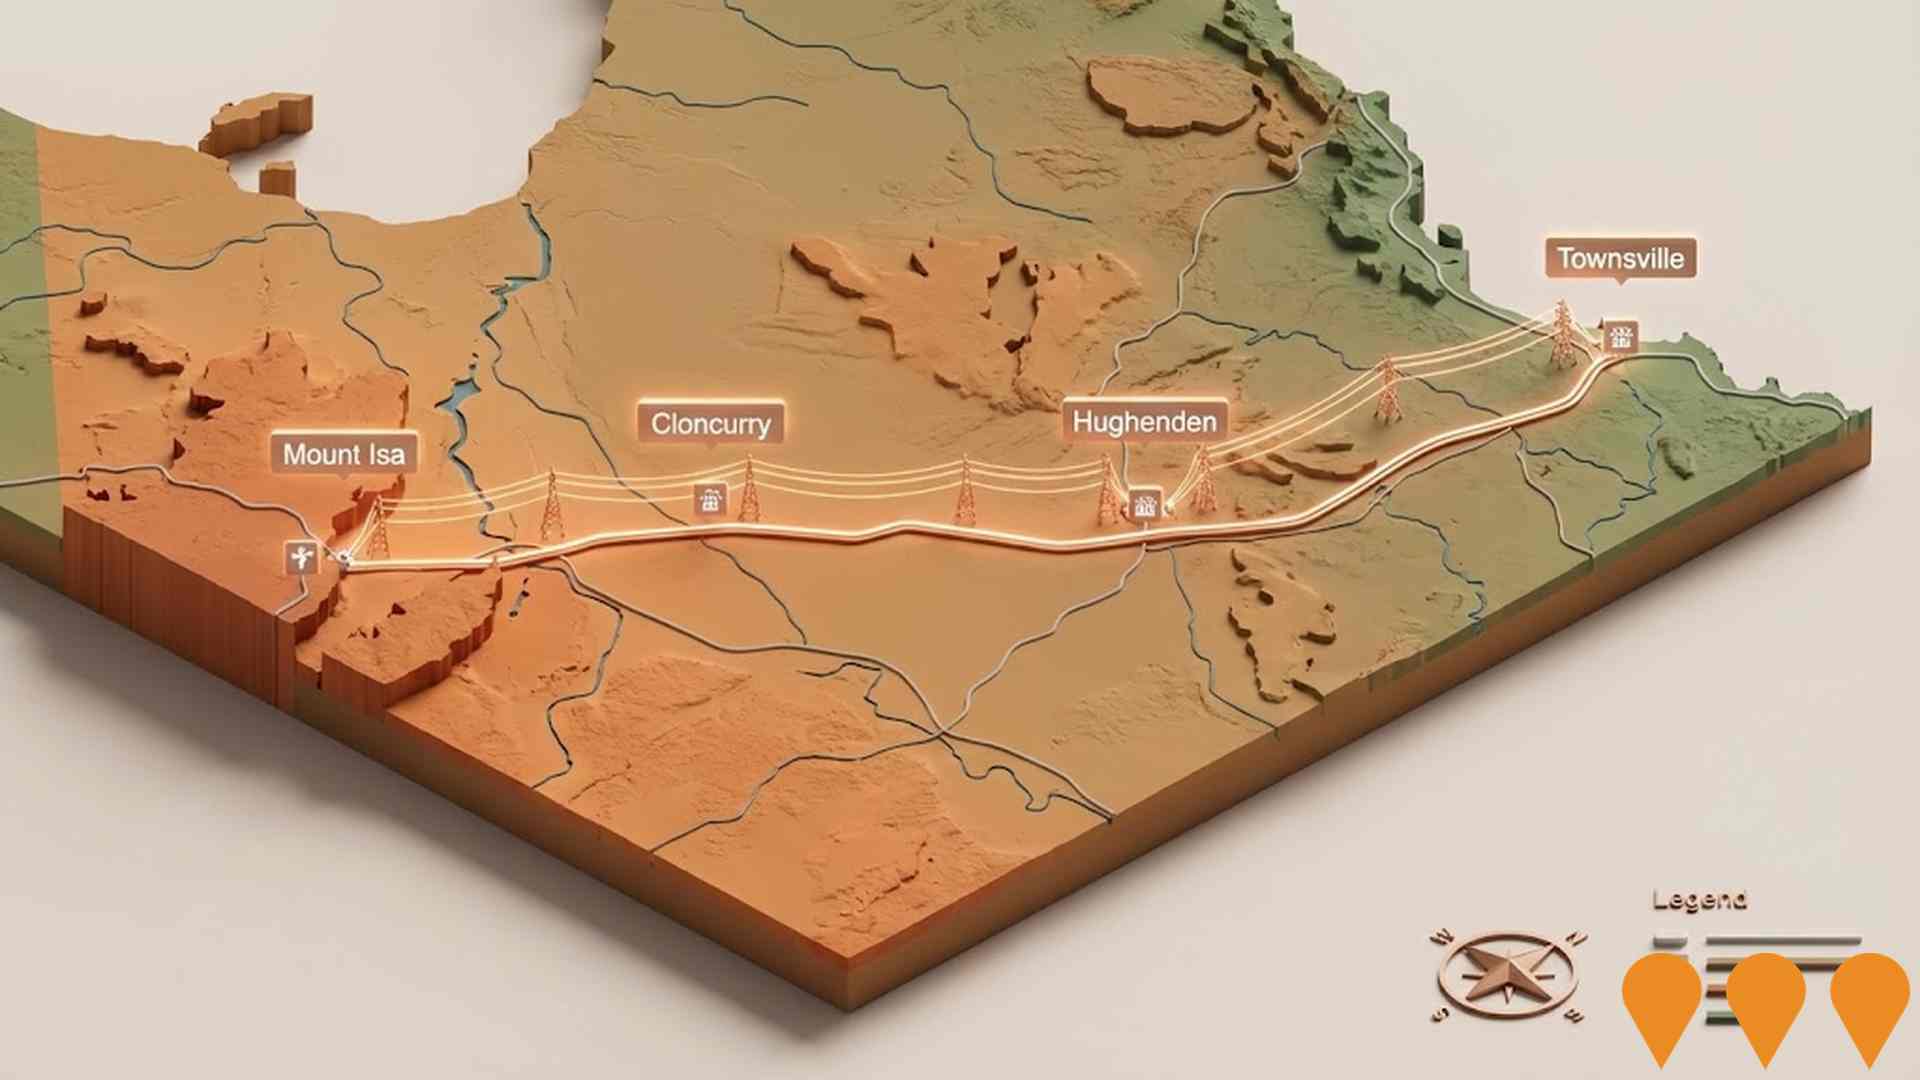
The CopperString 2032 project involves constructing approximately 840 km of high-voltage electricity transmission lines to connect Queensland's North West Minerals Province to the National Electricity Market. It includes a 500 kV line from Townsville to Hughenden, a 330 kV line from Hughenden to Cloncurry, a 220 kV line from Cloncurry to Mount Isa, along with substations and supporting facilities. The project is prioritizing the Eastern Link with private investment sought for the Western Link.
Douglas Water Treatment Plant Clarifiers Upgrade
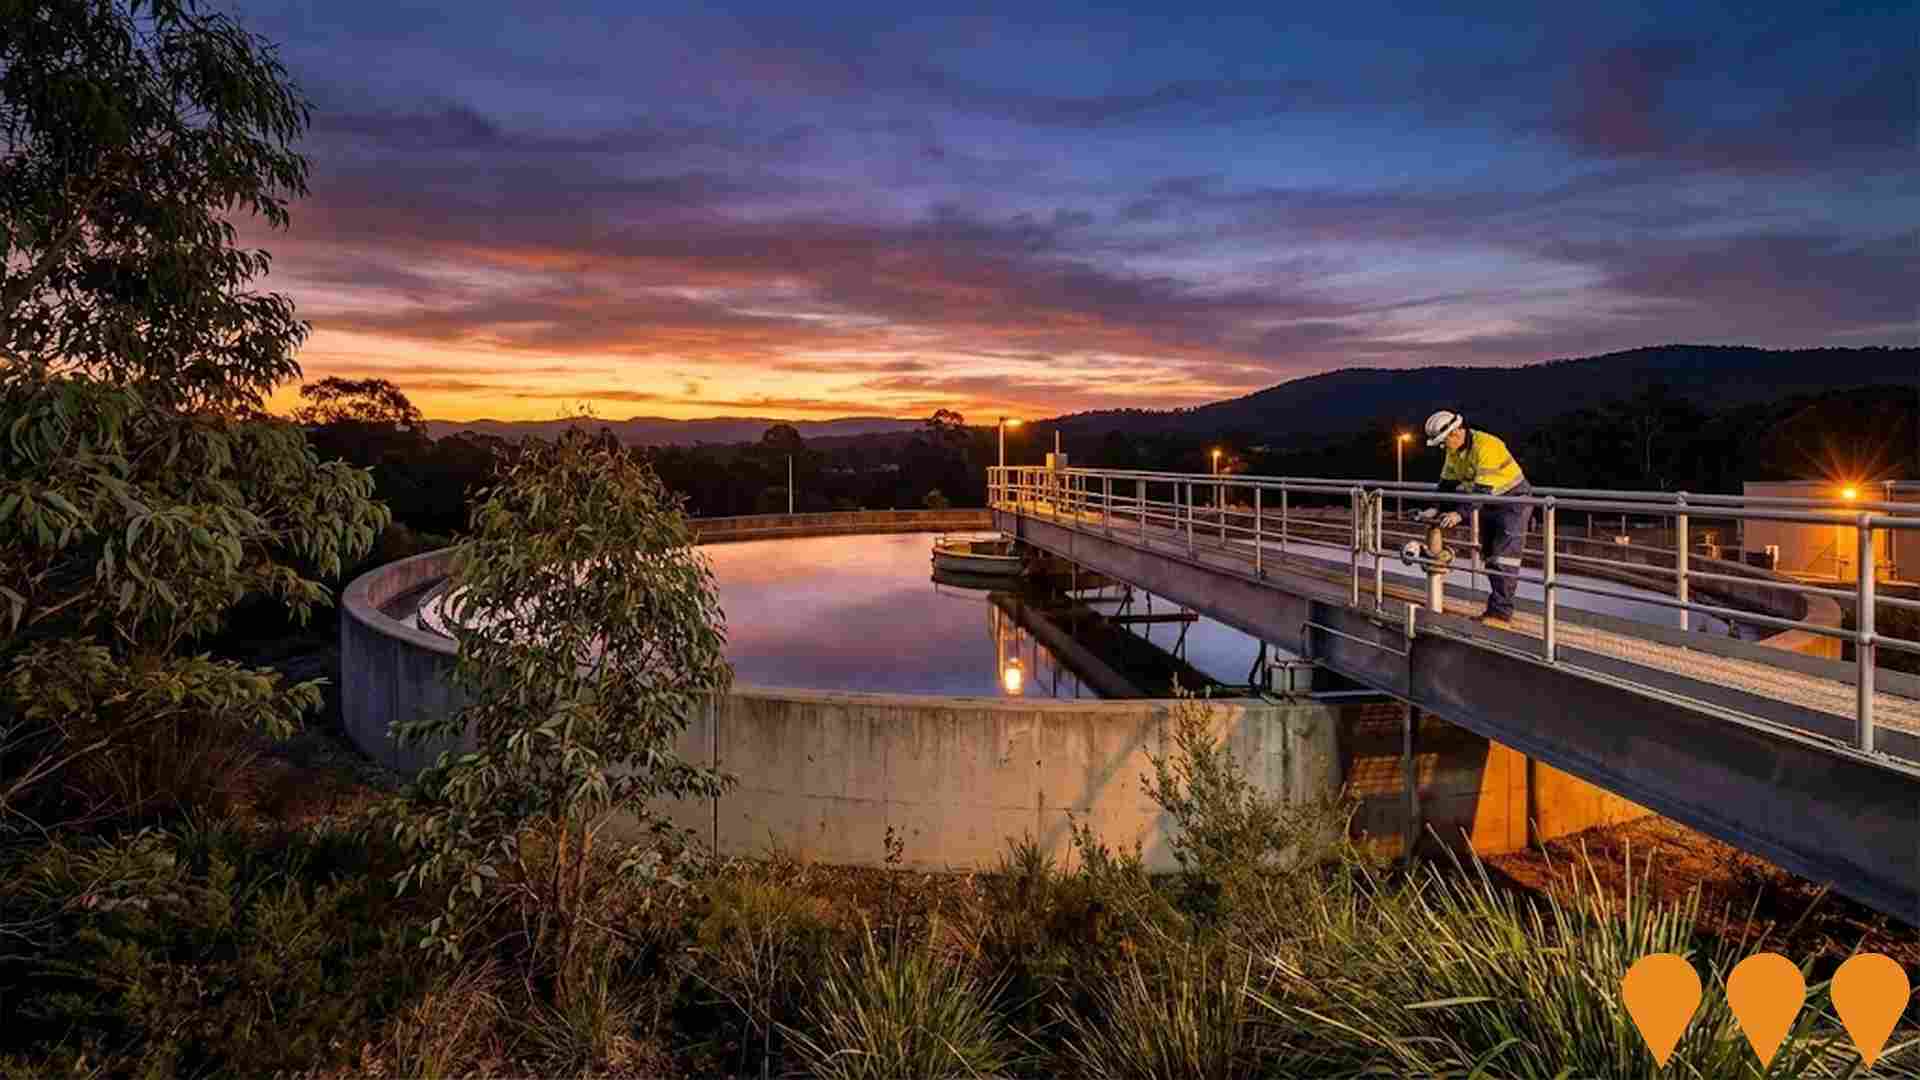
The project involved the installation of two new clarifiers at the Douglas Water Treatment Plant to double the number of clarifiers, enhancing water treatment capacity during tropical weather events and providing additional water security for Townsvilles growing population. The new infrastructure treats 950 litres per second through Module 3 and 1100 litres per second through Module 4.
Bowen Basin Gas Pipeline
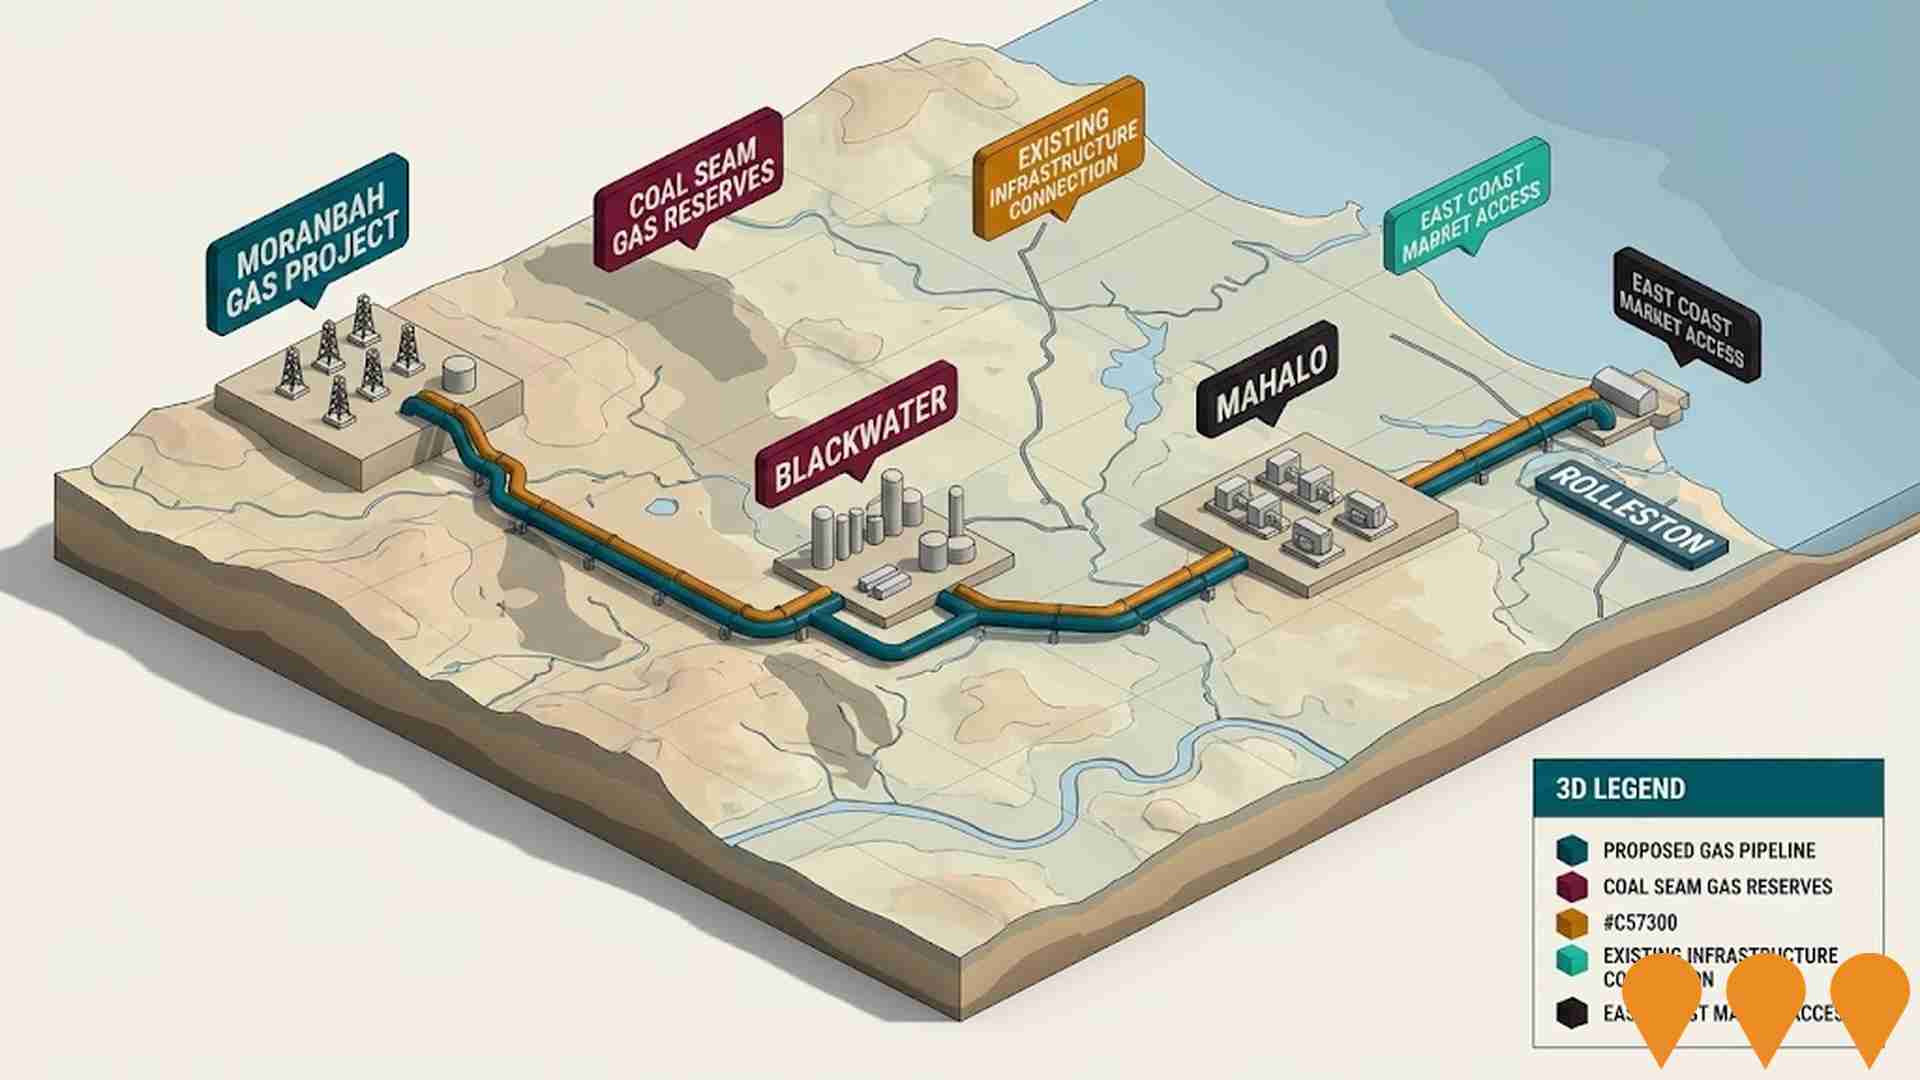
A proposed 500km gas transmission pipeline to connect coal seam gas reserves in the Bowen Basin to the east coast domestic market and overseas customers via existing pipeline infrastructure. The project completed Phase 1 concept study in December 2021 and Phase 2 market engagement in December 2022. Phase 2 findings showed market interest exists but timing is critical for investor confidence. The pipeline could potentially transport up to 457 TJ/d of gas from three main regions: Moranbah (200 TJ/d), Blackwater (77 TJ/d), and Mahalo (180 TJ/d). The preferred route (Option 2B) would run approximately 390km from the Bowen Basin to connect with existing infrastructure near Rolleston. The project also aims to capture coal mine methane emissions to reduce fugitive emissions and support Queensland's transition to a low-carbon economy.
Employment
AreaSearch assessment indicates Magnetic Island faces employment challenges relative to the majority of Australian markets
Magnetic Island's workforce is well-educated with a prominent tourism and hospitality sector. The unemployment rate as of September 2025 was 6.5%.
There were 1,117 residents employed while the unemployment rate was 2.5% higher than Rest of Qld's rate of 4.1%. Workforce participation lagged significantly at 47.1%, compared to Rest of Qld's 59.1%. Employment is concentrated in accommodation & food, health care & social assistance, and retail trade. The area specializes in accommodation & food with an employment share 2.5 times the regional level.
Conversely, health care & social assistance has lower representation at 11.3% versus the regional average of 16.1%. Over the year to September 2025, labour force levels increased by 0.6% while employment declined by 1.4%, causing unemployment rate to rise by 1.9 percentage points. Rest of Qld experienced employment growth of 1.7% and labour force growth of 2.1%. State-level data to 25-Nov shows QLD employment contracted by 0.01% with a state unemployment rate of 4.2%, broadly in line with the national rate of 4.3%. National employment forecasts from May-25 project a 6.6% increase over five years and 13.7% over ten years. Applying these projections to Magnetic Island's employment mix suggests local employment should increase by 6.4% over five years and 13.1% over ten years, assuming constant population projections.
Frequently Asked Questions - Employment
Income
Income metrics place the area in the bottom 10% of locations nationally according to AreaSearch analysis
AreaSearch's latest postcode level ATO data for financial year ending June 2022 shows median income in Magnetic Island SA2 was $39,504 and average income was $51,856. This is lower than Rest of Qld's median income of $50,780 and average income of $64,844. Based on Wage Price Index growth of 13.99% from June 2022 to September 2025, estimated median income in Magnetic Island would be approximately $45,031 and average income would be around $59,111 by that date. According to Census 2021 data, incomes in Magnetic Island fall between the 3rd and 15th percentiles nationally. The income bracket of $800 - 1,499 captures 28.8% of the community there, compared to metropolitan regions where 31.7% earn within the $1,500 - 2,999 range. Housing affordability pressures are severe in Magnetic Island, with only 84.7% of income remaining after housing costs, ranking at the 5th percentile nationally.
Frequently Asked Questions - Income
Housing
Magnetic Island is characterized by a predominantly suburban housing profile, with above-average rates of outright home ownership
The latest Census evaluation of Magnetic Island's dwelling structure showed 83.6% houses and 16.3% other dwellings (semi-detached, apartments, 'other' dwellings), compared to Non-Metro Qld's 81.3% houses and 18.7% other dwellings. Home ownership on Magnetic Island was 49.1%, with mortgaged dwellings at 23.4% and rented ones at 27.5%. The median monthly mortgage repayment in the area was $1,353, lower than Non-Metro Qld's average of $1,517. The median weekly rent figure on Magnetic Island was recorded as $290, compared to Non-Metro Qld's $305. Nationally, Magnetic Island's mortgage repayments were significantly lower than the Australian average of $1,863, while rents were substantially below the national figure of $375.
Frequently Asked Questions - Housing
Household Composition
Magnetic Island features high concentrations of lone person households and group households, with a lower-than-average median household size
Family households account for 58.9% of all households, including 11.8% couples with children, 37.6% couples without children, and 8.2% single parent families. Non-family households make up the remaining 41.1%, with lone person households at 36.4% and group households comprising 4.8%. The median household size is 1.9 people, which is smaller than the Rest of Qld average of 2.5.
Frequently Asked Questions - Households
Local Schools & Education
Magnetic Island performs slightly above the national average for education, showing competitive qualification levels and steady academic outcomes
The area's university qualification rate is 28.6%, exceeding the SA4 region average of 20.1% and Rest of Qld's rate of 20.6%. Bachelor degrees are most common at 18.5%, followed by postgraduate qualifications (7.4%) and graduate diplomas (2.7%). Vocational credentials are held by 39.8% of residents aged 15+, with advanced diplomas at 13.2% and certificates at 26.6%.
A total of 22.3% of the population is actively pursuing education, including 8.7% in primary, 6.3% in secondary, and 2.8% in tertiary education.
Frequently Asked Questions - Education
Schools Detail
Nearby Services & Amenities
Transport
Transport servicing is moderate compared to other areas nationally based on assessment of service frequency, route connectivity and accessibility
The analysis of public transport on Magnetic Island shows that there are currently 51 active transport stops in operation. These include a mix of ferry and bus services. There are two individual routes servicing these stops, collectively providing 500 weekly passenger trips.
The accessibility of transport is rated as good, with residents typically located approximately 320 meters from the nearest transport stop. The service frequency averages 71 trips per day across all routes, which equates to roughly 9 weekly trips per individual stop.
Frequently Asked Questions - Transport
Transport Stops Detail
Health
Health performance in Magnetic Island is well below average with prevalence of common health conditions notable across both younger and older age cohorts
Magnetic Island faces significant health challenges, with common conditions prevalent across both younger and older age groups. Private health cover is low at approximately 46%, covering around 1,235 people, compared to Queensland's rest average of 53.3% and the national average of 55.3%. The most frequent medical conditions are arthritis (affecting 11.4%) and mental health issues (7.9%).
Around 63.2% report being free from medical ailments, compared to Queensland's rest at 67.8%. The island has a higher proportion of seniors aged 65 and over, at 36.1% or around 965 people, compared to the state average of 14.9%. Despite this, health outcomes among seniors are strong and often better than those in the general population.
Frequently Asked Questions - Health
Cultural Diversity
In terms of cultural diversity, Magnetic Island records figures broadly comparable to the national average, as found in AreaSearch's assessment of a number of language and cultural background related metrics
Magnetic Island's cultural diversity was found to be above average, with 7.3% of its population speaking a language other than English at home and 27.6% born overseas. Christianity was the main religion on Magnetic Island, comprising 41.3% of its population. Notably, Buddhism was overrepresented compared to the rest of Queensland, making up 2.6% of Magnetic Island's population versus 0.9%.
The top three ancestry groups were English at 32.8%, Australian at 23.7%, and Irish at 11.8%. French, Scottish, and Dutch ethnicities showed notable divergences in representation compared to regional averages: French was overrepresented at 0.8% versus 0.4%, Scottish at 9.3% versus 7.7%, and Dutch at 1.7% versus 1.0%.
Frequently Asked Questions - Diversity
Age
Magnetic Island ranks among the oldest 10% of areas nationwide
Magnetic Island's median age is 57 years, which is considerably higher than Queensland's average of 41 years and the national norm of 38 years. The age profile shows that residents aged 65-74 years are prominent, making up 23.7% of the population, compared to the Rest of Qld's figure of 9.4%. Conversely, those aged 15-24 years make up only 6.2%, which is smaller than the Rest of Qld average. From 2021 to present, the 75-84 age group has grown from 8.2% to 9.6%, while the 45-54 cohort has declined from 11.8% to 9.1% and the 55-64 group has dropped from 23.7% to 21.5%. By 2041, demographic projections indicate that the 85+ age cohort will rise significantly, expanding by 57 people (75%) from 77 to 135. This aging trend continues as residents aged 65 and older represent 75% of anticipated growth. Conversely, population declines are projected for those aged 5-14 years and 15-24 years.
