Chart Color Schemes
This analysis uses ABS Statistical Areas Level 2 (SA2) boundaries, which can materially differ from Suburbs and Localities (SAL) even when sharing similar names.
SA2 boundaries are defined by the Australian Bureau of Statistics and are designed to represent communities for statistical reporting (e.g., census and ERP).
Suburbs and Localities (SAL) represent commonly-used suburb/locality names (postal-style areas) and may use different geographic boundaries. For comprehensive analysis, consider reviewing both boundary types if available.
est. as @ -- *
ABS ERP | -- people | --
2021 Census | -- people
Sales Activity
Curious about local property values? Filter the chart to assess the volume and appreciation (including resales) trends and regional comparisons, or scroll to the map below view this information at an individual property level.
Find a Recent Sale
Sales Detail
Population
Population growth drivers in Burrum - Fraser are strong compared to national averages based on AreaSearch's ranking of recent, and medium to long-term trends
Burrum-Fraser's population is approximately 11,877 as of November 2025. This represents a growth of 1,283 people since the 2021 Census, which recorded a population of 10,594. The increase is inferred from ABS data showing an estimated resident population of 11,634 in June 2024 and additional validated new addresses since then. This results in a population density ratio of 4.3 persons per square kilometer. Burrum-Fraser's growth rate of 12.1% since the 2021 Census exceeds that of its SA3 area (8.2%) and non-metro areas, indicating it as a growth leader. Interstate migration contributed approximately 88.3% of overall population gains in recent periods.
AreaSearch uses ABS/Geoscience Australia projections for each SA2 area released in 2024 with a base year of 2022. For areas not covered by this data and years post-2032, Queensland State Government's SA2 area projections released in 2023 based on 2021 data are adopted. However, these state projections lack age category splits, so AreaSearch applies proportional growth weightings aligned with ABS Greater Capital Region projections for each age cohort. Future demographic trends suggest a population increase just below the median of Australia's non-metropolitan areas. By 2041, based on the latest annual ERP population numbers, Burrum-Fraser is expected to grow by 1,520 persons, reflecting a total gain of 10.8% over the 17 years.
Frequently Asked Questions - Population
Development
The level of residential development activity in Burrum - Fraser was found to be higher than 90% of real estate markets across the country
Burrum-Fraser averaged 151 new dwelling approvals annually over the past five financial years, totalling 758 homes. As of FY26, 79 approvals have been recorded. Each year, an average of two new residents is gained per dwelling built, reflecting strong demand that supports property values. The average construction cost value for new homes is $328,000, aligning with regional trends.
This financial year has seen $2.5 million in commercial approvals, indicating the area's predominantly residential nature. Compared to the Rest of Queensland, Burrum-Fraser has 111% more construction activity per person, offering greater choice for buyers and attracting significant developer interest. The dwelling approvals are primarily detached (87%), maintaining the area's traditional low-density character focused on family homes. There are approximately 61 people per dwelling approval, suggesting an expanding market. Future projections estimate Burrum-Fraser to add 1,277 residents by 2041, with current construction levels expected to meet demand and potentially enable growth beyond current forecasts.
Future projections show Burrum - Fraser adding 1,277 residents by 2041 (from the latest AreaSearch quarterly estimate). With current construction levels, housing supply should adequately meet demand, creating favourable conditions for buyers while potentially enabling growth that exceeds current forecasts.
Frequently Asked Questions - Development
Infrastructure
Burrum - Fraser has moderate levels of nearby infrastructure activity, ranking in the top 50% nationally
Changes to local infrastructure significantly impact an area's performance. AreaSearch identified 103 projects potentially affecting the region. Notable initiatives include Torbanlea Pialba Road Upgrade, Maryborough-Hervey Bay Road improvement, Pialba-Burrum Heads Road intersection upgrade, BayWest City Centre development, and Dundowran Industrial Park expansion. The following list details projects most likely to be relevant.
Professional plan users can use the search below to filter and access additional projects.
INFRASTRUCTURE SEARCH
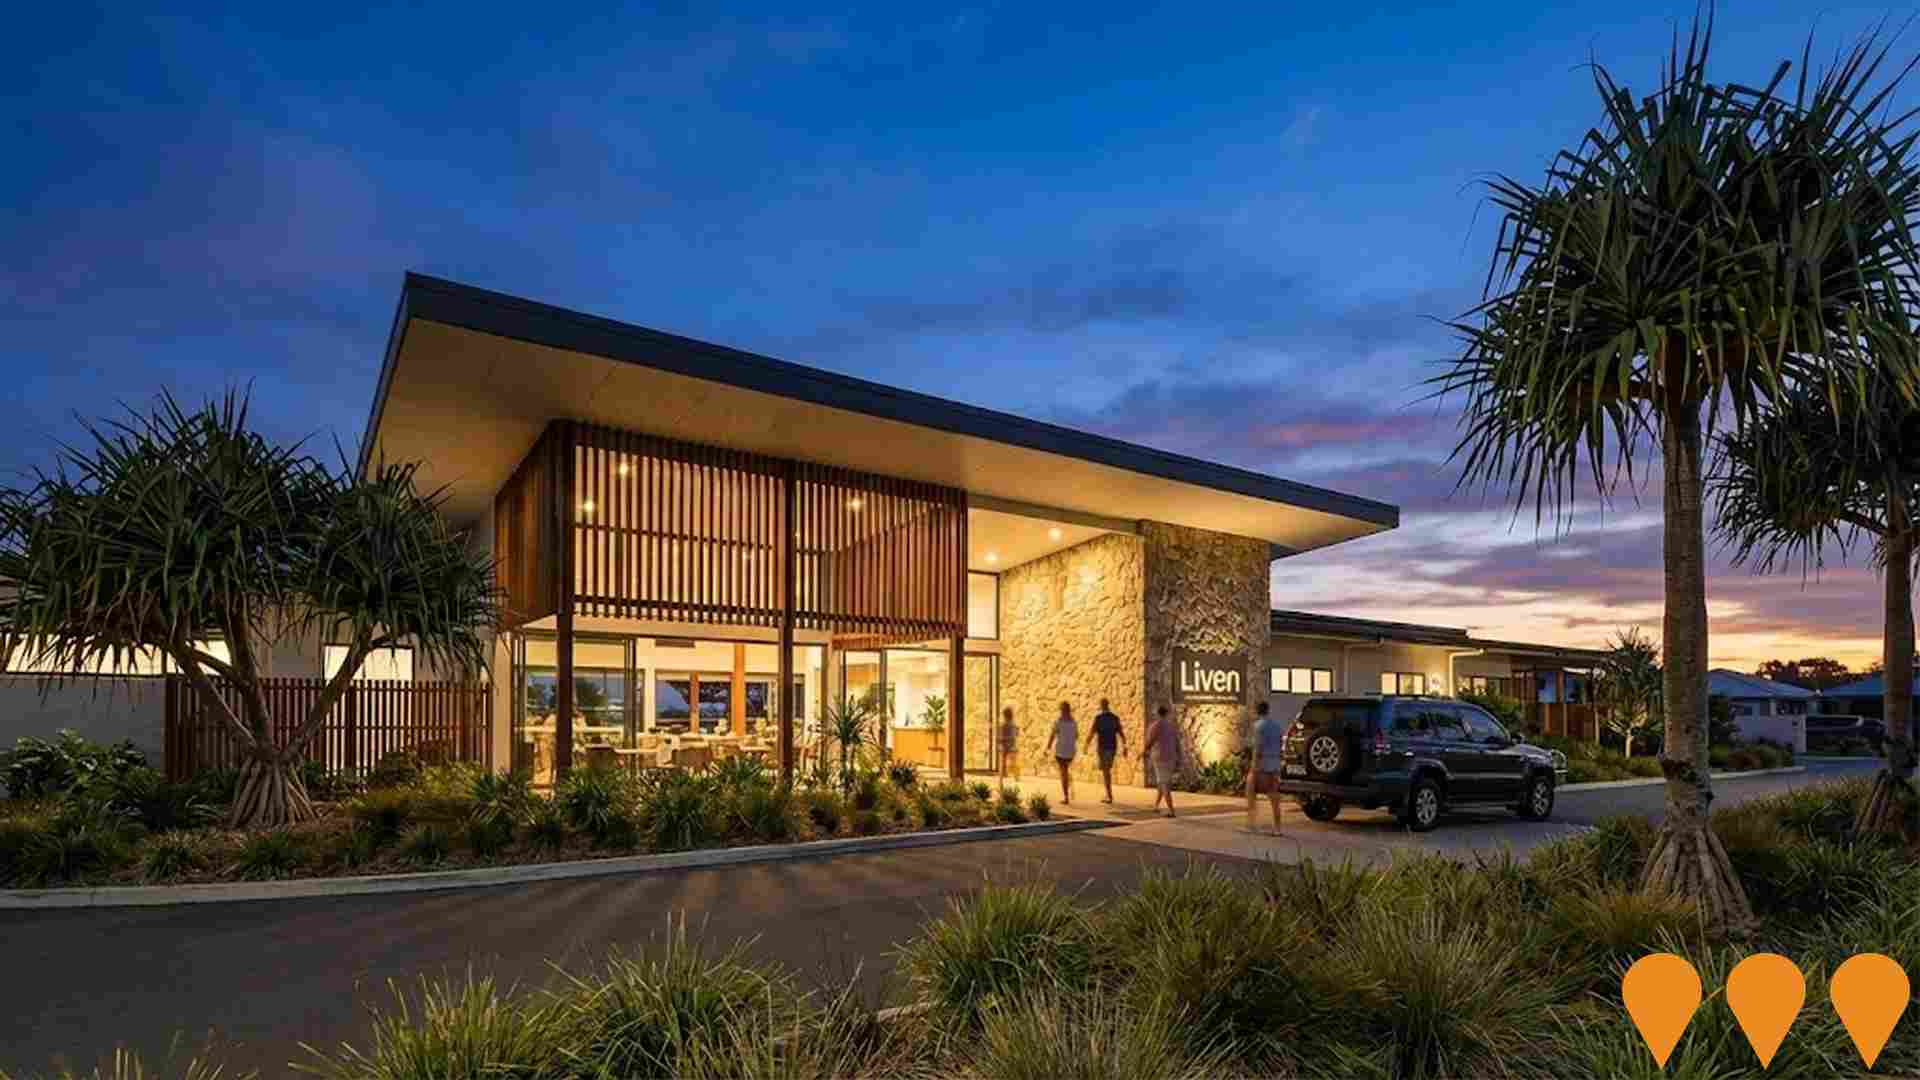
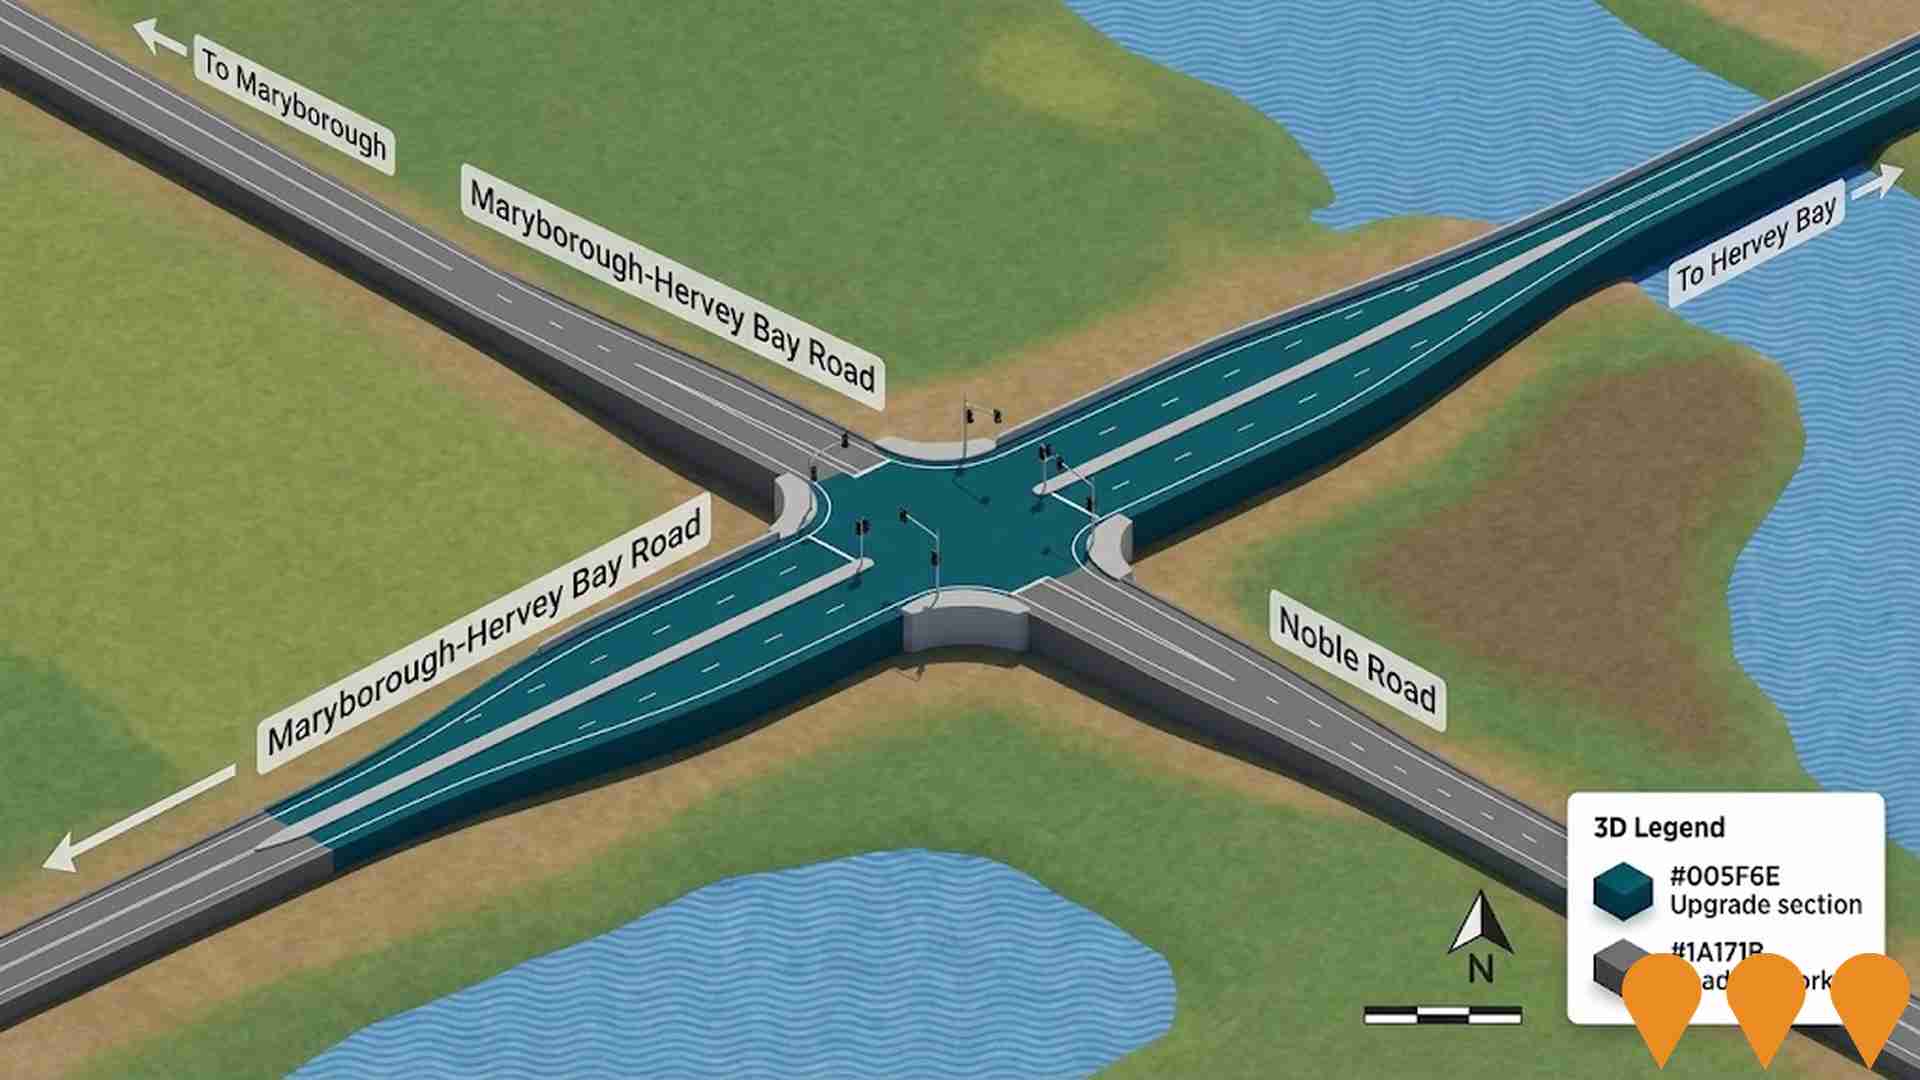
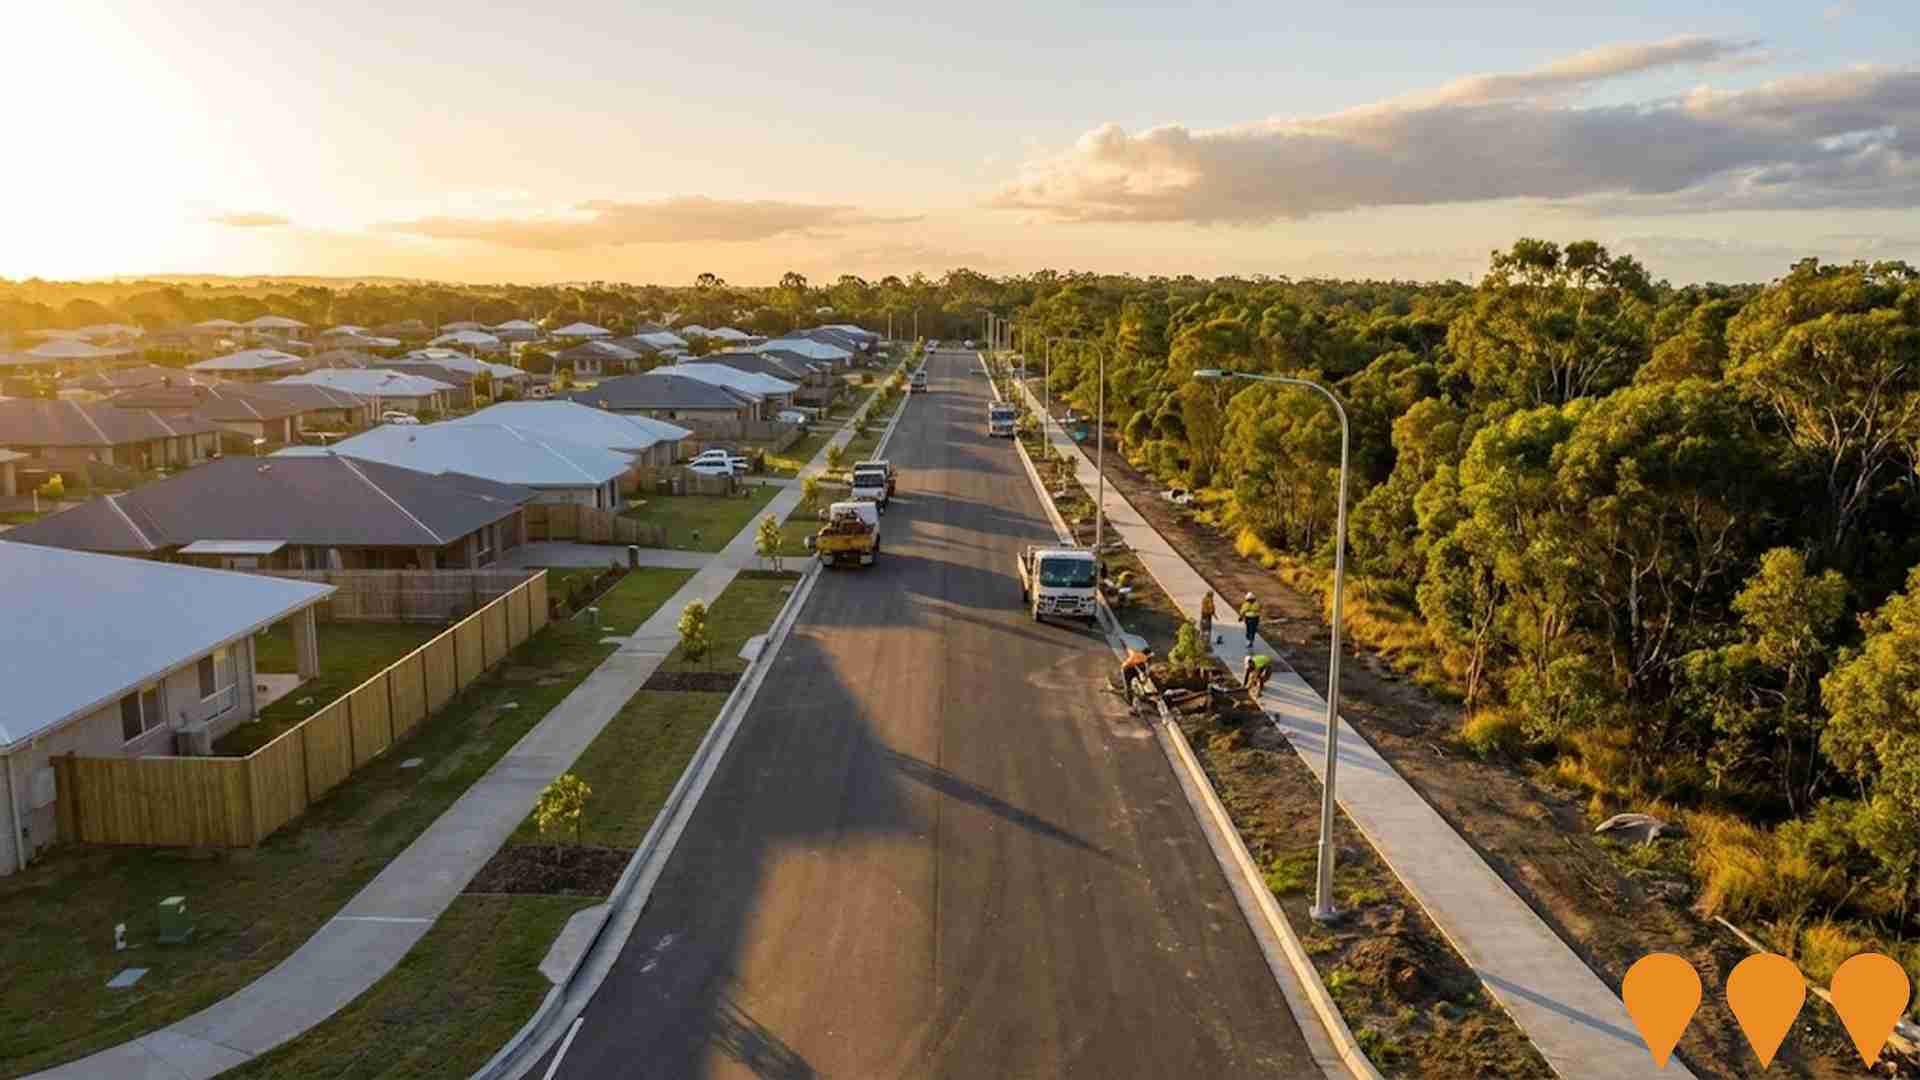
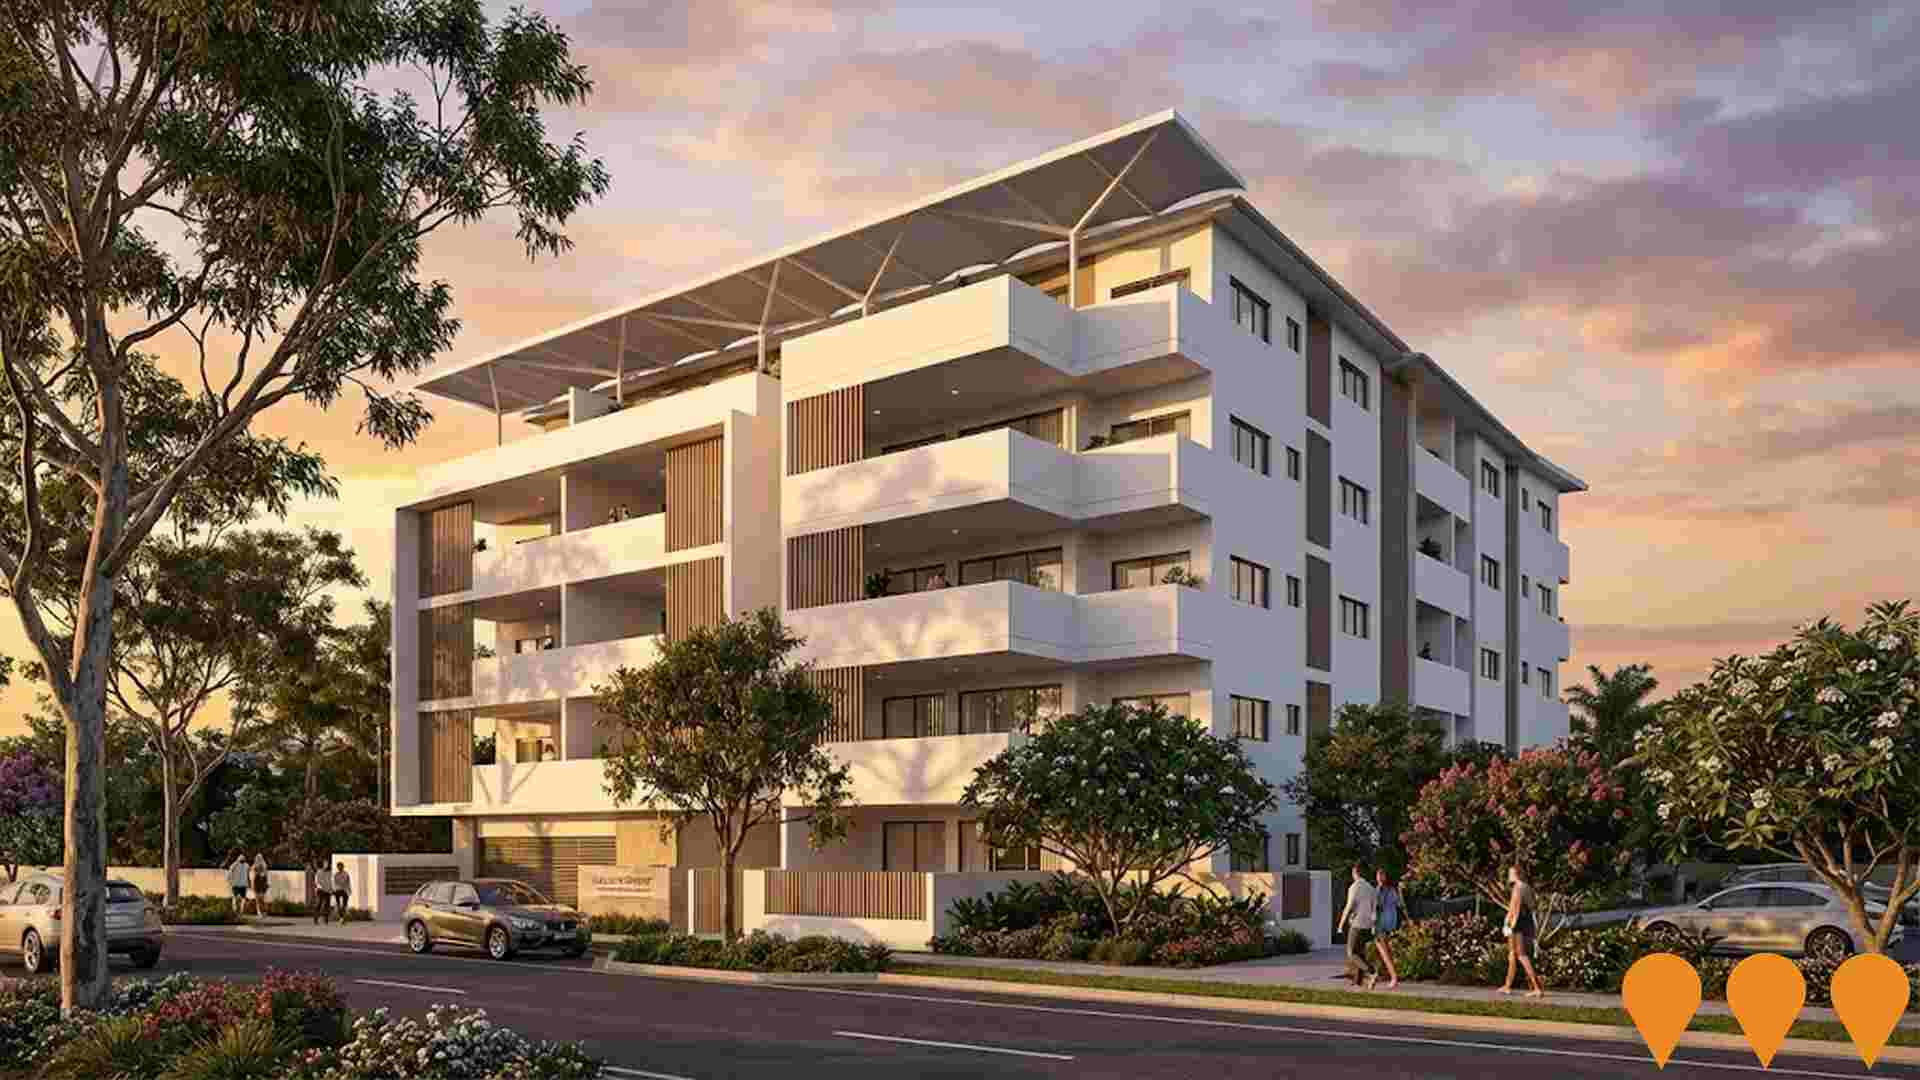
 Denotes AI-based impression for illustrative purposes only, not to be taken as definitive under any circumstances. Please follow links and conduct other investigations from the project's source for actual imagery. Developers and project owners wishing us to use original imagery please Contact Us and we will do so.
Frequently Asked Questions - Infrastructure
Queensland Train Manufacturing Program
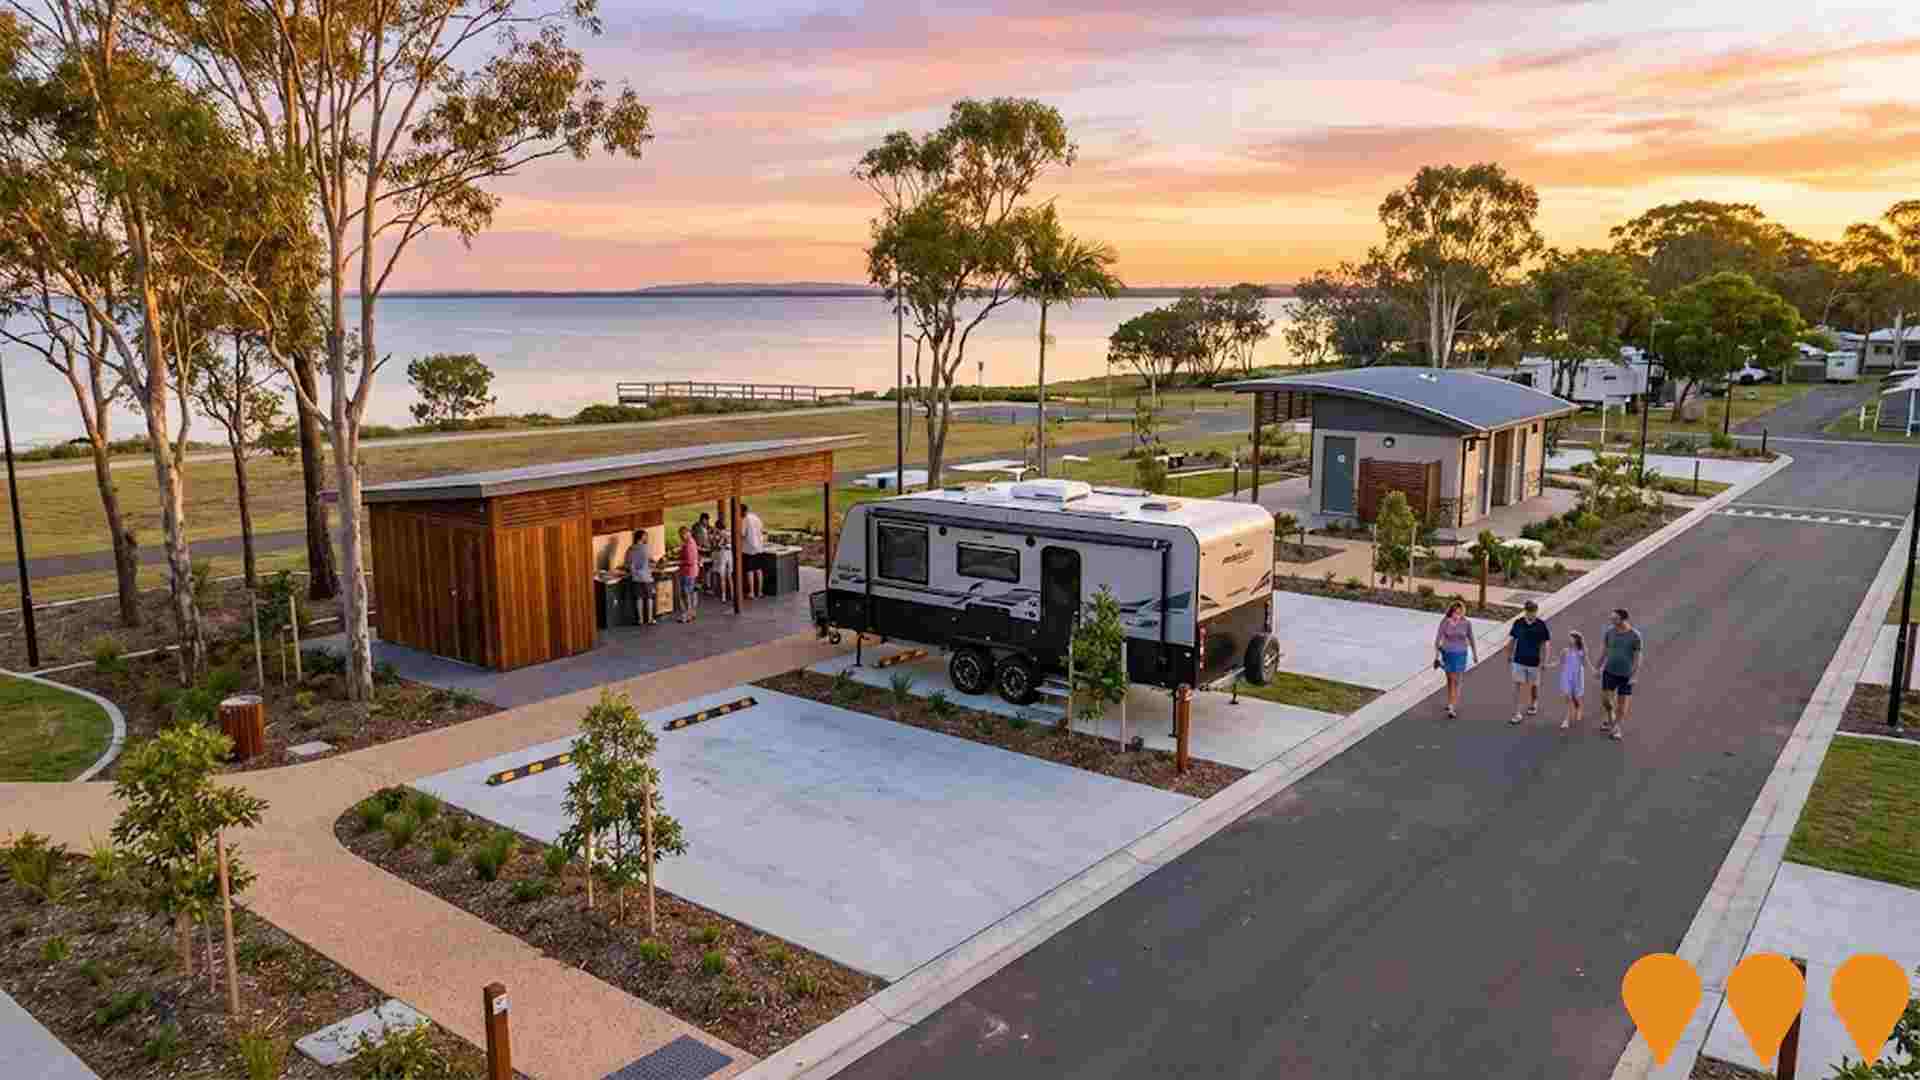
The Queensland Train Manufacturing Program is delivering 65 new six-car passenger trains at a new purpose-built manufacturing facility in Torbanlea (Fraser Coast) with an additional maintenance and stabling facility at Ormeau (Gold Coast). Construction of the Torbanlea facility is well advanced in 2025 with major structural works and roofing complete, internal fit-out progressing and utilities connections underway. The first train is scheduled for completion and testing in late 2026, entering service in 2027. All 65 trains will be in service by 2032 to support Cross River Rail and the Brisbane 2032 Olympic and Paralympic Games. The program is currently supporting around 800 jobs in construction and manufacturing.
Hervey Bay Community Hub
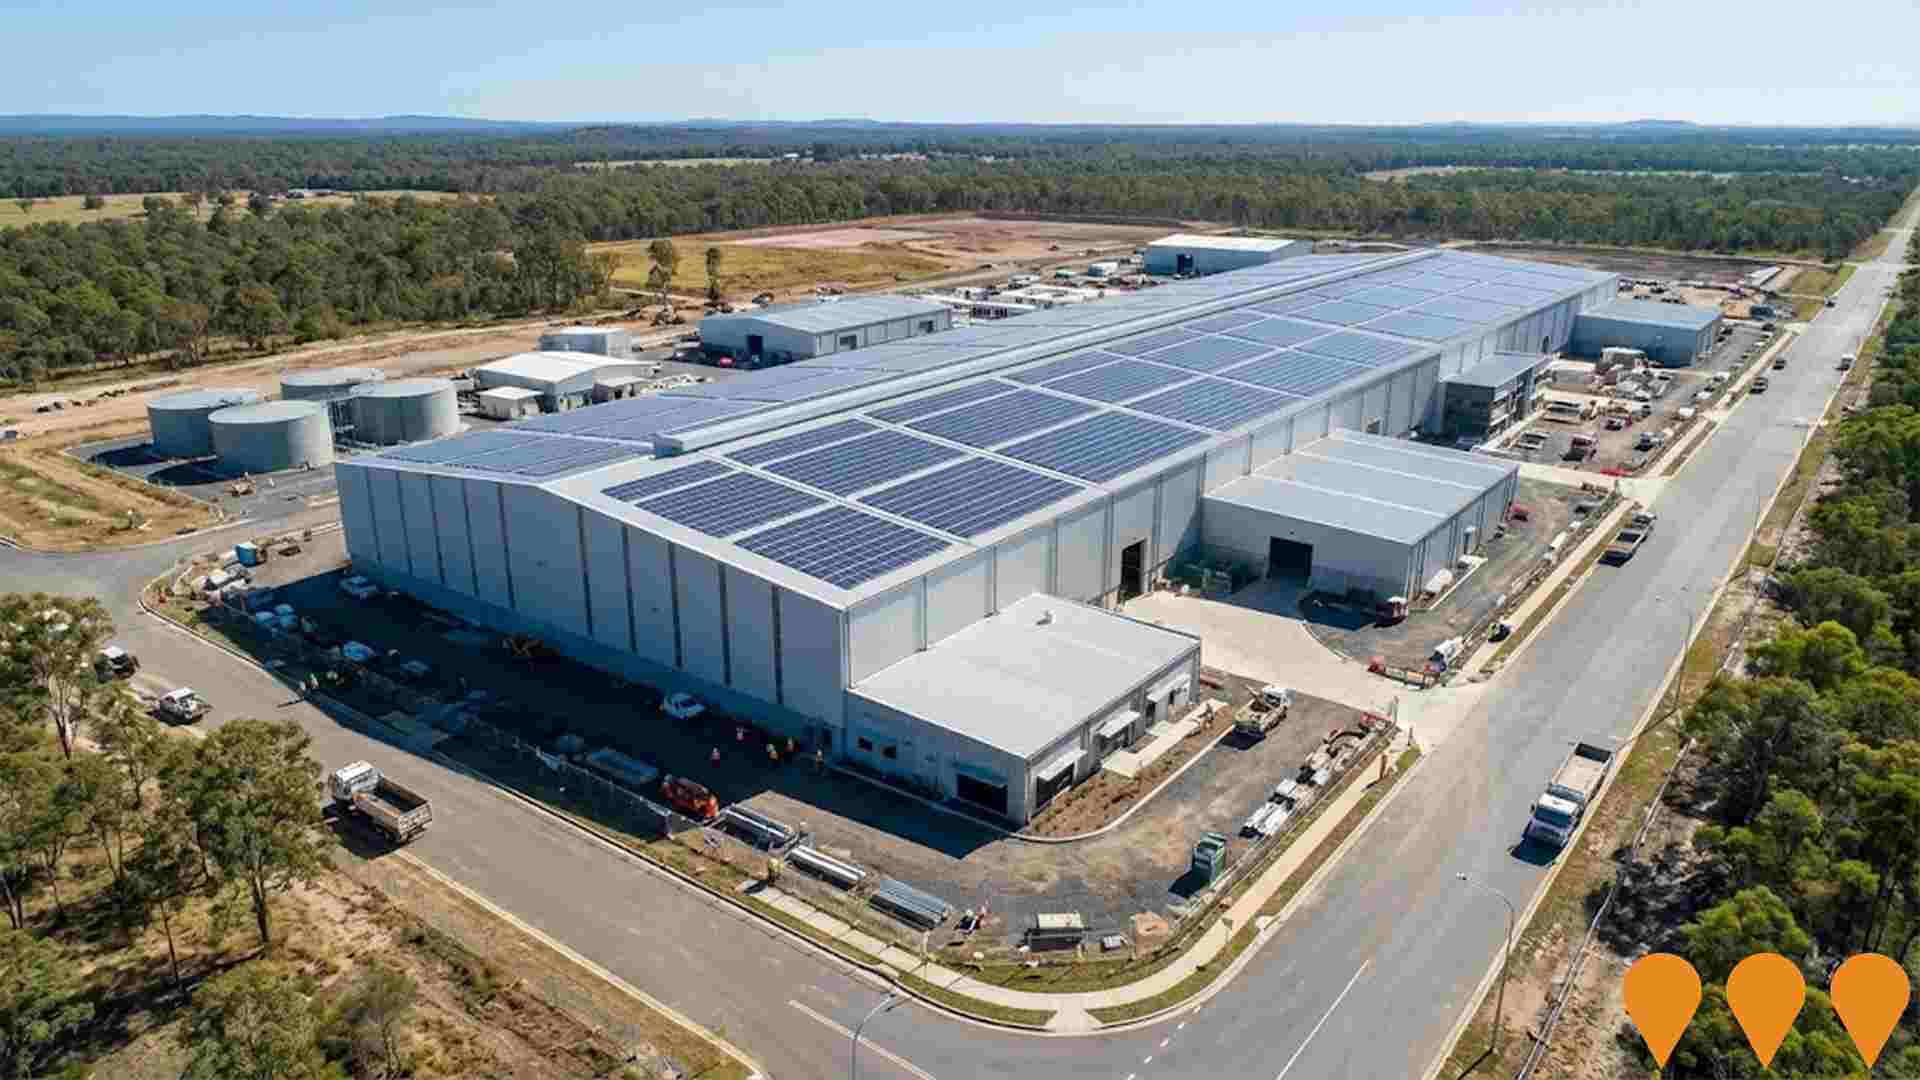
A $108.7 million regional community hub delivering a new two-level library (3,650sqm), Council Administration Centre, Disaster Resilience Centre, flexible community meeting spaces, public plaza, pedestrian links to adjacent parklands and approximately 100 underground car parks. Jointly funded by Fraser Coast Regional Council and Australian Government via the Hinkler Regional Deal. As of November 2025 the project is more than 70% complete with internal fit-out underway.
BayWest City Centre
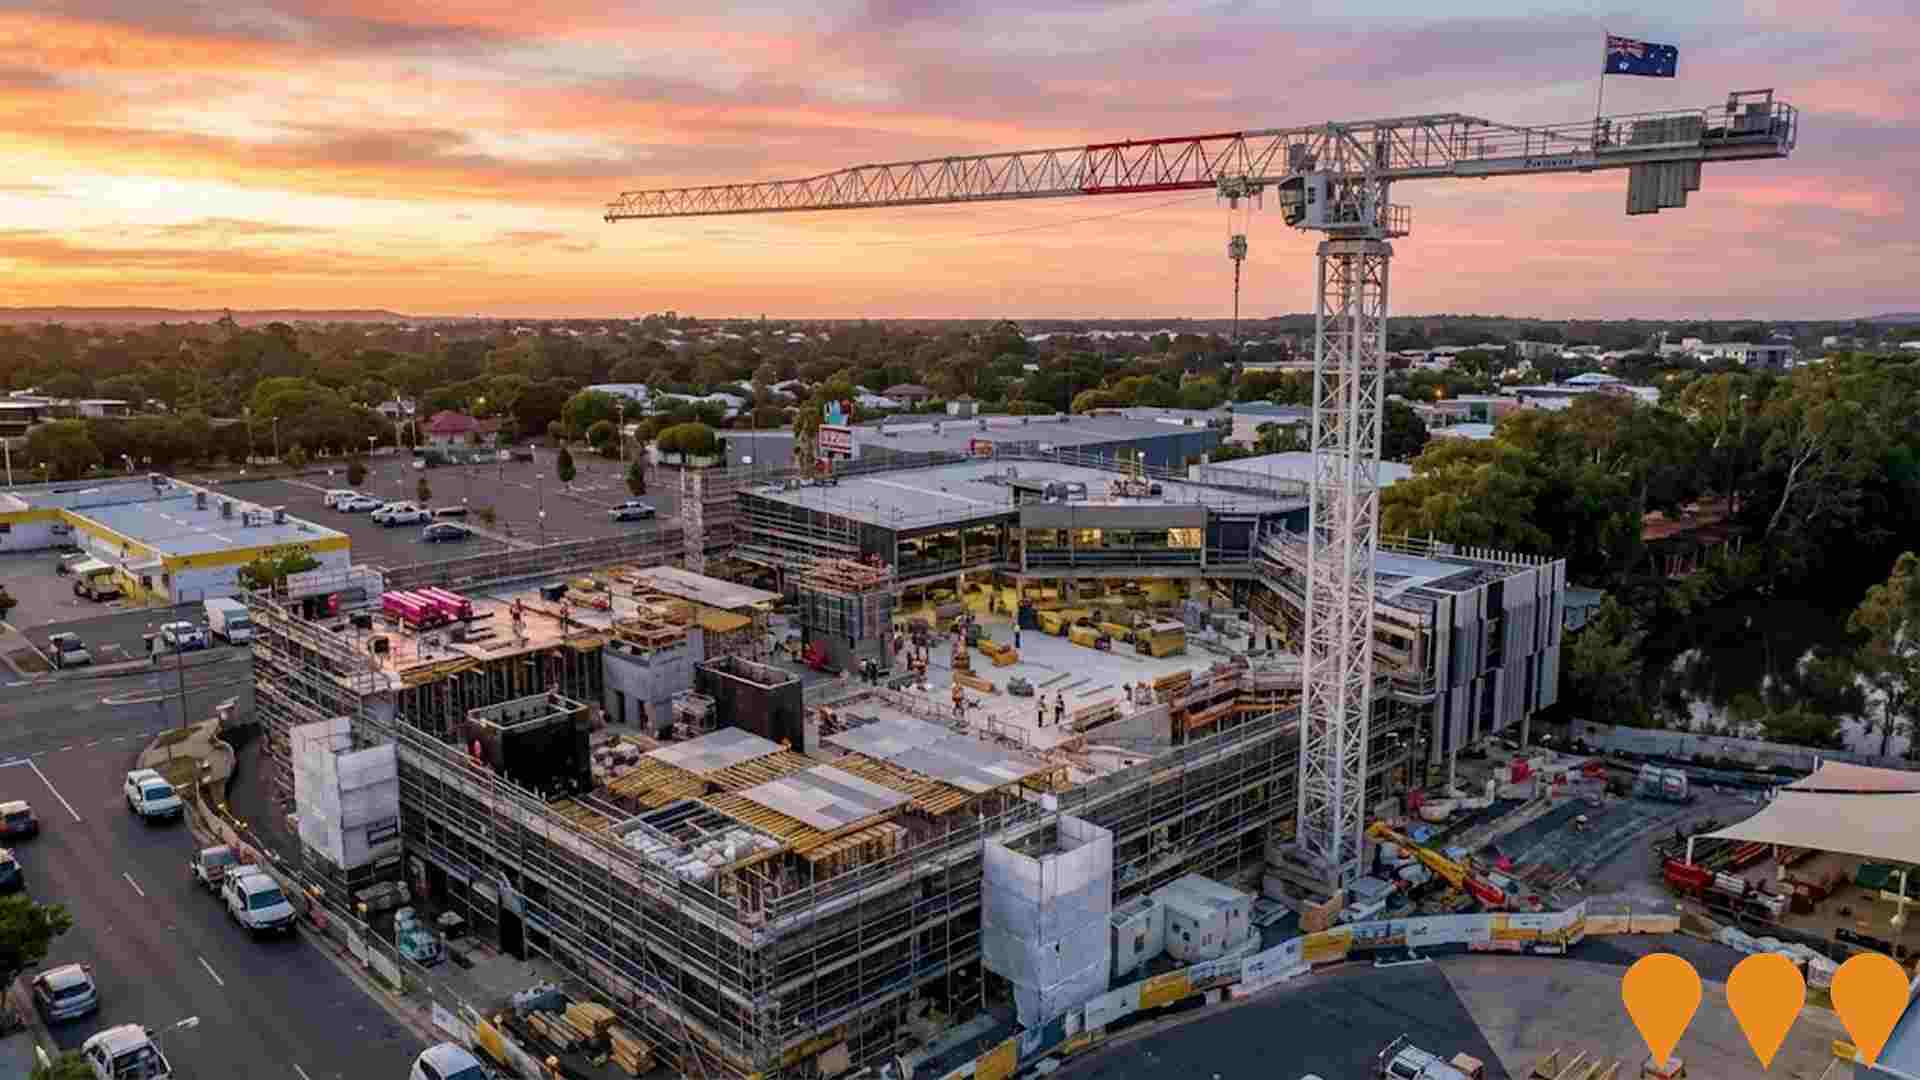
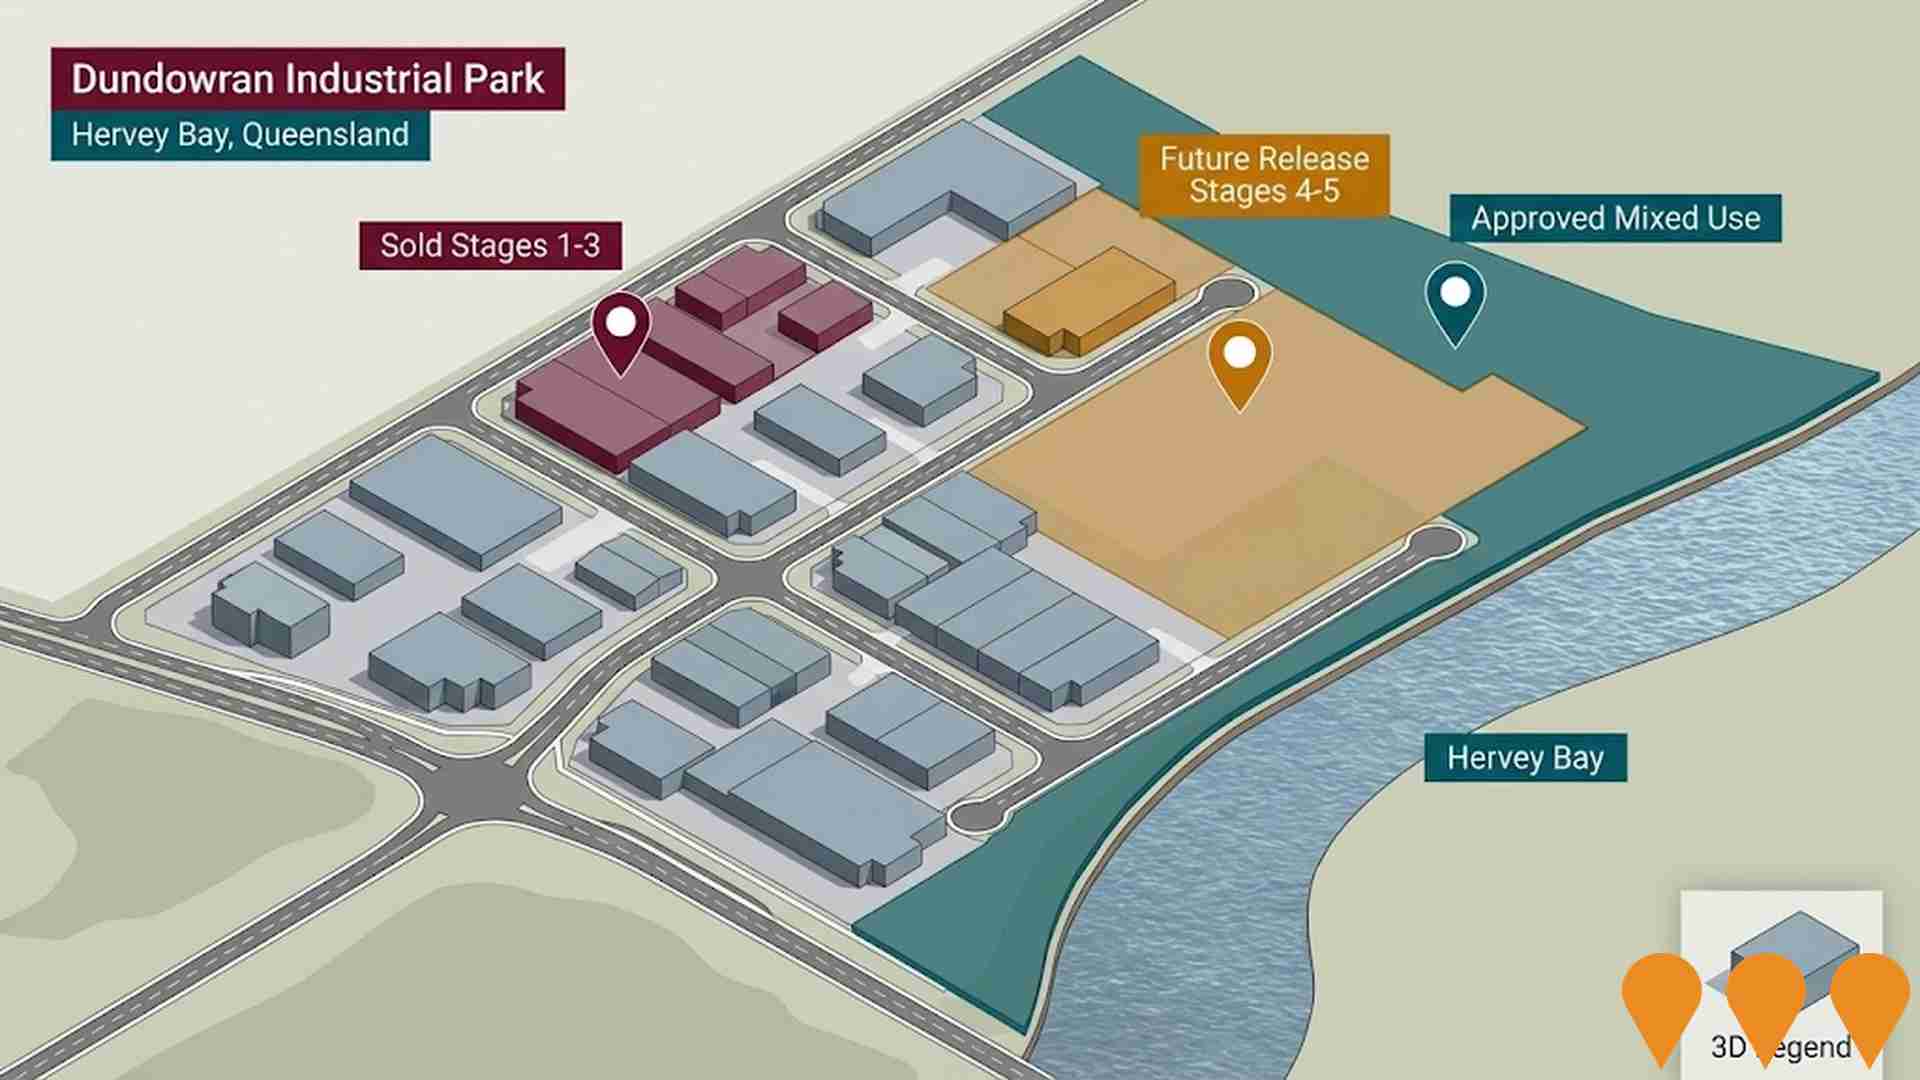
A retail development within Dundowran Industrial Park, including a supermarket, tavern, childcare centre, and Hervey Bay's third McDonald's, along with additional commercial outlets.
Radisson Hotel and SunLife Hervey Bay (The Jewel)
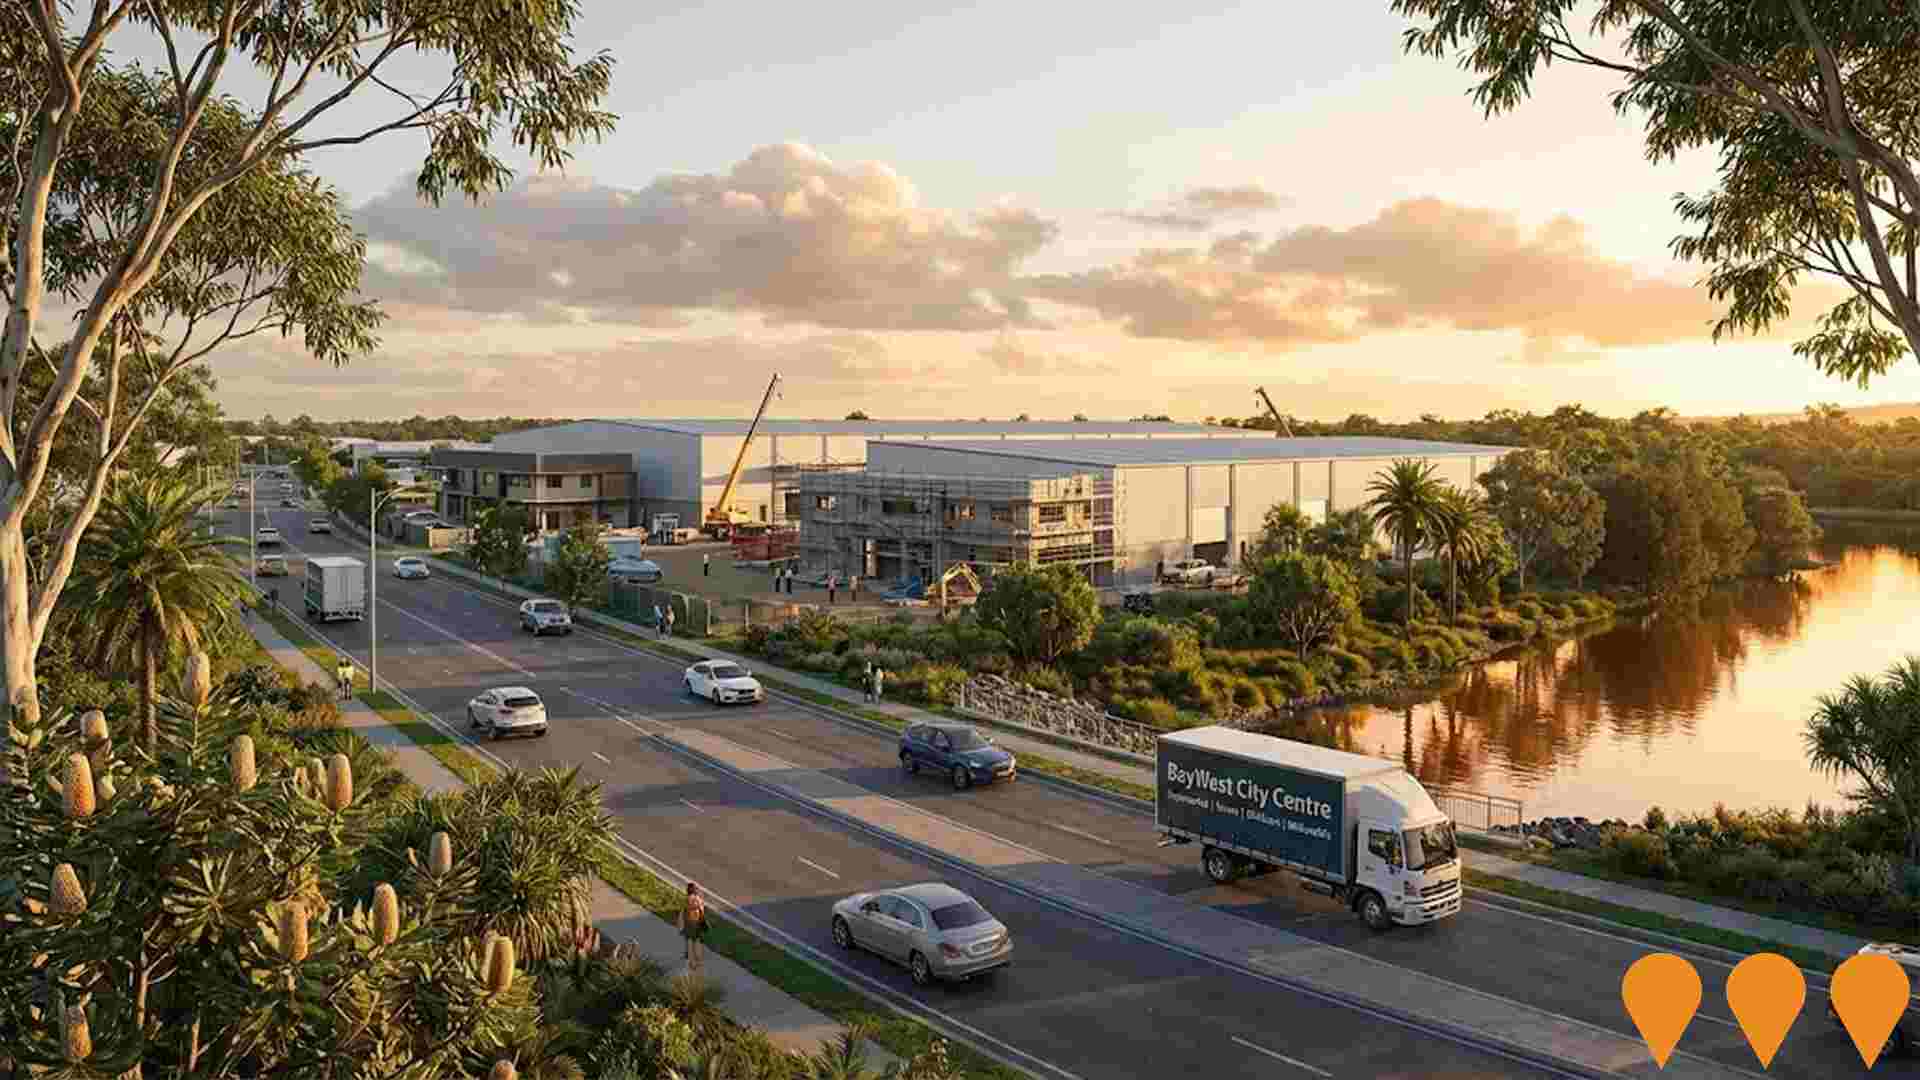
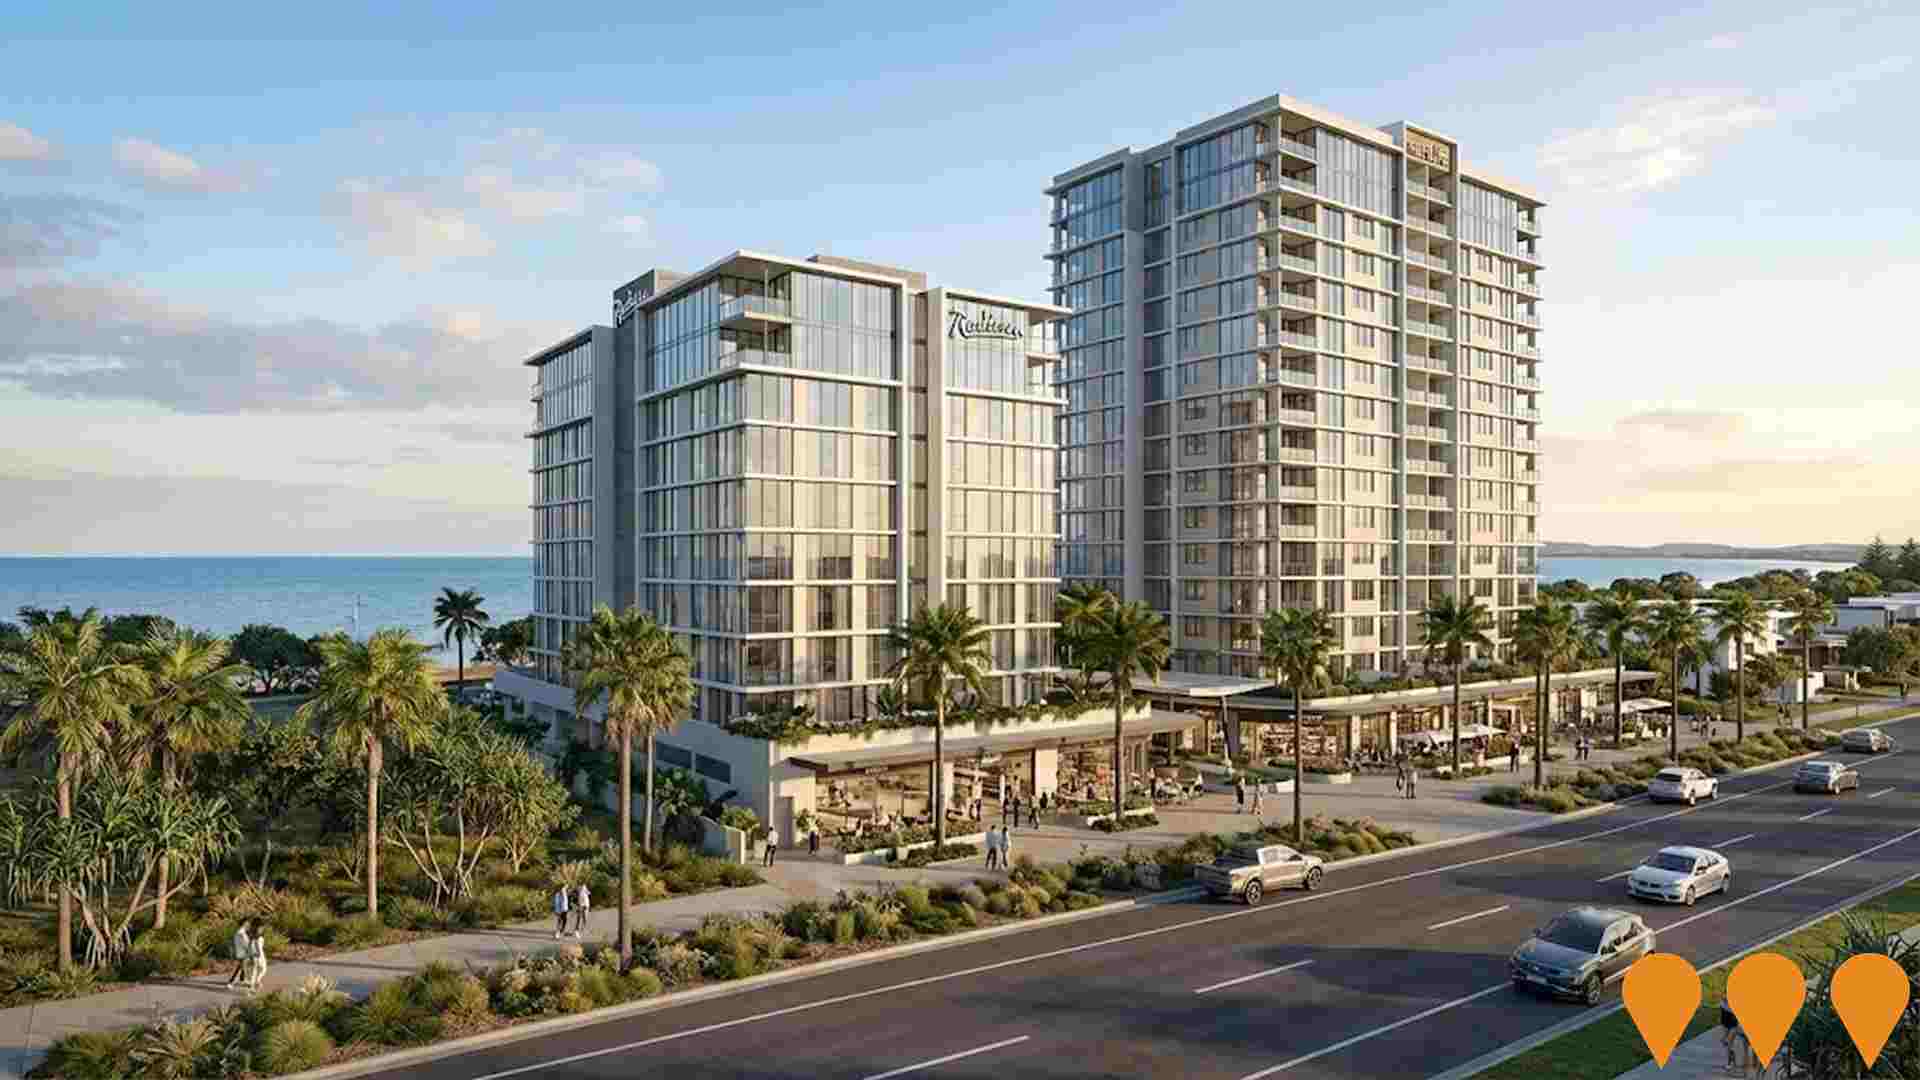
Mixed-use proposal in Hervey Bay City Centre comprising a 10-storey Radisson hotel (152 rooms) with wellness centre, conference facilities, restaurant and bar, alongside a 16-storey over-50s apartment tower branded SunLife with about 150 dwellings and a food and retail precinct. Council accepted a conditional $5m tender for the site and the project is progressing through the development application phase.
Torbanlea Pialba Road Upgrade
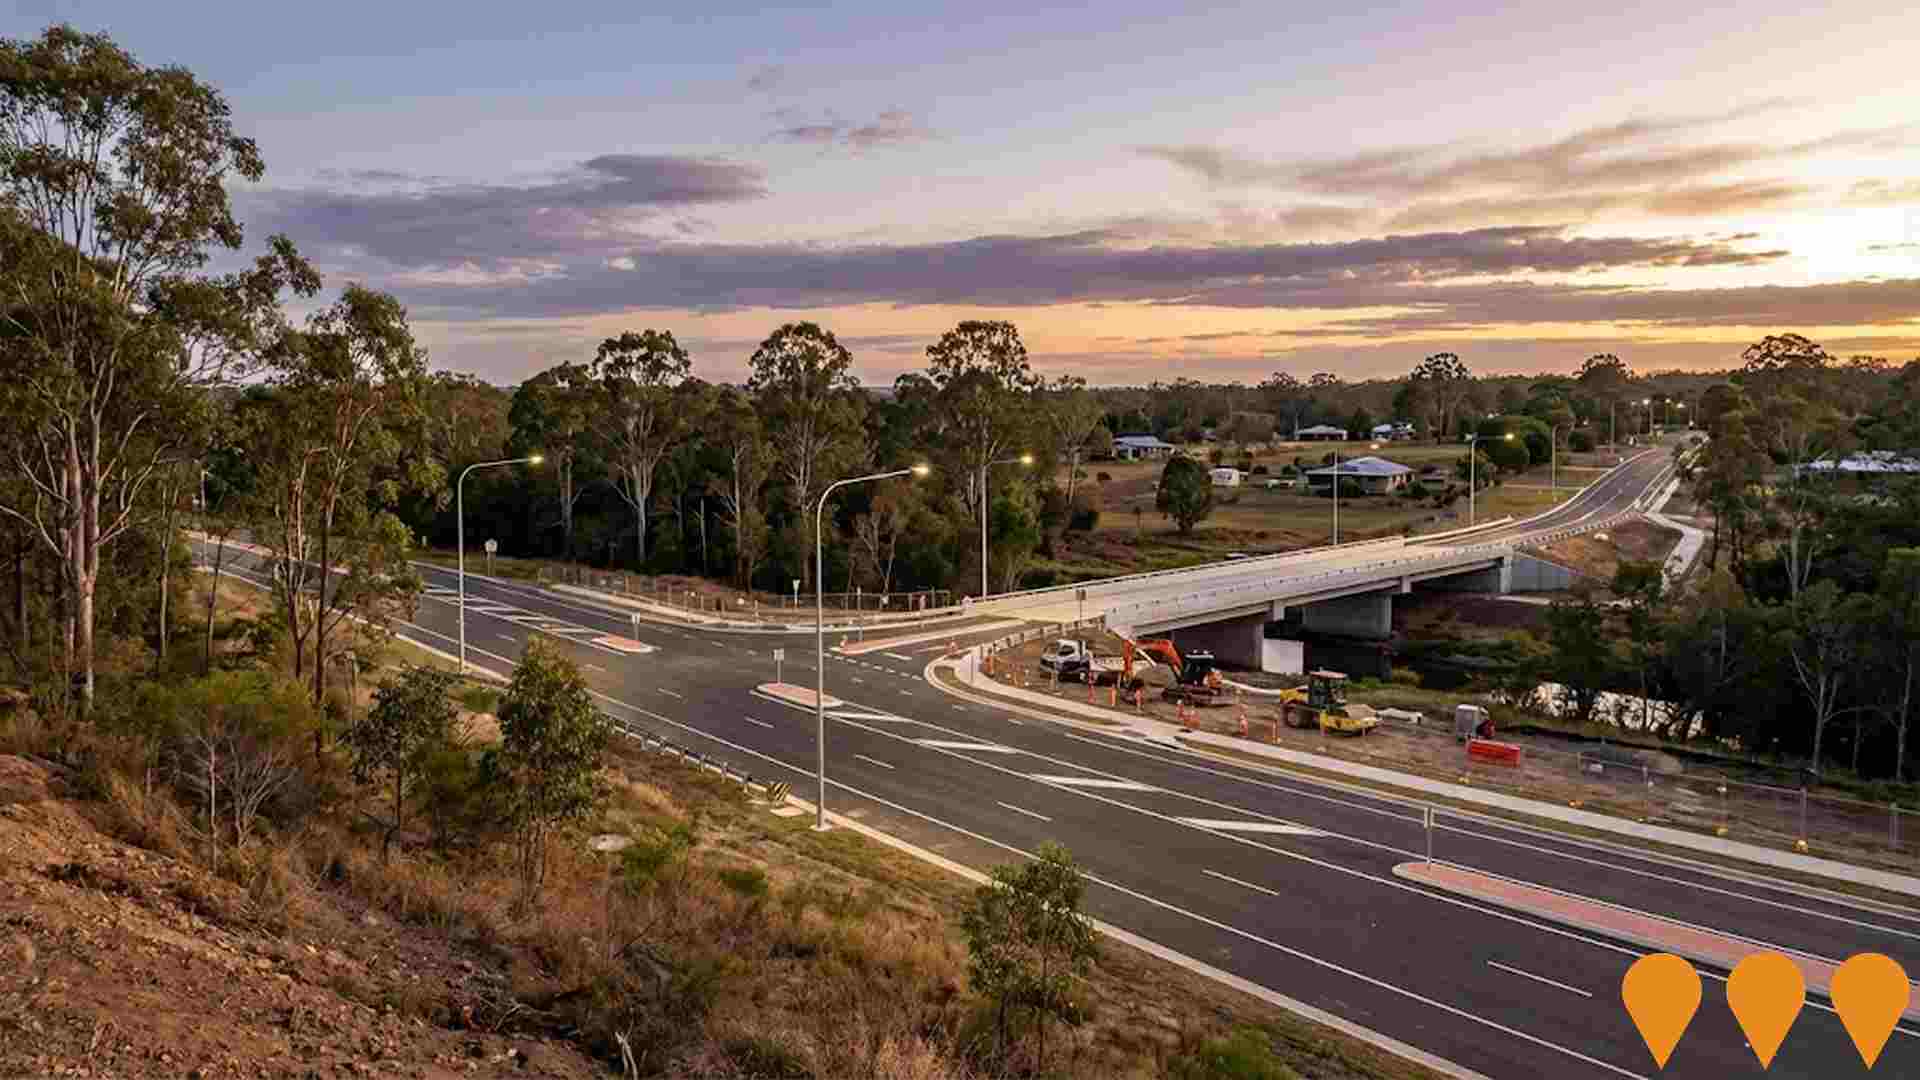
Upgraded approximately 6.3 km of Torbanlea-Pialba Road with widening and realignment, pavement and drainage works, lighting, local road and property access upgrades, five intersection upgrades, and a new four-span bridge over Beelbi Creek to improve flood immunity, safety, and regional connectivity.
SPG Hervey Bay Retail Centre
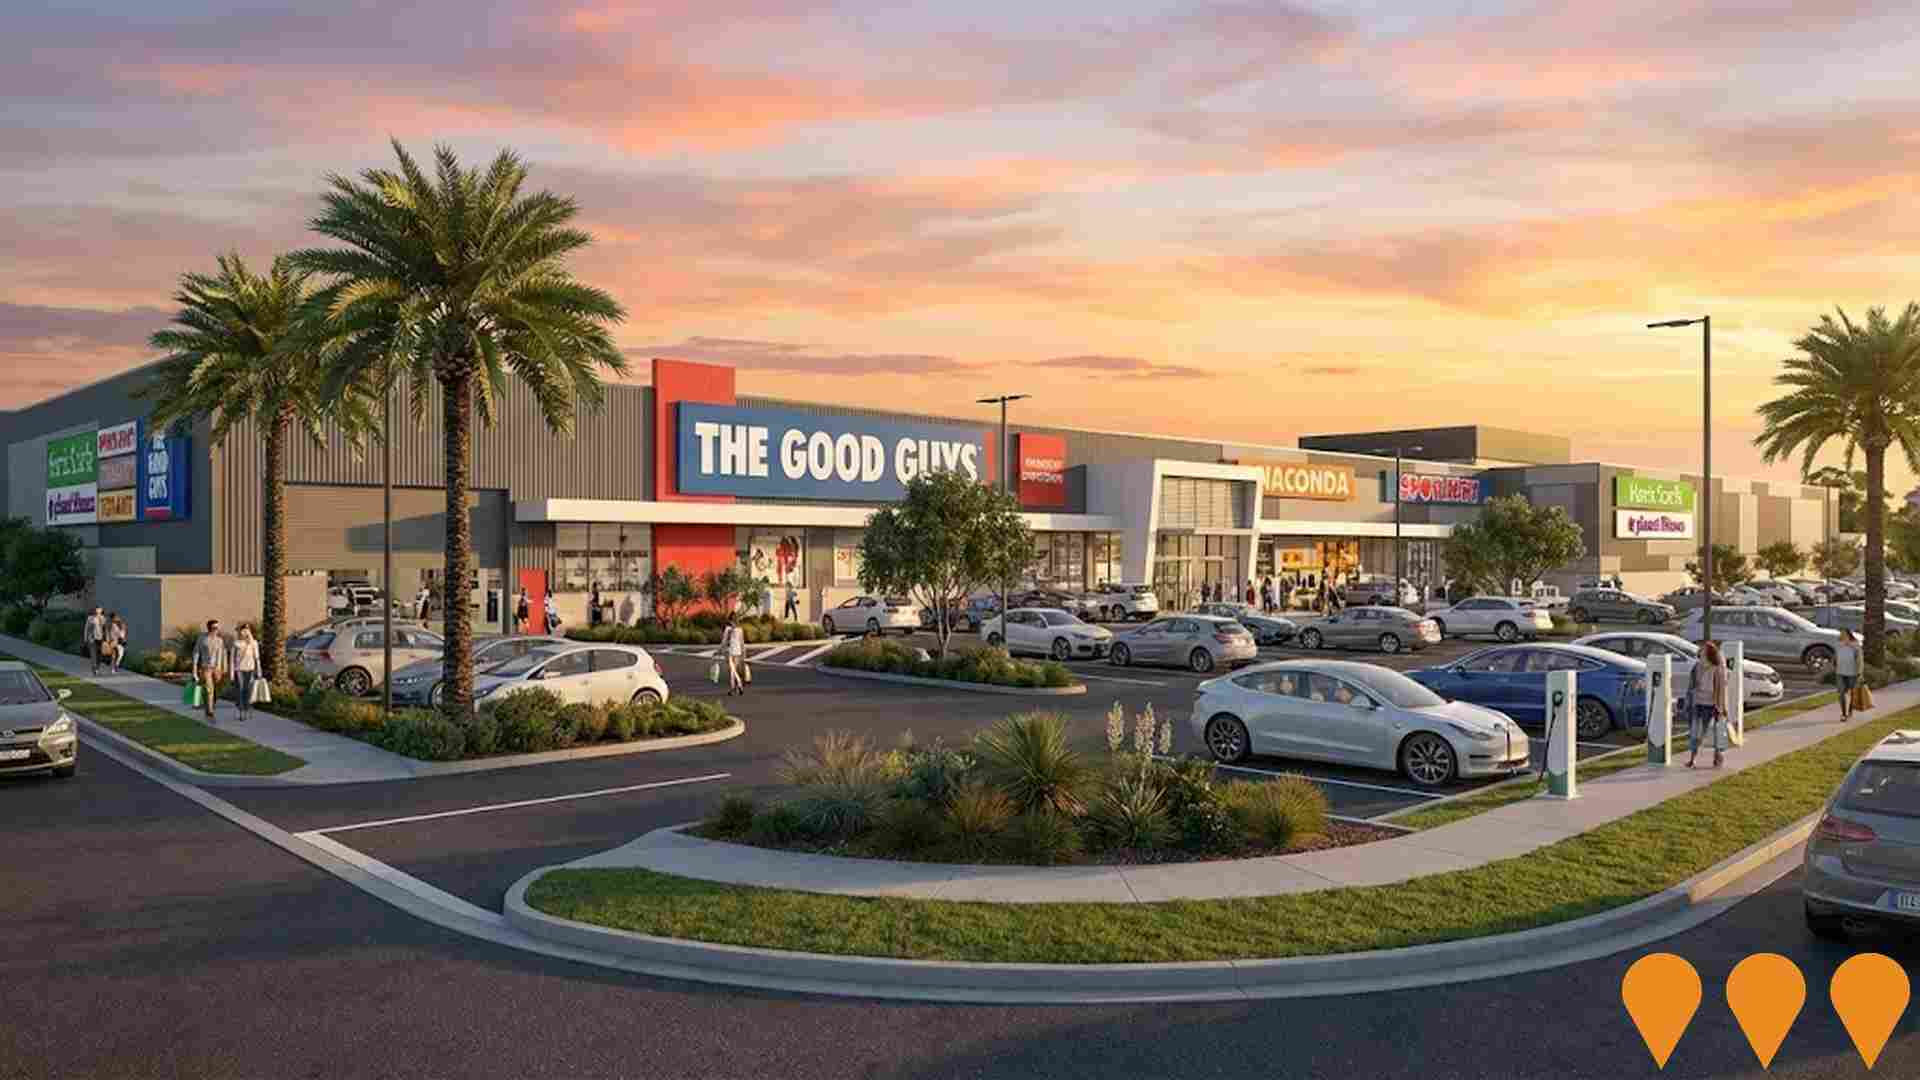
SPG Hervey Bay Retail Centre is a completed large-format retail development by Spotlight Property Group at 200 Boat Harbour Drive, Pialba. The 22,000sqm centre on a 3-hectare site features anchor tenants Spotlight, Anaconda, Harris Scarfe, and The Good Guys, plus retailers including Planet Fitness, Cafe 63, Early Settler, Eureka Furniture, Skechers, The Brave Hen, Hervey Bay Surf Outlet, Country Care Group, and Wholelife Pharmacy & Health Group. It includes a separate two-level Health & Services Hub with medical facilities, 445 car parking spaces (360 undercover), dining options, and EV charging stations.
Maryborough - Hervey Bay Road and Pialba - Burrum Heads Road Intersection Upgrade
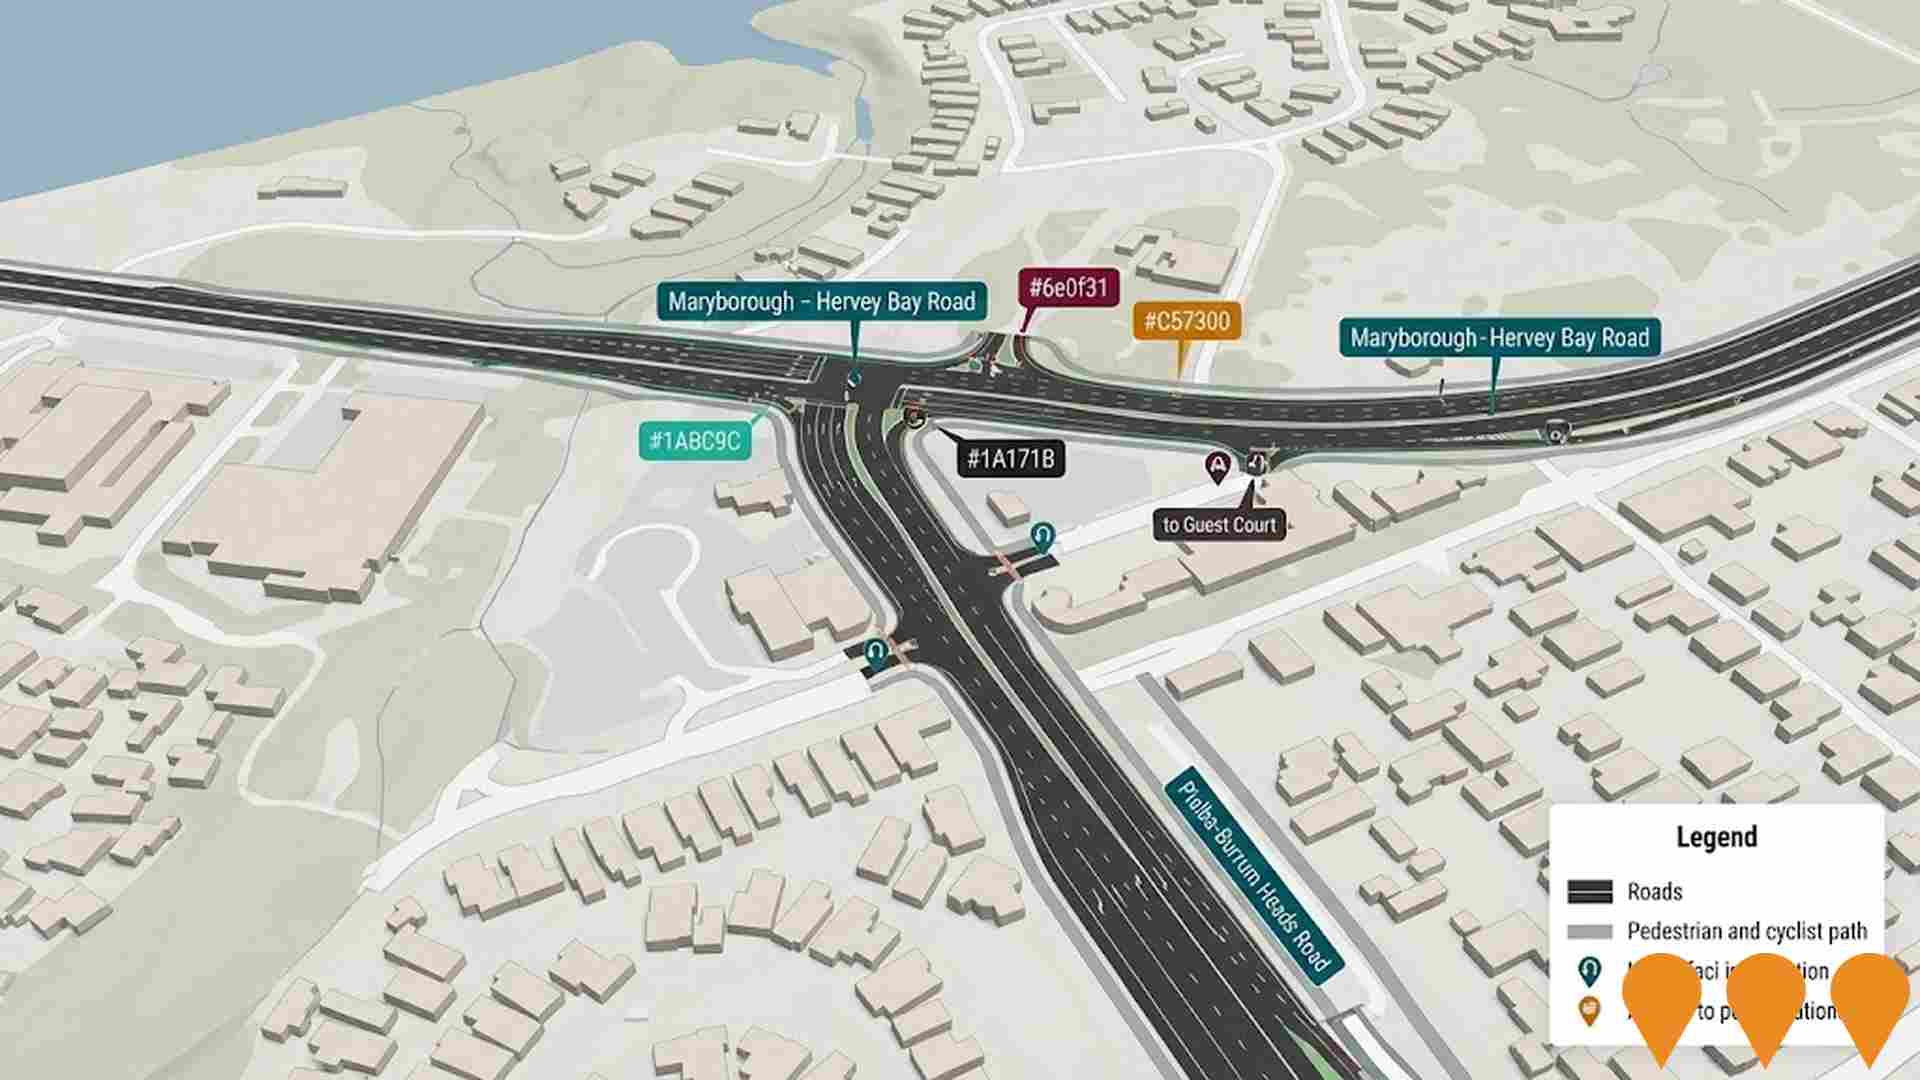
Stage 1 construction works commenced in August 2024 for this major intersection upgrade in Eli Waters. The project will signalise the intersection, duplicate Maryborough-Hervey Bay Road (southern approach) and Pialba-Burrum Heads Road (western section) from 2 to 4 lanes, and improve pedestrian and cyclist facilities to enhance safety and traffic flow in the growing Hervey Bay area.
Dundowran Industrial Park
Dundowran Industrial Park offers premium serviced industrial land for sale, turnkey design/construct packages, and leasing opportunities in Hervey Bay, Queensland. It is zoned for medium impact industry with excellent access for large vehicles. Stages 1-3 are sold out, Stage 4 is scheduled for 2025, and Stage 5 is a future release.
Employment
Burrum - Fraser has seen below average employment performance when compared to national benchmarks
Burrum-Fraser has a balanced workforce with both white and blue collar jobs. Key sectors include health care & social assistance, retail trade, and construction.
As of September 2025, 4,549 residents are employed, with an unemployment rate of 5.2%. This is 1.1% higher than the Rest of Qld's rate of 4.1%. Workforce participation in Burrum-Fraser is lower at 39.2%, compared to 59.1% in the rest of Queensland. The area shows strong specialization in health care & social assistance, with an employment share 1.2 times the regional level.
However, education & training has a limited presence, with 7.3% employment compared to the regional rate of 9.1%. Employment opportunities locally may be limited, as indicated by the Census working population vs resident population count. Over the past year, employment increased by 10.1%, while labour force also grew by 10.1%. Unemployment remained essentially unchanged. In contrast, Rest of Qld saw employment grow by 1.7% and unemployment rise by 0.3 percentage points. State-level data to 25-Nov-25 shows Queensland's employment contracted by 0.01%, with an unemployment rate of 4.2%. National employment forecasts from May-25 project a 6.6% increase over five years and 13.7% over ten years. Applying these projections to Burrum-Fraser's employment mix suggests local employment should increase by 6.5% over five years and 13.7% over ten years, assuming constant population projections.
Frequently Asked Questions - Employment
Income
Income metrics place the area in the bottom 10% of locations nationally according to AreaSearch analysis
AreaSearch's latest postcode level ATO data for financial year 2022 shows Burrum - Fraser SA2 had a median taxpayer income of $39,577 and an average of $49,312. This is below the national average. Rest of Qld had a median of $50,780 and average of $64,844. Based on Wage Price Index growth of 13.99% since financial year 2022, estimated incomes as of September 2025 would be approximately $45,114 (median) and $56,211 (average). Census data reveals household, family and personal incomes in Burrum - Fraser fall between the 2nd and 2nd percentiles nationally. Income brackets indicate 31.5% of the population falls within the $400-$799 range, differing from metropolitan regions where the $1,500-$2,999 category is predominant at 31.7%. The concentration of 40.2% in sub-$800 weekly brackets highlights economic challenges faced by a significant portion of the community. After housing costs, 85.9% of income remains, ranking at only the 5th percentile nationally.
Frequently Asked Questions - Income
Housing
Burrum - Fraser is characterized by a predominantly suburban housing profile, with above-average rates of outright home ownership
In Burrum-Fraser, as per the latest Census evaluation, 94.6% of dwellings were houses with the remaining 5.4% comprising semi-detached homes, apartments, and other types. This contrasts with Non-Metro Qld's figures of 91.8% houses and 8.2% other dwellings. Home ownership in Burrum-Fraser stood at 54.2%, with mortgaged properties at 27.6% and rented ones at 18.2%. The median monthly mortgage repayment was $1,300, exceeding Non-Metro Qld's average of $1,179. The median weekly rent in Burrum-Fraser was $300, compared to Non-Metro Qld's $260. Nationally, Burrum-Fraser's mortgage repayments were lower at $1,300 versus Australia's average of $1,863, and rents were substantially lower at $300 compared to the national figure of $375.
Frequently Asked Questions - Housing
Household Composition
Burrum - Fraser has a typical household mix, with a fairly typical median household size
Family households account for 70.4% of all households, including 18.3% couples with children, 41.8% couples without children, and 9.2% single parent families. Non-family households constitute the remaining 29.6%, with lone person households at 25.8% and group households comprising 3.8%. The median household size is 2.3 people, which aligns with the average for the Rest of Qld.
Frequently Asked Questions - Households
Local Schools & Education
Burrum - Fraser faces educational challenges, with performance metrics placing it in the bottom quartile of areas assessed nationally
The area's university qualification rate is 10.9%, significantly lower than the Australian average of 30.4%. This disparity presents both a challenge and an opportunity for targeted educational initiatives. Bachelor degrees are most common at 7.8%, followed by graduate diplomas (1.6%) and postgraduate qualifications (1.5%). Trade and technical skills are prevalent, with 43.7% of residents aged 15+ holding vocational credentials - advanced diplomas (9.7%) and certificates (34.0%).
A total of 22.4% of the population is actively engaged in formal education, including 8.7% in primary education, 7.7% in secondary education, and 1.5% pursuing tertiary education.
Frequently Asked Questions - Education
Schools Detail
Nearby Services & Amenities
Transport
Transport servicing is very low compared to other areas nationally based on assessment of service frequency, route connectivity and accessibility
Transport analysis indicates 44 active transport stops within Burrum - Fraser region, all of which are bus stops. These stops are serviced by three individual routes, collectively providing 97 weekly passenger trips. Transport accessibility is rated as limited, with residents typically located 3609 meters from the nearest transport stop.
Service frequency averages 13 trips per day across all routes, equating to approximately two weekly trips per individual stop.
Frequently Asked Questions - Transport
Transport Stops Detail
Health
Health performance in Burrum - Fraser is a key challenge with a range of health conditions having marked impacts on both younger and older age cohorts
Burrum-Fraser faces significant health challenges, with various conditions affecting both younger and older residents. Private health cover is low, at approximately 46% (~5,475 people), compared to the national average of 55.3%.
The most prevalent medical conditions are arthritis (14.6%) and mental health issues (9.5%). Conversely, 54.3% report no medical ailments, similar to Rest of Qld's 54.0%. The area has a higher proportion of seniors aged 65 and over at 34.4% (~4,084 people), compared to Rest of Qld's 29.9%. Despite this, health outcomes among seniors are generally good, performing better than the general population in various metrics.
Frequently Asked Questions - Health
Cultural Diversity
Burrum - Fraser is considerably less culturally diverse than average when assessed alongside AreaSearch's national rankings for language and cultural background related metrics
Burrum-Fraser, surveyed in 2016, had a culturally diverse population with 85.1% born in Australia, 90.1% being citizens, and 97.2% speaking English only at home. Christianity was the predominant religion, accounting for 52.8%, similar to Rest of Qld (52.8%). The top three ancestry groups were English (34.3%), Australian (30.0%), and Scottish (8.2%).
Notable differences existed in German representation (Burrum-Fraser: 5.5% vs regional: 6.6%), Australian Aboriginal (Burrum-Fraser: 3.5% vs regional: 3.4%), and New Zealand (Burrum-Fraser: 0.7% vs regional: 0.5%).
Frequently Asked Questions - Diversity
Age
Burrum - Fraser ranks among the oldest 10% of areas nationwide
The median age in Burrum-Fraser is 55, which is significantly higher than the Rest of Qld figure of 41 and substantially exceeds the national norm of 38. Compared to Rest of Qld, Burrum-Fraser has a higher concentration of residents aged 65-74 (21.0%) but fewer individuals aged 25-34 (7.1%). This 65-74 concentration is well above the national figure of 9.4%. Between the 2021 Census and present, the 75 to 84 age group has increased from 9.2% to 10.9% of the population. Conversely, the 5 to 14 cohort has declined from 10.4% to 9.0%. Looking ahead to 2041, demographic projections indicate significant shifts in Burrum-Fraser's age structure. The 75 to 84 group is projected to grow by 27%, reaching 1,648 people from the current 1,296. The aging population trend is clear, with those aged 65 and above comprising 70% of projected growth. Conversely, both the 45 to 54 and 5 to 14 age groups are expected to see reduced numbers.

