Chart Color Schemes
est. as @ -- *
ABS ERP | -- people | --
2021 Census | -- people
Sales Activity
Curious about local property values? Filter the chart to assess the volume and appreciation (including resales) trends and regional comparisons, or scroll to the map below view this information at an individual property level.
Find a Recent Sale
Sales Detail
Population
Tiwi Islands is positioned among the lower quartile of areas assessed nationally for population growth based on AreaSearch's assessment of recent, and medium term trends
Tiwi Islands' population was approximately 2,744 as of August 2025. This figure represents an increase of 396 people (16.9%) since the 2021 Census, which reported a population of 2,348. The change is inferred from ABS's estimated resident population of 2,744 in June 2024 and the addition of 19 validated new addresses since the Census date. This results in a density ratio of 0.40 persons per square kilometer. Tiwi Islands' growth rate exceeded the national average (8.6%) and the state's, making it a regional growth leader. Overseas migration contributed approximately 52.9% to overall population gains during recent periods.
AreaSearch uses ABS/Geoscience Australia projections for each SA2 area, released in 2024 with a base year of 2022. For areas not covered by this data and post-2032 estimates, AreaSearch applies growth rates by age cohort from the ABS's latest Greater Capital Region projections (released in 2023, based on 2022 data). Future population trends project an above median growth for national regional areas. By 2041, Tiwi Islands is expected to increase by 453 persons, reflecting a total increase of 16.5% over the 17 years.
Frequently Asked Questions - Population
Development
The level of residential development activity in Tiwi Islands is very low in comparison to the average area assessed nationally by AreaSearch
The Tiwi Islands experience minimal development activity, averaging three approvals annually between 2016-2020. This resulted in nineteen dwellings being constructed over this five-year period. The low development levels reflect the rural nature of the area, where housing needs are typically driven by local demands rather than broader market forces.
It is important to note that due to the small number of approvals, individual projects can significantly impact annual growth and relativity statistics. Compared to the Rest of NT, Tiwi Islands has substantially lower development levels, with its development pattern also falling below national averages.
Between 2016-2041, Tiwi Islands is projected to grow by 453 residents. If current construction levels persist, housing supply may lag behind population growth, potentially intensifying buyer competition and driving price increases.
Frequently Asked Questions - Development
Infrastructure
Tiwi Islands has limited levels of nearby infrastructure activity, ranking in the 0thth percentile nationally
Five projects identified by AreaSearch are expected to impact the area significantly: Tiwi Islands Tourism and Residential Development Opportunities, Tiwi Islands Roads Upgrades Program, Tiwi Islands Fire and Carbon Project, and Tiwi H2 Hydrogen Project.
Professional plan users can use the search below to filter and access additional projects.
INFRASTRUCTURE SEARCH
 Denotes AI-based impression for illustrative purposes only, not to be taken as definitive under any circumstances. Please follow links and conduct other investigations from the project's source for actual imagery. Developers and project owners wishing us to use original imagery please Contact Us and we will do so.
Frequently Asked Questions - Infrastructure
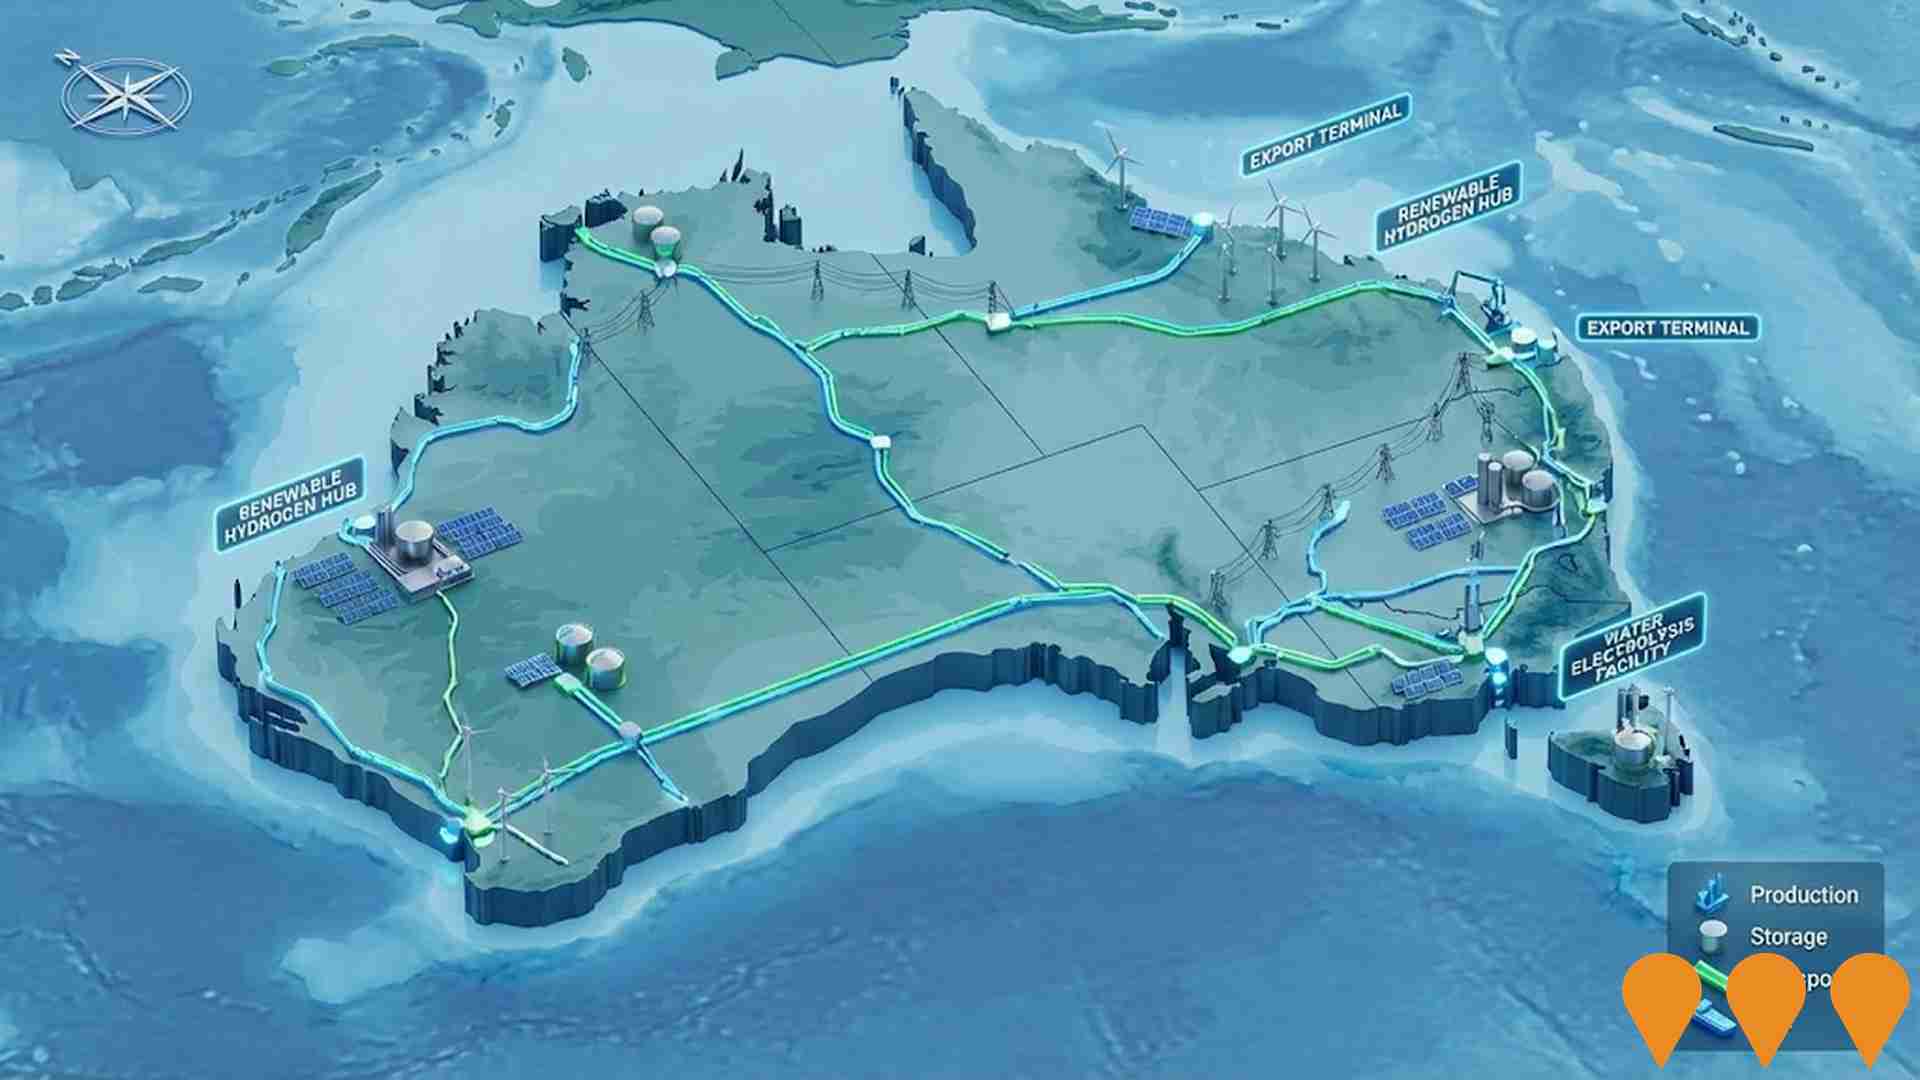
Enabling Infrastructure for Hydrogen Production
Australia has completed the National Hydrogen Infrastructure Assessment (NHIA) to 2050 and refreshed its National Hydrogen Strategy (2024). The programmatic focus has shifted to planning and enabling infrastructure through measures such as ARENA's Hydrogen Headstart and the Hydrogen Production Tax Incentive (from April 2025). Round 2 of Hydrogen Headstart consultation occurred in 2025. Collectively these actions aim to coordinate investment in transport, storage, water and electricity inputs linked to Renewable Energy Zones and priority hubs, supporting large-scale renewable hydrogen production and future export supply chains.
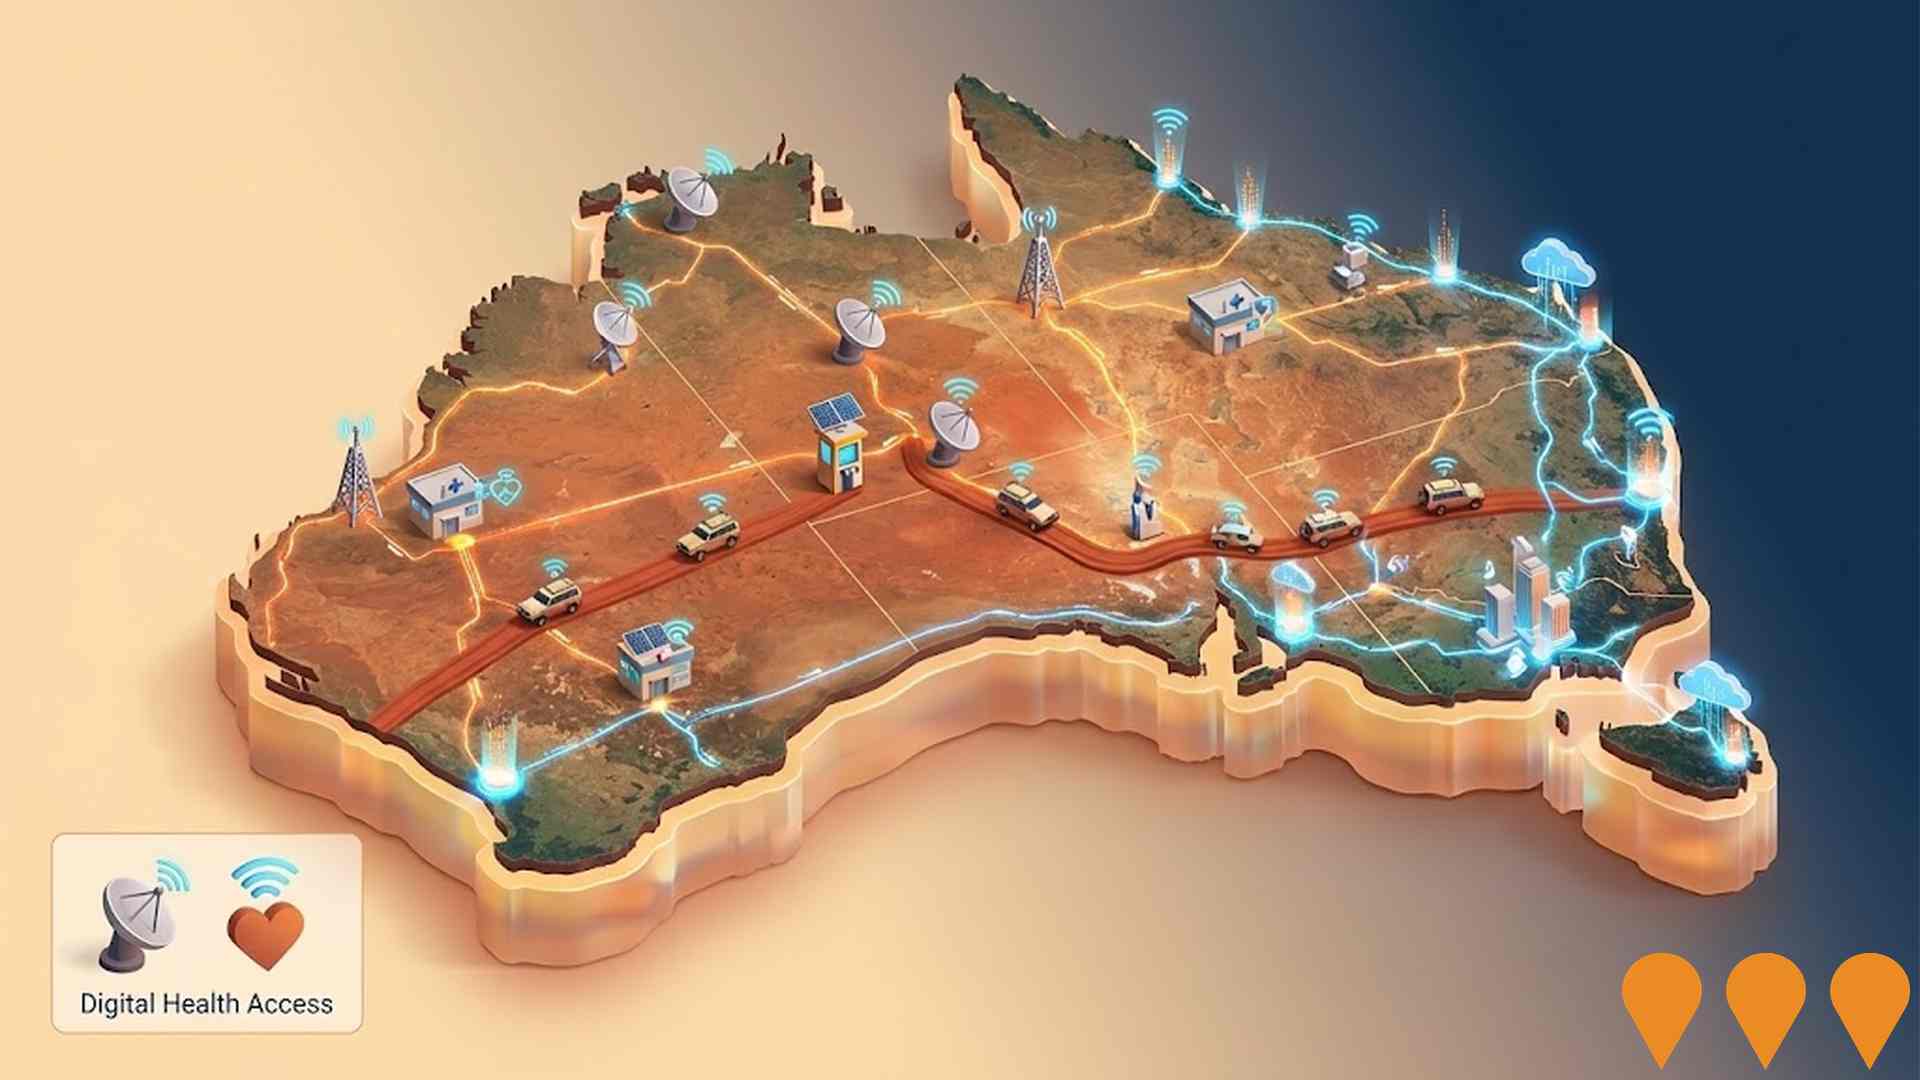
Enabling Digital Health Services for Regional and Remote Australia
National initiative to expand and improve digital health access for people in regional and remote Australia. Focus areas include enabling telehealth and virtual care, upgrading clinical systems and connectivity, supporting secure information exchange, and building workforce capability in digital health, aligned with the Australian Government's Digital Health Blueprint and Action Plan 2023-2033.
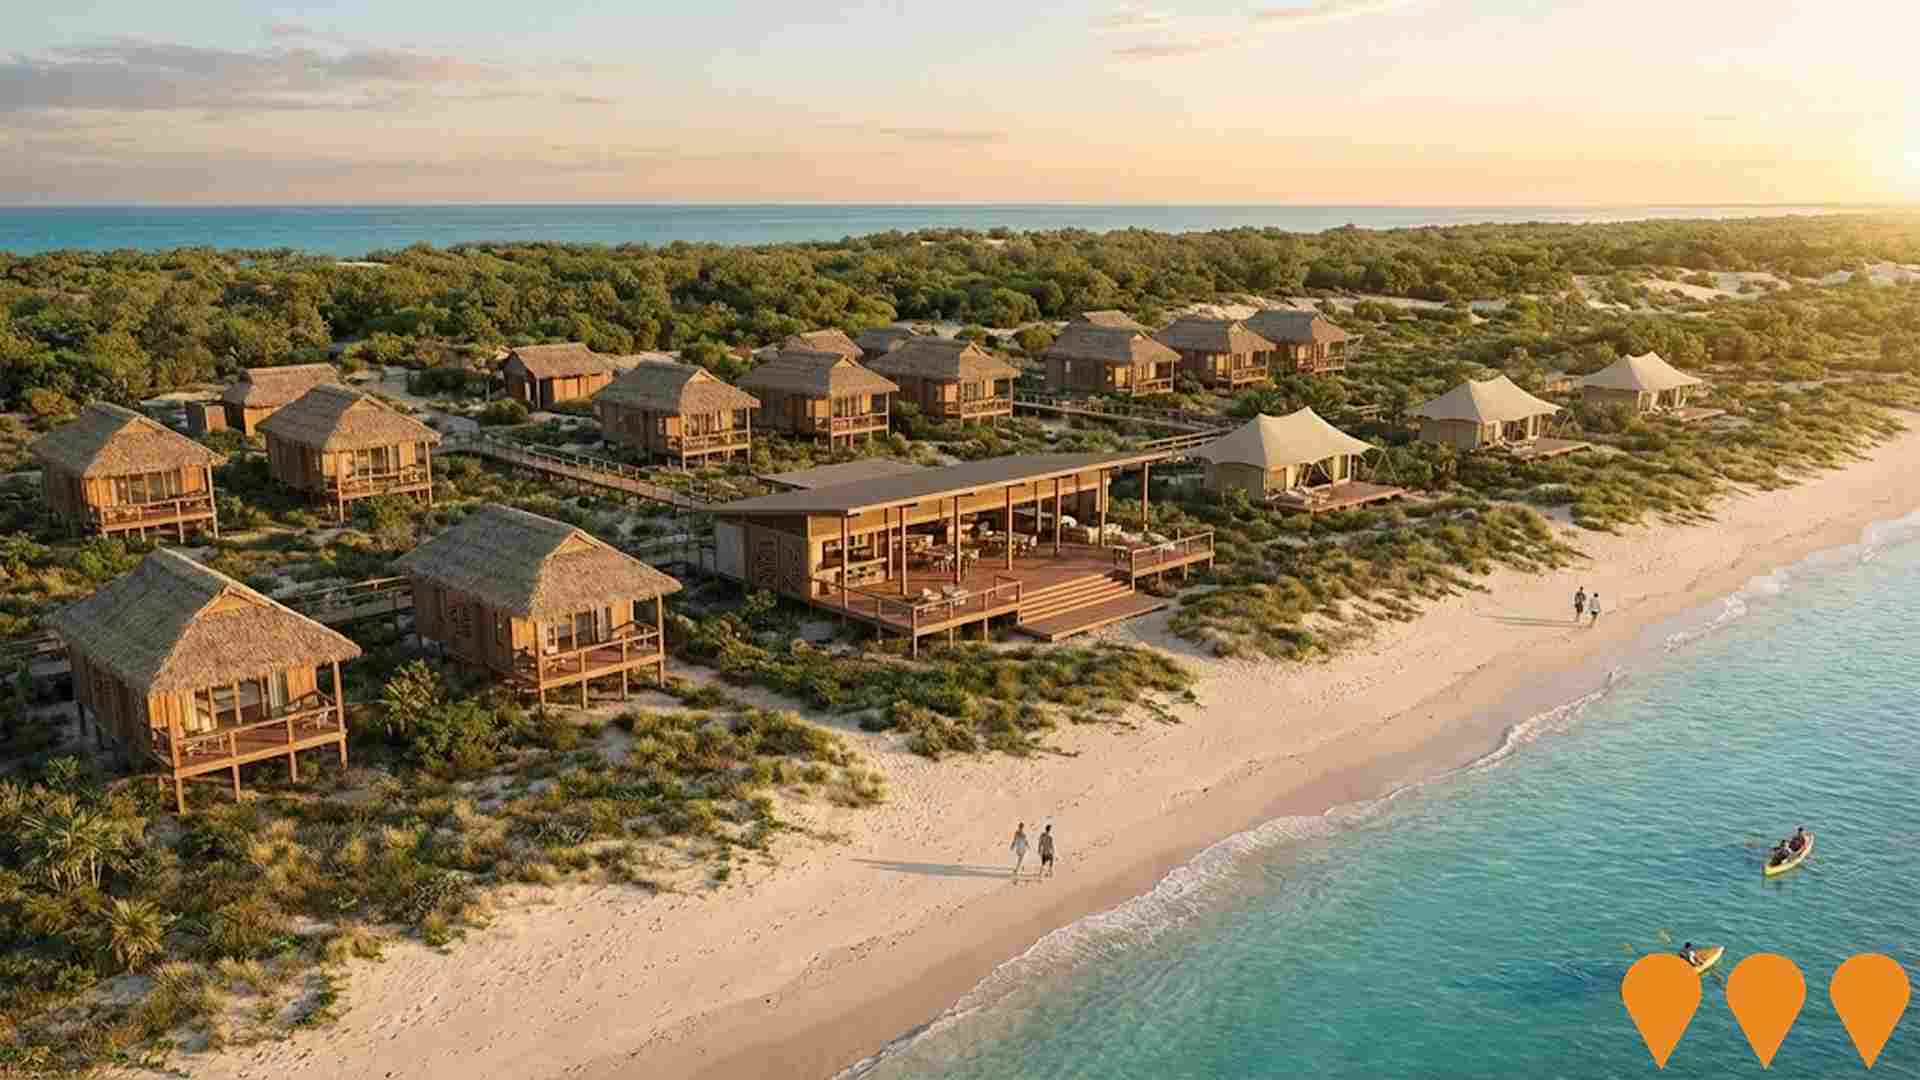
Tiwi Islands Tourism and Residential Development Opportunities
Expressions of interest are being sought for tourism and residential developments across selected sites on Bathurst and Melville Islands under the Tiwi Development Framework Agreement. Concepts promoted include cabin-style accommodation, small eco-lodges and glamping, with the goal of creating local jobs and long-term benefits for Tiwi communities.
National EV Charging Network (Highway Fast Charging)
Partnership between the Australian Government and NRMA to deliver a backbone EV fast charging network on national highways. Program funds and co-funds 117 DC fast charging sites at roughly 150 km intervals to connect all capital cities and regional routes, reducing range anxiety and supporting EV uptake.

Network Optimisation Program - Roads
A national program concept focused on improving congestion and reliability on urban road networks by using low-cost operational measures and technology (e.g., signal timing, intersection treatments, incident management) to optimise existing capacity across major city corridors.

Tiwi Islands Roads Upgrades Program
A $75 million jointly funded program by the Northern Territory and Australian governments to upgrade and seal roads across the Tiwi Islands. This includes works on Paru Road, Pickertaramoor, and Pirlangimpi access roads, aiming to improve connectivity, address access and safety issues, and enhance flood immunity.

Tiwi Islands Fire and Carbon Project
An independent, Indigenous owned carbon enterprise focused on savanna fire management across approximately 8000 square kilometres of Aboriginal land. The project generates Australian carbon credit units and supports the Tiwi community in self-determination, job creation, and cultural stewardship.
Tiwi H2 (Hydrogen) Project
An export green hydrogen project on the Tiwi Islands by Provaris Energy. It aims to produce up to 100,000 tonnes per annum of green hydrogen for export, using solar energy. The project is estimated to create 500 jobs during construction and 100 positions once operational, with a lifespan of 30 years.

Employment
Employment conditions in Tiwi Islands face significant challenges, ranking among the bottom 10% of areas assessed nationally
Tiwi Islands has a balanced workforce with both white and blue collar jobs, well-represented essential services sectors, and an unemployment rate of 14.2% as of June 2025. There are 890 residents employed while the unemployment rate is 8.3% higher than the Rest of NT's rate of 5.9%.
Workforce participation stands at 34.9%, significantly lower than the Rest of NT's 50.7%. Key industries include education & training, public administration & safety, and health care & social assistance. Education & training has a strong presence with an employment share 2.6 times the regional level. Conversely, health care & social assistance is less represented at 12.9% compared to the regional average of 18.8%.
The area may lack local employment opportunities as suggested by the difference between Census working population and resident population. Between June 2024 and June 2025, Tiwi Islands' labour force decreased by 1.9%, while employment declined by 4.6%, leading to a rise in unemployment of 2.4 percentage points. This contrasts with the Rest of NT where employment contracted by 1.7% and unemployment fell marginally despite a similar labour force decrease of 1.8%. Jobs and Skills Australia's national employment forecasts from May 2025 project overall growth of 6.6% over five years and 13.7% over ten years. Applying these projections to Tiwi Islands' industry mix suggests local growth of approximately 6.1% over five years and 12.8% over ten years, though these are simple extrapolations for illustrative purposes only.
Frequently Asked Questions - Employment
Income
Income metrics place the area in the bottom 10% of locations nationally according to AreaSearch analysis
Tiwi Islands had a median taxpayer income of $39,270 and an average income of $52,420 in financial year 2022. This is lower than the national average, with Rest of NT having a median income of $51,655 and an average income of $61,577. By September 2025, estimates suggest these figures would be approximately $43,986 (median) and $58,716 (average), based on Wage Price Index growth of 12.01% since financial year 2022. Census income data is unavailable for detailed analysis. In Tiwi Islands, 27.7% of the population falls within the $400 - $799 income range, contrasting with the broader area where the $1,500 - $2,999 bracket leads at 33.6%. The concentration of 53.2% in sub-$800 weekly brackets highlights economic challenges faced by a significant portion of the community. While housing costs are modest, with 89.9% of income retained, total disposable income ranks at just the 3rd percentile nationally.
Frequently Asked Questions - Income
Housing
Tiwi Islands is characterized by a predominantly suburban housing profile, with a higher proportion of rental properties than the broader region
The dwelling structure in Tiwi Islands, as per the latest Census, consisted of 82.2% houses and 17.8% other dwellings (semi-detached, apartments, 'other' dwellings), compared to Non-Metro NT's 83.6% houses and 16.4% other dwellings. Home ownership in Tiwi Islands was at 4.5%, with the rest either mortgaged (0.0%) or rented (95.5%). The median monthly mortgage repayment was $845, below Non-Metro NT's average of $1,346, and rents were recorded at $80, matching Non-Metro NT's figure. Nationally, Tiwi Islands' mortgage repayments are significantly lower than the Australian average of $1,863, while rents are substantially below the national figure of $375.
Frequently Asked Questions - Housing
Household Composition
Tiwi Islands features high concentrations of family households, with a lower-than-average median household size
Family households constitute 81.0% of all households, including 32.5% couples with children, 20.4% couples without children, and 20.1% single parent families. Non-family households account for 19.0%, with lone person households at 19.2% and group households comprising 1.7%. The median household size is 3.4 people, which is smaller than the Rest of NT average of 3.5.
Frequently Asked Questions - Households
Local Schools & Education
Tiwi Islands faces educational challenges, with performance metrics placing it in the bottom quartile of areas assessed nationally
The area has university qualification rates at 10.2%, significantly lower than the Australian average of 30.4%. This presents both a challenge and an opportunity for targeted educational initiatives. Bachelor degrees are the most common at 6.7%, followed by graduate diplomas (2.0%) and postgraduate qualifications (1.5%). Vocational pathways account for 18.1% of qualifications among those aged 15+, with advanced diplomas at 2.7% and certificates at 15.4%.
Educational participation is high, with 30.6% of residents currently enrolled in formal education. This includes 14.2% in primary education, 11.4% in secondary education, and 1.4% pursuing tertiary education. The Tiwi Islands have a total of 5 schools with an enrollment of 418 students. Educational conditions vary across the islands, with a mix of 1 primary school, 1 secondary school, and 3 K-12 schools.
Frequently Asked Questions - Education
Schools Detail
Nearby Services & Amenities
Transport
No public transport data available for this catchment area.
Frequently Asked Questions - Transport
Transport Stops Detail
Health
Tiwi Islands's residents boast exceedingly positive health performance metrics with very low prevalence of common health conditions across all age groups
Health outcomes data shows excellent results across Tiwi Islands, with very low prevalence of common health conditions across all age groups. The rate of private health cover is extremely low at approximately 46% of the total population (~1,267 people), compared to the national average of 55.3%.
The most prevalent medical conditions in the area are diabetes and heart disease, affecting 4.5 and 4.4% of residents respectively. A total of 83.6% of residents declare themselves completely clear of medical ailments, compared to 78.5% across Rest of NT. The area has 6.0% of its residents aged 65 and over (165 people), lower than the 9.4% in Rest of NT. Health outcomes among seniors are particularly strong, broadly aligning with the general population's health profile.
Frequently Asked Questions - Health
Cultural Diversity
The level of cultural diversity witnessed in Tiwi Islands was found to be above average when compared nationally for a number of language and cultural background related metrics
Tiwi Islands had a cultural diversity index above average, with 2.4% of its population born overseas and 86.9% speaking a language other than English at home. Christianity was the predominant religion in Tiwi Islands, comprising 89.4% of the population, compared to 61.0% across the rest of Northern Territory. The top three ancestry groups were Australian Aboriginal (85.4%), English (4.3%), and Australian (3.6%).
These figures differed from regional averages: Australian Aboriginal was substantially higher at 64.6%, while English and Australian were notably lower at 10.2% and 9.9% respectively.
Frequently Asked Questions - Diversity
Age
Tiwi Islands hosts a very young demographic, ranking in the bottom 10% of areas nationwide
The median age of Tiwi Islands is 30 years, which is close to Rest of NT's 31 and significantly lower than the national average of 38 years. Compared to Rest of NT, Tiwi Islands has a higher percentage of residents aged 15-24 (17.2%) but fewer residents aged 25-34 (16.3%). Between the 2016 Census and the 2021 Census, the population aged 55 to 64 increased from 9.5% to 11.7%, while the population aged 65 to 74 rose from 3.8% to 5.0%. Conversely, the population aged 5 to 14 decreased from 16.3% to 13.3%, and the population aged 45 to 54 dropped from 14.6% to 13.4%. By 2041, demographic modeling suggests Tiwi Islands' age profile will change significantly. The 45 to 54 age group is projected to grow by 38%, reaching 507 people from 368. However, both the 85+ and 15 to 24 age groups are expected to decrease in number.
