Chart Color Schemes
This analysis uses ABS Statistical Areas Level 2 (SA2) boundaries, which can materially differ from Suburbs and Localities (SAL) even when sharing similar names.
SA2 boundaries are defined by the Australian Bureau of Statistics and are designed to represent communities for statistical reporting (e.g., census and ERP).
Suburbs and Localities (SAL) represent commonly-used suburb/locality names (postal-style areas) and may use different geographic boundaries. For comprehensive analysis, consider reviewing both boundary types if available.
est. as @ -- *
ABS ERP | -- people | --
2021 Census | -- people
Sales Activity
Curious about local property values? Filter the chart to assess the volume and appreciation (including resales) trends and regional comparisons, or scroll to the map below view this information at an individual property level.
Find a Recent Sale
Sales Detail
Population
Wahroonga (East) - Warrawee is positioned among the lower quartile of areas assessed nationally for population growth based on AreaSearch's assessment of recent, and medium term trends
As of Nov 2025, Wahroonga (East) - Warrawee's population is around 18,248. This reflects an increase since the 2021 Census, which reported a population of 18,191 people. The change is inferred from the estimated resident population of 18,222 as of June 2024 and an additional 29 validated new addresses since the Census date. This level of population equates to a density ratio of 1,368 persons per square kilometer, above the average seen across national locations assessed by AreaSearch. Population growth for the area was primarily driven by overseas migration.
AreaSearch is adopting ABS/Geoscience Australia projections for each SA2 area, as released in 2024 with 2022 as the base year, and NSW State Government's SA2 level projections for areas not covered, released in 2022 with 2021 as the base year. Growth rates by age group are applied to all areas from these aggregations for years 2032 to 2041. Based on demographic trends and latest annual ERP population numbers, the area is expected to grow by 1,312 persons to 2041, reflecting a gain of 7.0% in total over the 17 years.
Frequently Asked Questions - Population
Development
AreaSearch analysis of residential development drivers sees Wahroonga (East) - Warrawee recording a relatively average level of approval activity when compared to local markets analysed countrywide
Wahroonga East-Warrawee has seen approximately 61 new homes approved annually over the past five financial years, totalling 307 homes. As of FY26137 approvals have been recorded. Despite population decline, development activity has remained adequate relative to other areas. The average expected construction cost for new homes is $830,000, indicating a focus on premium properties.
In FY26, $137.0 million in commercial development approvals have been recorded, suggesting strong local business investment. Compared to Greater Sydney, Wahroonga East-Warrawee shows 13.0% lower construction activity per person but ranks among the 71st percentile nationally, with building activity accelerating recently. Recent construction comprises 52.0% detached houses and 48.0% medium-high density housing, marking a shift from the current 75.0% houses, suggesting decreasing developable land availability and responding to evolving lifestyle preferences and affordability needs. With around 226 people per dwelling approval, it indicates low-density characteristics. Future projections estimate an addition of 1,286 residents by 2041.
At current development rates, new housing supply should meet demand comfortably, providing favourable conditions for buyers and potentially supporting population growth beyond current projections.
Frequently Asked Questions - Development
Infrastructure
Wahroonga (East) - Warrawee has moderate levels of nearby infrastructure activity, ranking in the 45thth percentile nationally
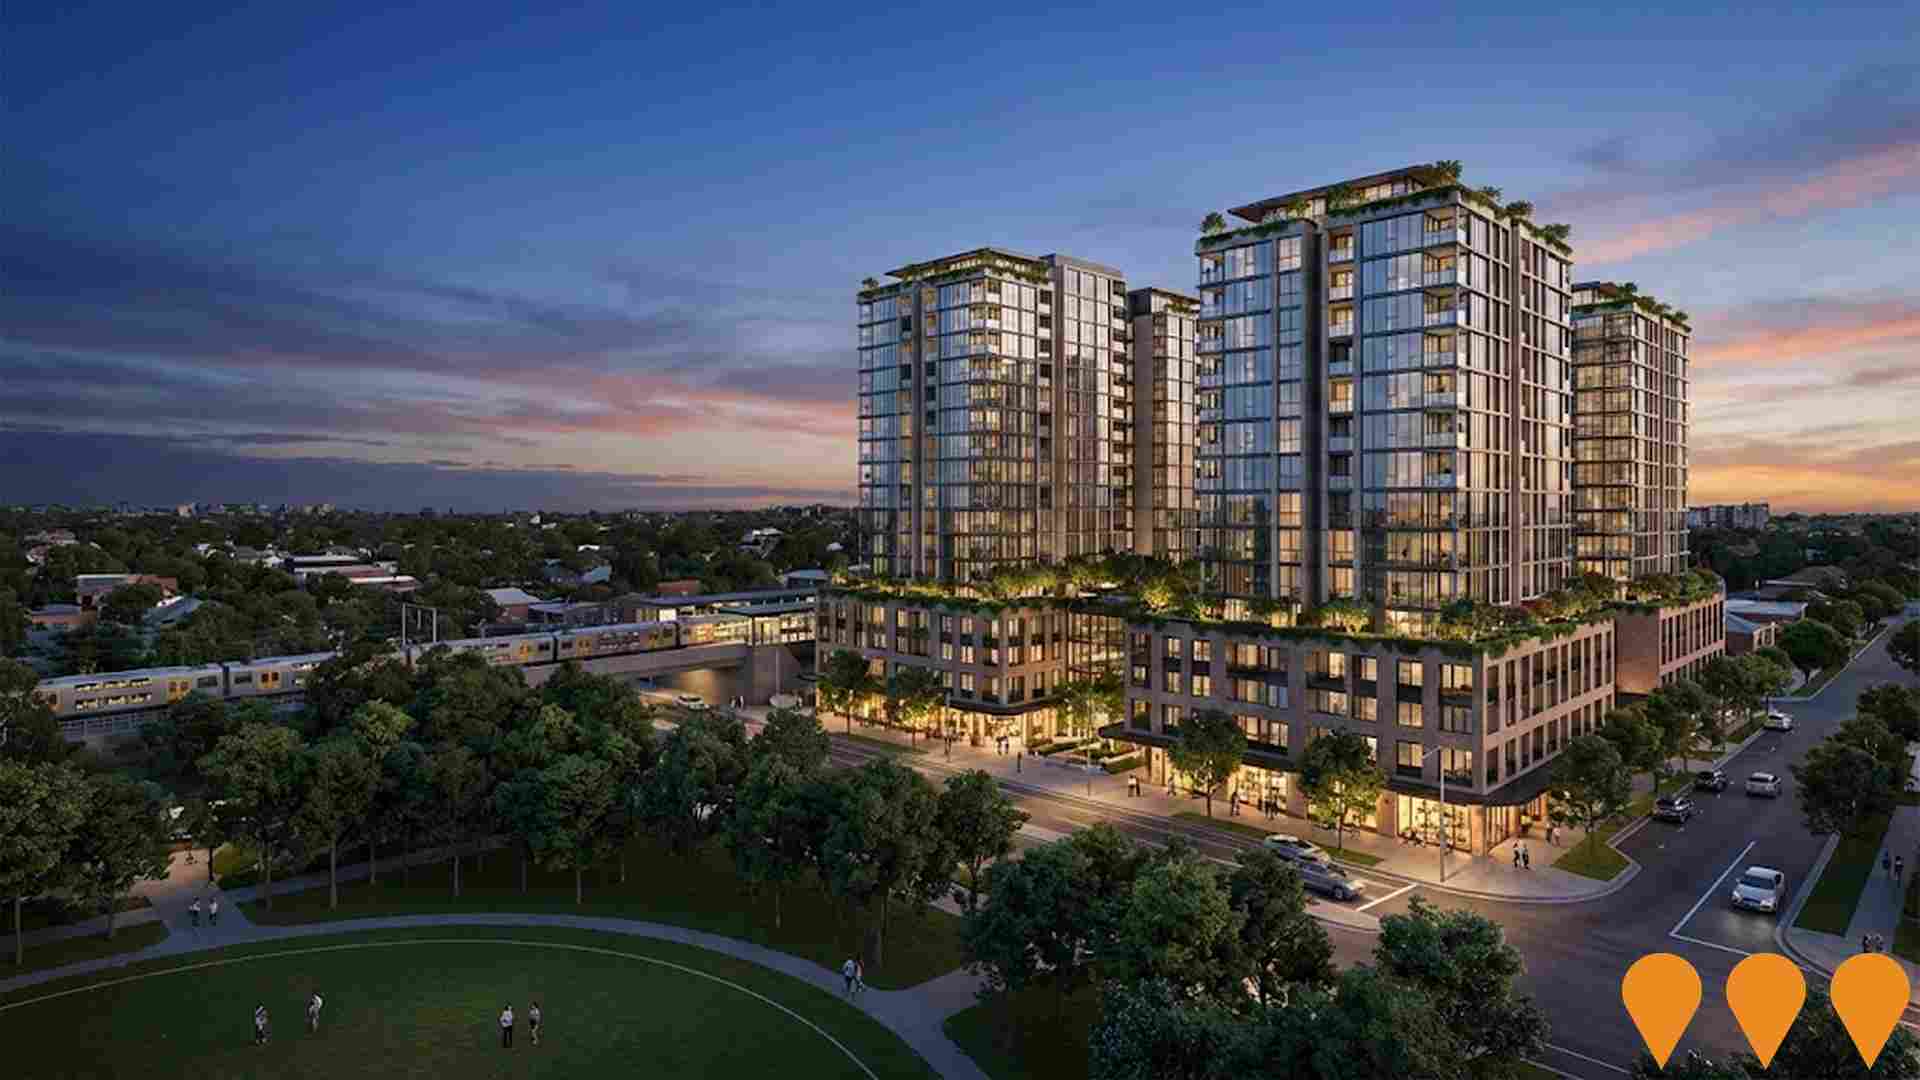
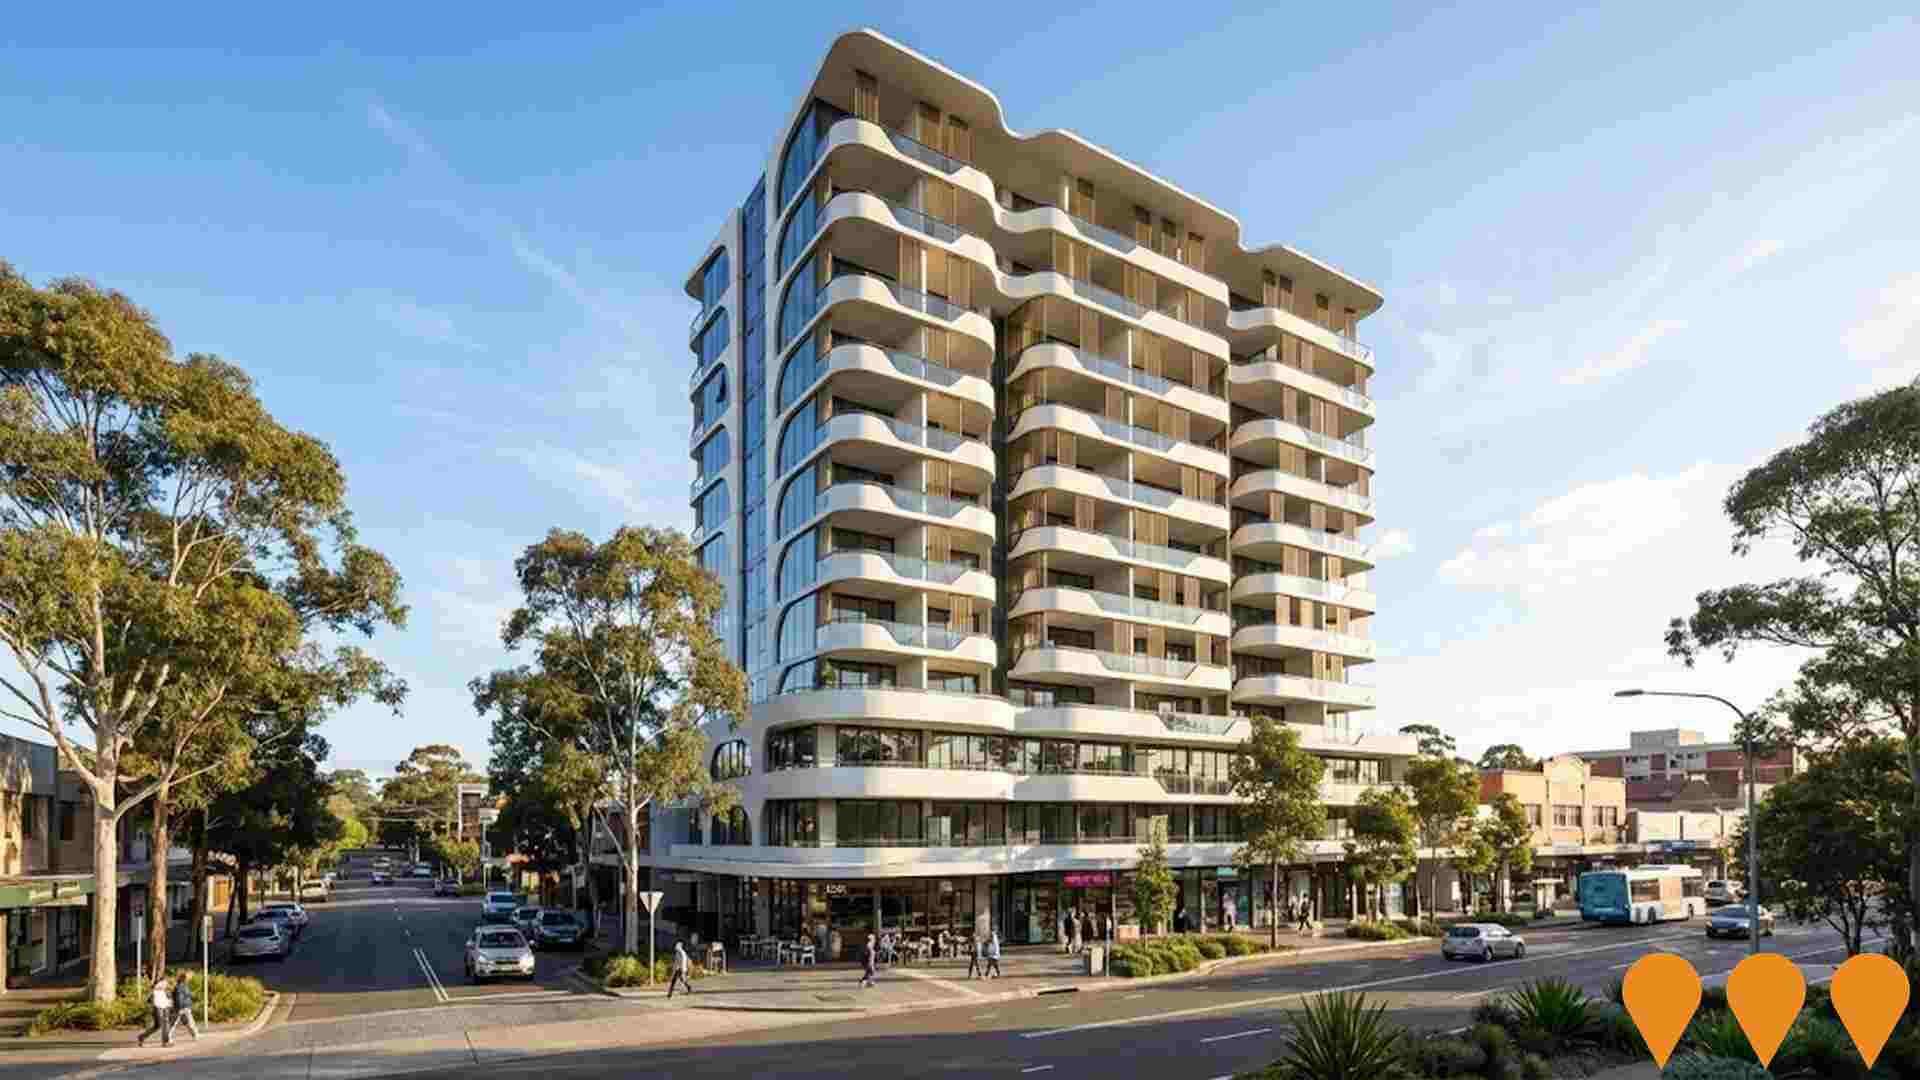
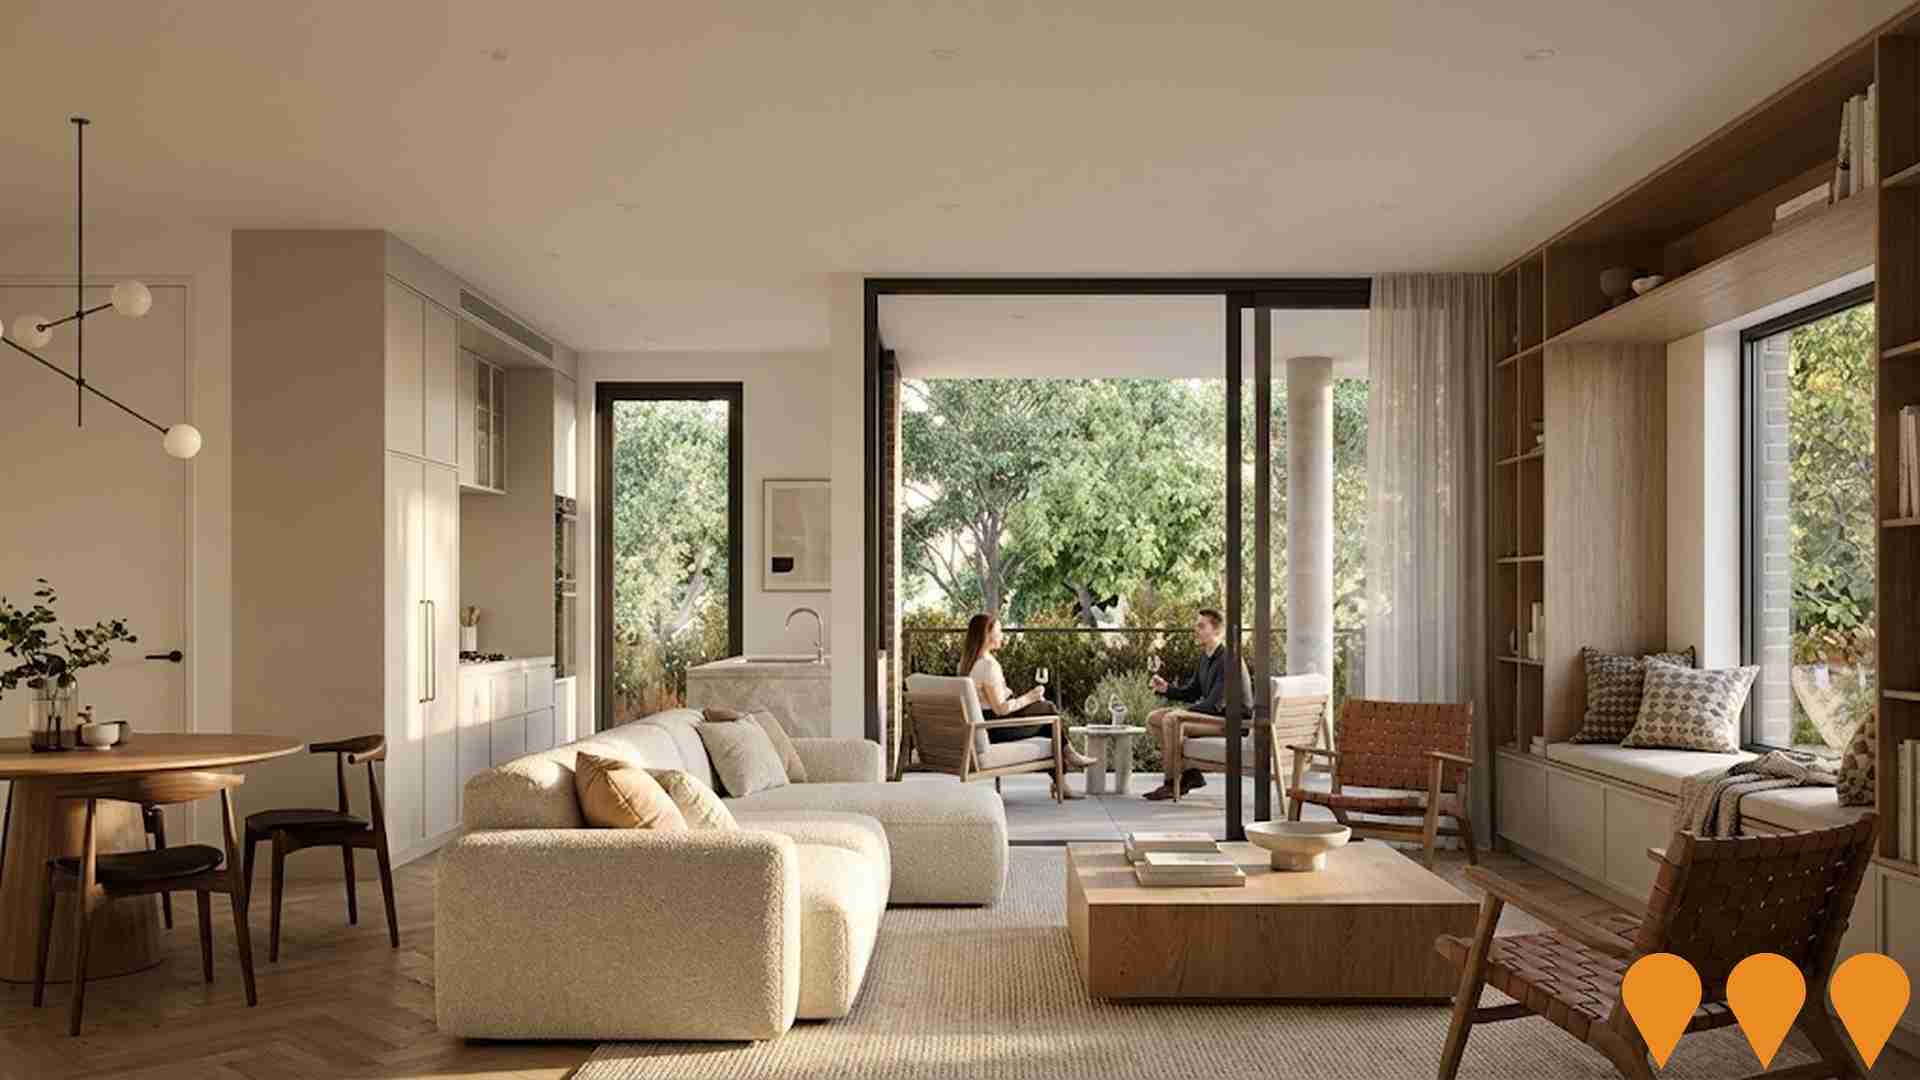
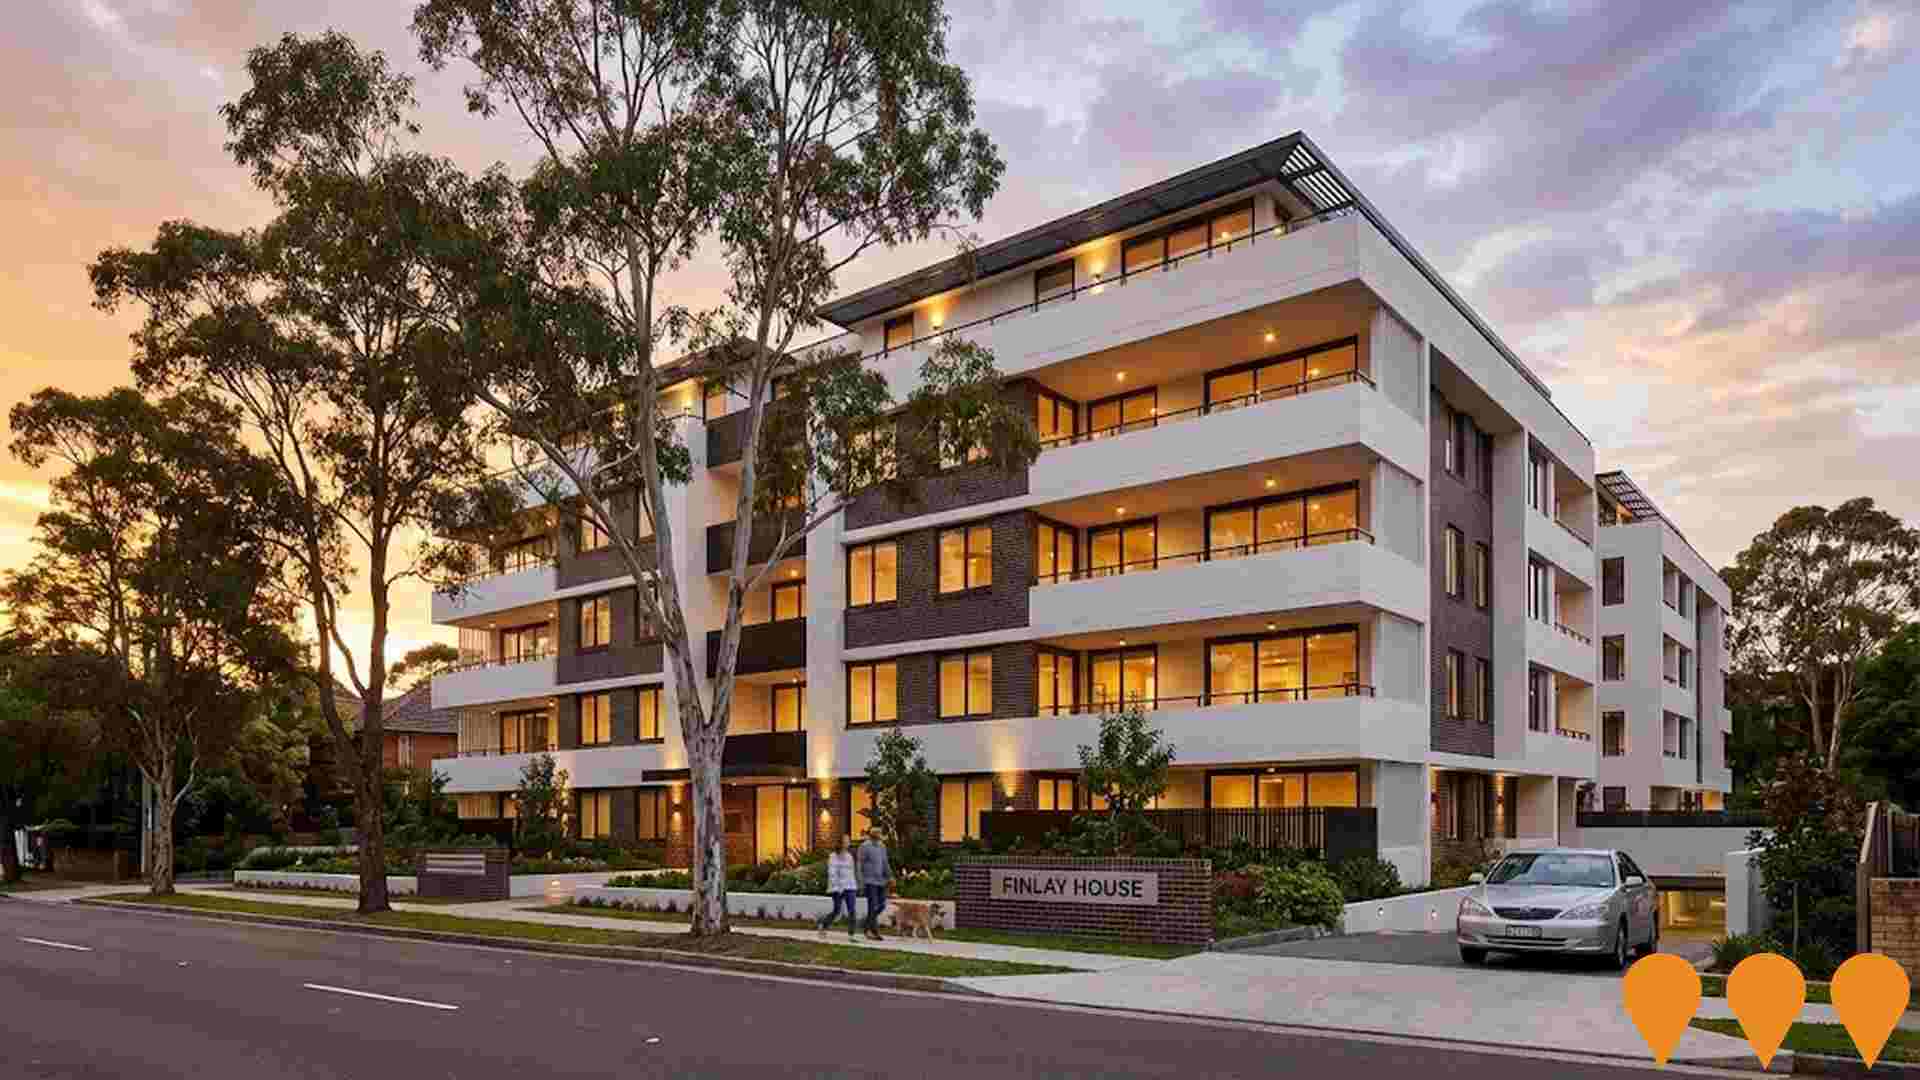
Changes to local infrastructure significantly influence an area's performance. AreaSearch has identified 37 projects likely to impact this area. Notable projects include The Residences at Wahroonga Estate, Braeside Street Road Upgrade, Sydney Adventist Hospital Redevelopment, and Hammondcare Hospital And Seniors Housing Development. Below is a list of most relevant projects.
Professional plan users can use the search below to filter and access additional projects.
INFRASTRUCTURE SEARCH
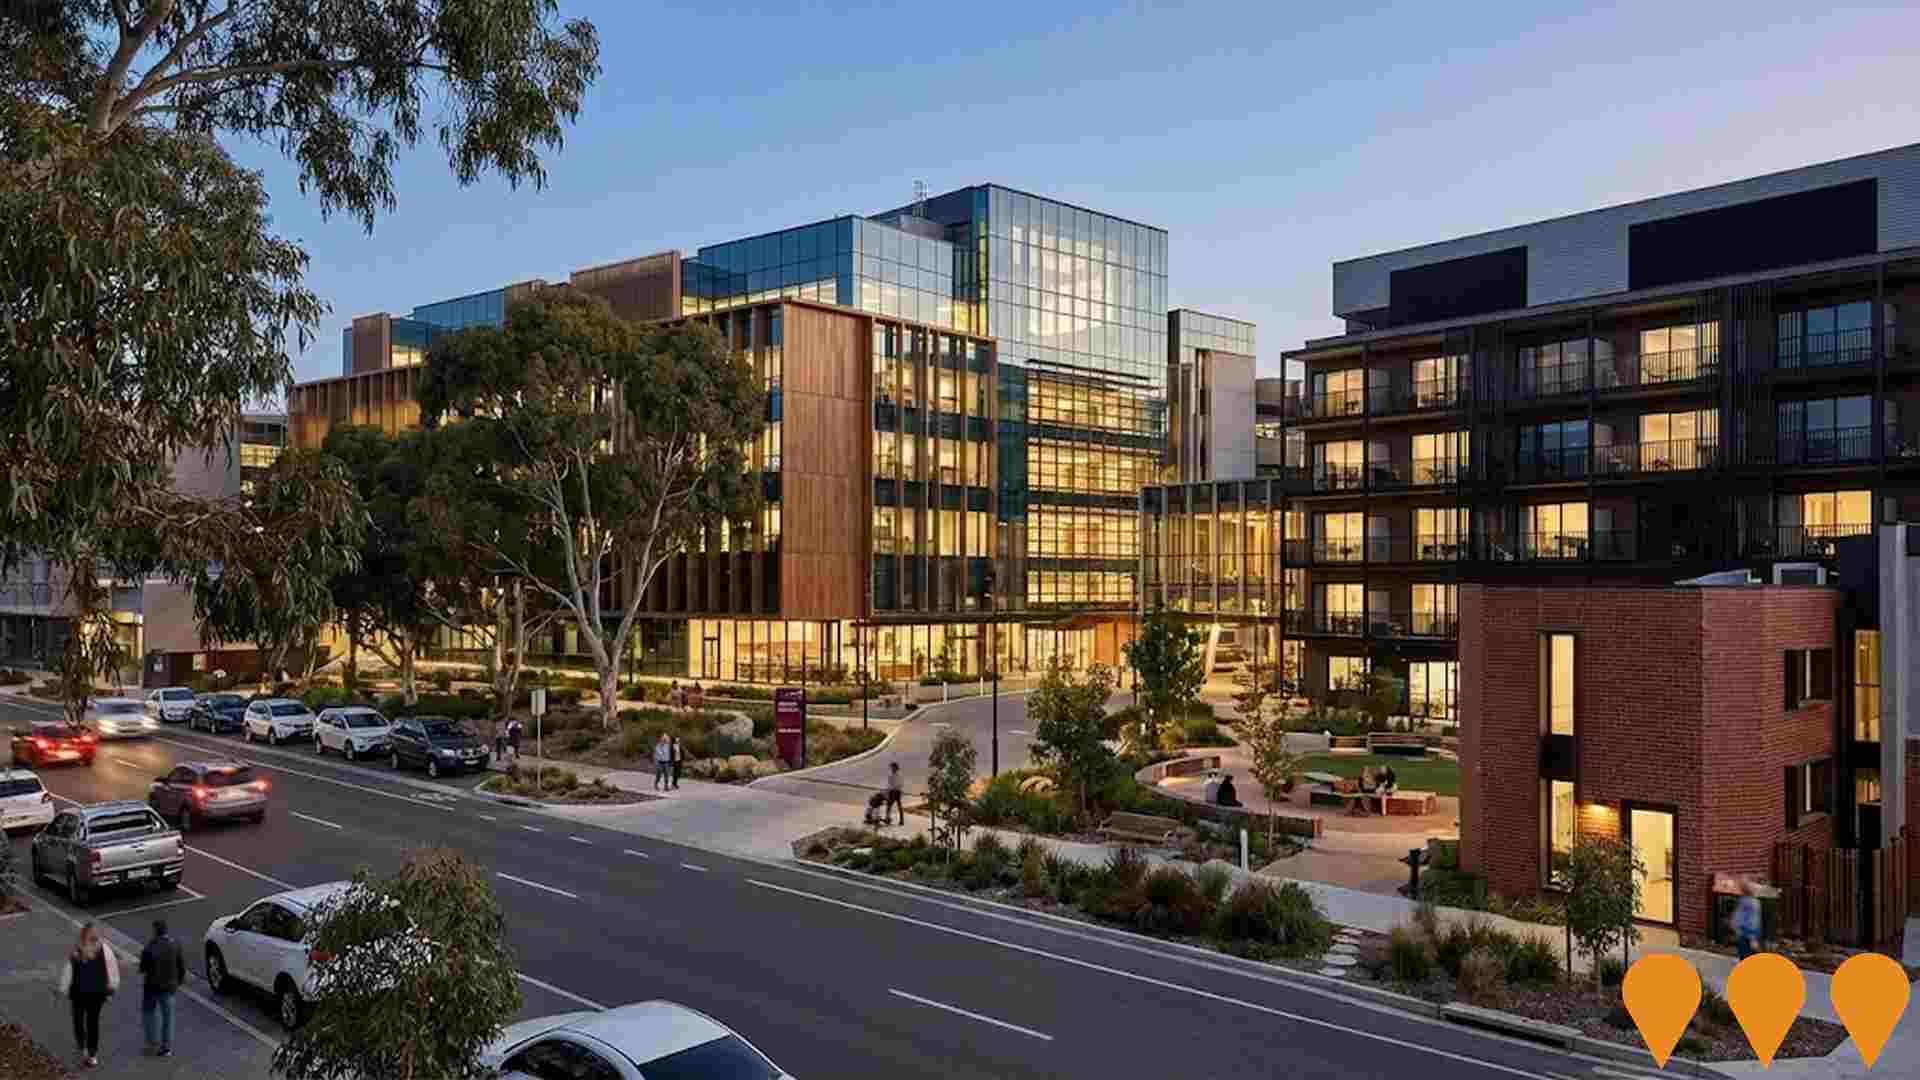
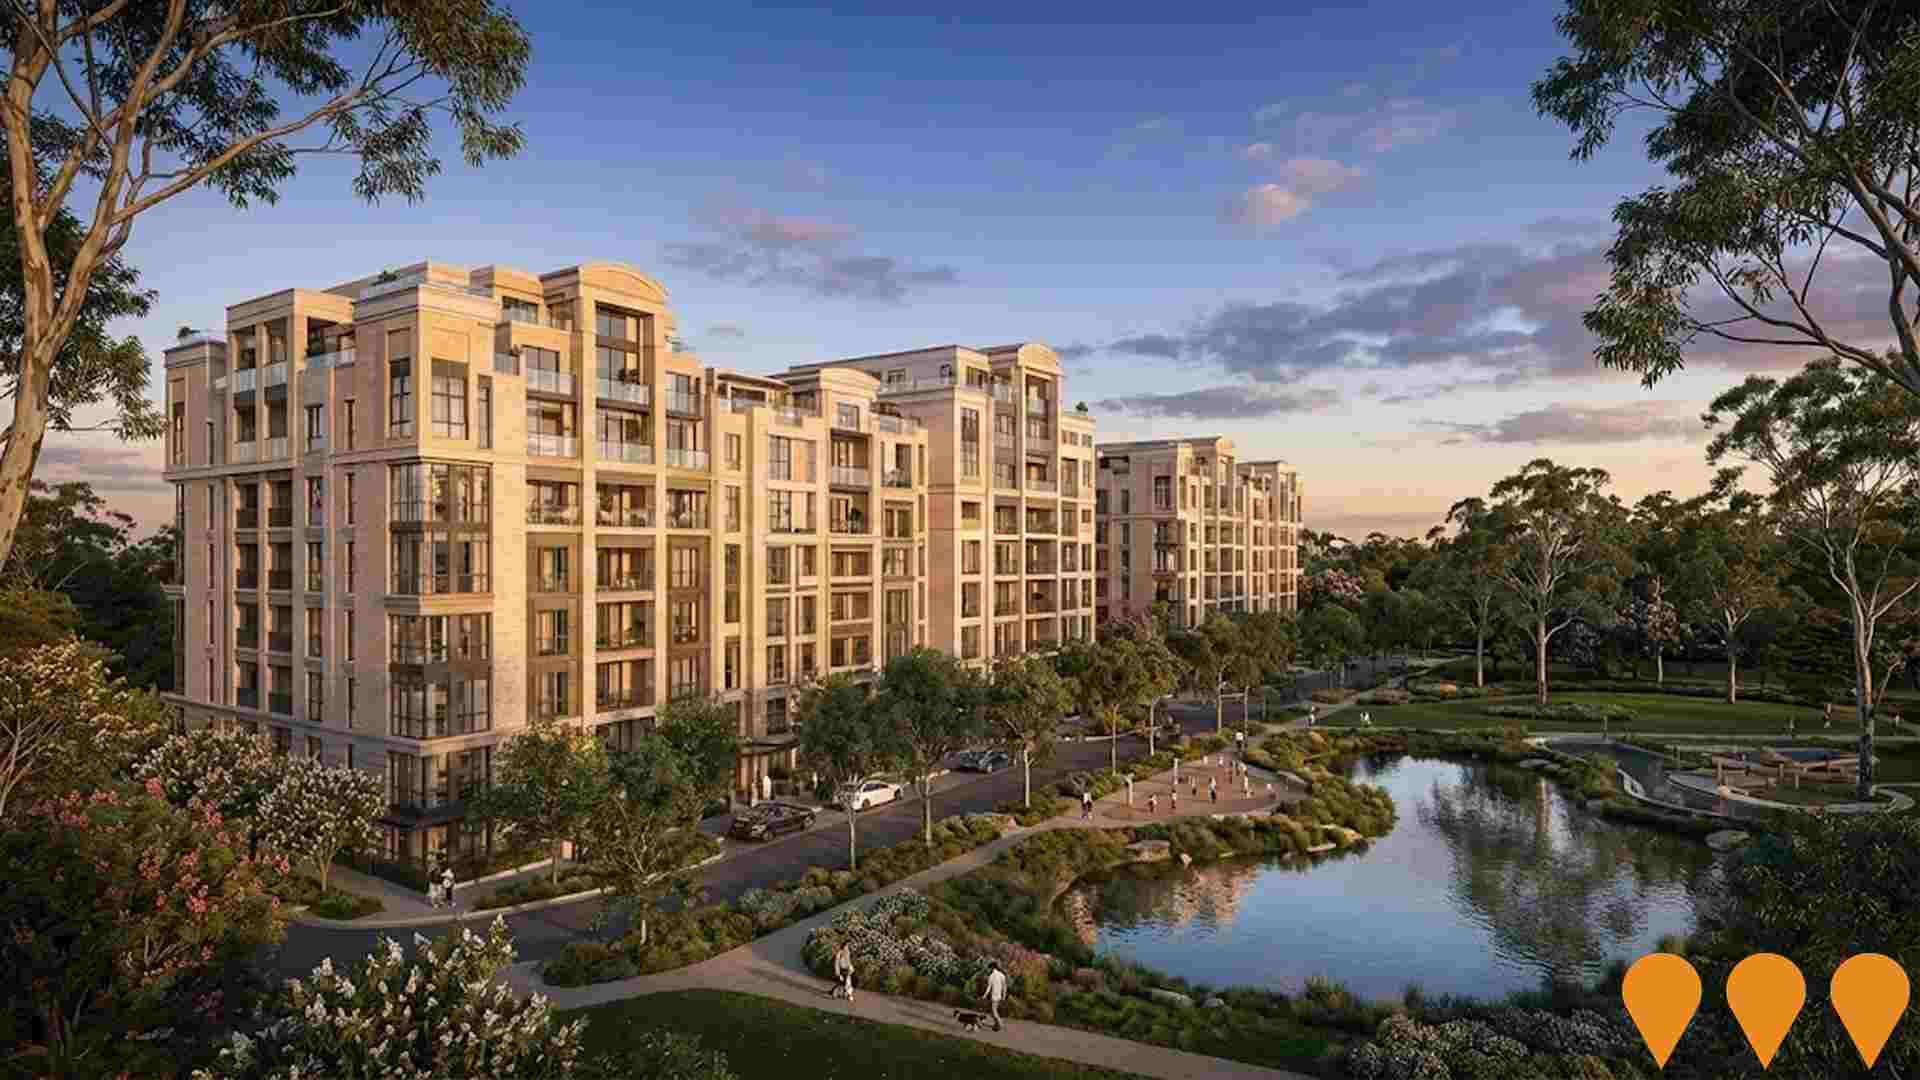
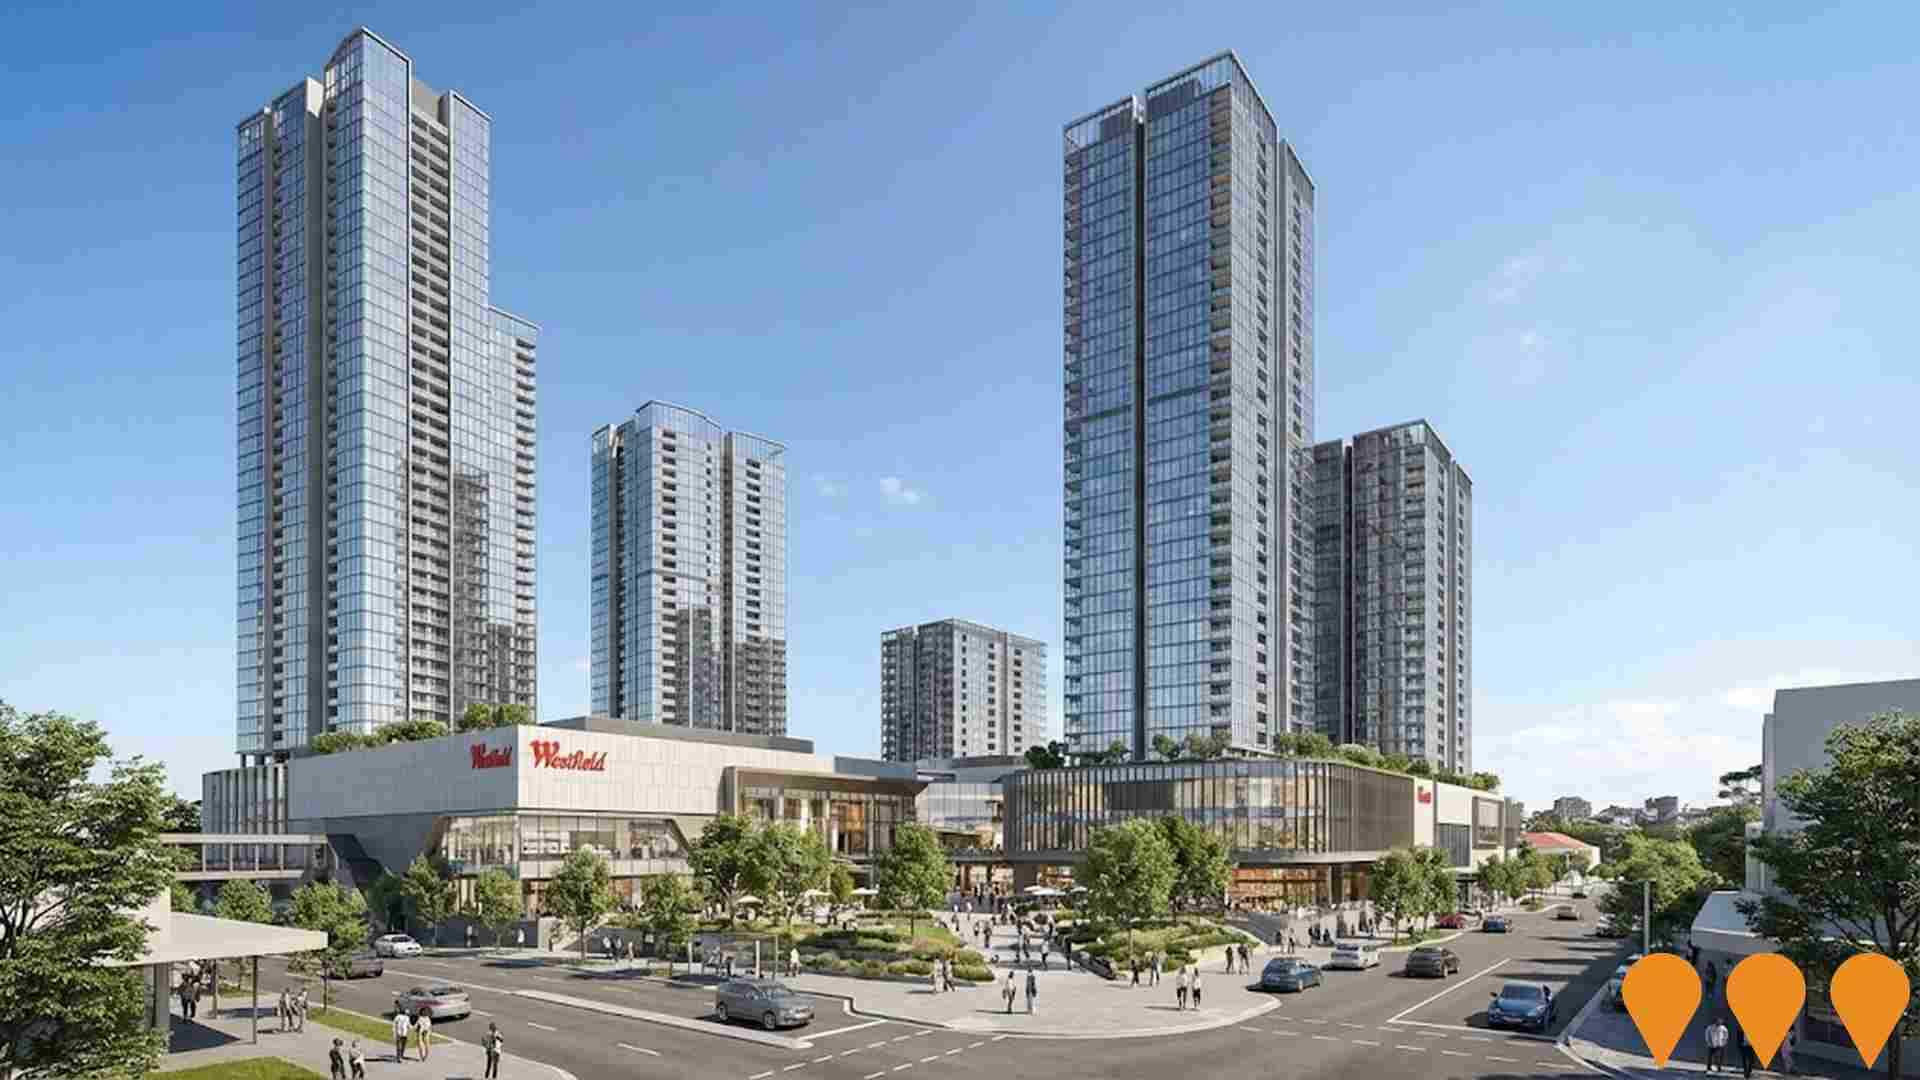
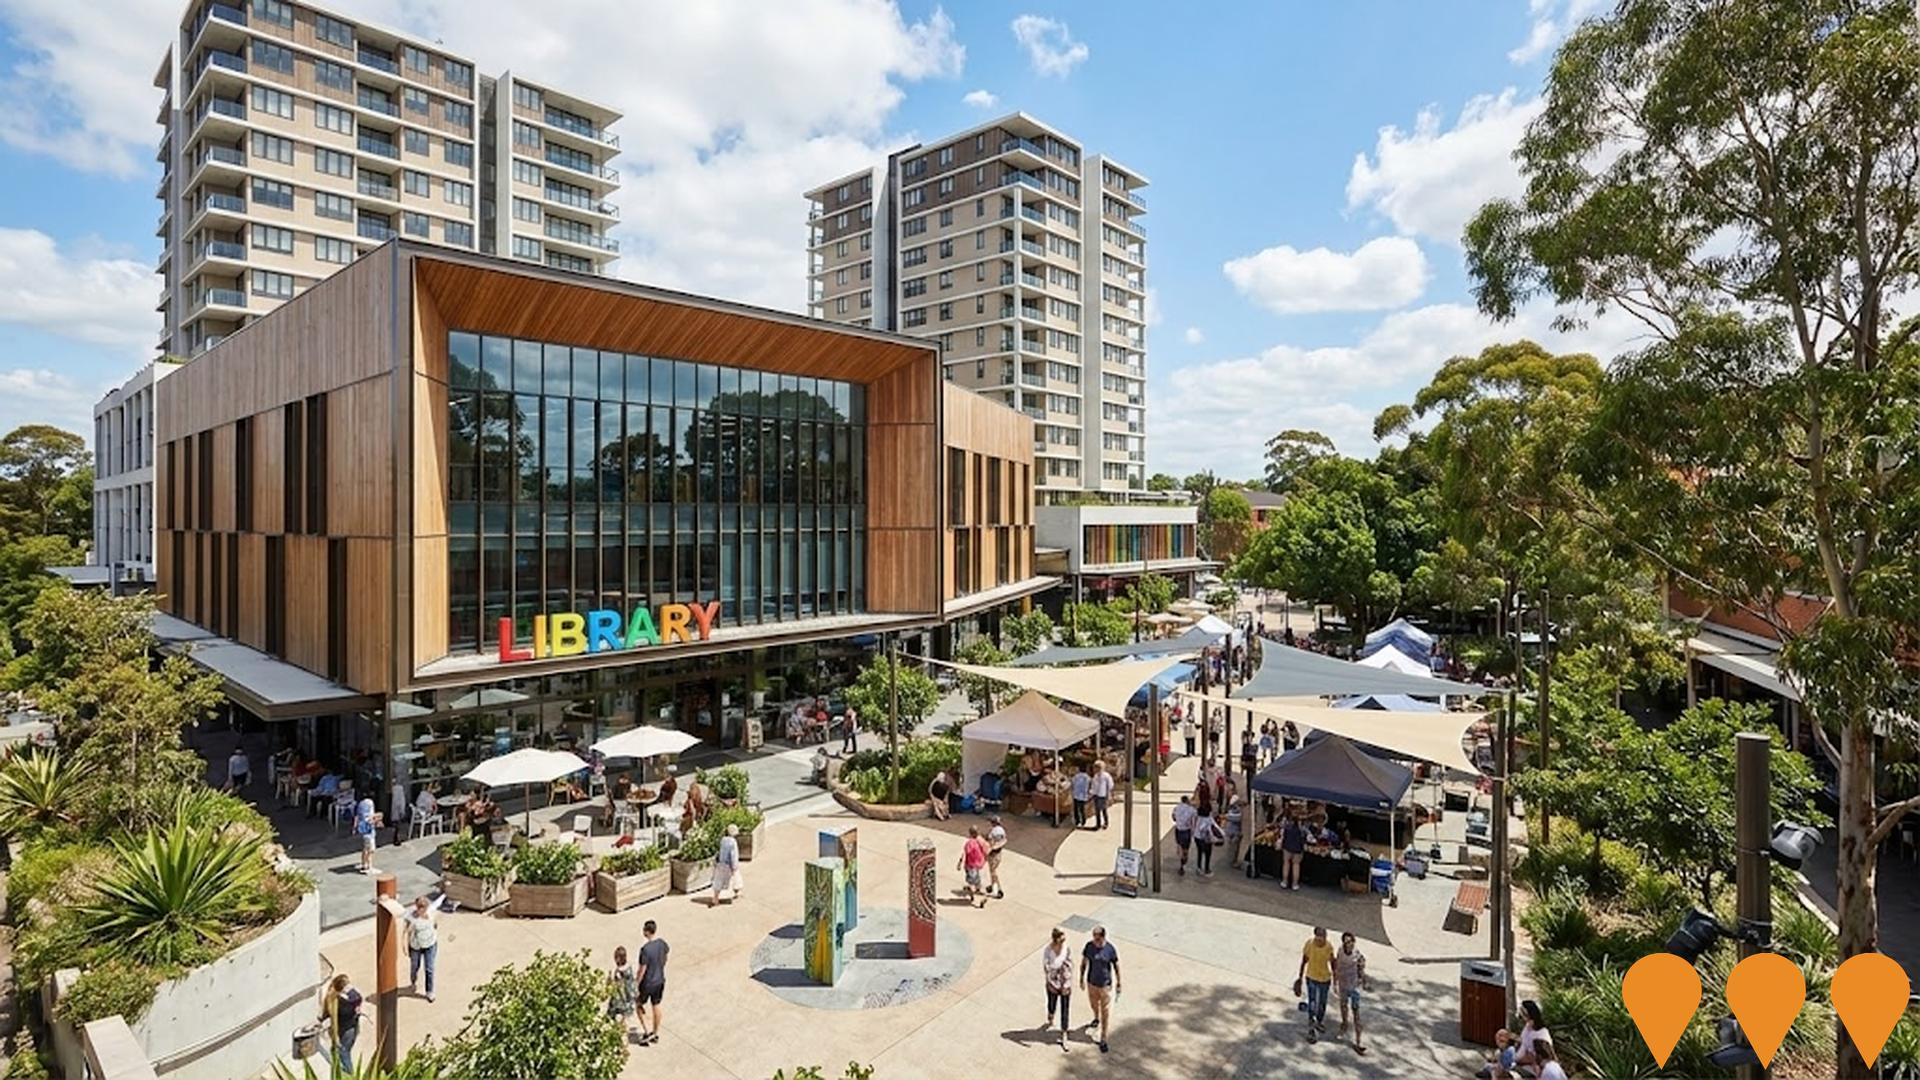
 Denotes AI-based impression for illustrative purposes only, not to be taken as definitive under any circumstances. Please follow links and conduct other investigations from the project's source for actual imagery. Developers and project owners wishing us to use original imagery please Contact Us and we will do so.
Frequently Asked Questions - Infrastructure
Westfield Hornsby Transport Oriented Development
Large-scale mixed-use redevelopment of Westfield Hornsby under the NSW Government's Transport Oriented Development (TOD) Program. The concept proposal allows for up to 6,000 new dwellings in multiple residential towers (up to 53 storeys), expanded retail and commercial floor space, public domain improvements and new community facilities, all centred around Hornsby Railway Station.
Hornsby Town Centre Master Plan
Comprehensive urban renewal master plan for Hornsby Town Centre delivering up to 6,000 new dwellings in buildings up to 36 storeys, approximately 2,900 new jobs, upgraded public domain, new community facilities, improved transport connections and sustainable infrastructure. The master plan was finalised and came into legal effect in November 2024 with development applications now able to be lodged under the new planning controls.
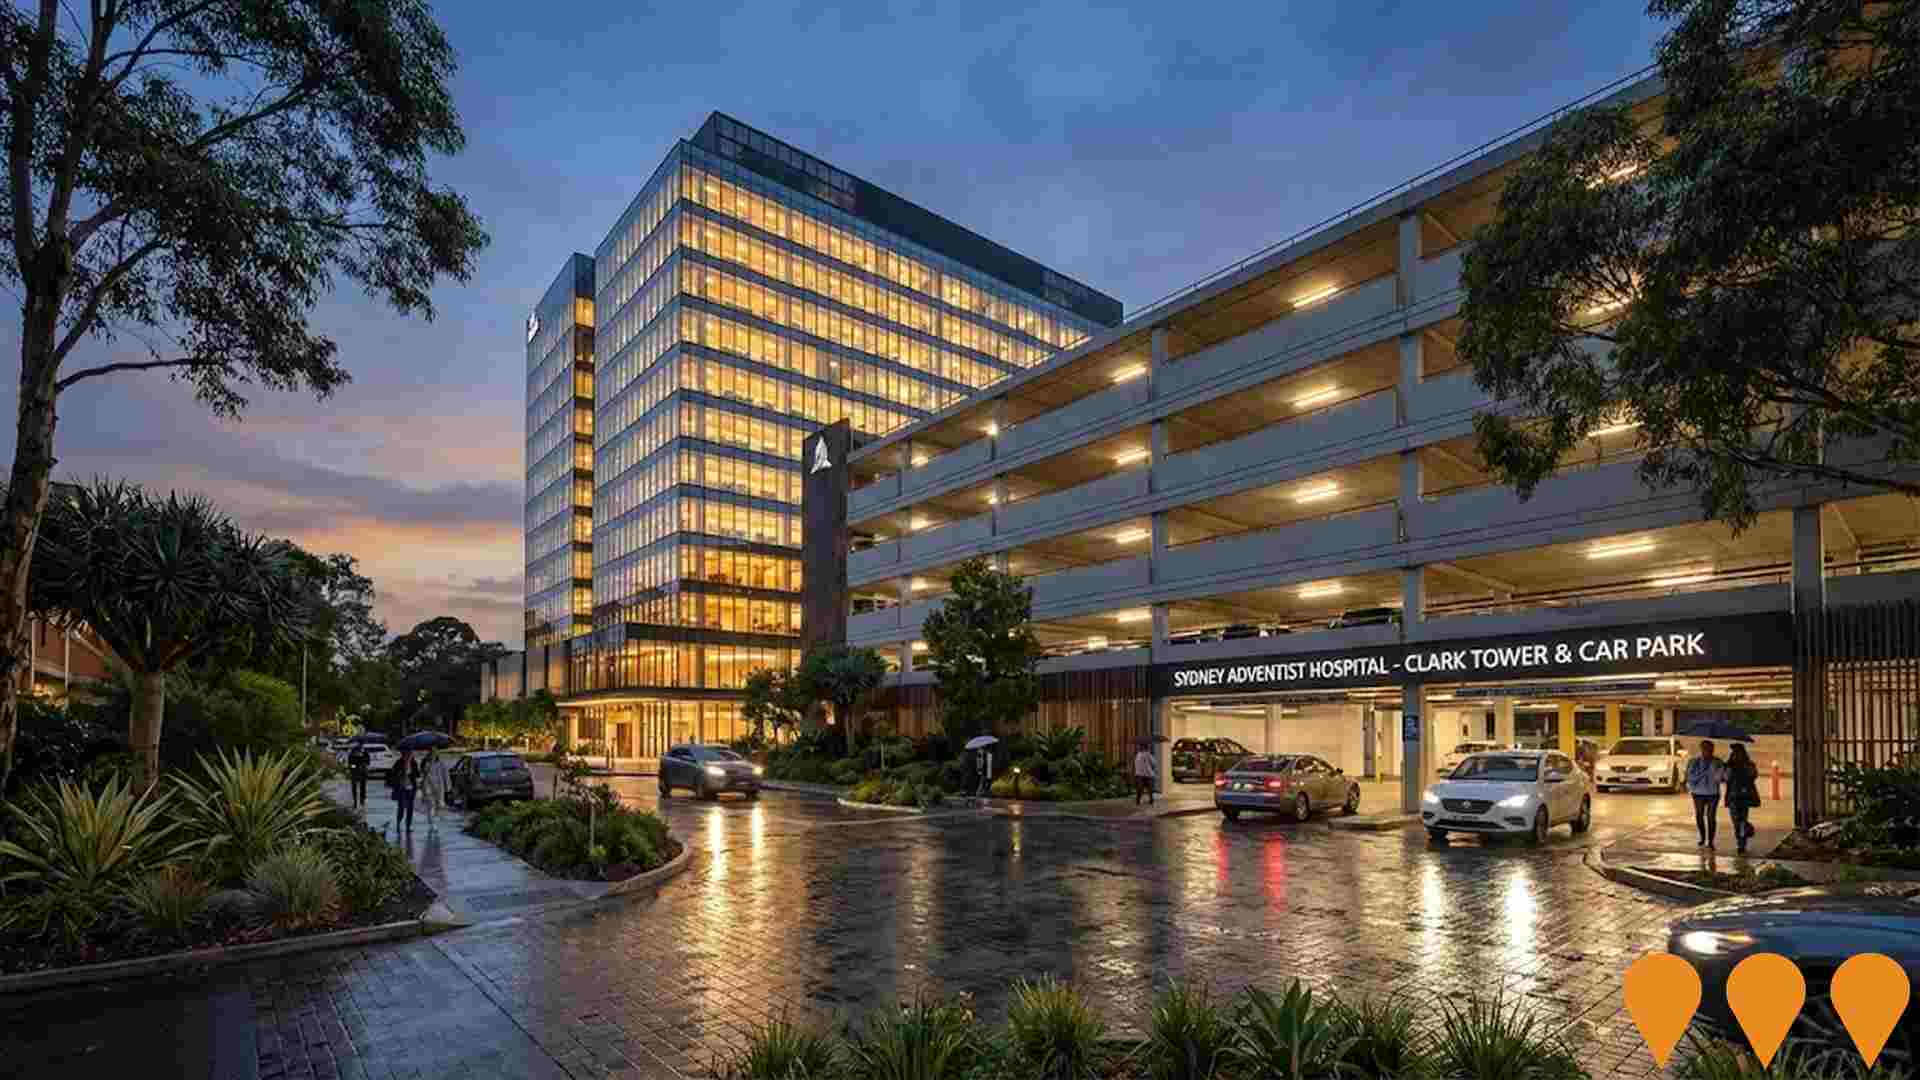
Sydney Adventist Hospital Redevelopment
Major hospital redevelopment delivering new 12-storey Clinical Services Building (Clark Tower), 5-storey car park, and expanded facilities. Largest redevelopment in the hospital's history, enhancing health services for Upper North Shore community.
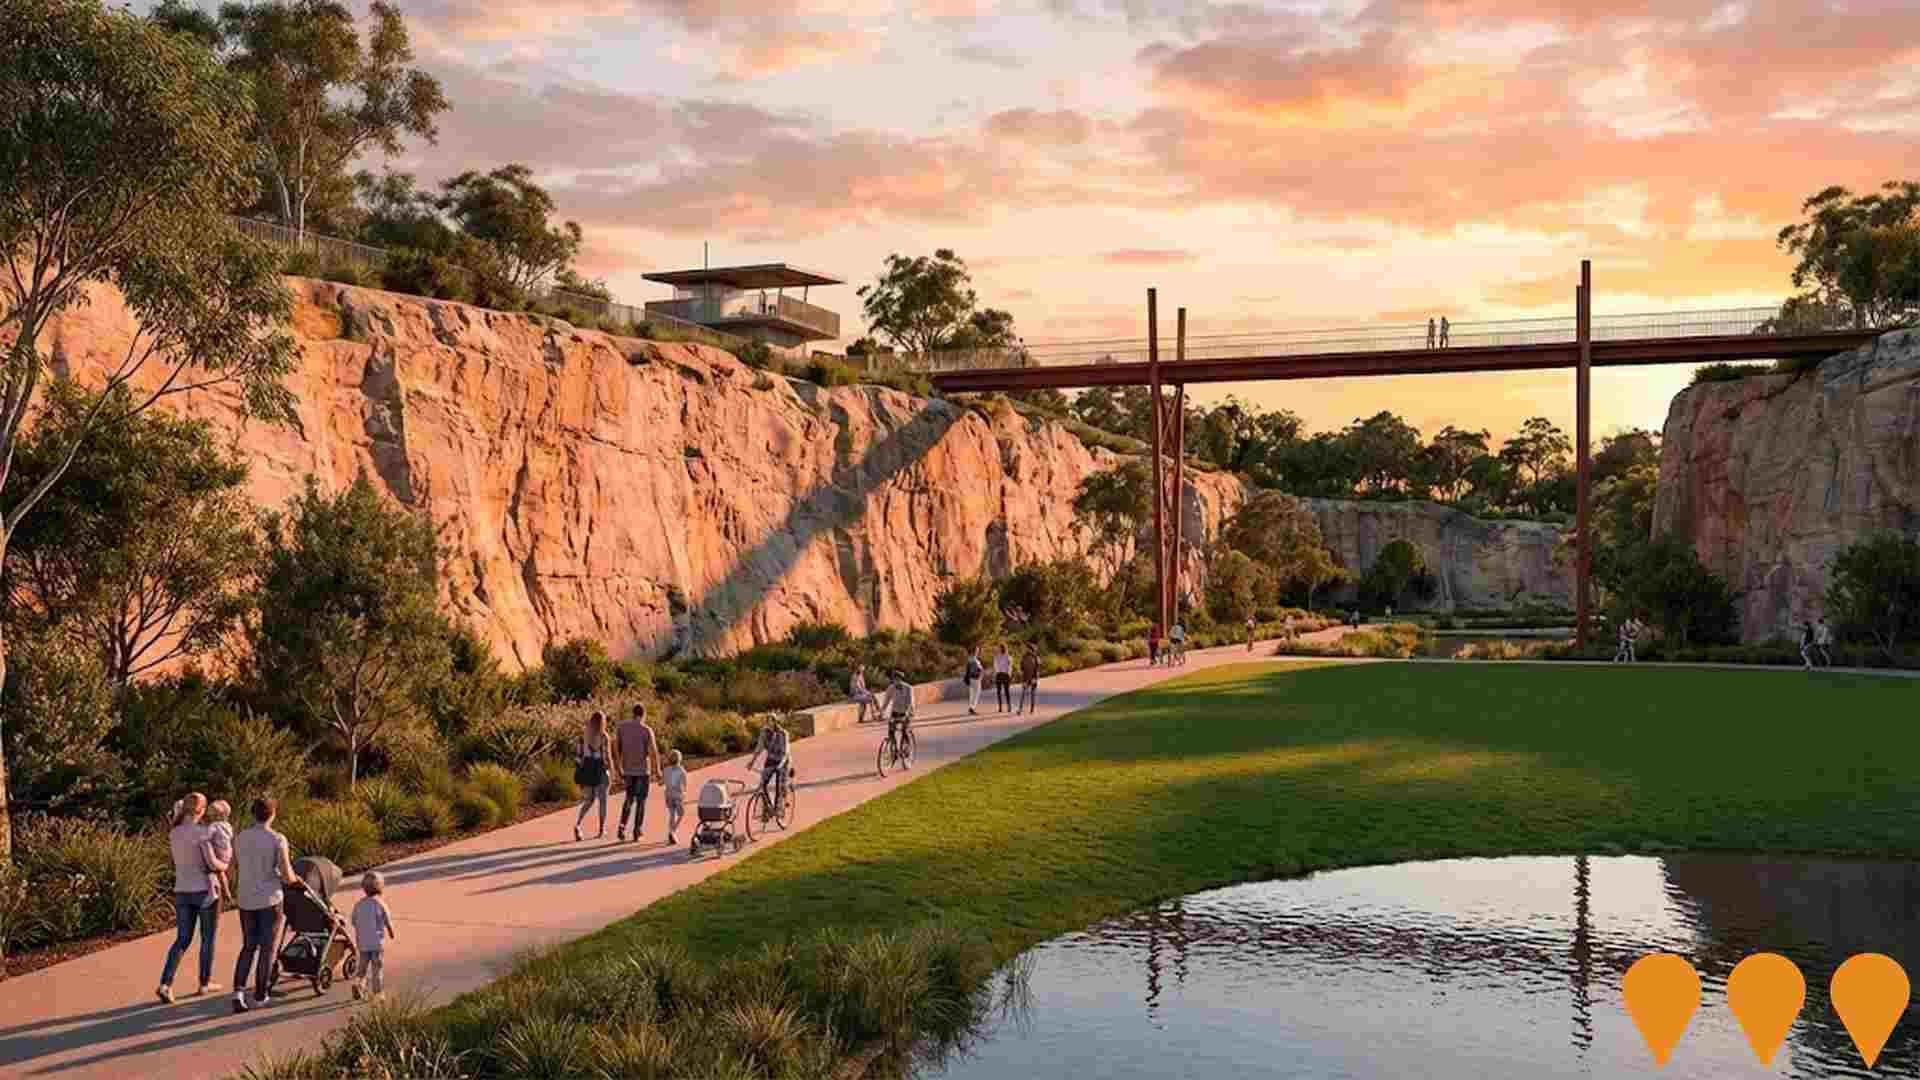
Hornsby Park
Transformation of the 60-hectare former Hornsby Quarry into a major parkland. Stage 1, opening mid-2026, features the 'Crusher Plant' precinct with a lookout, lawn, and amenities, plus the 'Quarry Loop' shared path. Future stages include the Old Mans Valley 'Field of Play' (commencing 2026), a recreational lake, and wetlands. A proposed canopy skywalk is currently under review.
Twin Towers Hornsby
Mixed-use residential and retail development featuring approximately 249 high-quality apartments in twin towers of 20 storeys and 12 storeys, including supermarket and retail shops, with heritage building relocation and four minutes walk from Hornsby railway station.

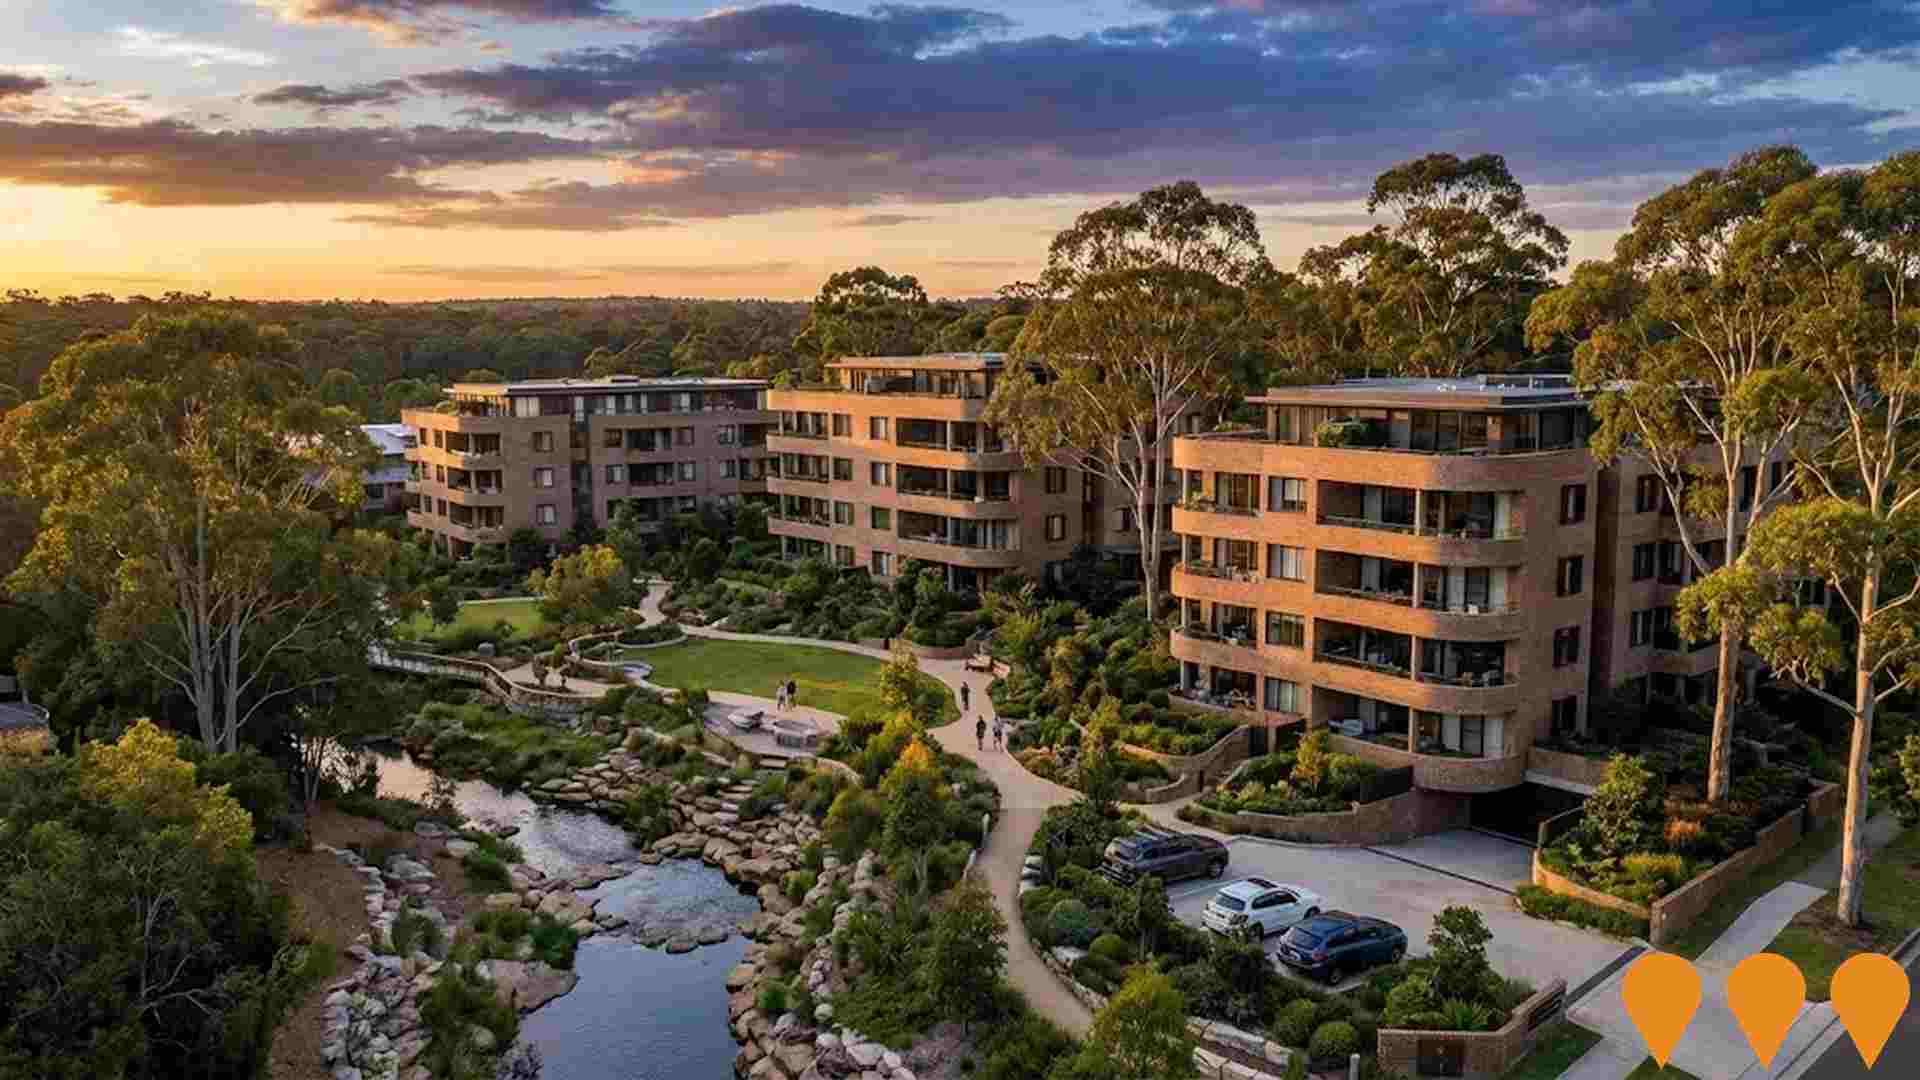
The Residences at Wahroonga Estate
Luxurious residential development featuring 166 apartments across 3-4 buildings on the 64.2ha Wahroonga Estate site. Developed by Capital Corporation for the Seventh-day Adventist Church, featuring curved brick facade design and landscaped communal spaces adjacent to Coupes Creek. The first stage of the re-imagined master planned community of Wahroonga Estate, designed by international award-winning architects Group GSA with bespoke interiors by Coco Republic.
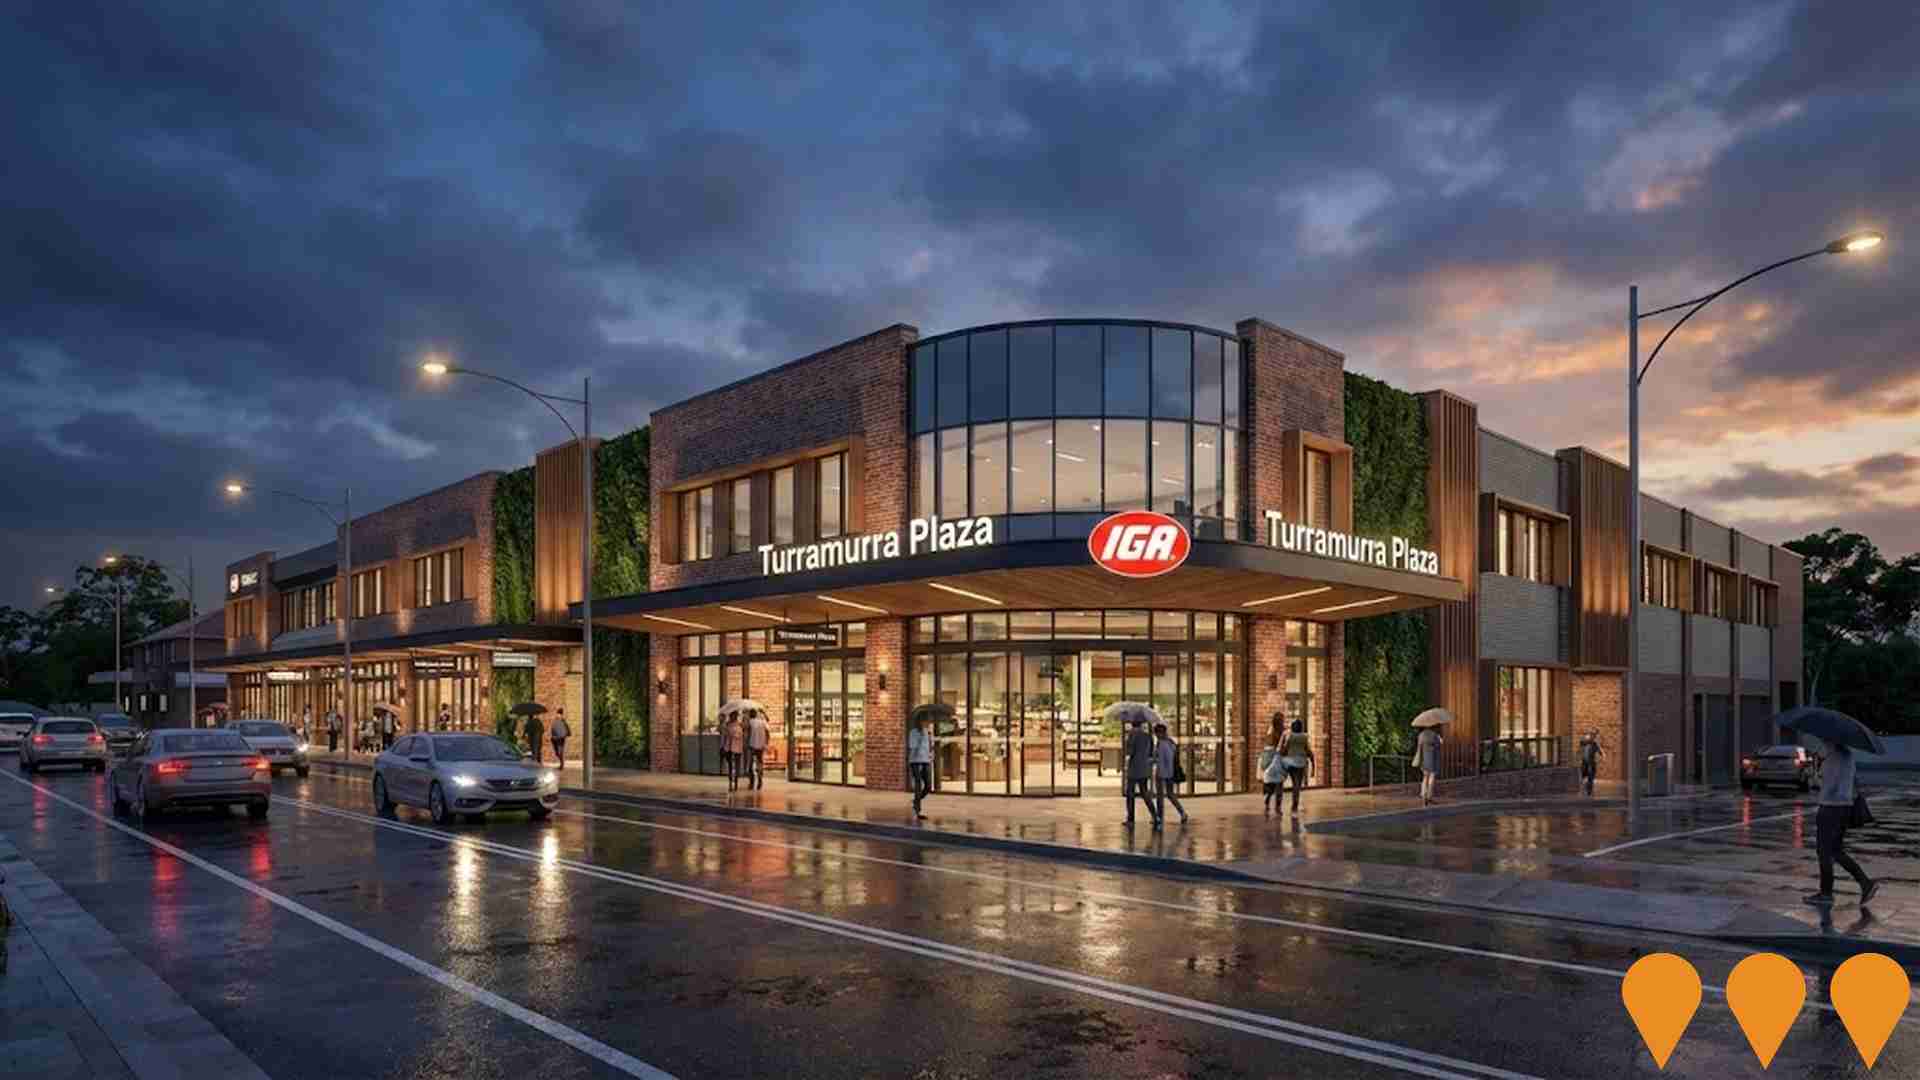
Turramurra Plaza Redevelopment
Redevelopment of existing shopping center with expanded retail space, improved parking facilities, and enhanced community amenities. Modern design with sustainable features.
Braeside Street Road Upgrade
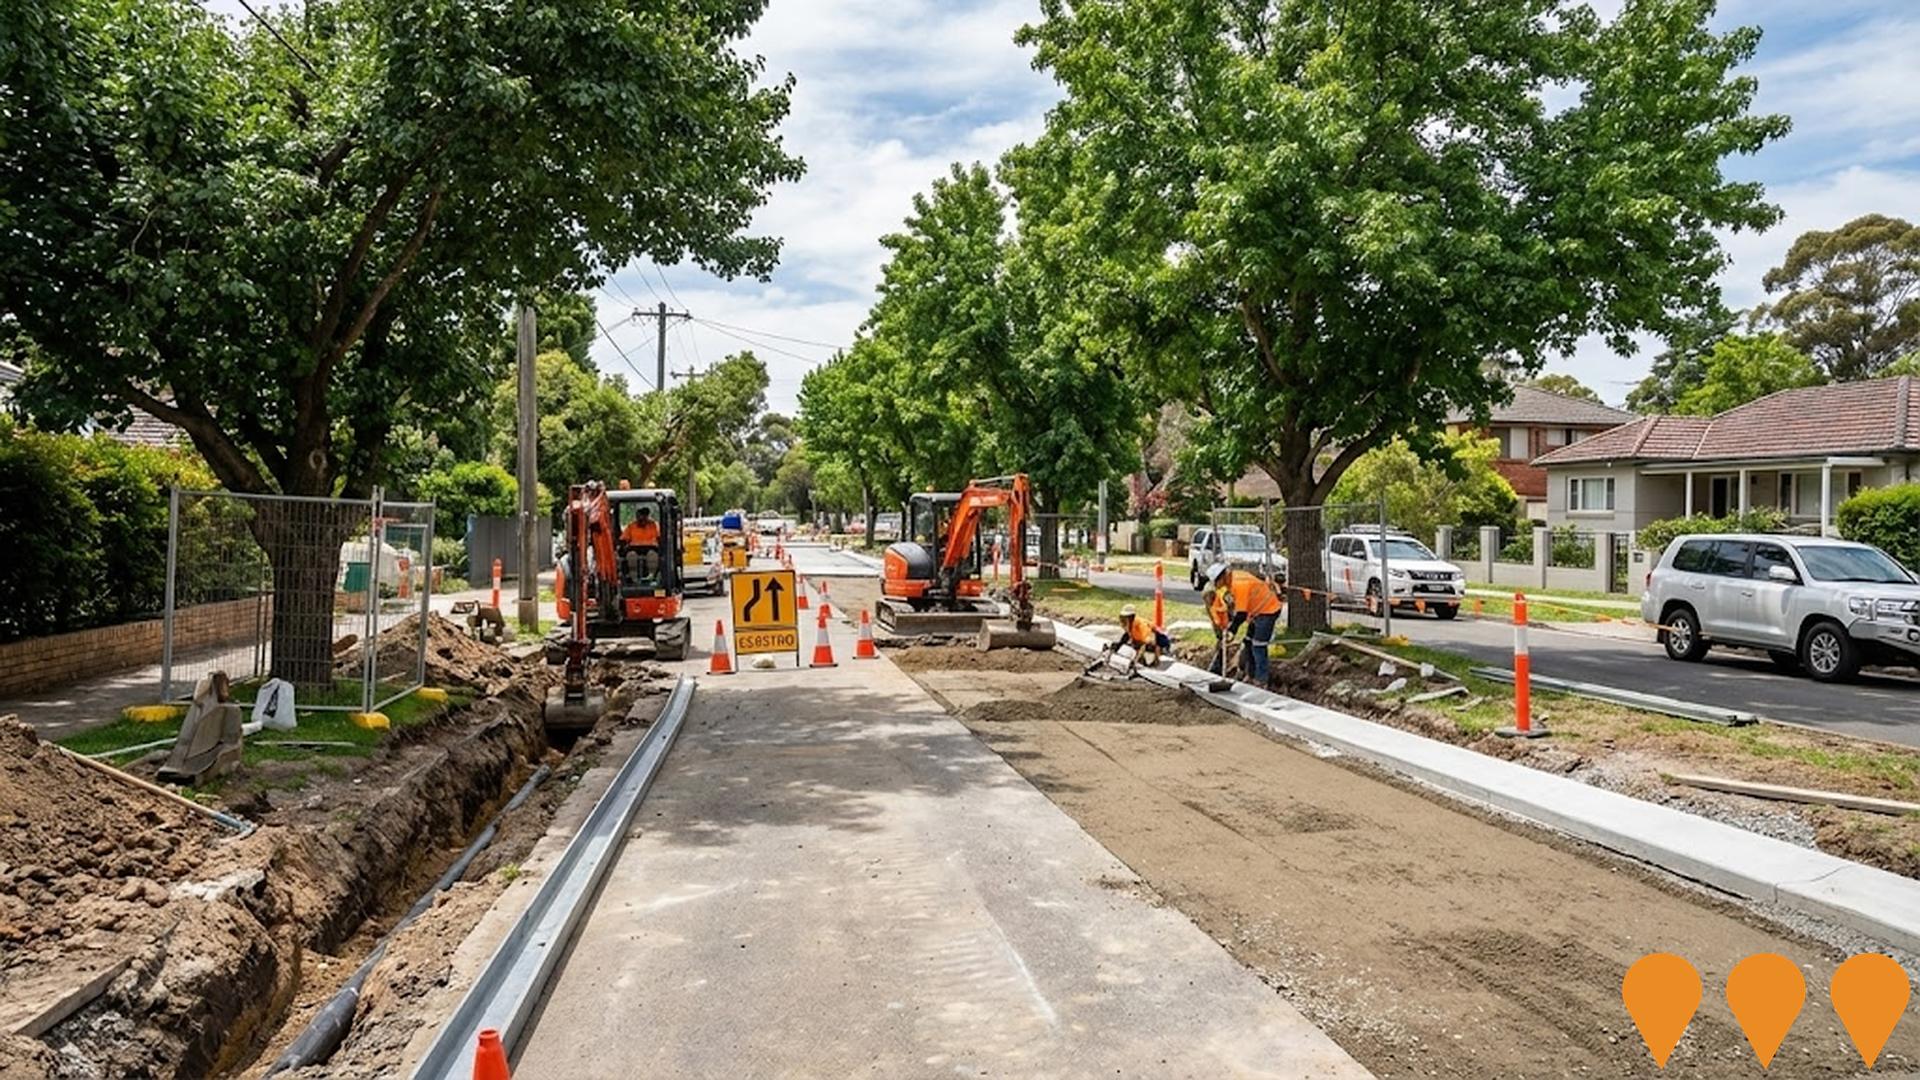
Ku-ring-gai Council is preparing the first stage of upgrades to Braeside Street in Wahroonga (between Eastern Road and Westbrook Avenue). Works include new drainage infrastructure, kerb and gutter construction, pavement rehabilitation and targeted tree management with replanting. The first construction phase is scheduled for early 2026, subject to environmental approvals and Council tendering.
Employment
Wahroonga (East) - Warrawee has seen below average employment performance when compared to national benchmarks
Wahroonga East - Warrawee has a highly educated workforce with notable representation in the technology sector. The unemployment rate as of September 2025 is 4.3%.
In this period, 9,101 residents are employed while the unemployment rate is 0.1% higher than Greater Sydney's rate of 4.2%. Workforce participation is similar to Greater Sydney's 60.0%. The leading employment industries among residents include professional & technical, health care & social assistance, and finance & insurance. The area has a particular specialization in professional & technical services, with an employment share 1.6 times the regional level.
Conversely, construction has limited presence with only 5.0% of employment compared to the regional average of 8.6%. Over the year ending September 2025, labour force levels increased by 0.1%, but employment decreased by 1.7%, leading to a rise in unemployment rate by 1.8 percentage points. In comparison, Greater Sydney saw employment grow by 2.1% and labour force expand by 2.4%, with unemployment rising by only 0.2%. State-level data from NSW as of 25-Nov shows employment contracted by 0.03%, losing 2,260 jobs, with an unemployment rate of 3.9%, lower than the national average of 4.3%. National employment forecasts from May-25 project a 6.6% increase over five years and 13.7% over ten years. Applying these projections to Wahroonga East - Warrawee's employment mix suggests local employment should grow by 7.7% over five years and 15.4% over ten years, though these are simple extrapolations for illustrative purposes only.
Frequently Asked Questions - Employment
Income
Income metrics indicate excellent economic conditions, with the area achieving higher performance than 75% of national locations assessed by AreaSearch
AreaSearch's aggregation of latest postcode level ATO data released for financial year 2022 shows Wahroonga (East) - Warrawee SA2 had a median taxpayer income of $63,857 and an average of $114,778. These figures place the area in the top percentile nationally, compared to Greater Sydney's levels of $56,994 and $80,856 respectively. Based on 12.61% growth since financial year 2022, current estimates for September 2025 would be approximately $71,909 (median) and $129,252 (average). Census 2021 income data ranks Wahroonga (East) - Warrawee's household, family, and personal incomes highly, between the 86th and 98th percentiles nationally. The area has a significant proportion of residents earning over $4,000 per week, with 53.2% supporting premium retail and service offerings. Housing accounts for 13.9% of income, while strong earnings place residents in the 98th percentile for disposable income. The area's SEIFA income ranking places it in the 10th decile.
Frequently Asked Questions - Income
Housing
Wahroonga (East) - Warrawee is characterized by a predominantly suburban housing profile, with above-average rates of outright home ownership
In Wahroonga (East) - Warrawee, as per the latest Census evaluation, 75.1% of dwellings were houses, with the remaining 25.0% comprising semi-detached homes, apartments, and other types. This contrasts with Sydney metropolitan areas' 68.8% houses and 31.3% other dwellings. Home ownership in Wahroonga (East) - Warrawee stood at 42.5%, mirroring the Sydney metro average, with mortgaged properties at 41.1% and rented dwellings at 16.4%. The median monthly mortgage repayment in the area was $3,600, exceeding the Sydney metro average of $3,500. Meanwhile, the median weekly rent was $650, compared to Sydney's $630. Nationally, Wahroonga (East) - Warrawee's mortgage repayments were significantly higher than the Australian average of $1,863, and rents were substantially above the national figure of $375.
Frequently Asked Questions - Housing
Household Composition
Wahroonga (East) - Warrawee features high concentrations of family households, with a fairly typical median household size
Family households constitute 83.9% of all households, including 48.1% couples with children, 26.4% couples without children, and 8.7% single parent families. Non-family households account for the remaining 16.1%, with lone person households at 15.0% and group households comprising 1.0% of the total. The median household size is 2.9 people, which aligns with the Greater Sydney average.
Frequently Asked Questions - Households
Local Schools & Education
Wahroonga (East) - Warrawee demonstrates exceptional educational outcomes, ranking among the top 5% of areas nationally based on AreaSearch's comprehensive analysis of qualification and performance metrics
Educational attainment in Wahroonga (East) - Warrawee is notable with 55.9% of residents aged 15 years and over holding university qualifications compared to the national average of 30.4% and the NSW average of 32.2%. Bachelor degrees are the most common at 34.4%, followed by postgraduate qualifications (17.7%) and graduate diplomas (3.8%). Vocational pathways account for 18.5% of qualifications among those aged 15 years and over, with advanced diplomas at 10.2% and certificates at 8.3%. Educational participation is high with 33.5% of residents currently enrolled in formal education.
This includes 10.7% in secondary education, 10.2% in primary education, and 8.2% pursuing tertiary education.
Frequently Asked Questions - Education
Schools Detail
Nearby Services & Amenities
Transport
Transport servicing is good compared to other areas nationally based on assessment of service frequency, route connectivity and accessibility
Wahroonga (East) - Warrawee has 124 active public transport stops. These are a mix of train and bus stops, served by 56 different routes. The total weekly passenger trips across these routes is 4033.
Residents have excellent accessibility to transport, with an average distance of 184 meters to the nearest stop. There are approximately 576 trips per day across all routes, which equates to around 32 weekly trips per individual stop.
Frequently Asked Questions - Transport
Transport Stops Detail
Health
Wahroonga (East) - Warrawee's residents boast exceedingly positive health performance metrics with very low prevalence of common health conditions across all age groups
Health outcomes data shows excellent results for Wahroonga (East) - Warrawee, with very low prevalence of common health conditions across all age groups. The rate of private health cover is exceptionally high at approximately 78% of the total population, which consists of 14,142 people. This compares to a rate of 79.6% across Greater Sydney, and a national average of 55.3%.
The most common medical conditions in the area are arthritis and asthma, affecting 6.4% and 6.3% of residents respectively. A total of 74.1% of residents declare themselves completely clear of medical ailments, compared to 76.0% across Greater Sydney. In this area, 20.9% of residents are aged 65 and over, totalling 3,812 people. Health outcomes among seniors are particularly strong, broadly aligning with the general population's health profile.
Frequently Asked Questions - Health
Cultural Diversity
Wahroonga (East) - Warrawee was found to be more culturally diverse than the vast majority of local markets in Australia, upon assessment of a range of language and cultural background related metrics
Wahroonga East-Warrawee scores high in cultural diversity with 28.0% of its population speaking a language other than English at home, as of 2016 Census data. Additionally, 39.0% of the population was born overseas during this period. Christianity is the main religion in Wahroonga East-Warrawee, comprising 52.7% of people, according to the 2016 Census.
However, Judaism is overrepresented at 0.6%, compared to Greater Sydney's average of 2.5%. In terms of ancestry, the top three groups are English (24.6%), Australian (18.8%), and Chinese (12.3%). Notably, South African ancestry is overrepresented at 1.7% compared to the regional average of 1.6%, while Korean ancestry is underrepresented at 1.7% versus 2.3%. Sri Lankan ancestry is also underrepresented at 0.6% compared to the region's 0.4%.
Frequently Asked Questions - Diversity
Age
Wahroonga (East) - Warrawee's median age exceeds the national pattern
The median age in Wahroonga (East) - Warrawee is 43 years, significantly higher than Greater Sydney's average of 37 years and exceeding the national average of 38 years. The age profile shows that individuals aged 45-54 are most prominent at 15.8%, while those aged 25-34 comprise only 5.3%. Between 2021 and present, the 15-24 age group has increased from 14.2% to 16.2%, and the 75-84 cohort has risen from 6.9% to 8.0%. Conversely, the 25-34 age group has decreased from 6.4% to 5.3%. By 2041, demographic projections indicate significant shifts in Wahroonga (East) - Warrawee's age structure. The 85+ age cohort is projected to grow by 809 people, increasing from 666 to 1,476, a rise of 122%. Notably, the combined 65+ age groups will account for 91% of total population growth, reflecting the area's aging demographic profile. Conversely, the 25-34 and 0-4 age cohorts are expected to experience population declines.
