Chart Color Schemes
est. as @ -- *
ABS ERP | -- people | --
2021 Census | -- people
Sales Activity
Curious about local property values? Filter the chart to assess the volume and appreciation (including resales) trends and regional comparisons, or scroll to the map below view this information at an individual property level.
Find a Recent Sale
Sales Detail
Population
Cootamundra is positioned among the lower quartile of areas assessed nationally for population growth based on AreaSearch's assessment of recent, and medium term trends
Cootamundra's population is 7,744 as of Nov 2025. This reflects an increase of 39 people since the 2021 Census, which reported a population of 7,705. The change is inferred from the estimated resident population of 7,722 in June 2024 and 18 validated new addresses since the Census date. This level of population equates to a density ratio of 4.7 persons per square kilometer. Population growth was primarily driven by overseas migration.
AreaSearch adopted ABS/Geoscience Australia projections for each SA2 area, released in 2024 with 2022 as the base year. For areas not covered, NSW State Government's SA2 level projections were used, released in 2022 with 2021 as the base year. Growth rates by age group are applied to all areas for years 2032 to 2041. Demographic trends anticipate lower quartile growth of regional areas nationally, with Cootamundra expected to expand by 299 persons to 2041 based on latest annual ERP population numbers, reflecting a 3.6% increase over the 17 years.
Frequently Asked Questions - Population
Development
AreaSearch assessment of residential development drivers sees a low level of activity in Cootamundra, placing the area among the bottom 25% of areas assessed nationally
Cootamundra has seen approximately 21 new homes approved annually. From fiscal year 2021 (FY-21) to FY-25, around 109 homes were approved, with an additional 4 approved in FY-26 so far. On average, about 0.2 people moved to the area for each dwelling built during these years.
This indicates that new supply is meeting or exceeding demand, providing ample buyer choices and room for population growth beyond current forecasts. The average expected construction cost value of new dwellings is around $423,000, which aligns with regional patterns. In FY-26, approximately $7.0 million in commercial approvals have been registered, highlighting the area's primarily residential nature. Comparatively, Cootamundra has about two-thirds the rate of new dwelling approvals per person compared to the Rest of NSW.
Nationally, it ranks around the 18th percentile for areas assessed, suggesting more limited choices for buyers and supporting demand for existing homes. This is likely due to the area's maturity and potential planning constraints. New building activity in Cootamundra consists of approximately 93.0% standalone homes and 7.0% medium and high-density housing, maintaining its traditional low-density character focused on family homes appealing to those seeking space. The estimated population count per dwelling approval is around 815 people, reflecting a quiet, low-activity development environment. According to AreaSearch's latest quarterly estimate, Cootamundra is projected to gain approximately 277 residents by 2041. At current development rates, new housing supply should comfortably meet demand, offering good conditions for buyers and potentially supporting growth beyond current population projections.
Frequently Asked Questions - Development
Infrastructure
Cootamundra has moderate levels of nearby infrastructure activity, ranking in the top 50% nationally
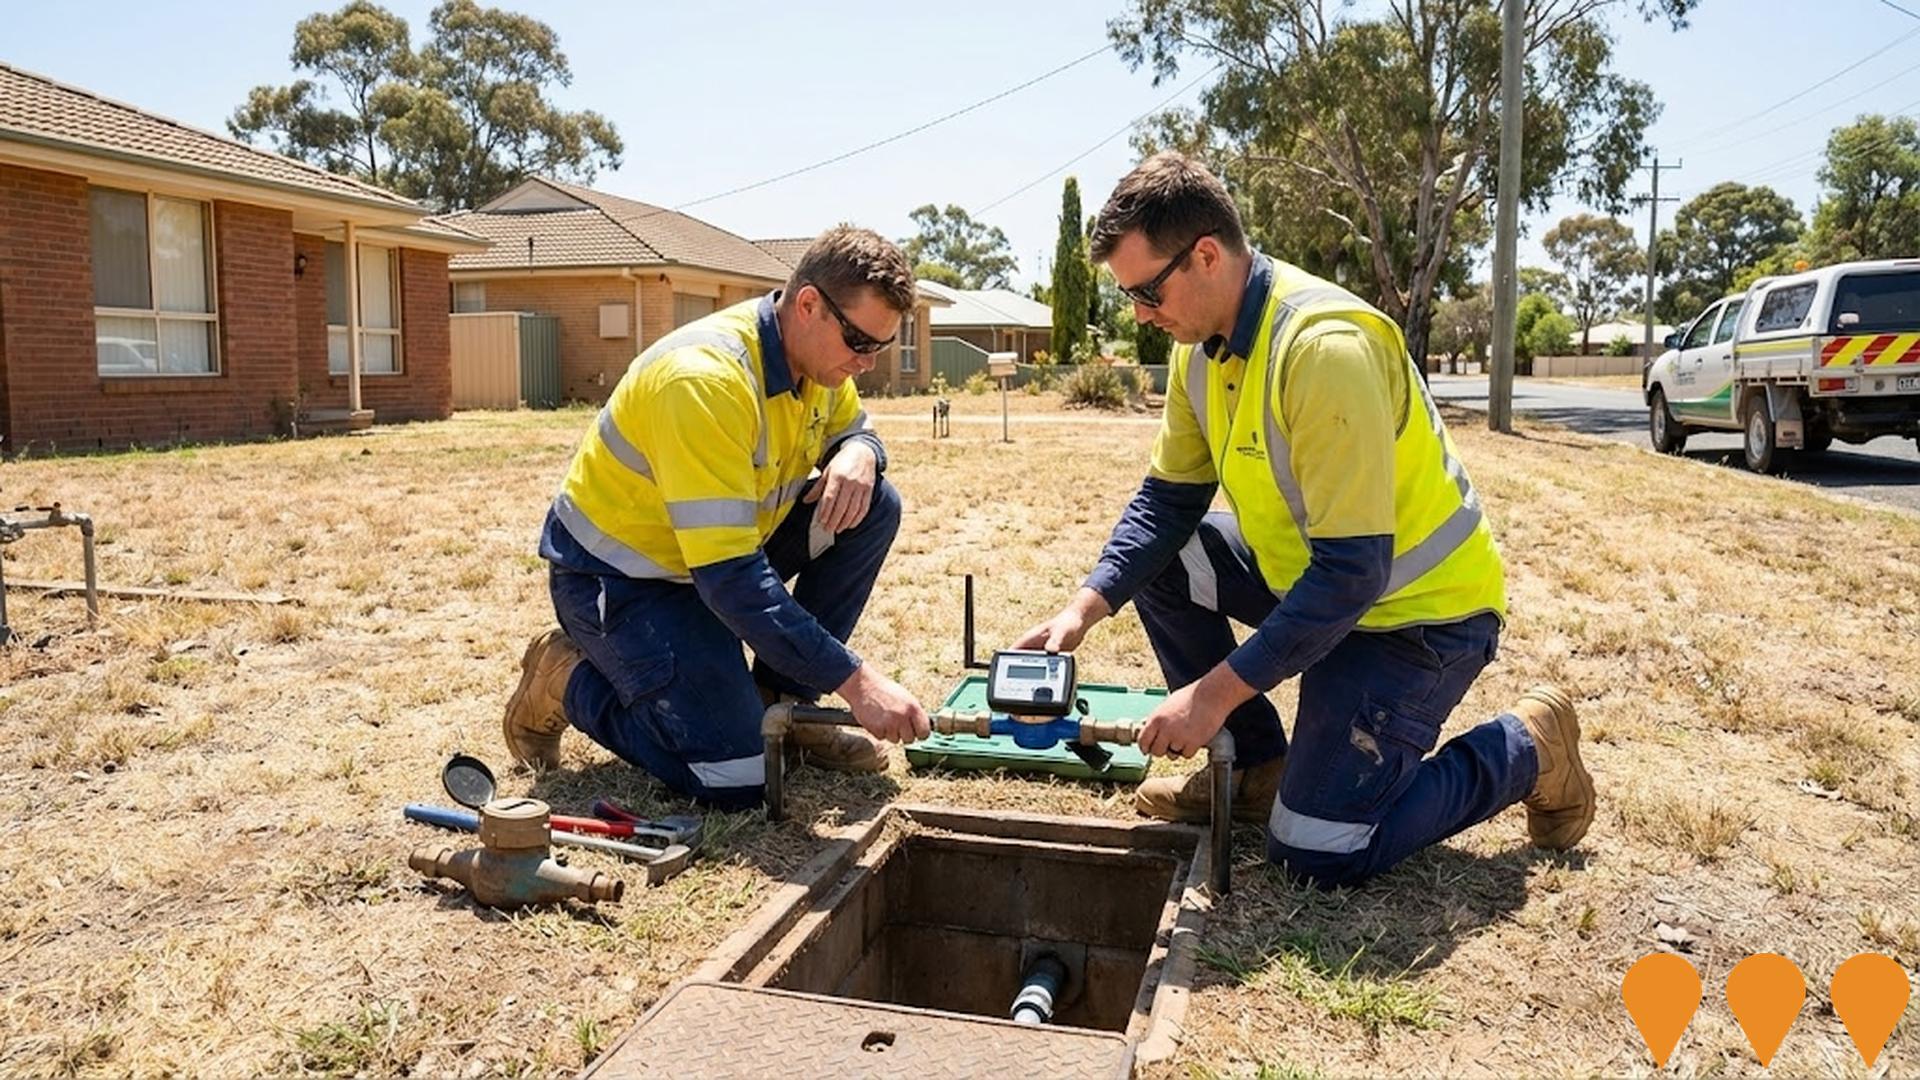
Changes to local infrastructure significantly impact an area's performance. AreaSearch identified three projects likely influencing the region: The Wired Lab - The Church (Muttama Cultural Tourism Project), Inland Rail from Illabo to Stockinbingal, Smart Water Meter Replacement Program, and Cootamundra-Gundagai Regional Council Single Local Environmental Plan Development.
Professional plan users can use the search below to filter and access additional projects.
INFRASTRUCTURE SEARCH
 Denotes AI-based impression for illustrative purposes only, not to be taken as definitive under any circumstances. Please follow links and conduct other investigations from the project's source for actual imagery. Developers and project owners wishing us to use original imagery please Contact Us and we will do so.
Frequently Asked Questions - Infrastructure
The Wired Lab - The Church (Muttama Cultural Tourism Project)
Redevelopment of the deconsecrated Church of the Immaculate Conception at Muttama into 'The Church' - a multi-purpose cultural destination featuring deep listening arts experiences, a Wiradyuri Yarning Circle, an ambisonic sound array, the permanent 'Telepathy' anechoic chamber installation, and adjoining boutique accommodation.

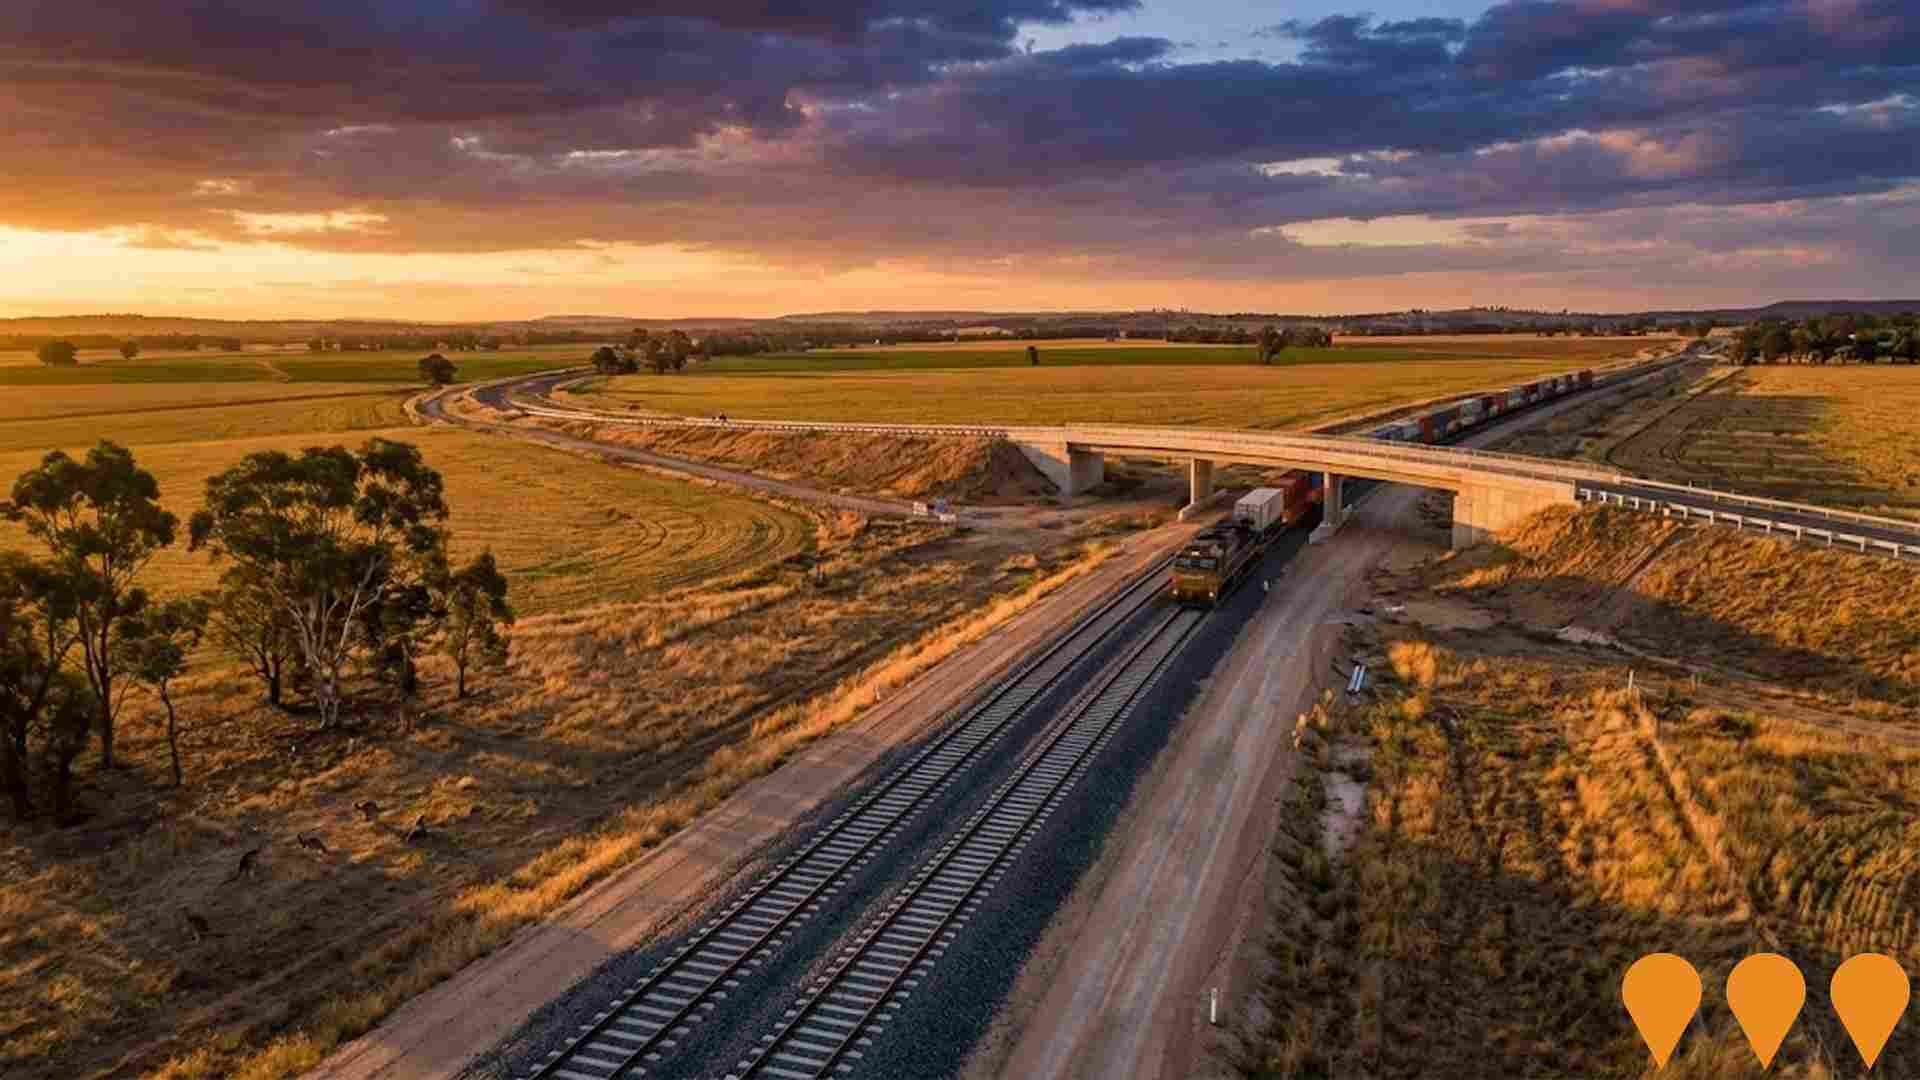
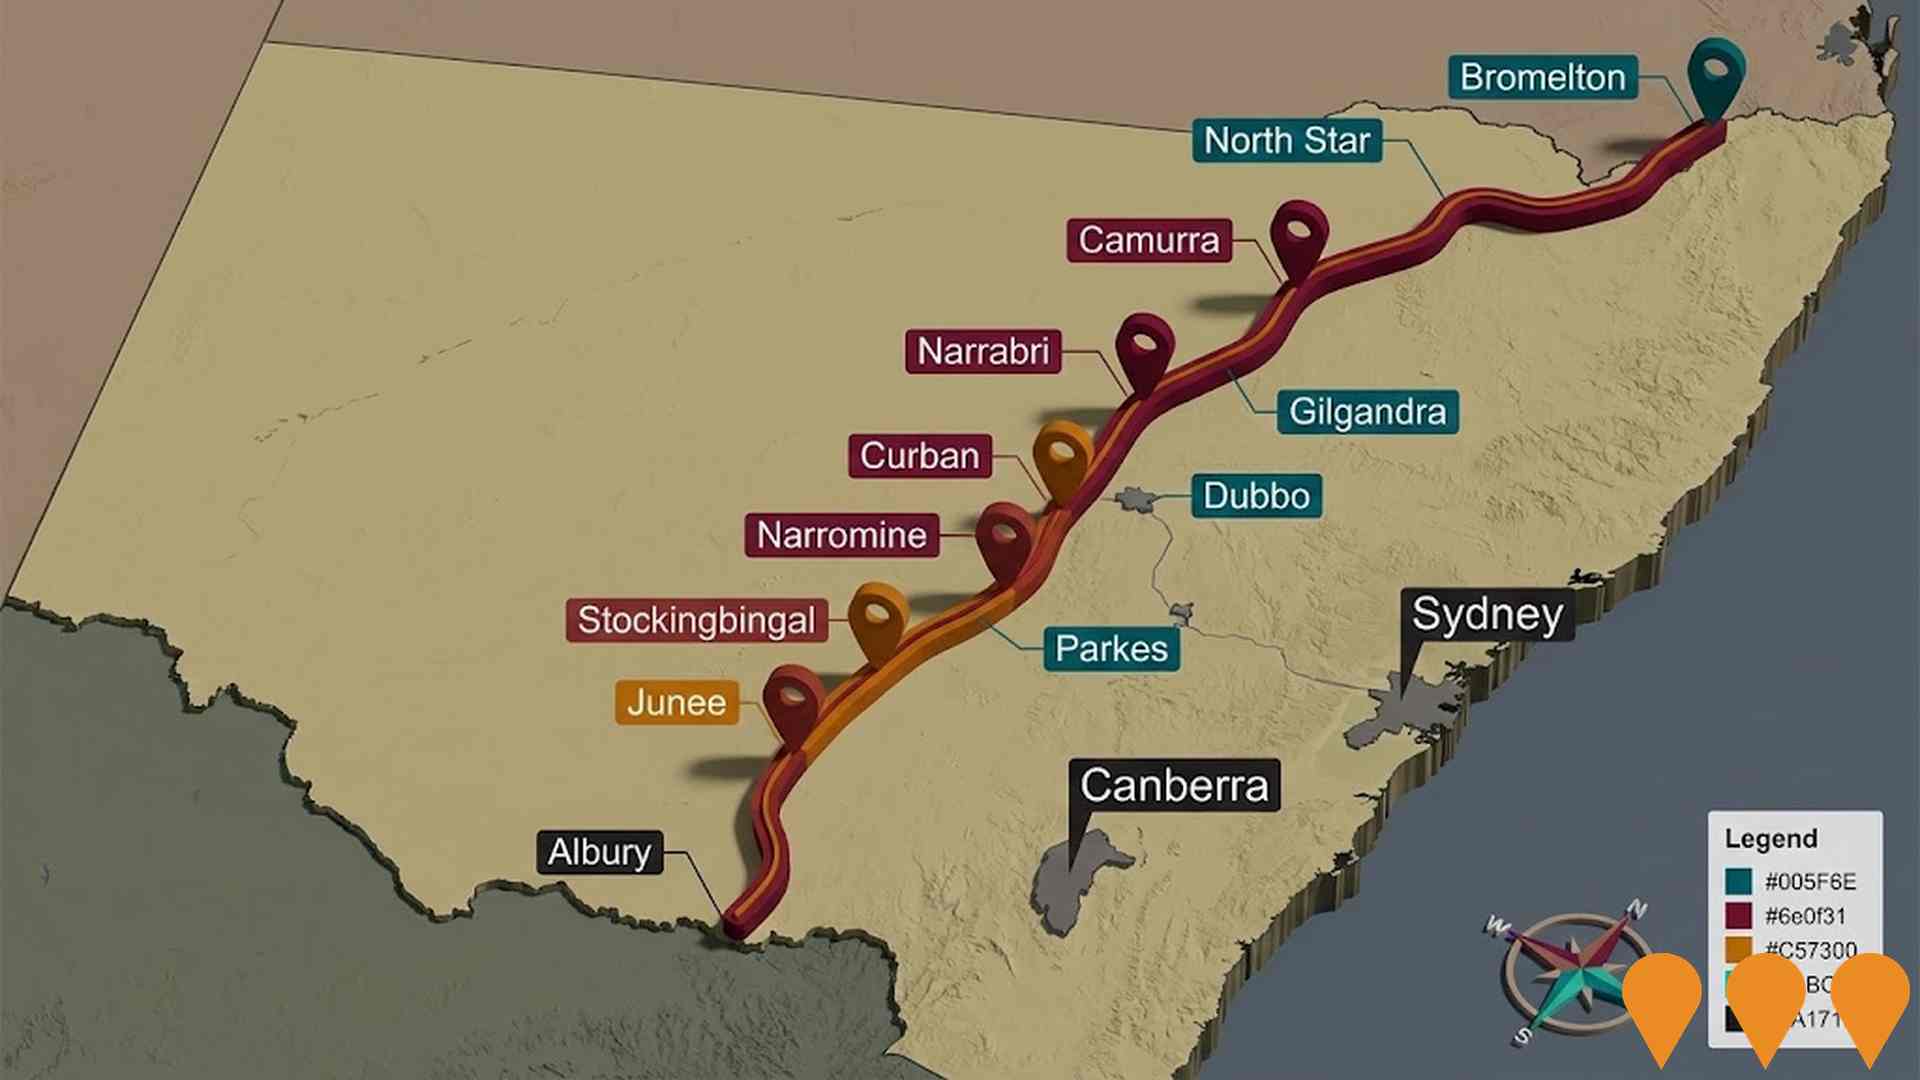
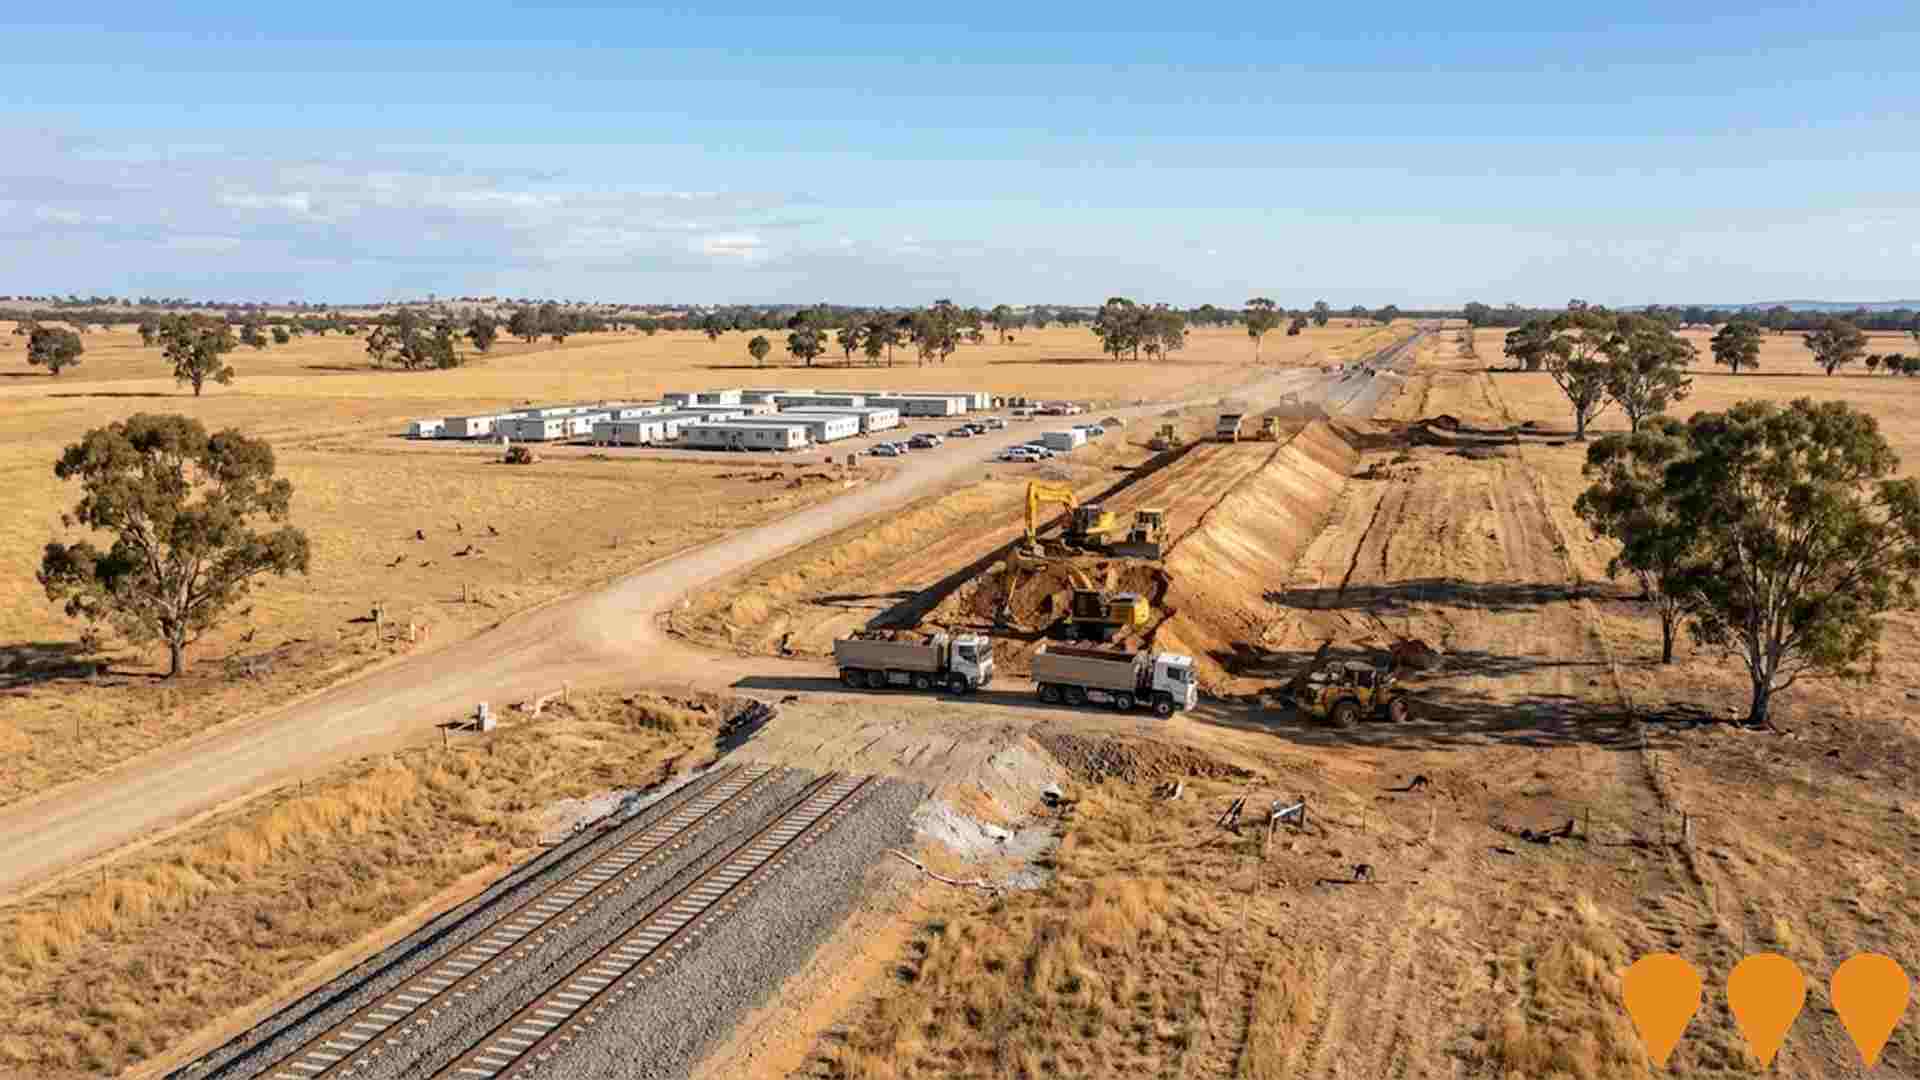
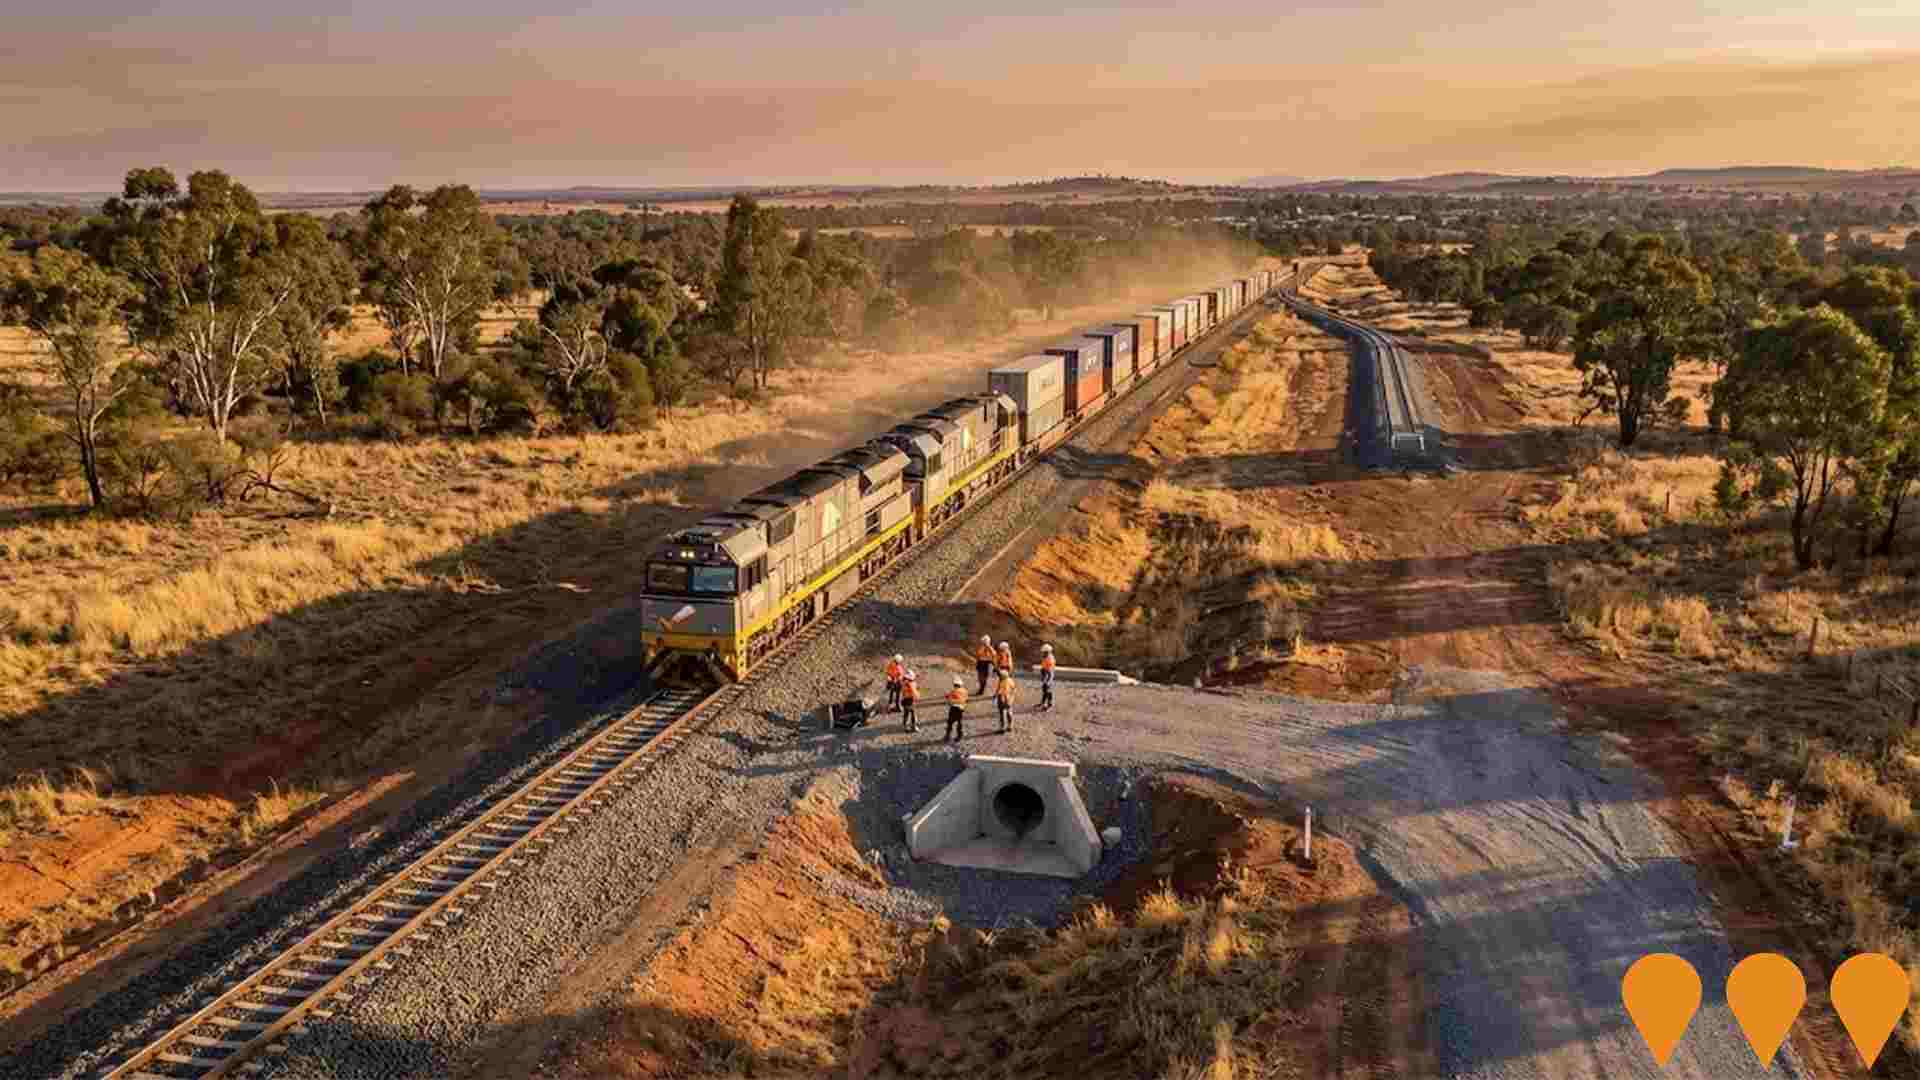
Inland Rail - Illabo to Stockinbingal
This 37 km section of Inland Rail creates a new direct route from east of Illabo tracking north to Stockinbingal, bypassing Cootamundra and Bethungra and the Bethungra Spiral. The project has received all primary environmental approvals from NSW and Australian governments, John Holland was appointed in Oct 2024 to design and construct, enabling works and site investigations have been underway through 2025, a 350 person workers accommodation facility is being built at Stockinbingal, and major construction is expected across many sites from the second half of 2025.
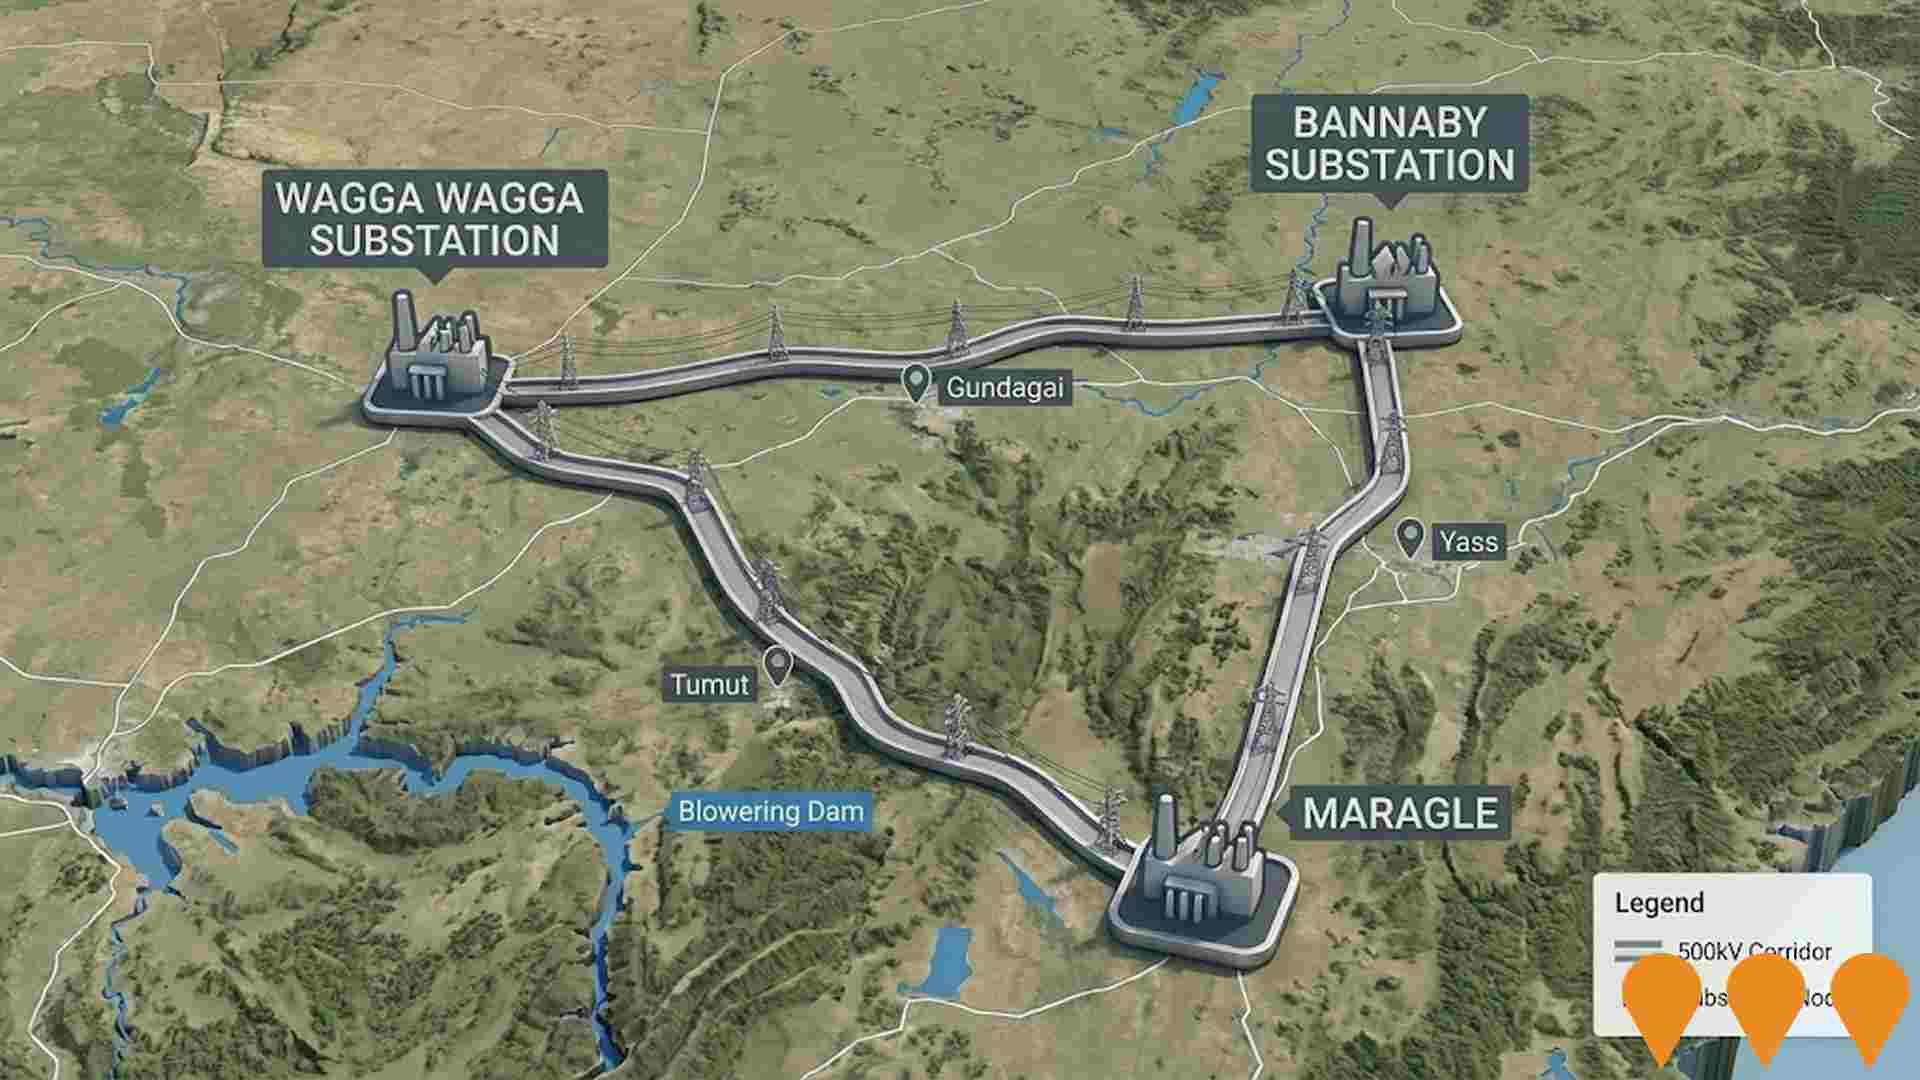
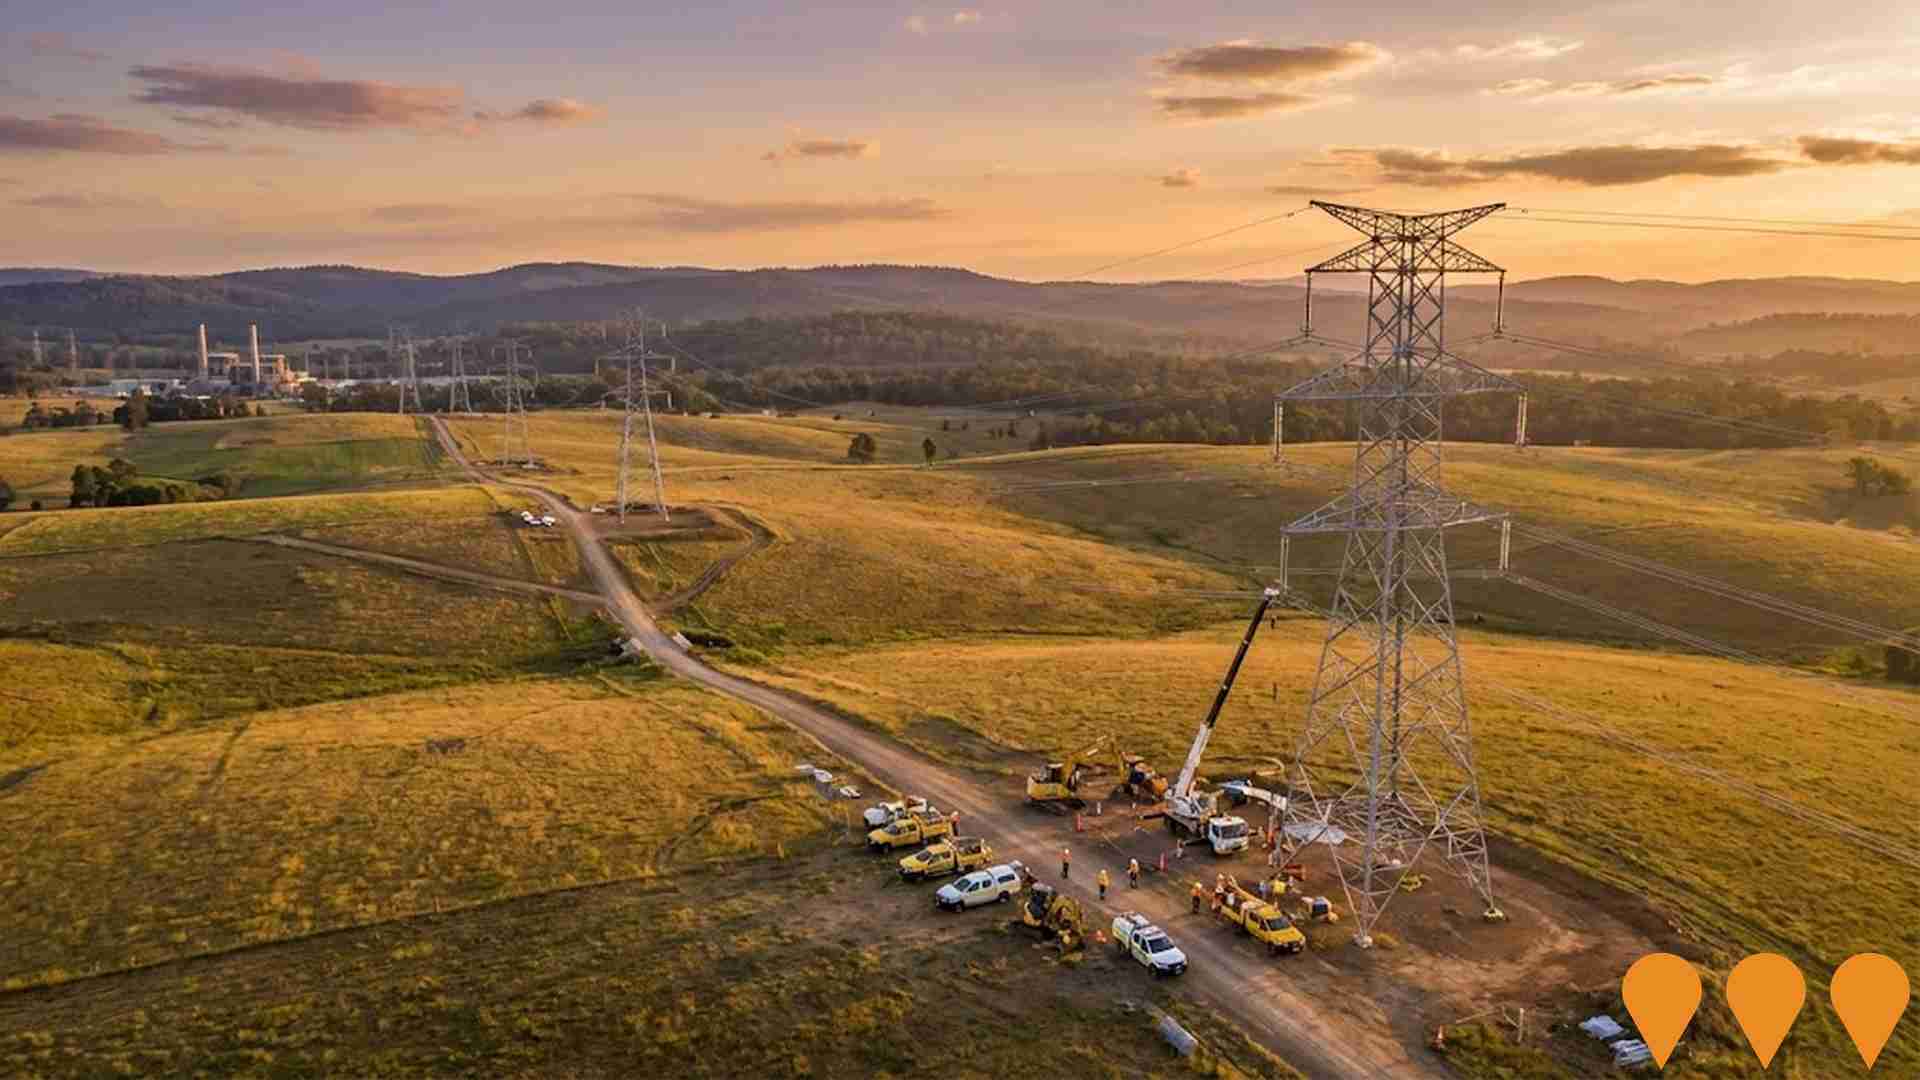
HumeLink
HumeLink is a new 500kV transmission line project connecting Wagga Wagga, Bannaby, and Maragle, spanning approximately 365 km. It includes new or upgraded infrastructure at four locations and aims to enhance the reliability and sustainability of the national electricity grid by increasing the integration of renewable energy sources such as wind and solar.
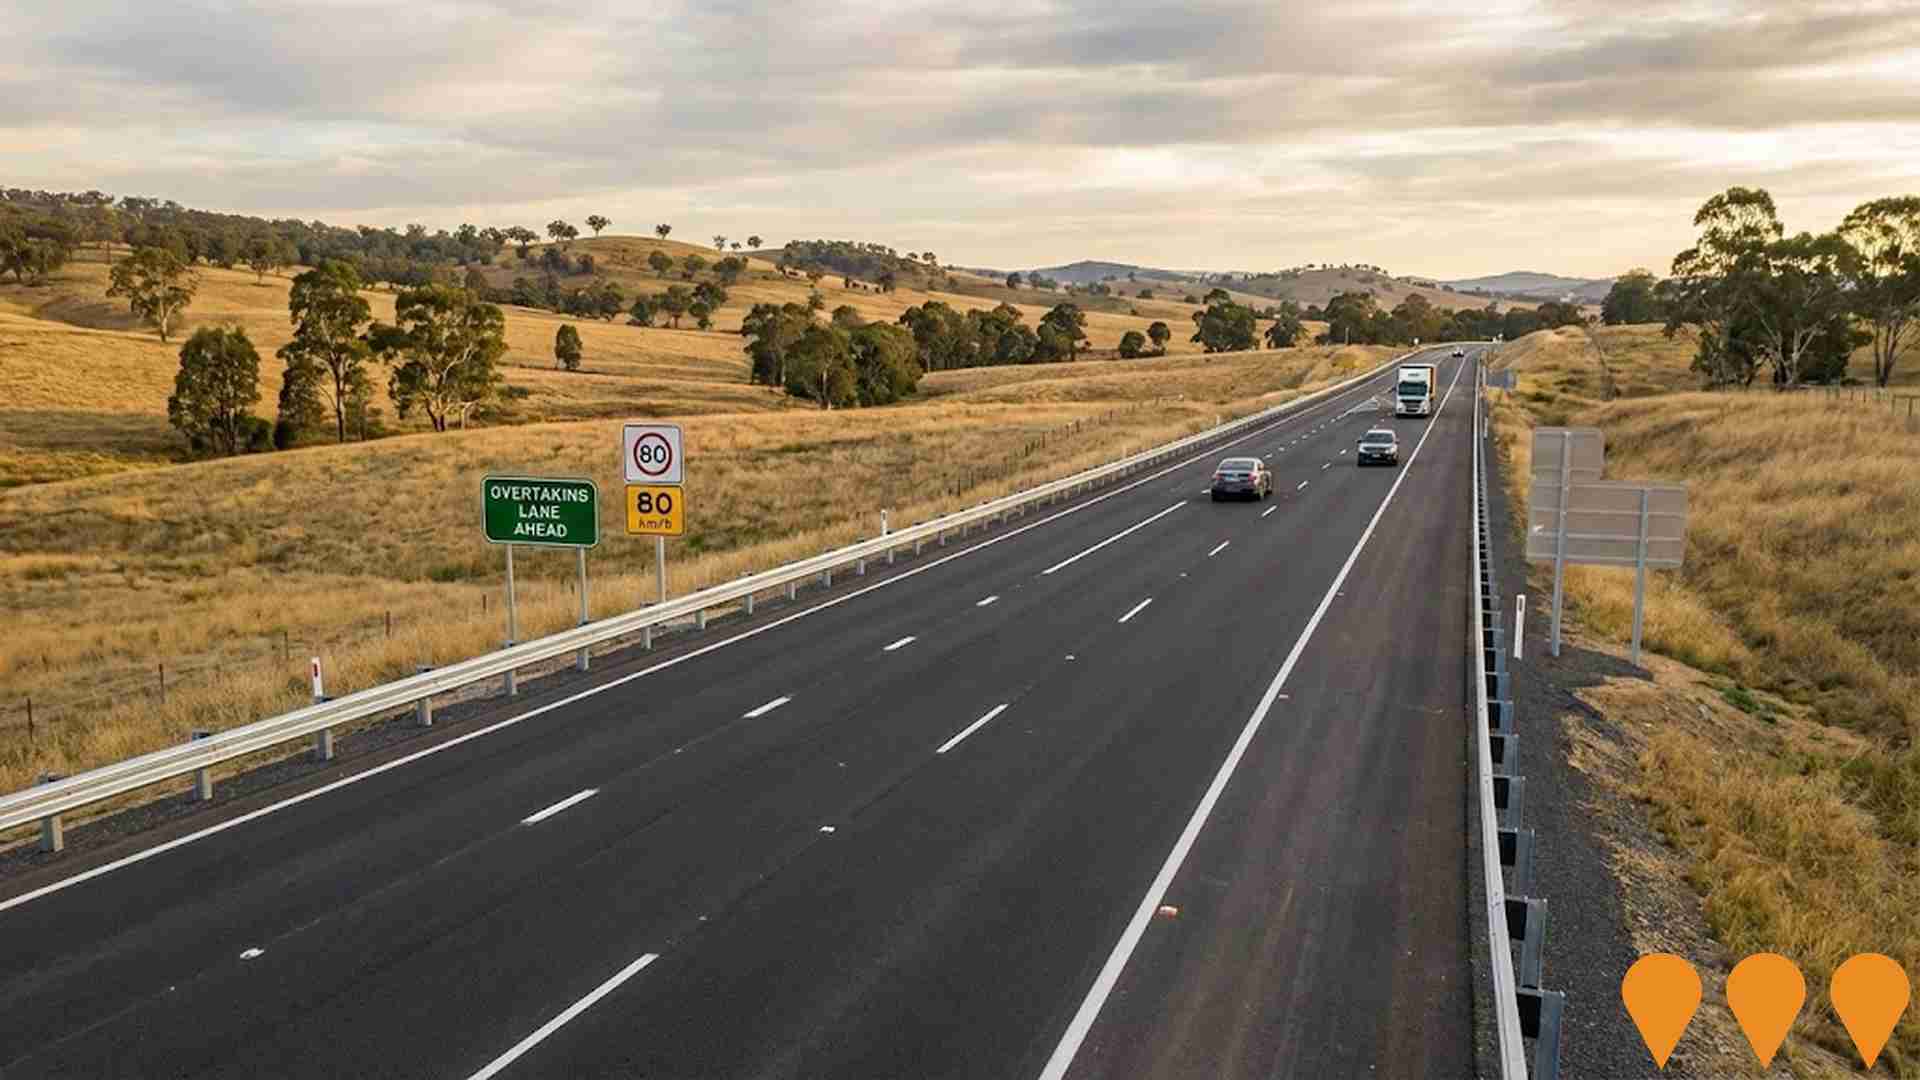
Olympic Highway Safety Improvements
Comprehensive safety upgrade works along the Olympic Highway corridor from Cowra to Table Top, supported by a $26 million funding injection. The project involves overtaking lanes, intersection improvements, shoulder sealing, road widening, and the installation of flexible safety barriers. Recent works have focused on sections near Cowra and Young to reduce crash rates and improve regional traffic flow.
Jeremiah Wind Farm
The proposed Jeremiah Wind Farm is a 400MW renewable energy project by Squadron Energy located on Wiradjuri Country, approximately 25km east of Gundagai, NSW. The wind farm will comprise 65 wind turbines with 6MW GE Vernova turbines and include a 150MW battery energy storage system. The project is expected to power over 200,000 homes and prevent approximately 560,000 tonnes of carbon emissions annually. Construction is expected to create up to 262 jobs during the build phase and 12 ongoing operational jobs. The project will connect to the Lower Tumut-Yass transmission line and is part of Squadron Energy's 14GW renewable energy development pipeline. An Environmental Impact Statement has been completed and the project is progressing through planning approvals.

Inland Rail - Stockinbingal to Parkes
The Stockinbingal to Parkes section of the Inland Rail project involves enhancement of the existing 170km rail corridor between Stockinbingal and Parkes to accommodate double-stacked freight trains. Works include upgrading bridges, tracks, installation of a new crossing loop at Daroobalgie, and modifications to structures and utilities. Major construction works by contractor Martinus Rail are nearing completion with handover scheduled for mid-2025.
HumeLink East
HumeLink East is Transgrid's eastern package of the HumeLink transmission project. It delivers about 237 km of new 500 kV double-circuit overhead transmission lines from Bannaby to the Wondalga interface point and upgrades the existing 500 kV Bannaby substation. Transgrid has engaged Acciona and Genus in joint venture to design and construct the package. Enabling works began in early 2025, with main construction targeted to commence from mid to late August 2025 pending planning approvals.
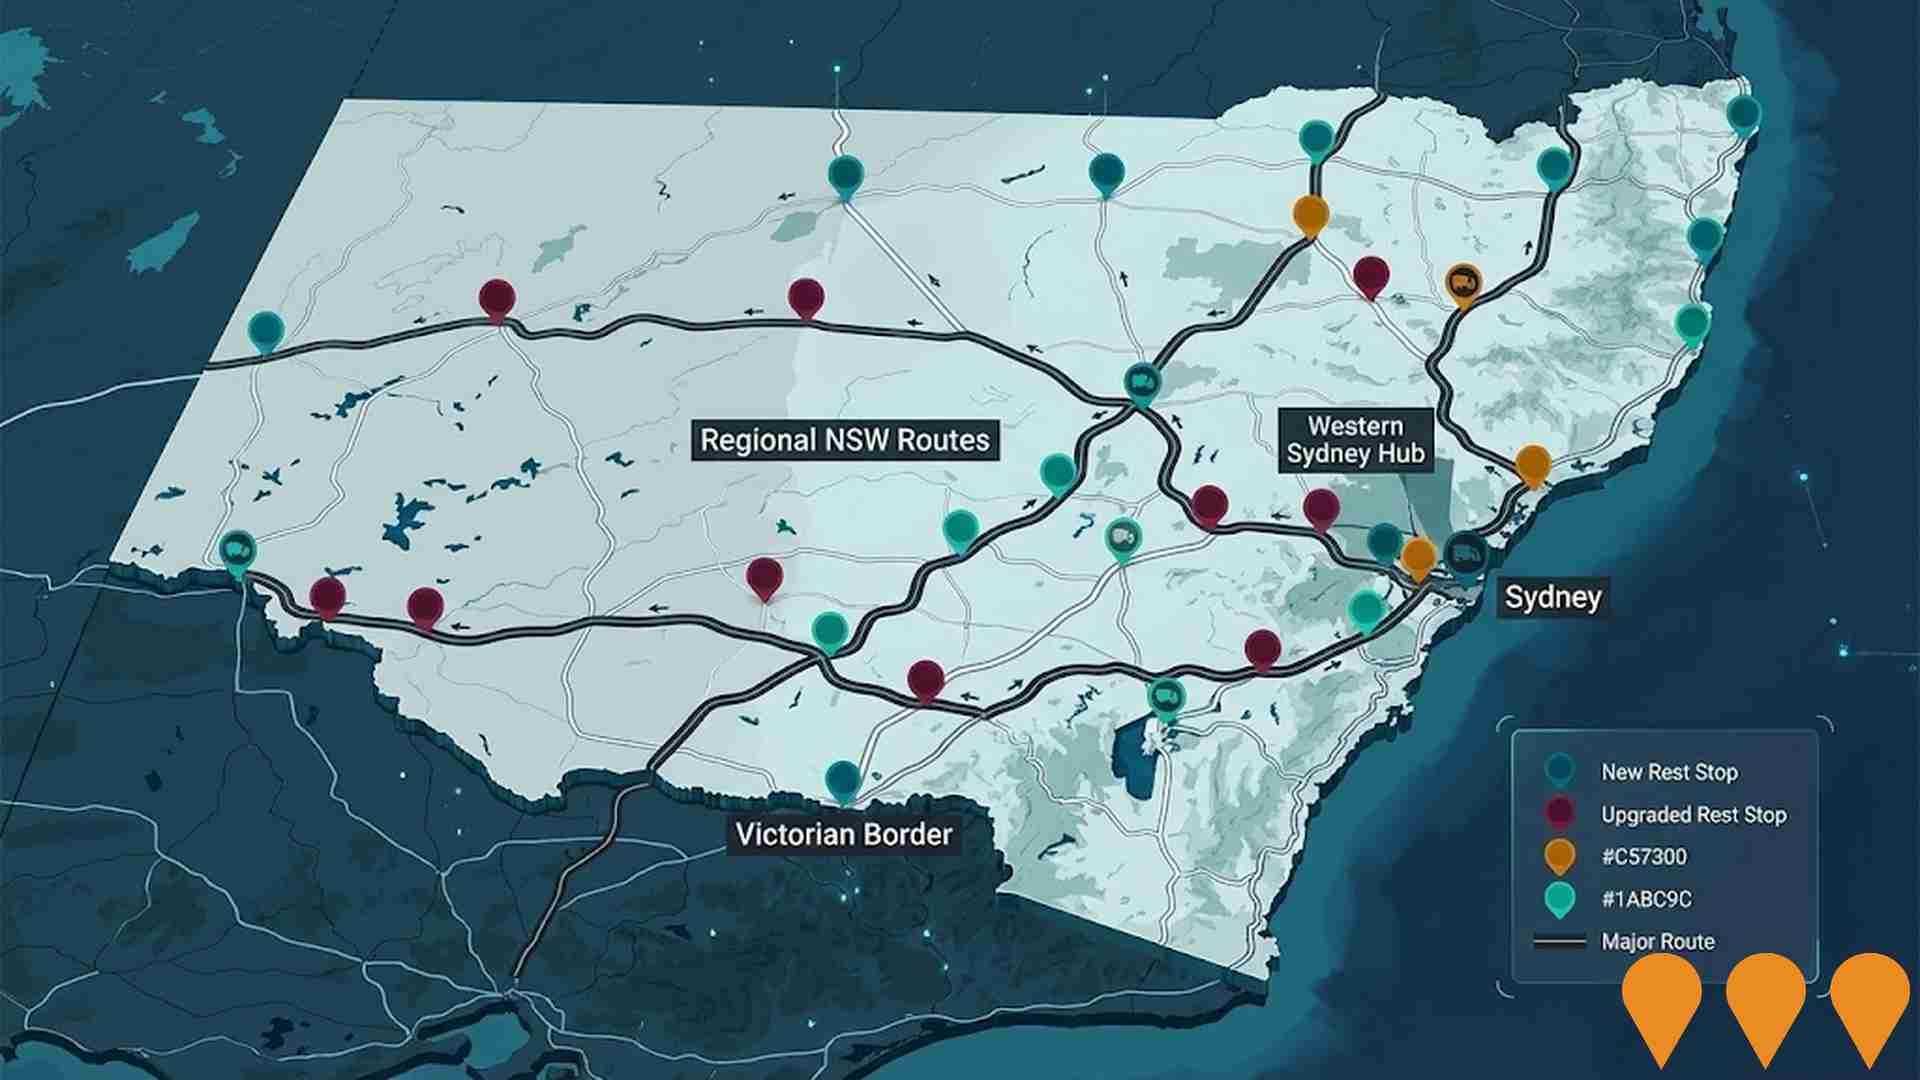
NSW Heavy Vehicle Rest Stops Program (TfNSW)
Statewide Transport for NSW program to increase and upgrade heavy vehicle rest stopping across NSW. Works include minor upgrades under the $11.9m Heavy Vehicle Rest Stop Minor Works Program (e.g. new green reflector sites and amenity/signage improvements), early works on new and upgraded formal rest areas in regional NSW, and planning and site confirmation for a major new dedicated rest area in Western Sydney. The program aims to reduce fatigue, improve safety and productivity on key freight routes, and respond to industry feedback collected since 2022.
Employment
The employment landscape in Cootamundra shows performance that lags behind national averages across key labour market indicators
Cootamundra has a balanced workforce with representation from both white and blue collar jobs. Essential services sectors are well-represented in the area.
As of June 2025, the unemployment rate is 3.9%, with an estimated employment growth of 8.1% over the past year. There are 3,053 residents employed currently, while the unemployment rate stands at 3.7%. Workforce participation in Cootamundra lags behind the Rest of NSW's rate at 46.7%. The dominant sectors include health care & social assistance, agriculture, forestry & fishing, and retail trade.
Agriculture, forestry & fishing have particularly high employment levels, at 2.5 times the regional average. However, accommodation & food services have a limited presence with only 5.1% of employment compared to the regional average of 7.8%. The area may offer limited local employment opportunities as indicated by Census data. In the period from June 2024 to June 2025, employment increased by 8.1%, while labour force grew by 8.9%, leading to an unemployment rise of 0.7 percentage points. This contrasts with Rest of NSW where employment contracted by 0.1%. State-level data for NSW as of Nov-25 shows a contraction in employment by 0.03% (losing 2,260 jobs), with the state unemployment rate at 3.9%. Jobs and Skills Australia's national employment forecasts from May-25 suggest that national employment will expand by 6.6% over five years and 13.7% over ten years. Applying these projections to Cootamundra's employment mix indicates a potential local employment increase of 6.0% over five years and 12.7% over ten years, assuming no changes in population projections.
Frequently Asked Questions - Employment
Income
The area's income levels rank in the lower 15% nationally based on AreaSearch comparative data
The Cootamundra SA2 had a median taxpayer income of $46,642 and an average of $59,925 in the financial year 2022. This was lower than national averages, with Rest of NSW having a median income of $49,459 and an average income of $62,998. By September 2025, estimates based on Wage Price Index growth suggest the median income would be approximately $52,524 and the average $67,482. According to the 2021 Census, incomes in Cootamundra fell between the 5th and 10th percentiles nationally for households, families, and individuals. The predominant income cohort was $400 - 799, with 29.6% of locals (2,292 people) falling into this bracket, contrasting with the surrounding region where the leading bracket was $1,500 - 2,999 at 29.9%. Housing costs were modest, with 88.8% of income retained, but total disposable income ranked at just the 10th percentile nationally.
Frequently Asked Questions - Income
Housing
Cootamundra is characterized by a predominantly suburban housing profile, with above-average rates of outright home ownership
The latest Census in Cootamundra revealed that 92.4% of dwellings were houses, with the remaining 7.6% consisting of semi-detached homes, apartments, and other types. In comparison, Non-Metro NSW had 88.4% houses and 11.7% other dwellings. Home ownership in Cootamundra stood at 50.7%, with mortgaged properties at 25.9% and rented ones at 23.4%. The median monthly mortgage repayment in the area was $1,111, lower than Non-Metro NSW's average of $1,430. The median weekly rent figure in Cootamundra was $219, compared to Non-Metro NSW's $280. Nationally, Cootamundra's mortgage repayments were significantly lower than the Australian average of $1,863, and rents were substantially below the national figure of $375.
Frequently Asked Questions - Housing
Household Composition
Cootamundra features high concentrations of lone person households, with a lower-than-average median household size
Family households constitute 65.9% of all households, including 20.4% couples with children, 34.7% couples without children, and 10.1% single parent families. Non-family households comprise the remaining 34.1%, with lone person households at 32.3% and group households making up 1.7%. The median household size is 2.2 people, which is smaller than the Rest of NSW average of 2.5.
Frequently Asked Questions - Households
Local Schools & Education
Cootamundra faces educational challenges, with performance metrics placing it in the bottom quartile of areas assessed nationally
The area's university qualification rate is 13.4%, significantly lower than NSW's average of 32.2%. Bachelor degrees are the most common at 10.0%, followed by postgraduate qualifications (1.8%) and graduate diplomas (1.6%). Vocational credentials are prominent, with 40.9% of residents aged 15+ holding them, including advanced diplomas (10.4%) and certificates (30.5%). Educational participation is high at 25.0%, with 10.0% in primary education, 8.1% in secondary education, and 1.5% pursuing tertiary education.
Educational participation is notably high, with 25.0% of residents currently enrolled in formal education. This includes 10.0% in primary education, 8.1% in secondary education, and 1.5% pursuing tertiary education.
Frequently Asked Questions - Education
Schools Detail
Nearby Services & Amenities
Transport
Transport servicing is moderate compared to other areas nationally based on assessment of service frequency, route connectivity and accessibility
Cootamundra has 262 active public transport stops. These include both train and bus services. There are 51 individual routes operating in total, which provide 937 weekly passenger trips combined.
The accessibility of transport is rated as excellent, with residents typically located just 189 meters from the nearest stop. On average, there are 133 trips per day across all routes, translating to approximately three weekly trips per individual stop.
Frequently Asked Questions - Transport
Transport Stops Detail
Health
Health performance in Cootamundra is a key challenge with a range of health conditions having marked impacts on both younger and older age cohorts
Cootamundra faces significant health challenges, with various conditions affecting both younger and older residents. Approximately 50% (~3,833 people) have private health cover, lower than the national average of 55.3%.
The most prevalent medical conditions are arthritis (12.9%) and mental health issues (9.4%). Conversely, 56.5% report no medical ailments, compared to 64.5% in Rest of NSW. Residents aged 65 and over comprise 32.8% (2,536 people), higher than the 19.6% in Rest of NSW. Seniors' health outcomes present challenges similar to those of the general population.
Frequently Asked Questions - Health
Cultural Diversity
The latest Census data sees Cootamundra placing among the least culturally diverse areas in the country when compared across a range of language and cultural background related metrics
Cootamundra, as per the 2016 Census, had a cultural diversity profile below average. Its population was predominantly Australian citizens at 91.5%, with 92.6% born in Australia and 97.4% speaking English only at home. Christianity was the dominant religion, practiced by 69.0% of Cootamundra's population, compared to 64.3% across the Rest of NSW.
In terms of ancestry, the top three groups were English (33.5%), Australian (32.9%), and Irish (10.7%). Notable differences existed in the representation of certain ethnic groups: Australian Aboriginal was overrepresented at 4.9% compared to the regional average of 4.5%, Scottish at 7.6% versus 8.0%, and German at 3.2% against a regional figure of 3.9%.
Frequently Asked Questions - Diversity
Age
Cootamundra ranks among the oldest 10% of areas nationwide
Cootamundra's median age at 51 years is significantly higher than the Rest of NSW average of 43 and considerably older than the Australian median of 38. Compared to the Rest of NSW, Cootamundra has a notably over-represented 75-84 cohort (12.1%) and an under-represented 35-44 age group (7.9%). This 75-84 concentration is well above the national average of 6.0%. Post-2021 Census data shows that from 2021 to present, the 75 to 84 age group has grown from 10.5% to 12.1%, while the 15 to 24 cohort increased from 9.2% to 10.4%. Conversely, the 35 to 44 cohort has declined from 8.9% to 7.9%. By 2041, Cootamundra's age composition is expected to see notable shifts. Leading this demographic shift, the 85+ group is projected to grow by 57%, reaching 522 people from 332. The aging population dynamic is clear, with those aged 65 and above comprising 57% of projected growth. Conversely, both the 0-4 and 15-24 age groups are expected to have reduced numbers.
