Chart Color Schemes
This analysis uses ABS Statistical Areas Level 2 (SA2) boundaries, which can materially differ from Suburbs and Localities (SAL) even when sharing similar names.
SA2 boundaries are defined by the Australian Bureau of Statistics and are designed to represent communities for statistical reporting (e.g., census and ERP).
Suburbs and Localities (SAL) represent commonly-used suburb/locality names (postal-style areas) and may use different geographic boundaries. For comprehensive analysis, consider reviewing both boundary types if available.
est. as @ -- *
ABS ERP | -- people | --
2021 Census | -- people
Sales Activity
Curious about local property values? Filter the chart to assess the volume and appreciation (including resales) trends and regional comparisons, or scroll to the map below view this information at an individual property level.
Find a Recent Sale
Sales Detail
Population
Vermont has seen population growth performance typically on par with national averages when looking at short and medium term trends
Vermont's population, as of November 2025, is approximately 11,369. This figure represents an increase of 376 people since the 2021 Census, which reported a population of 10,993. The change is inferred from the estimated resident population of 11,353 in June 2024 and an additional 38 validated new addresses since the Census date. This results in a population density ratio of 2,466 persons per square kilometer, placing Vermont in the upper quartile relative to national locations assessed by AreaSearch. Over the past decade, ending in 2021, Vermont exhibited resilient growth patterns with a compound annual growth rate of 0.7%, outpacing the SA3 area. Population growth was primarily driven by overseas migration during this period.
AreaSearch is adopting ABS/Geoscience Australia projections for each SA2 area, released in 2024 with a base year of 2022. For areas not covered by this data, AreaSearch uses VIC State Government's Regional/LGA projections from 2023, adjusted using a method of weighted aggregation of population growth from LGA to SA2 levels. Growth rates by age group are applied across all areas for years 2032 to 2041. By 2041, Vermont is expected to increase its population by approximately 1,139 persons, reflecting a gain of 9.9% over the 17-year period based on the latest annual ERP population numbers.
Frequently Asked Questions - Population
Development
Residential development activity is lower than average in Vermont according to AreaSearch's national comparison of local real estate markets
Vermont has averaged approximately 36 new dwelling approvals annually. Over the past five financial years, from FY21 to FY25, a total of 181 homes were approved, with an additional 11 approved so far in FY26. On average, over these five years, each new home accommodated about 0.5 new residents per year.
This indicates that new construction is meeting or exceeding demand, providing more options for buyers and potentially facilitating population growth beyond current projections. The average expected construction cost of new properties during this period was $478,000, suggesting a focus on the premium market segment. In FY26, $2.4 million in commercial approvals have been registered, reflecting Vermont's residential character. Compared to Greater Melbourne, Vermont has similar development levels per capita, maintaining market balance with the broader area.
However, these development levels are lower than national averages, which could indicate market maturity or potential development constraints. The types of dwellings approved in Vermont show a mix of housing options: 69.0% detached dwellings and 31.0% townhouses or apartments. This suggests an expanding range of medium-density housing options, creating opportunities across various price brackets from traditional family homes to more affordable compact alternatives. The population density per approval is around 420 people, indicating a mature market. According to the latest AreaSearch quarterly estimate, Vermont is projected to grow by 1,123 residents by 2041. Current building activity appears to be keeping pace with these growth projections. However, as the population grows, buyers may face increased competition for available properties.
Frequently Asked Questions - Development
Infrastructure
Vermont has moderate levels of nearby infrastructure activity, ranking in the top 50% nationally
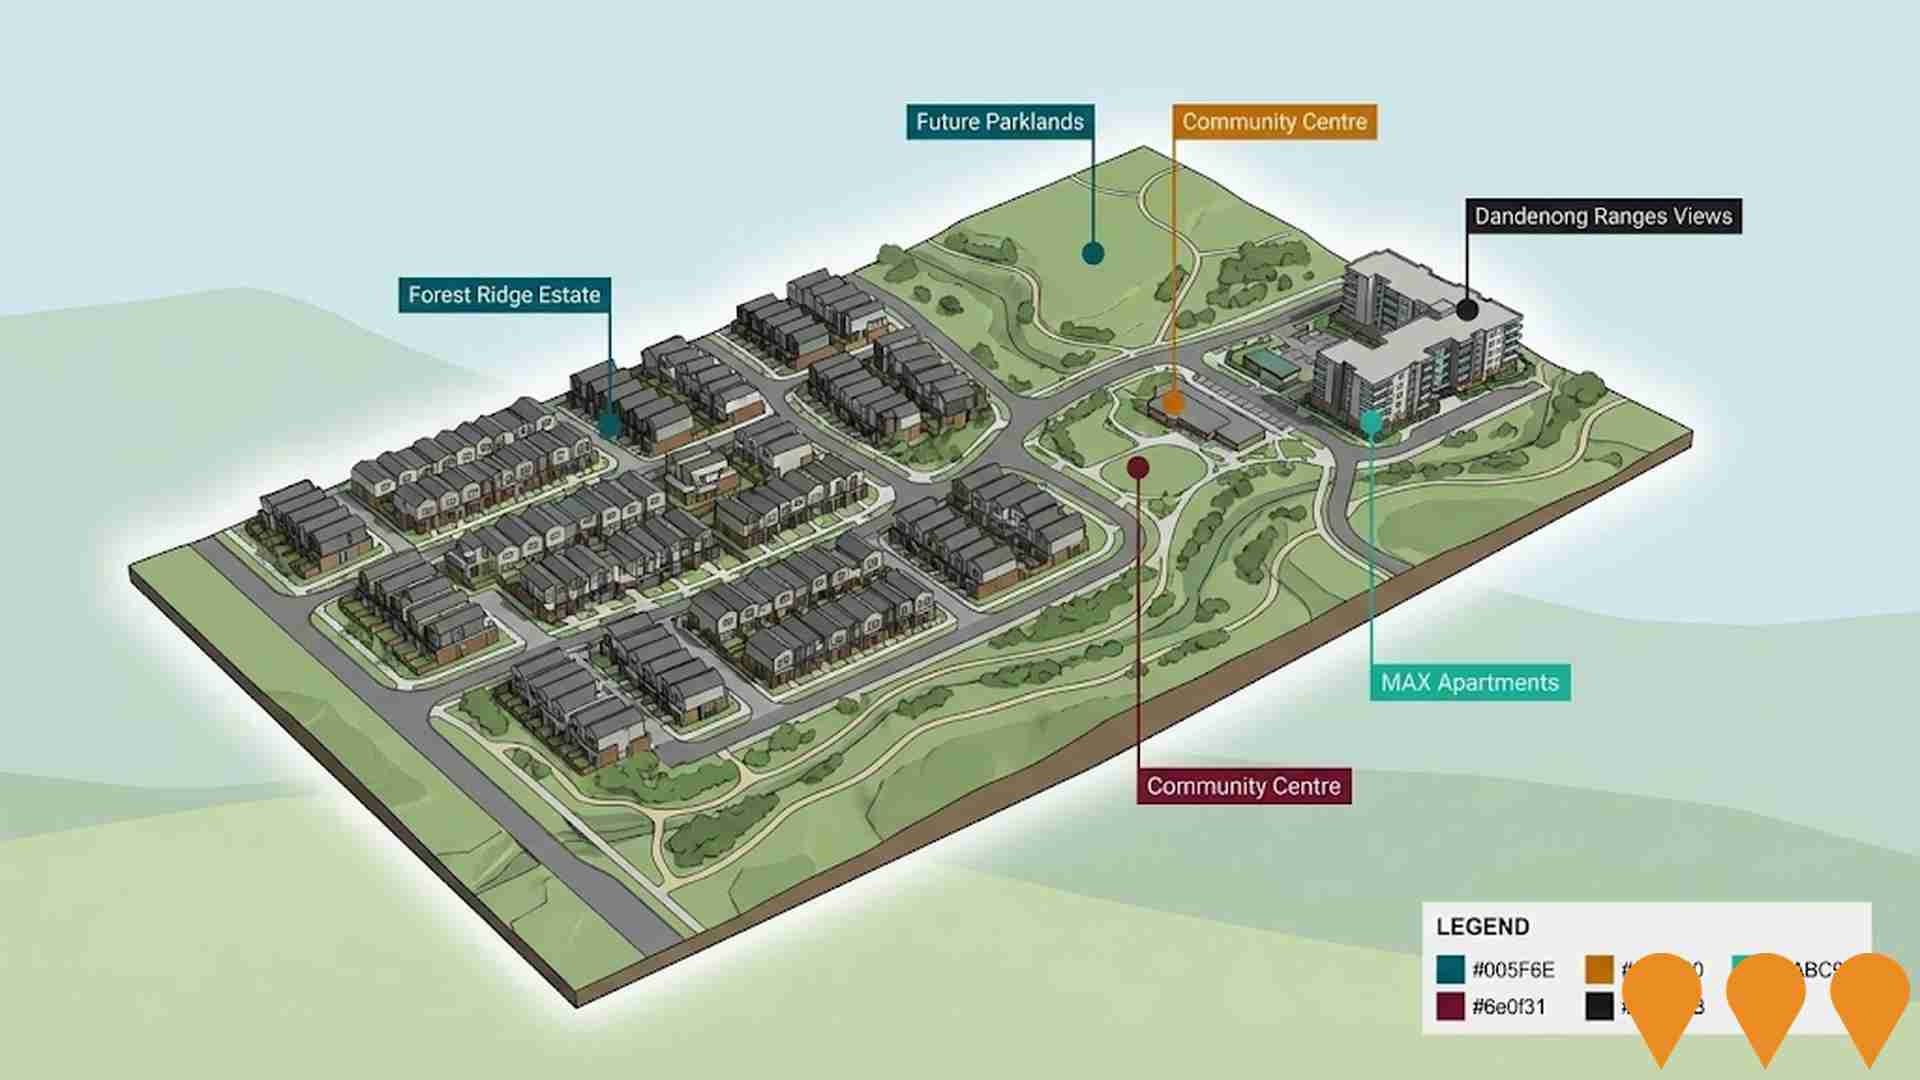
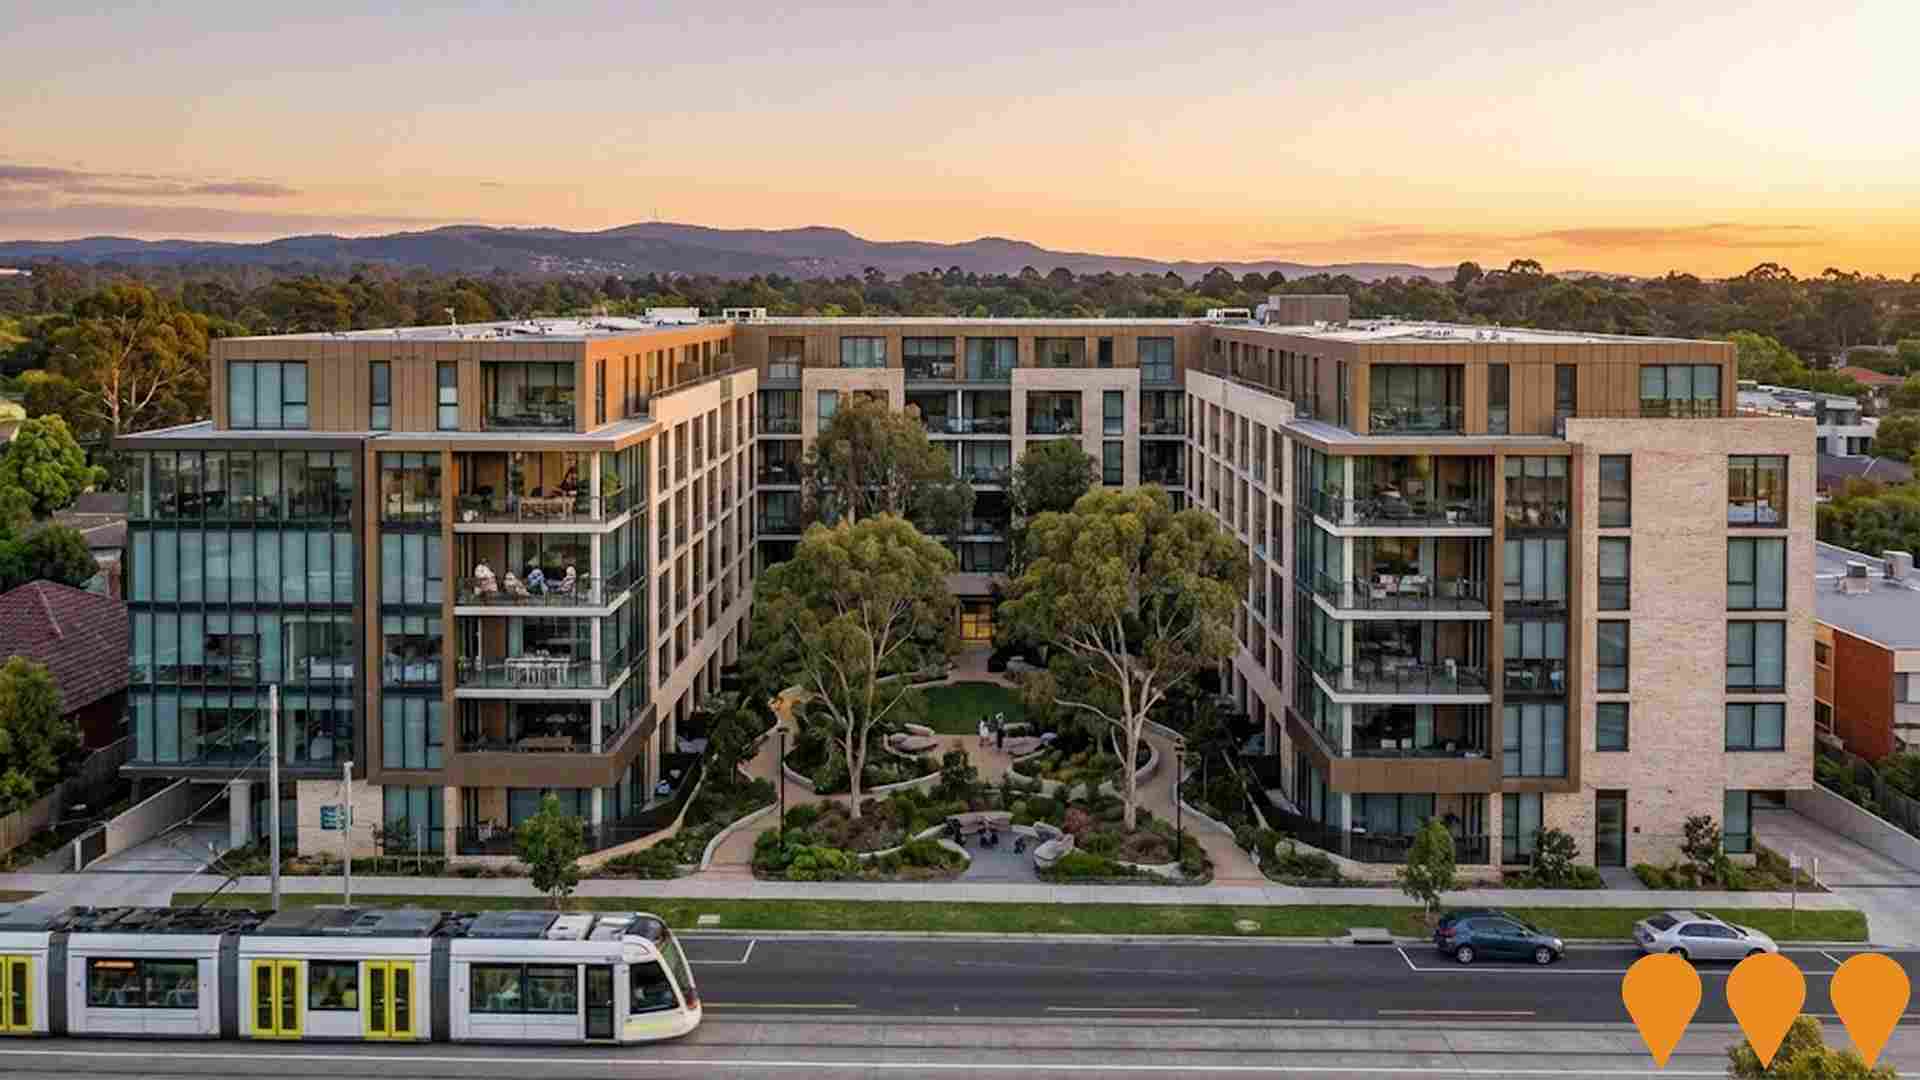
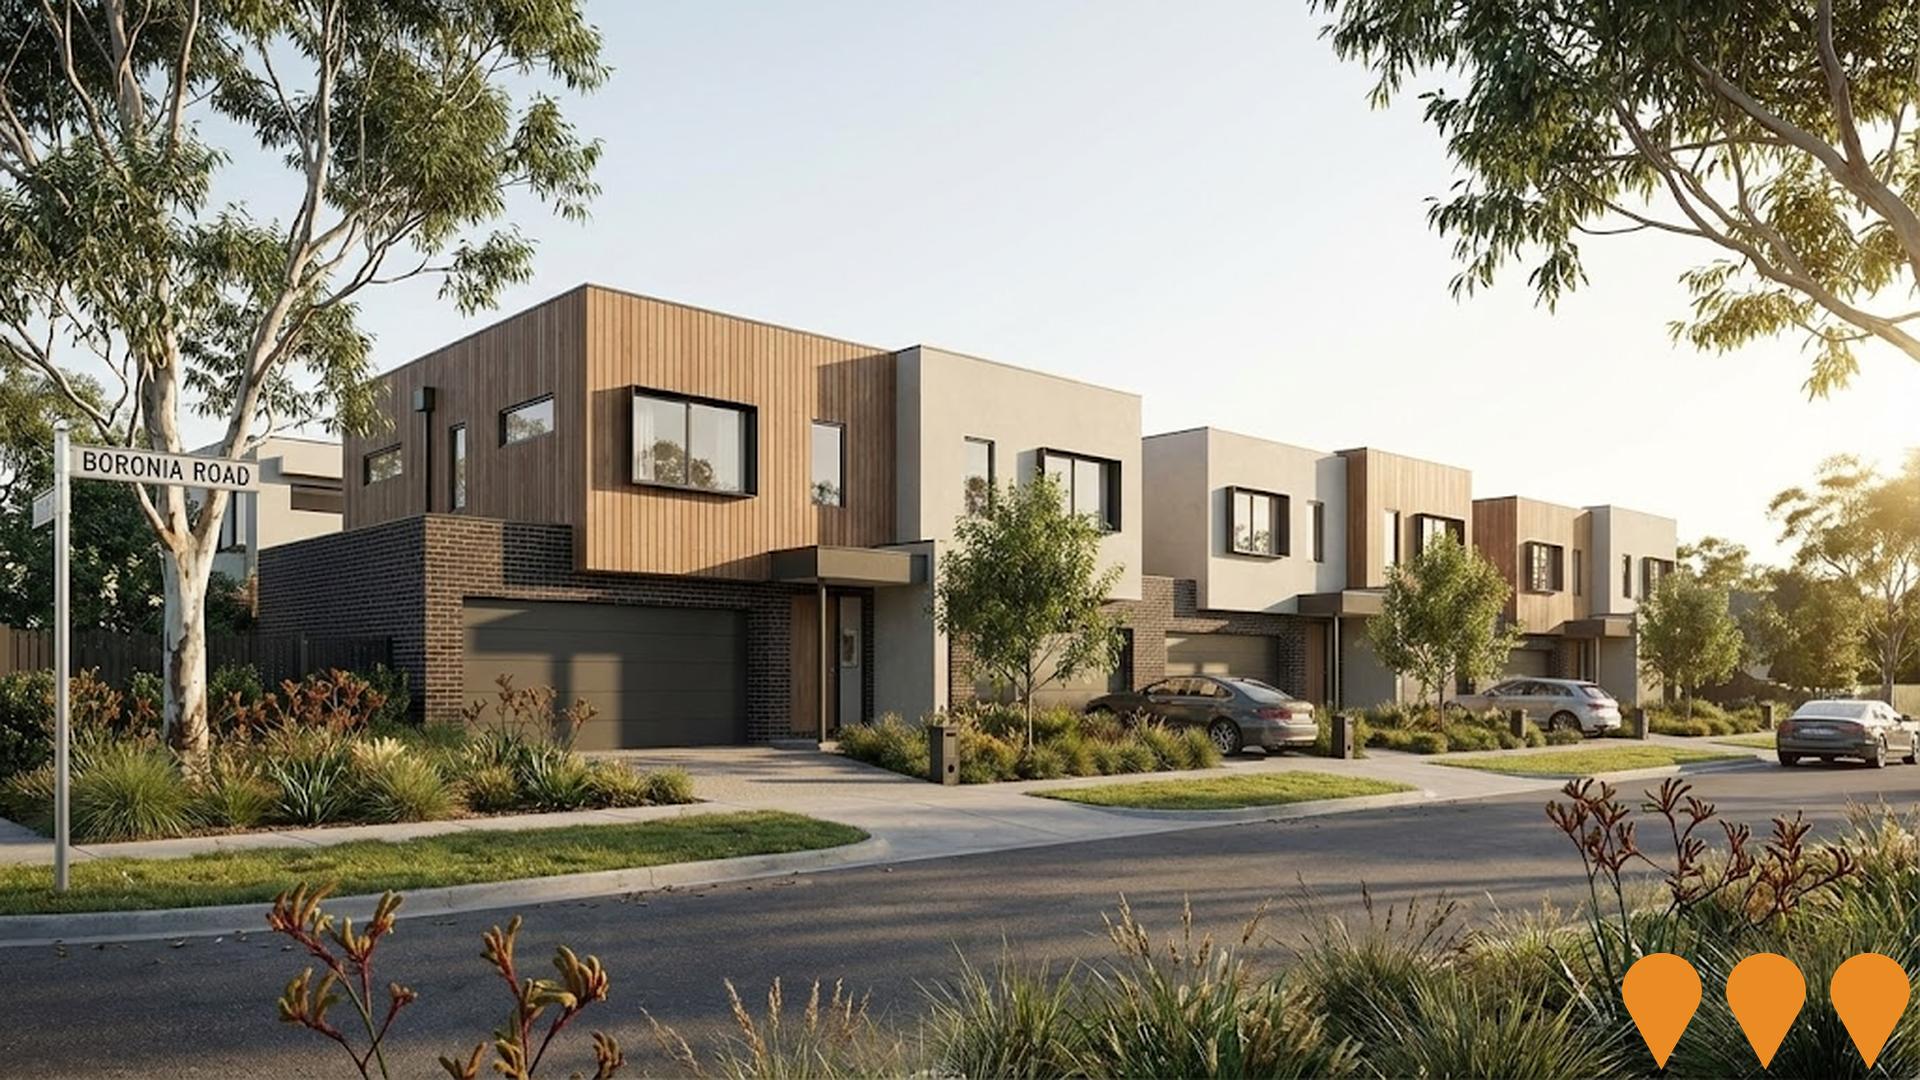
Changes to local infrastructure significantly influence an area's performance. AreaSearch has identified six projects likely to impact the area. Key projects are Vermont Reserve Pavilion Redevelopment, Vermont Inc, Forest Ridge, and The Green Hill. Below is a list of those most relevant.
Professional plan users can use the search below to filter and access additional projects.
INFRASTRUCTURE SEARCH
 Denotes AI-based impression for illustrative purposes only, not to be taken as definitive under any circumstances. Please follow links and conduct other investigations from the project's source for actual imagery. Developers and project owners wishing us to use original imagery please Contact Us and we will do so.
Frequently Asked Questions - Infrastructure
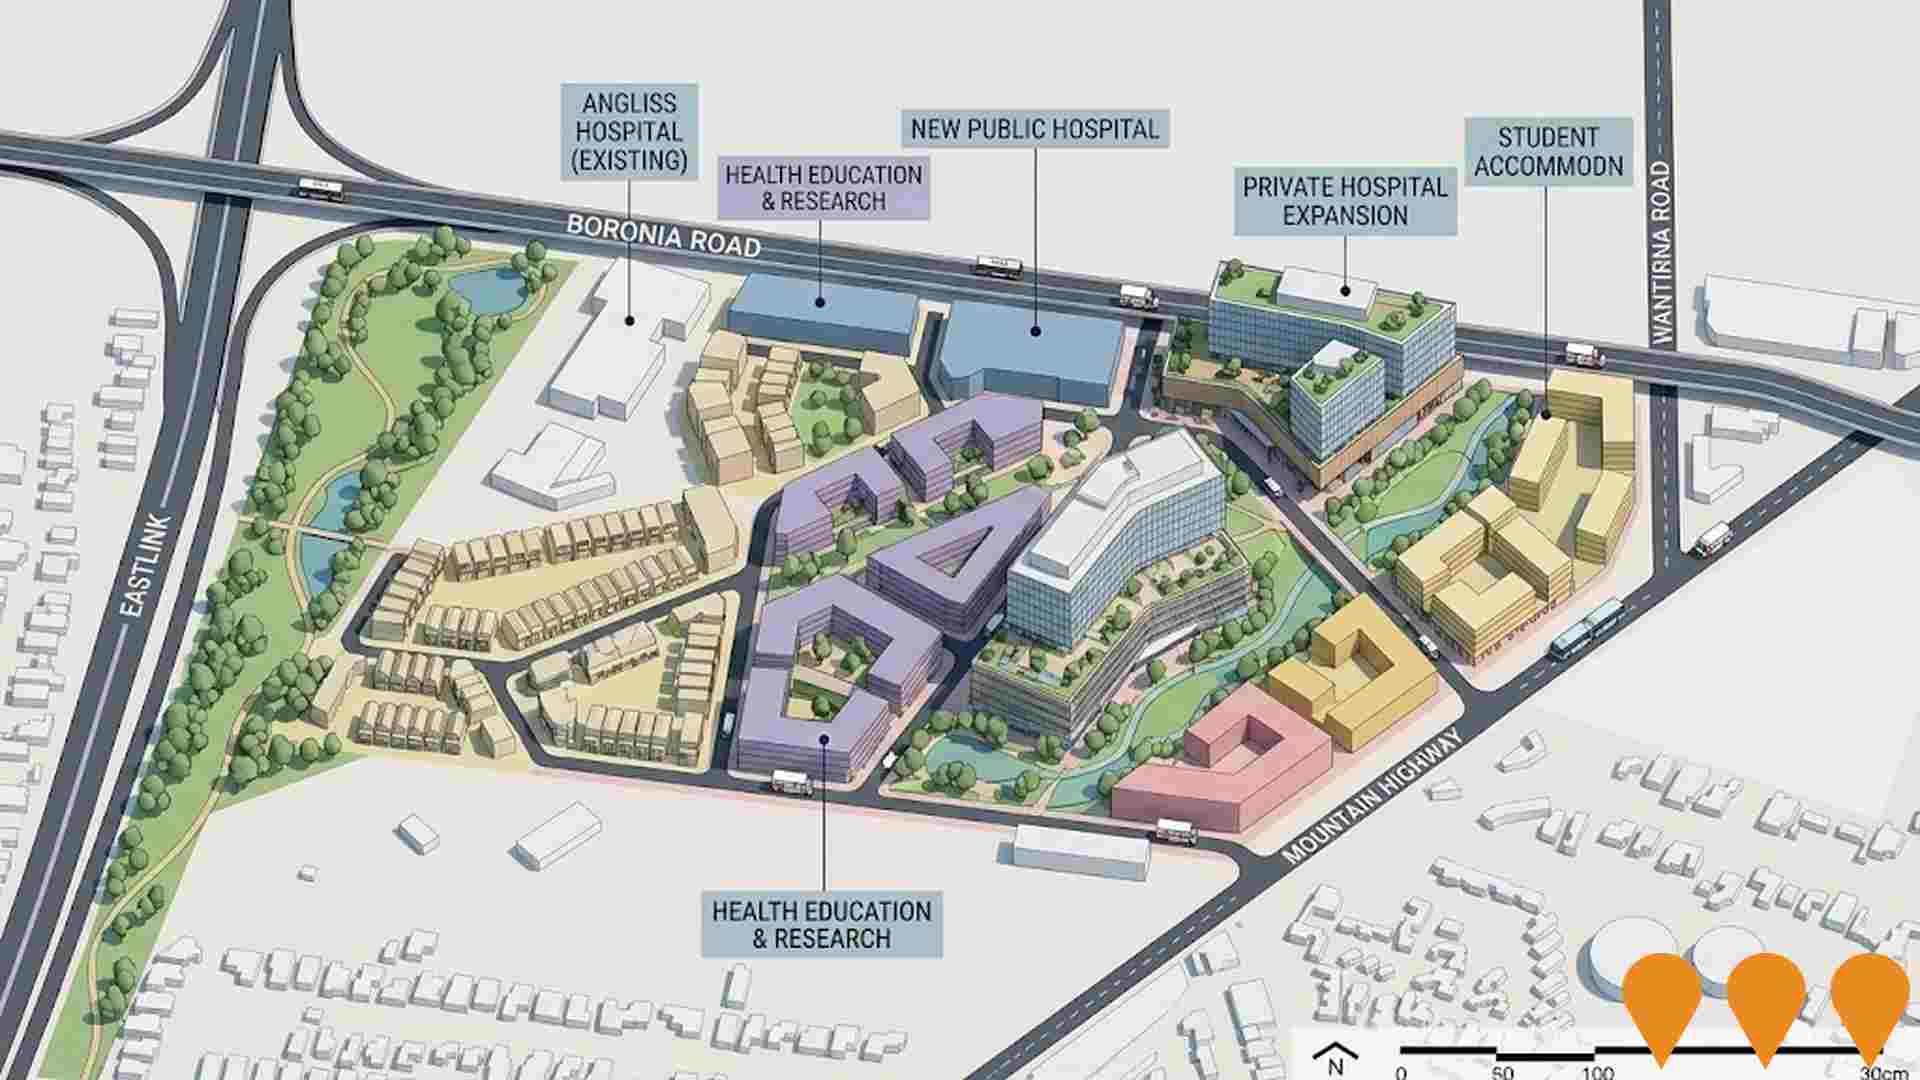
Wantirna Health Precinct
State-led masterplan to transform the land around the existing Angliss Hospital into a major integrated health and education precinct. Includes a new public hospital, private hospital expansion, medical services, health education and research facilities, aged care, student and staff accommodation, limited housing, enhanced public transport links and significant open space. The Comprehensive Development Plan was approved and gazetted via Amendment C185knox on 30 August 2024, enabling staged delivery over the coming decade.
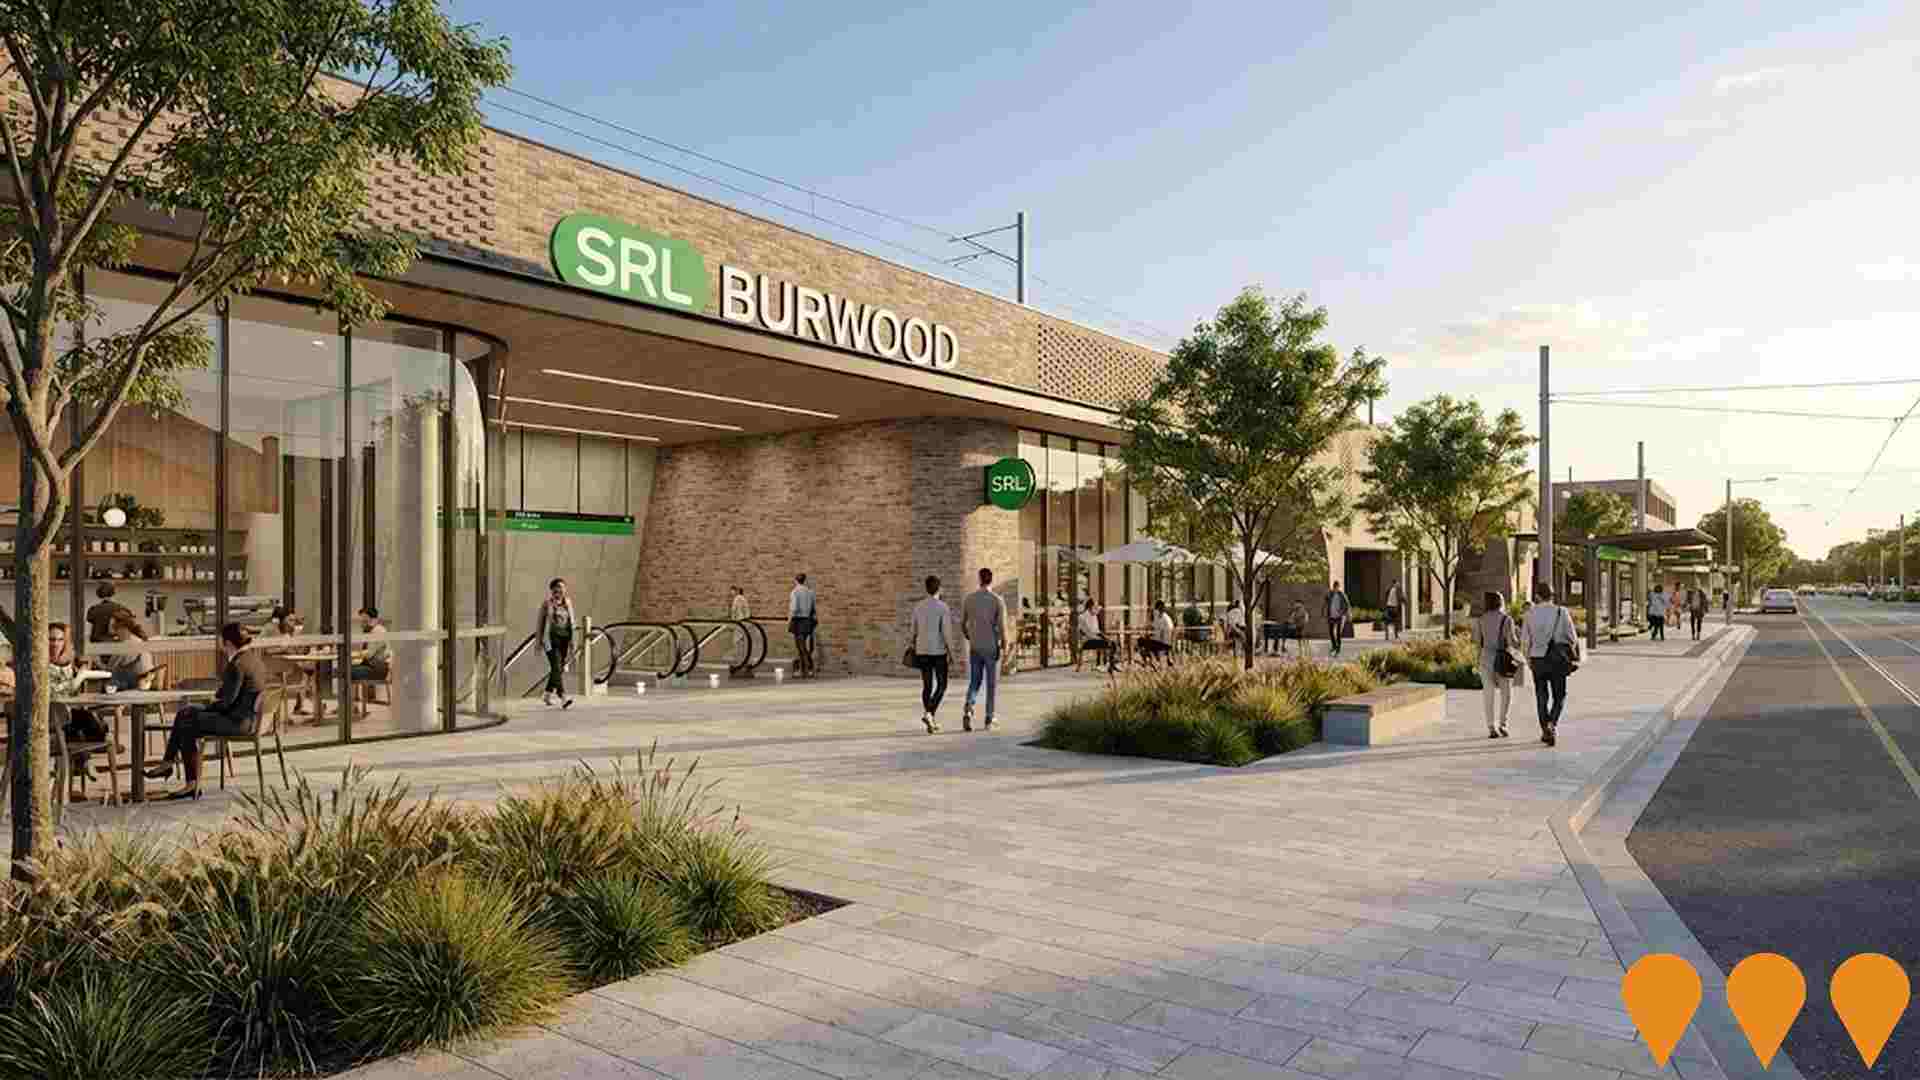
Suburban Rail Loop East - Burwood Station
Underground Suburban Rail Loop (SRL) East station at Burwood, adjacent to Deakin University, with a 94m platform located approximately 18m below ground. The station is part of the SRL East line, a 26km twin-tunnel rail link connecting Cheltenham to Box Hill. Major construction has commenced, including the excavation of the 19m deep launch shaft for Tunnel Boring Machines (TBMs). Tunnelling is expected to begin in 2026. The Burwood station will integrate with a new tram stop on Burwood Highway, pedestrian overpass, and new walking/cycling paths, and will provide 750 bicycle parking spaces. It is part of the larger Suburban Rail Loop project, which is set to create up to 8,000 direct jobs.
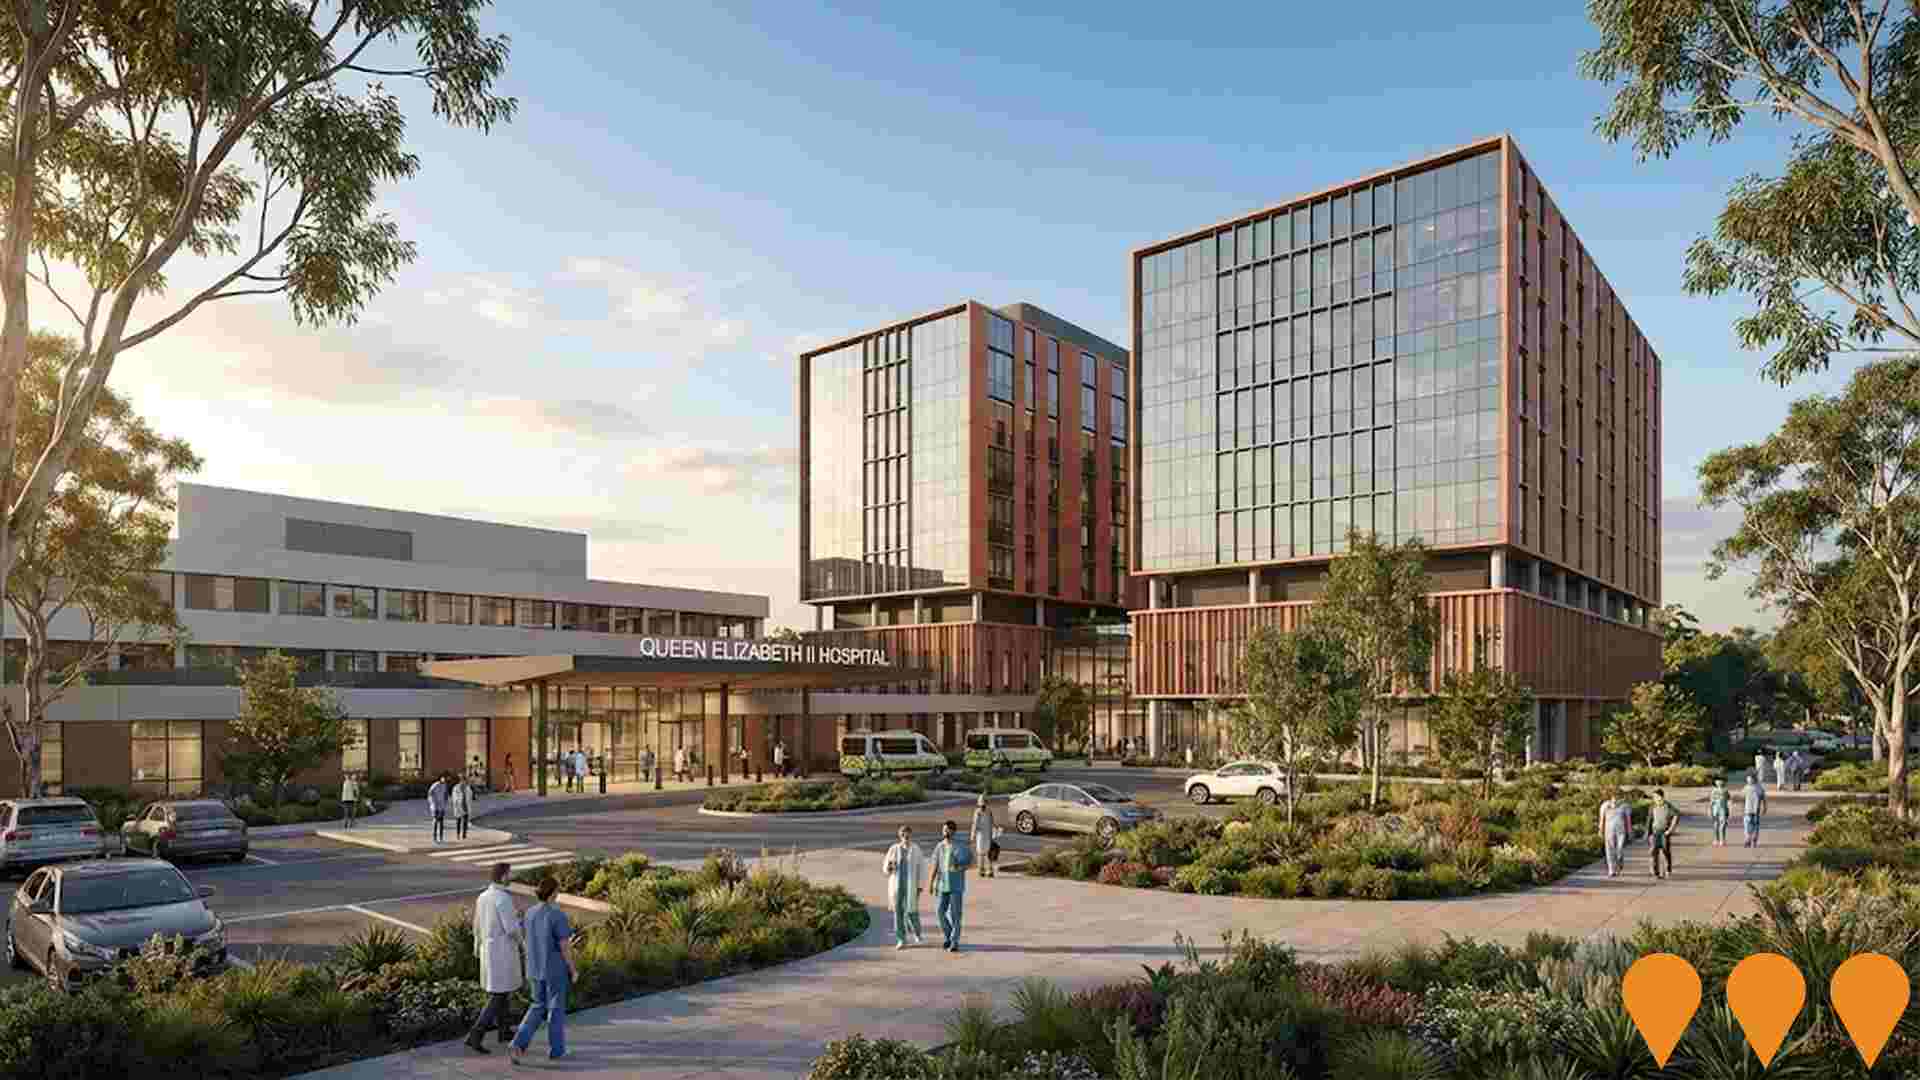
Queen Elizabeth II Hospital (Maroondah Hospital Redevelopment)
Complete redevelopment and expansion of the existing Maroondah Hospital, to be renamed Queen Elizabeth II Hospital. The $1.05 billion project will deliver a new emergency department (14 extra treatment spaces), a dedicated children's emergency department, a new mental health hub, operating theatres, day procedure facilities, specialist care spaces, two six-storey inpatient towers with 200+ extra beds, and an expanded medical imaging unit. Once complete, the hospital is expected to treat an extra 9,000 in-patients and 22,400 extra emergency patients annually. The project is part of the Victorian Government's Hospital Infrastructure Delivery Fund. Planning for the masterplan and feasibility study is underway, with construction still expected to start in 2025 and completion by 2029.
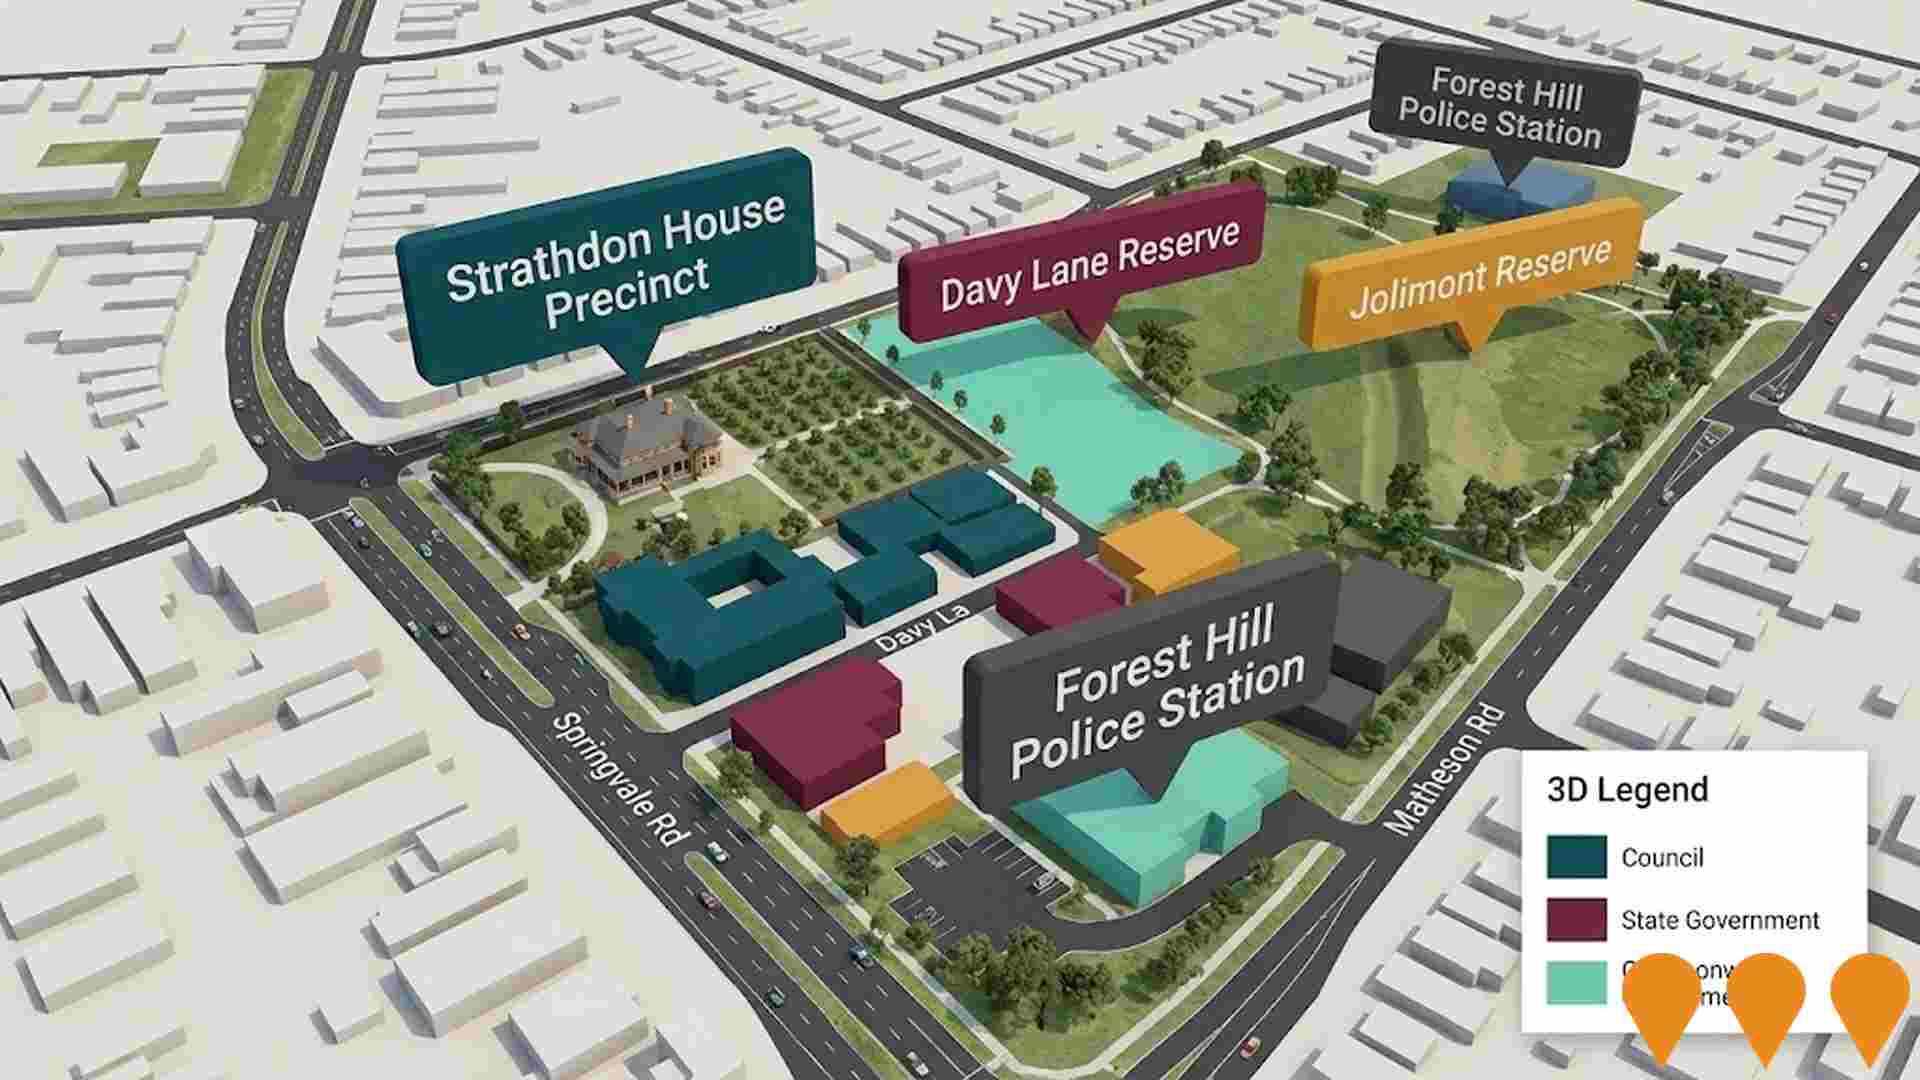
Strathdon House Davy Lane Jolimont Reserve Precinct Master Plan
A comprehensive master plan for Strathdon House, Davy Lane Reserve, and Jolimont Reserve that will guide development over the next 10-15 years. The plan focuses on historic preservation of the 1893 Strathdon House and heritage orchard, enhancement of recreational open spaces including sports fields for cricket and AFL, walking paths, community gardens, native vegetation conservation, and facilities for both passive and active recreation. The site serves as the western gateway to the former Healesville Freeway Reserve and aims to balance environmental values with increased community recreational opportunities. The draft master plan is being developed in 2025 with community consultation planned for early 2025.
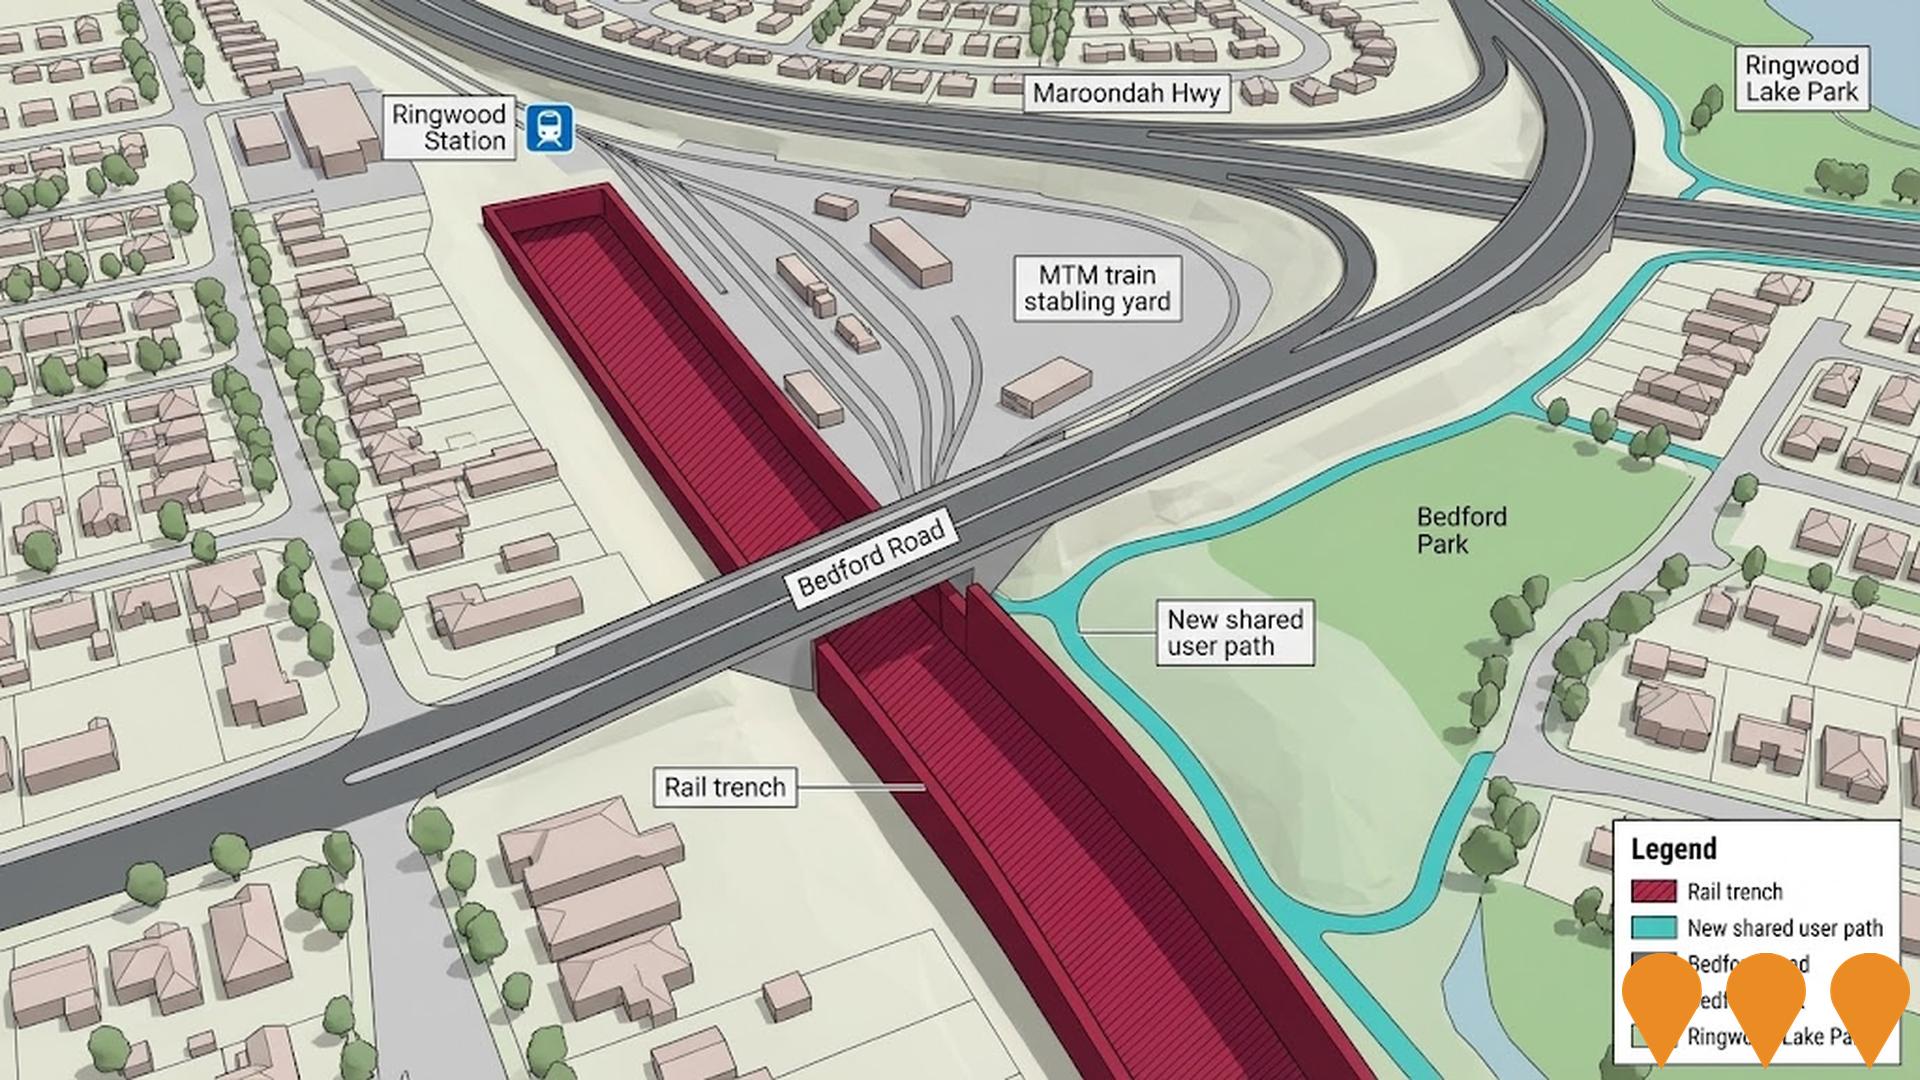
Bedford Road Level Crossing Removal
Removal of dangerous and congested level crossing by building 380m rail trench under Bedford Road. Part of Level Crossing Removal Project making Belgrave Line level crossing free between city and Ferntree Gully. New walking and cycling path connecting 19.2km Heathmont Rail Trail to Bedford Park. Over 60,000 native trees, plants and grasses planted. Boom gates were down for up to 23 minutes during peak periods before removal, affecting 13,500 vehicles daily.
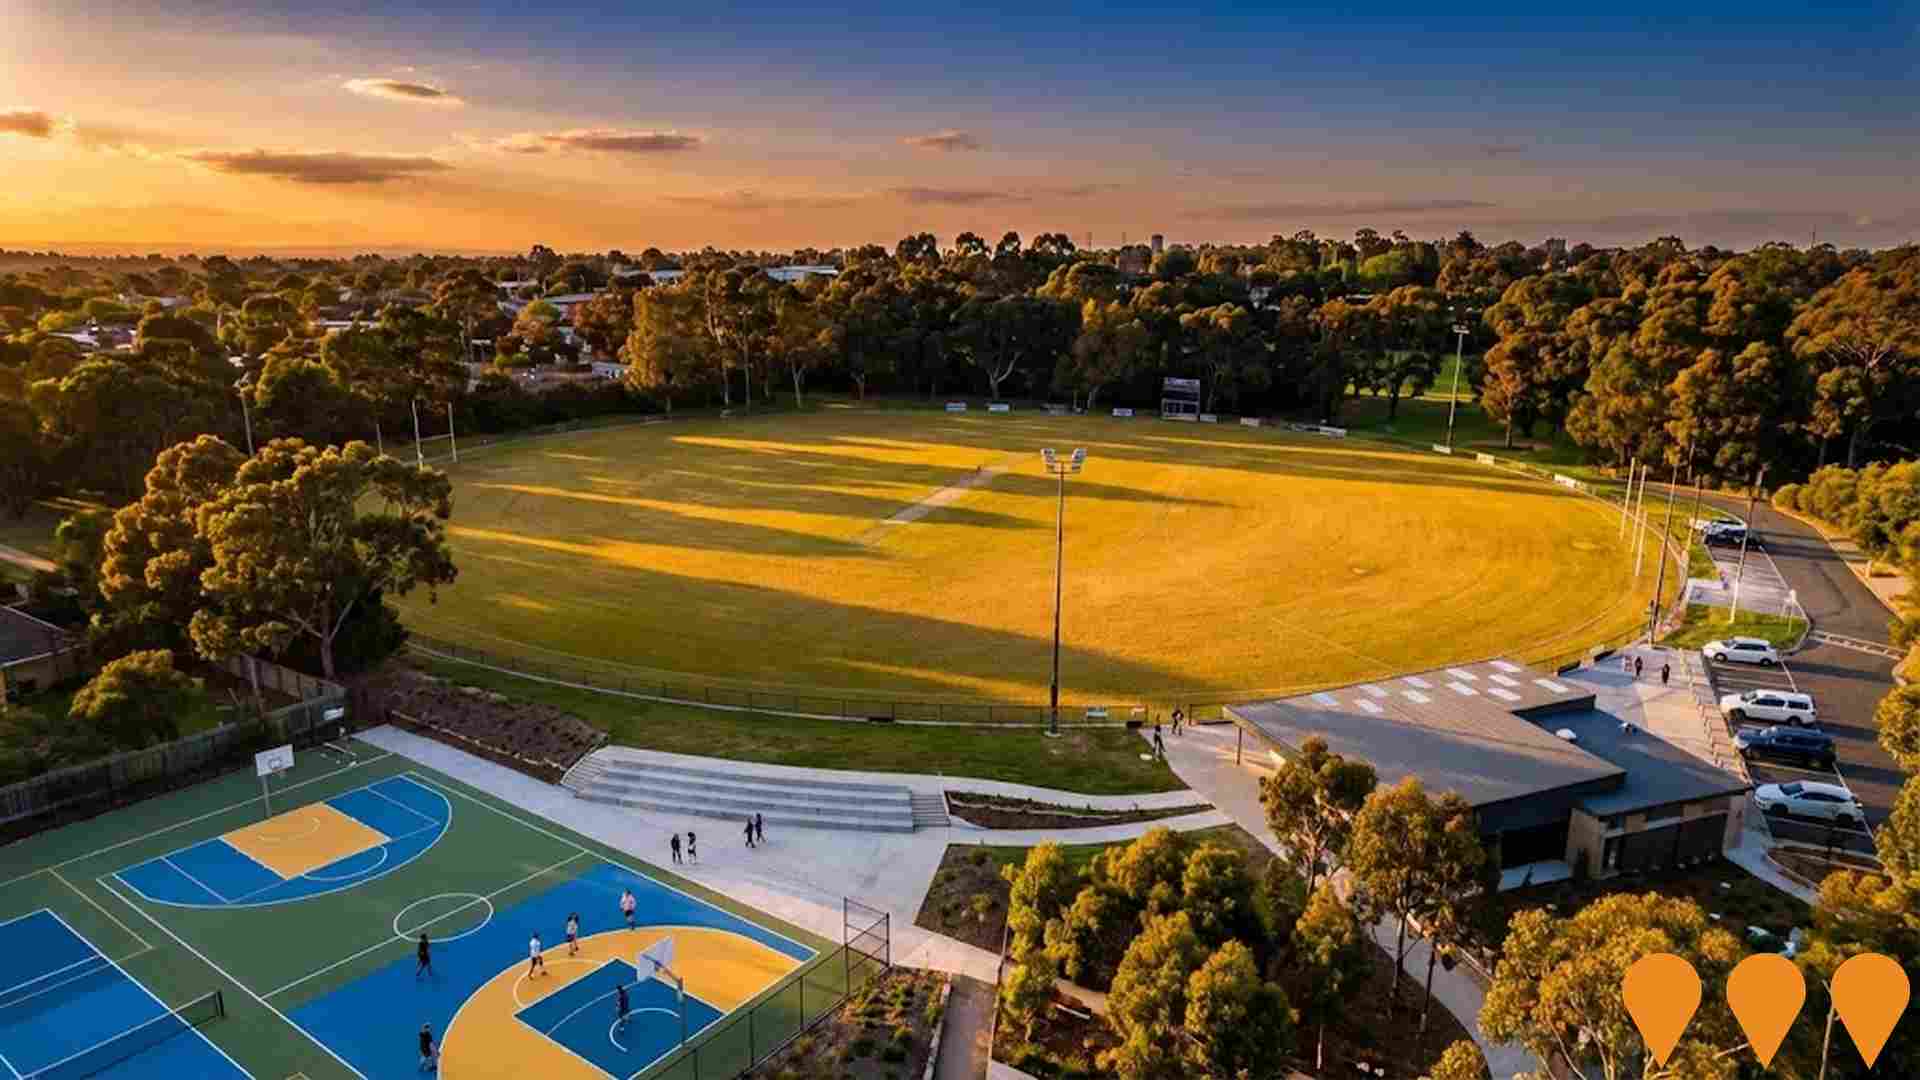
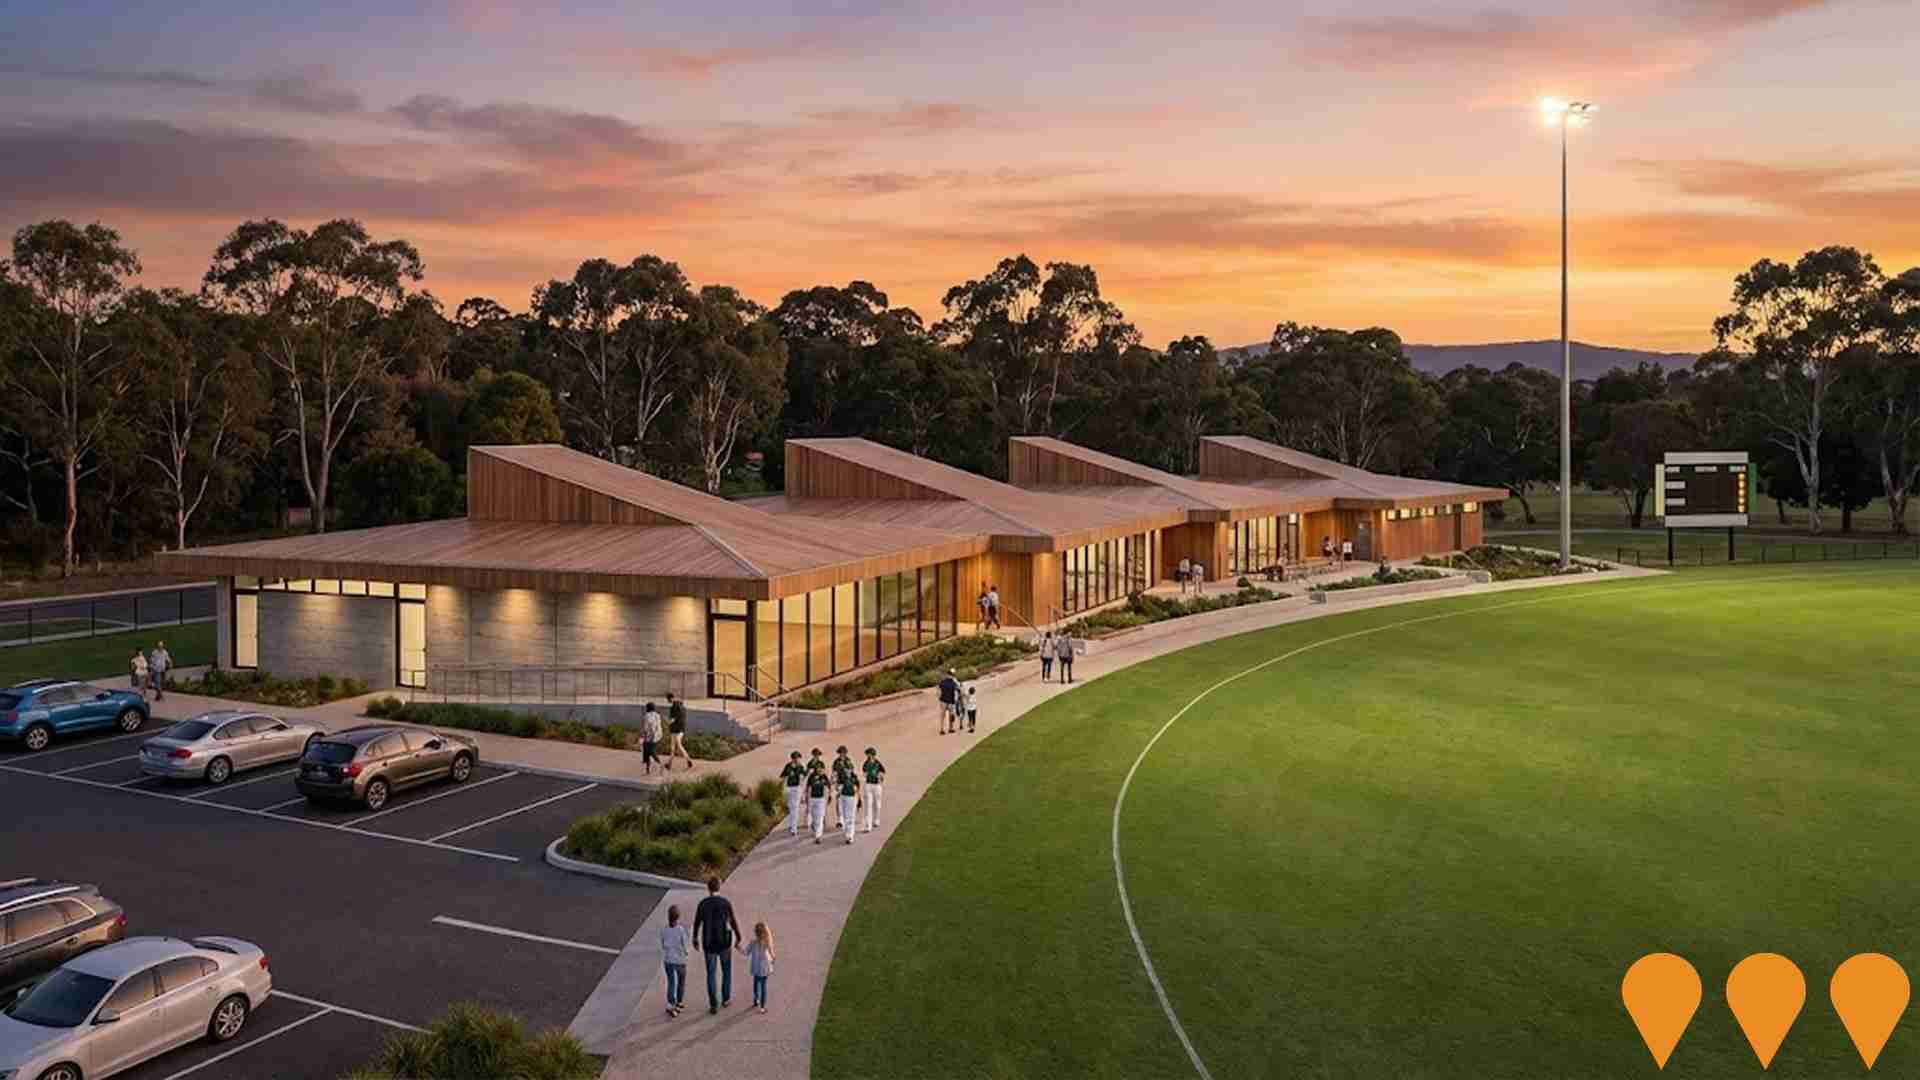
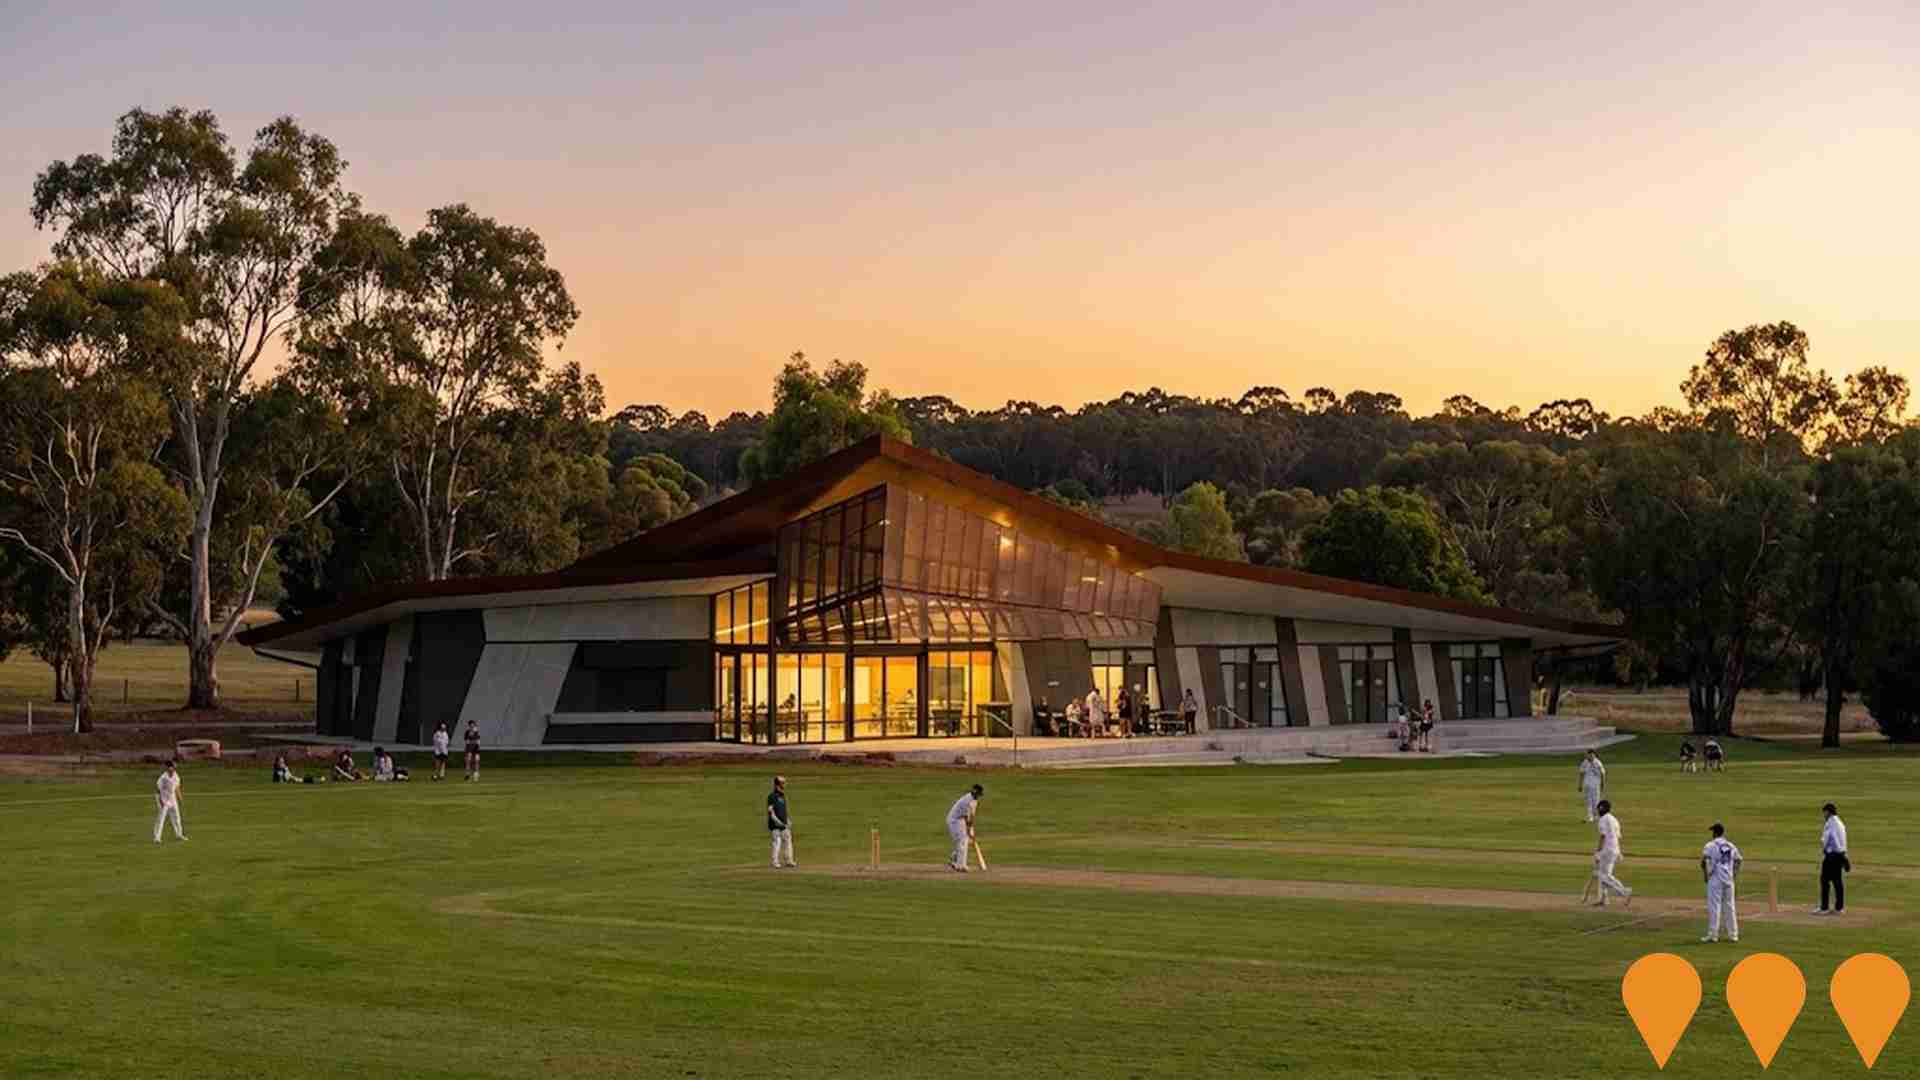
Vermont Reserve Pavilion Redevelopment
Council led redevelopment of the Vermont Reserve pavilion to replace the older red brick section and deliver modern, accessible change rooms, umpire rooms, first aid, accessible toilets and community spaces. Demolition of the old section and construction of a larger footprint facility commenced mid 2025 with completion targeted for mid 2026.
Terrara Park Pavilion Redevelopment
Redevelopment of four outdated pavilions into a new multi-purpose facility featuring female-friendly change rooms, umpire facilities, a multi-purpose social room, kitchen, first aid room, public toilets, and storage. The 774 sqm pavilion serves multiple sports fields for soccer and cricket with covered spectator viewing areas and environmentally sustainable features including rainwater collection tanks and solar panels.
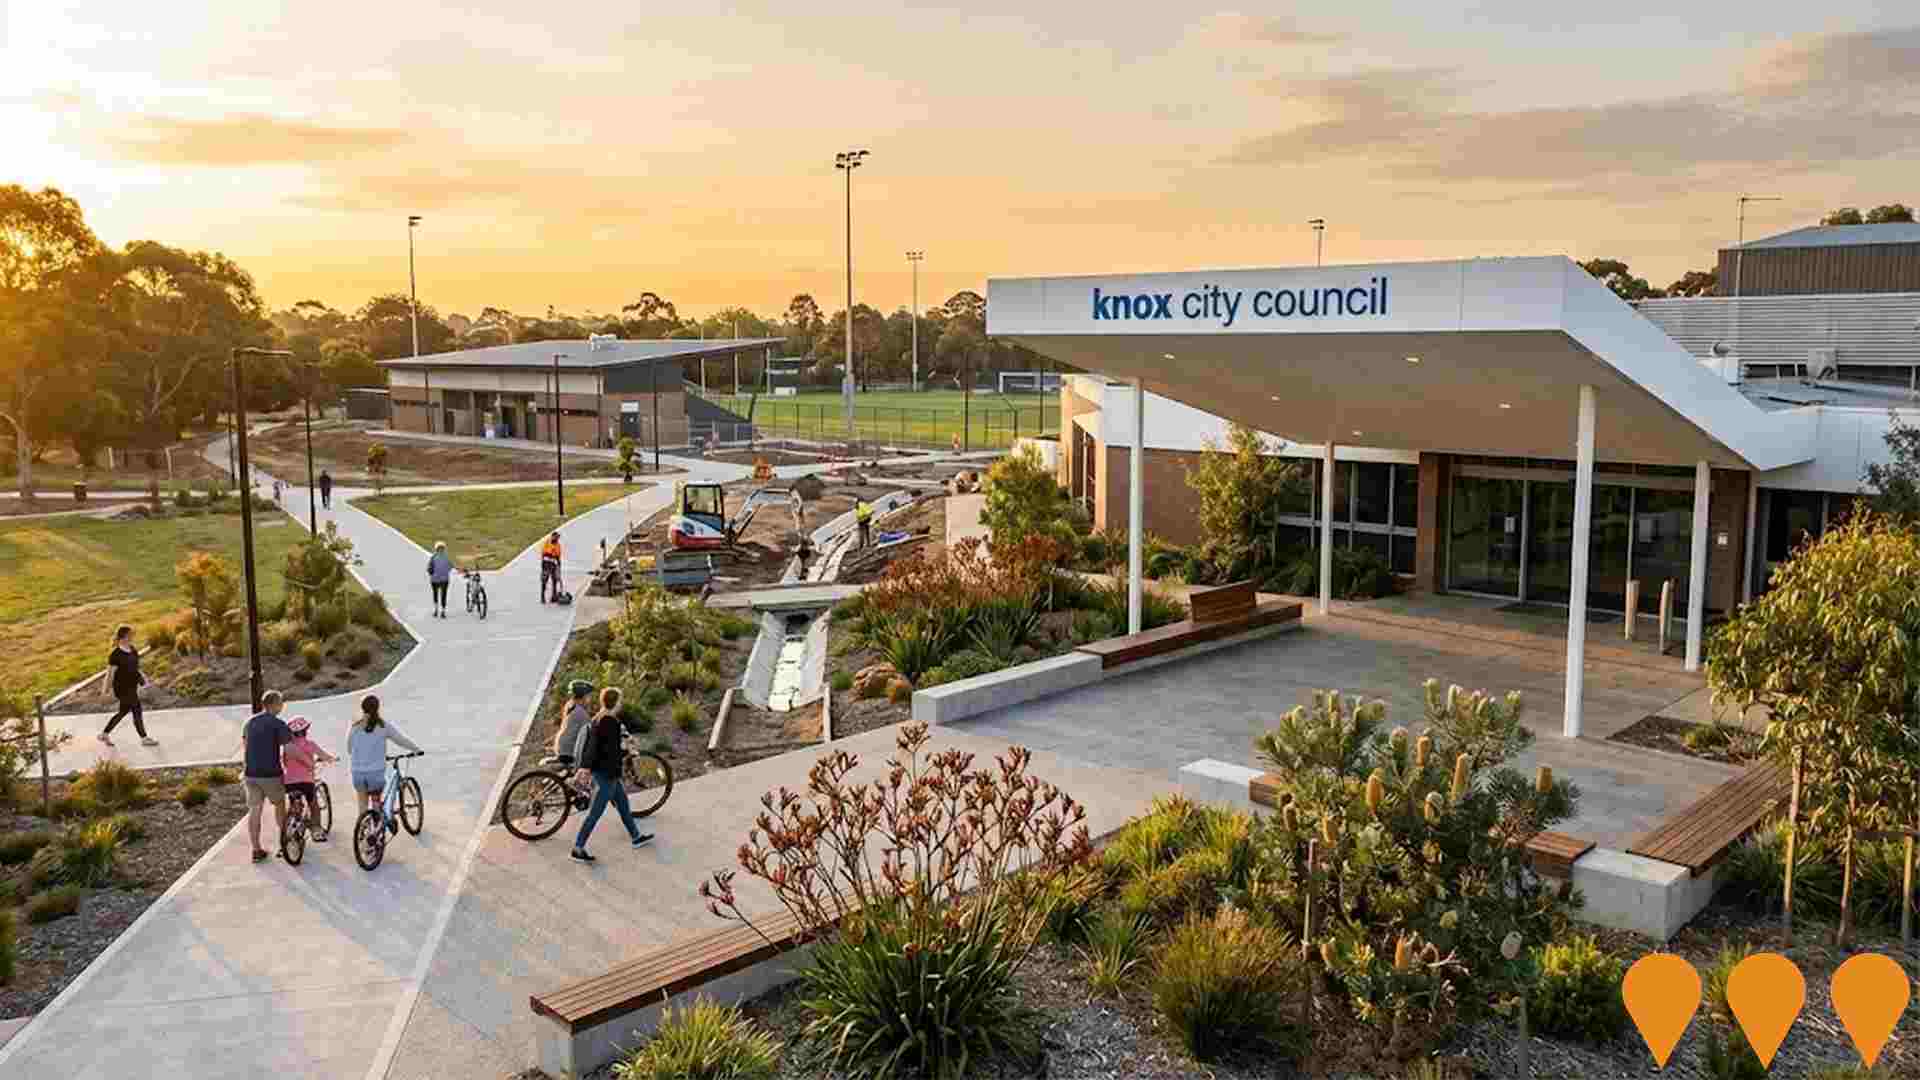
Knox City Council Capital Works Program 2025-26
Comprehensive $58 million capital works program including $9.2 million for sporting pavilion upgrades at Park Ridge Reserve, Wally Tew Reserve, Tormore Reserve and Carrington Park. $4.8 million for footpaths and cycling paths, $4.7 million for building maintenance, $4.5 million for sports fields including Marie Wallace Bayswater Oval, and $3.6 million for drainage infrastructure.
Employment
Vermont ranks among the top 25% of areas assessed nationally for overall employment performance
Vermont has a highly educated workforce. Its professional services sector is strong, with an unemployment rate of 2.2% and estimated employment growth of 1.5% over the past year.
As of September 2025, 5,808 residents are employed, with an unemployment rate of 2.5%, below Greater Melbourne's rate of 4.7%. Workforce participation is similar to Greater Melbourne's 64.1%. Leading employment industries among residents include health care & social assistance, education & training, and professional & technical services. Education & training has a notably high concentration, with employment levels at 1.2 times the regional average.
Transport, postal & warehousing, however, has limited presence at 2.9%, compared to 5.2% regionally. Over the year to September 2025, employment increased by 1.5% while labour force increased by 1.1%, reducing unemployment by 0.4 percentage points. In contrast, Greater Melbourne experienced higher employment growth of 3.0%. State-level data to 25-Nov-25 shows VIC employment grew by 1.13% year-on-year, adding 41,950 jobs, with the state unemployment rate at 4.7%, compared to the national rate of 4.3%. Jobs and Skills Australia's national employment forecasts from May-25 project a 6.6% increase over five years and 13.7% over ten years. Applying these projections to Vermont's employment mix suggests local employment should increase by 6.9% over five years and 14.1% over ten years, though this is a simple weighting extrapolation for illustrative purposes only.
Frequently Asked Questions - Employment
Income
Income analysis reveals strong economic positioning, with the area outperforming 60% of locations assessed nationally by AreaSearch
AreaSearch's latest postcode level ATO data for financial year 2022 shows Vermont SA2 had a median taxpayer income of $52,575 and an average of $72,523. Nationally, the median was lower at $49,861 with an average of $70,579. Greater Melbourne's figures were $54,892 (median) and $73,761 (average). By September 2025, estimates based on a 12.16% Wage Price Index growth suggest median income could reach $58,968 and average $81,342. The 2021 Census places Vermont SA2's household income at the 67th percentile ($2,042 weekly) and personal income at the 49th percentile. Most locals (31.4%, or 3,569 people) earn between $1,500 - 2,999 weekly, similar to surrounding regions (32.8%). High-earning households (exceeding $3,000 weekly) comprise 30.1% of the total, indicating strong consumer spending power after housing costs. After accounting for housing, 85.0% of income remains for other expenses. The area's SEIFA income ranking places it in the 8th decile.
Frequently Asked Questions - Income
Housing
Vermont is characterized by a predominantly suburban housing profile, with above-average rates of outright home ownership
Vermont's dwelling structures, as per the latest Census data, consisted of 79.7% houses and 20.3% other dwellings (semi-detached, apartments, 'other' dwellings). This compares to Melbourne metro's structure of 73.0% houses and 26.9% other dwellings. Home ownership in Vermont was at 40.1%, similar to Melbourne metro's level, with the remaining dwellings either mortgaged (40.7%) or rented (19.2%). The median monthly mortgage repayment in Vermont was $2,383, higher than Melbourne metro's average of $2,200. The median weekly rent figure in Vermont was $426, compared to Melbourne metro's $410. Nationally, Vermont's median mortgage repayments were significantly higher at $2,383 versus the Australian average of $1,863, and rents were substantially above the national figure of $375.
Frequently Asked Questions - Housing
Household Composition
Vermont features high concentrations of family households, with a higher-than-average median household size
Family households constitute 78.6% of all households, including 43.7% couples with children, 23.3% couples without children, and 10.6% single parent families. Non-family households comprise the remaining 21.4%, with lone person households at 19.6% and group households at 1.8%. The median household size is 2.8 people, larger than the Greater Melbourne average of 2.6.
Frequently Asked Questions - Households
Local Schools & Education
Vermont demonstrates exceptional educational outcomes, ranking among the top 5% of areas nationally based on AreaSearch's comprehensive analysis of qualification and performance metrics
Vermont's educational attainment is notably high with 42.1% of residents aged 15+ holding university qualifications, surpassing Australia's 30.4% and the SA4 region's 31.2%. Bachelor degrees are most prevalent at 26.3%, followed by postgraduate qualifications (11.9%) and graduate diplomas (3.9%). Vocational credentials are also prominent with 25.5% of residents aged 15+ holding them, including advanced diplomas (11.8%) and certificates (13.7%). Educational participation is high at 32.5%, with primary education enrollment at 11.6%, secondary education at 9.4%, and tertiary education at 5.5%.
Educational participation is notably high, with 32.5% of residents currently enrolled in formal education. This includes 11.6% in primary education, 9.4% in secondary education, and 5.5% pursuing tertiary education.
Frequently Asked Questions - Education
Schools Detail
Nearby Services & Amenities
Transport
Transport servicing is good compared to other areas nationally based on assessment of service frequency, route connectivity and accessibility
Vermont operates 50 active public transport stops, all serving buses. These stops are serviced by 16 routes, offering a total of 1,990 weekly passenger trips. Transport accessibility is rated excellent, with residents typically located 198 meters from the nearest stop.
Service frequency averages 284 trips per day across all routes, equating to approximately 39 weekly trips per individual stop.
Frequently Asked Questions - Transport
Transport Stops Detail
Health
Vermont's residents are extremely healthy with both young and old age cohorts seeing low prevalence of common health conditions
Analysis of health metrics indicates strong performance across Vermont, with both young and older age cohorts experiencing low prevalence of common health conditions.
Approximately 55% (~6,287 people) of the total population has private health cover, which is a very high rate. The most prevalent medical conditions in the area are asthma and arthritis, affecting 7.3 and 6.4% of residents respectively. A significant majority, 73.5%, reported being completely free from medical ailments, compared to 72.3% across Greater Melbourne. Vermont has 18.7% (2,127 people) of its residents aged 65 and over, which is lower than the 20.4% in Greater Melbourne. Health outcomes among seniors are above average and broadly align with the general population's health profile.
Frequently Asked Questions - Health
Cultural Diversity
Vermont is among the most culturally diverse areas in the country based on AreaSearch assessment of a range of language and cultural background related metrics
Vermont's population shows high cultural diversity, with 38.5% born overseas and 38.9% speaking a language other than English at home. Christianity is the predominant religion in Vermont, accounting for 41.8% of its population. Notably, Buddhism comprises 4.7%, which is higher than the 5.3% figure across Greater Melbourne.
The top three ancestry groups are English (19.9%), Chinese (18.1%), and Australian (18.0%). Some ethnic groups have notable differences in representation: Sri Lankan at 1.0% compared to 0.9%, Russian at 0.5% compared to 0.3%, and Indian at 4.7% compared to 3.9%.
Frequently Asked Questions - Diversity
Age
Vermont's population is slightly older than the national pattern
Vermont's median age is 40, which is slightly higher than Greater Melbourne's figure of 37 and Australia's average of 38 years. Comparing the two regions, Vermont has a notably higher percentage of individuals aged 5-14 (16.4% locally) but a lower percentage of those aged 25-34 (7.3%). Between 2021 and present, the 5-14 age group has increased from 15.5% to 16.4%, while the 25-34 cohort has decreased from 8.5% to 7.3%. During this period, the 0-4 age group has also dropped from 5.1% to 4.0%. Demographic projections indicate significant changes in Vermont's age profile by 2041. The 45-54 age cohort is expected to grow by 371 people (23%) from 1,637 to 2,009. Conversely, both the 0-4 and 35-44 age groups are projected to decrease in number.
