Chart Color Schemes
This analysis uses ABS Statistical Areas Level 2 (SA2) boundaries, which can materially differ from Suburbs and Localities (SAL) even when sharing similar names.
SA2 boundaries are defined by the Australian Bureau of Statistics and are designed to represent communities for statistical reporting (e.g., census and ERP).
Suburbs and Localities (SAL) represent commonly-used suburb/locality names (postal-style areas) and may use different geographic boundaries. For comprehensive analysis, consider reviewing both boundary types if available.
est. as @ -- *
ABS ERP | -- people | --
2021 Census | -- people
Sales Activity
Curious about local property values? Filter the chart to assess the volume and appreciation (including resales) trends and regional comparisons, or scroll to the map below view this information at an individual property level.
Find a Recent Sale
Sales Detail
Population
Strathmore has seen population growth performance typically on par with national averages when looking at short and medium term trends
Strathmore's population was approximately 10,493 as of November 2025. This figure indicates a growth of 462 people, representing a 4.6% increase since the 2021 Census, which recorded a population of 10,031. The change is inferred from ABS's estimated resident population of 10,457 in June 2024 and an additional 40 validated new addresses since the Census date. This results in a population density ratio of 2,534 persons per square kilometer, placing Strathmore in the upper quartile relative to other locations assessed by AreaSearch. The area's growth rate of 4.6% since the 2021 census exceeded that of the SA3 area at 4.5%, positioning it as a growth leader in the region. Overseas migration contributed approximately 77.7% of overall population gains during recent periods, driving primary population growth for Strathmore.
AreaSearch adopts ABS/Geoscience Australia projections for each SA2 area released in 2024 with a base year of 2022. For areas not covered by this data, AreaSearch employs the VIC State Government's Regional/LGA projections released in 2023, adjusted using a method of weighted aggregation of population growth from LGA to SA2 levels. Growth rates by age group are applied across all areas for years 2032 to 2041 based on these aggregations. Demographic trends suggest that Strathmore's population is expected to increase just below the median of statistical areas nationally, with an anticipated growth of 1,321 persons by 2041, reflecting a total increase of 12.2% over the 17-year period based on the latest annual ERP population numbers.
Frequently Asked Questions - Population
Development
Recent residential development output has been above average within Strathmore when compared nationally
Strathmore has recorded approximately 66 residential properties granted approval per year over the past five financial years, totalling 330 homes. As of FY26, 16 approvals have been recorded. On average, 0.4 people moved to the area annually for each dwelling built between FY21 and FY25, indicating that new supply is meeting or exceeding demand. The average construction value of new homes is $640,000, suggesting developers are targeting the premium market segment with higher-end properties.
This financial year has seen $8.1 million in commercial approvals, reflecting Strathmore's primarily residential nature. Compared to Greater Melbourne, Strathmore maintains similar construction rates per person, preserving market equilibrium consistent with surrounding areas. New building activity comprises 40.0% standalone homes and 60.0% townhouses or apartments, promoting higher-density living and creating more affordable entry points for downsizers, investors, and first-home buyers. This marks a significant shift from the current housing mix of 77.0% houses, likely due to reduced development site availability and changing lifestyle demands. Strathmore has approximately 150 people per dwelling approval, indicating a low-density market.
By 2041, Strathmore is projected to grow by 1,285 residents (AreaSearch quarterly estimate). At current development rates, new housing supply should comfortably meet demand, providing favourable conditions for buyers and potentially supporting growth beyond current population projections.
Frequently Asked Questions - Development
Infrastructure
Strathmore has moderate levels of nearby infrastructure activity, ranking in the top 50% nationally
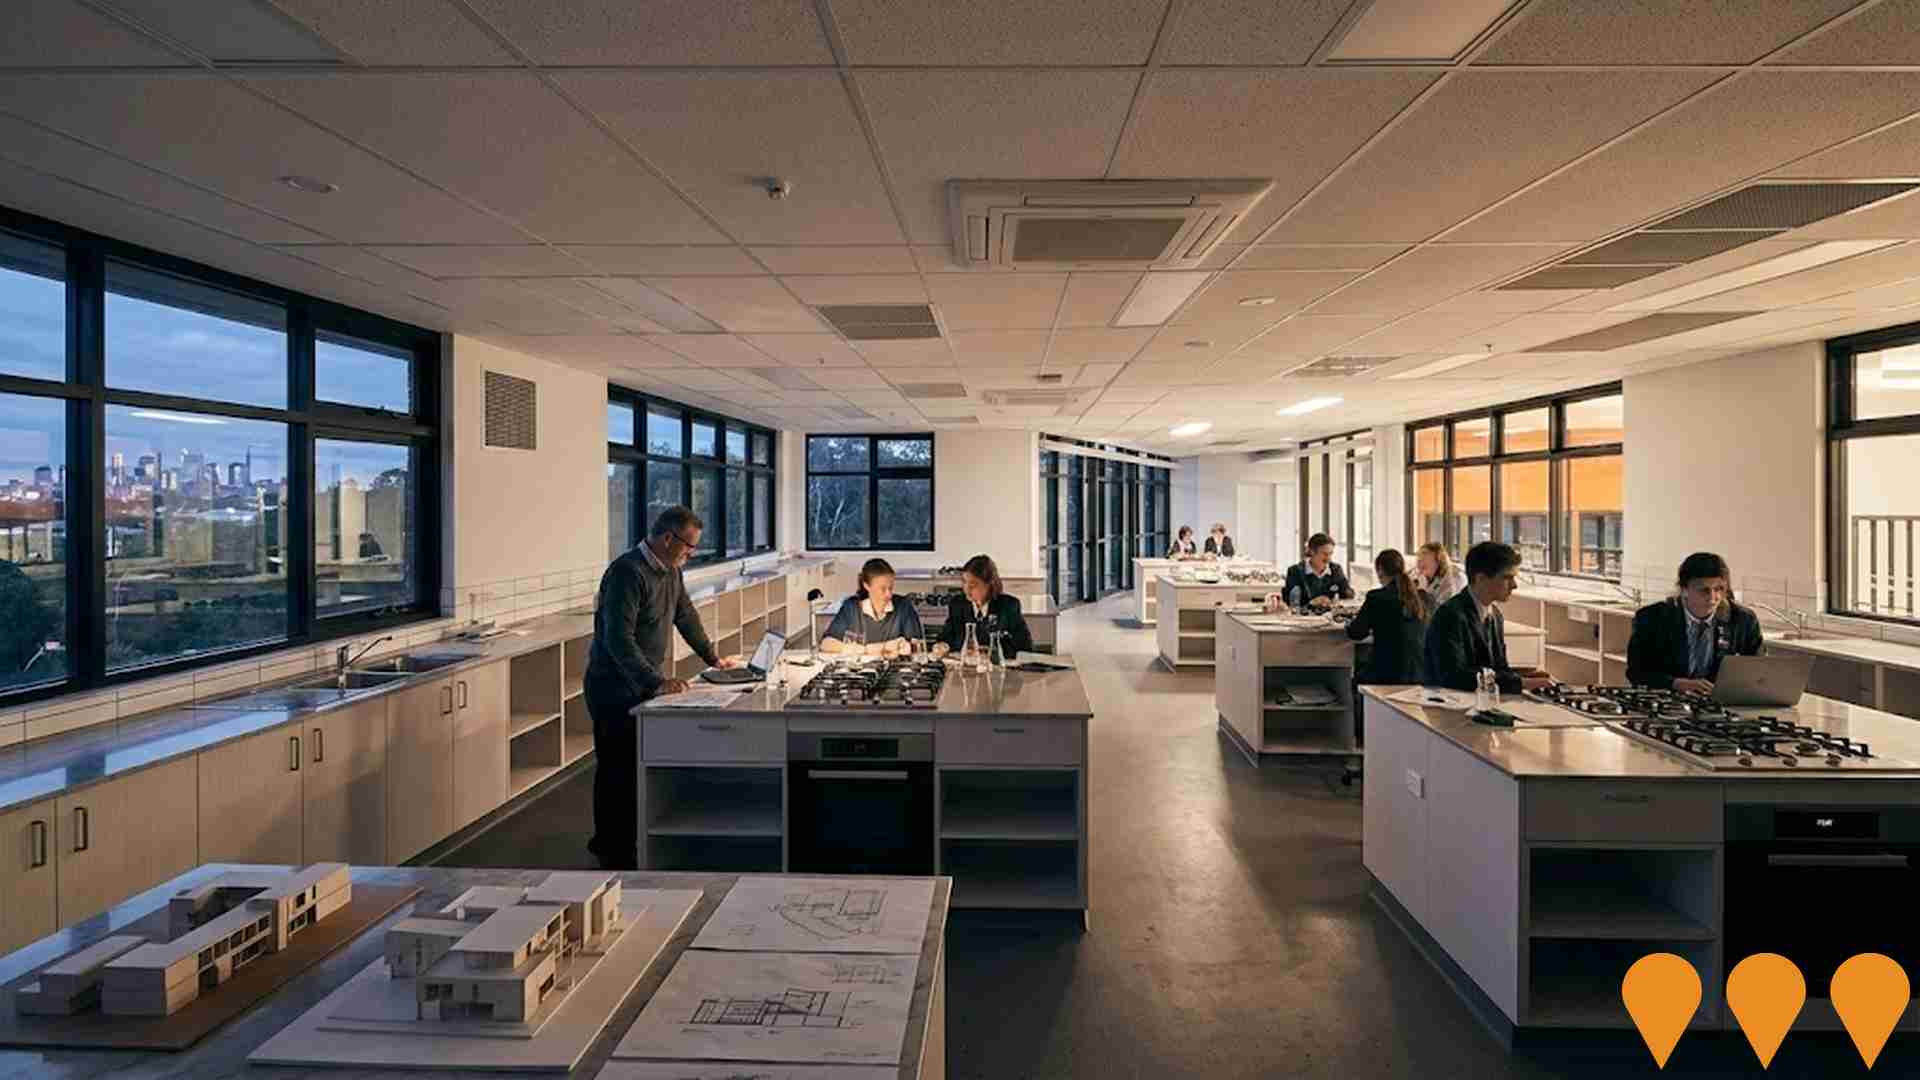
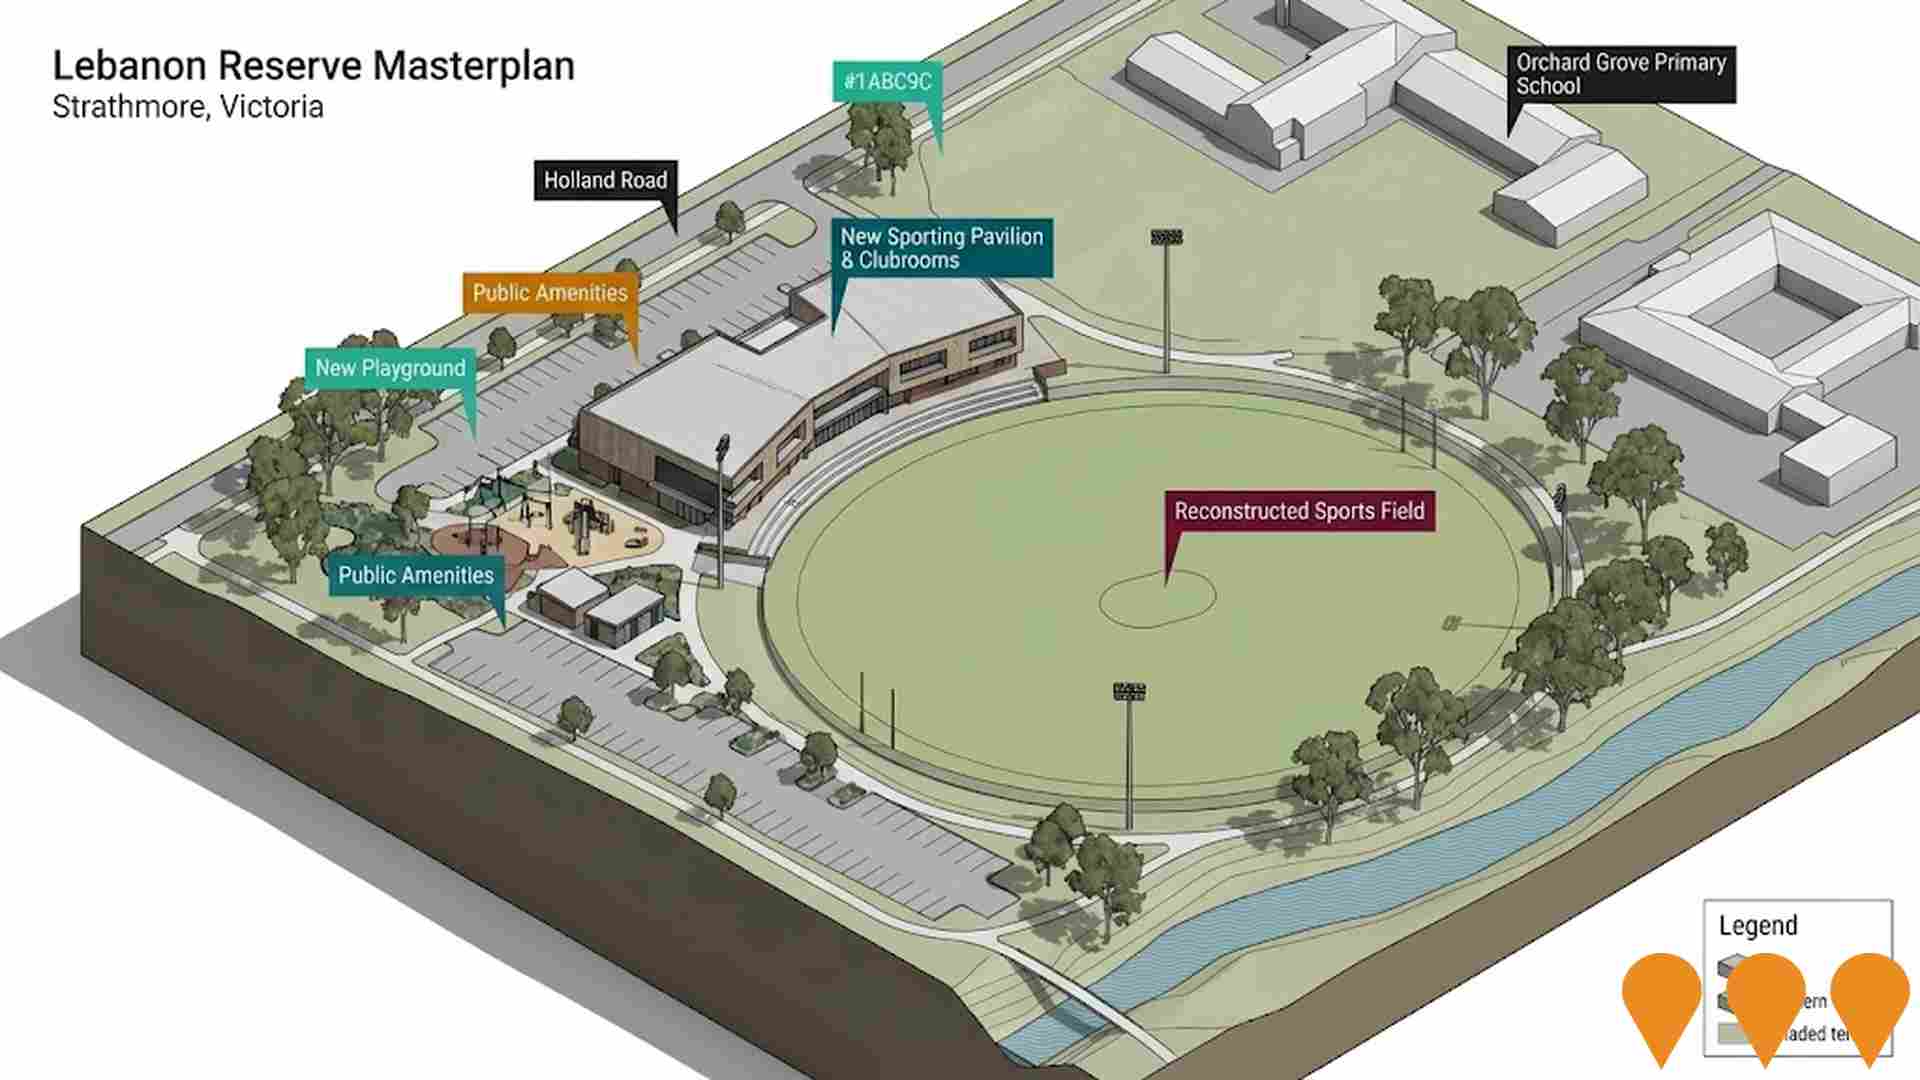
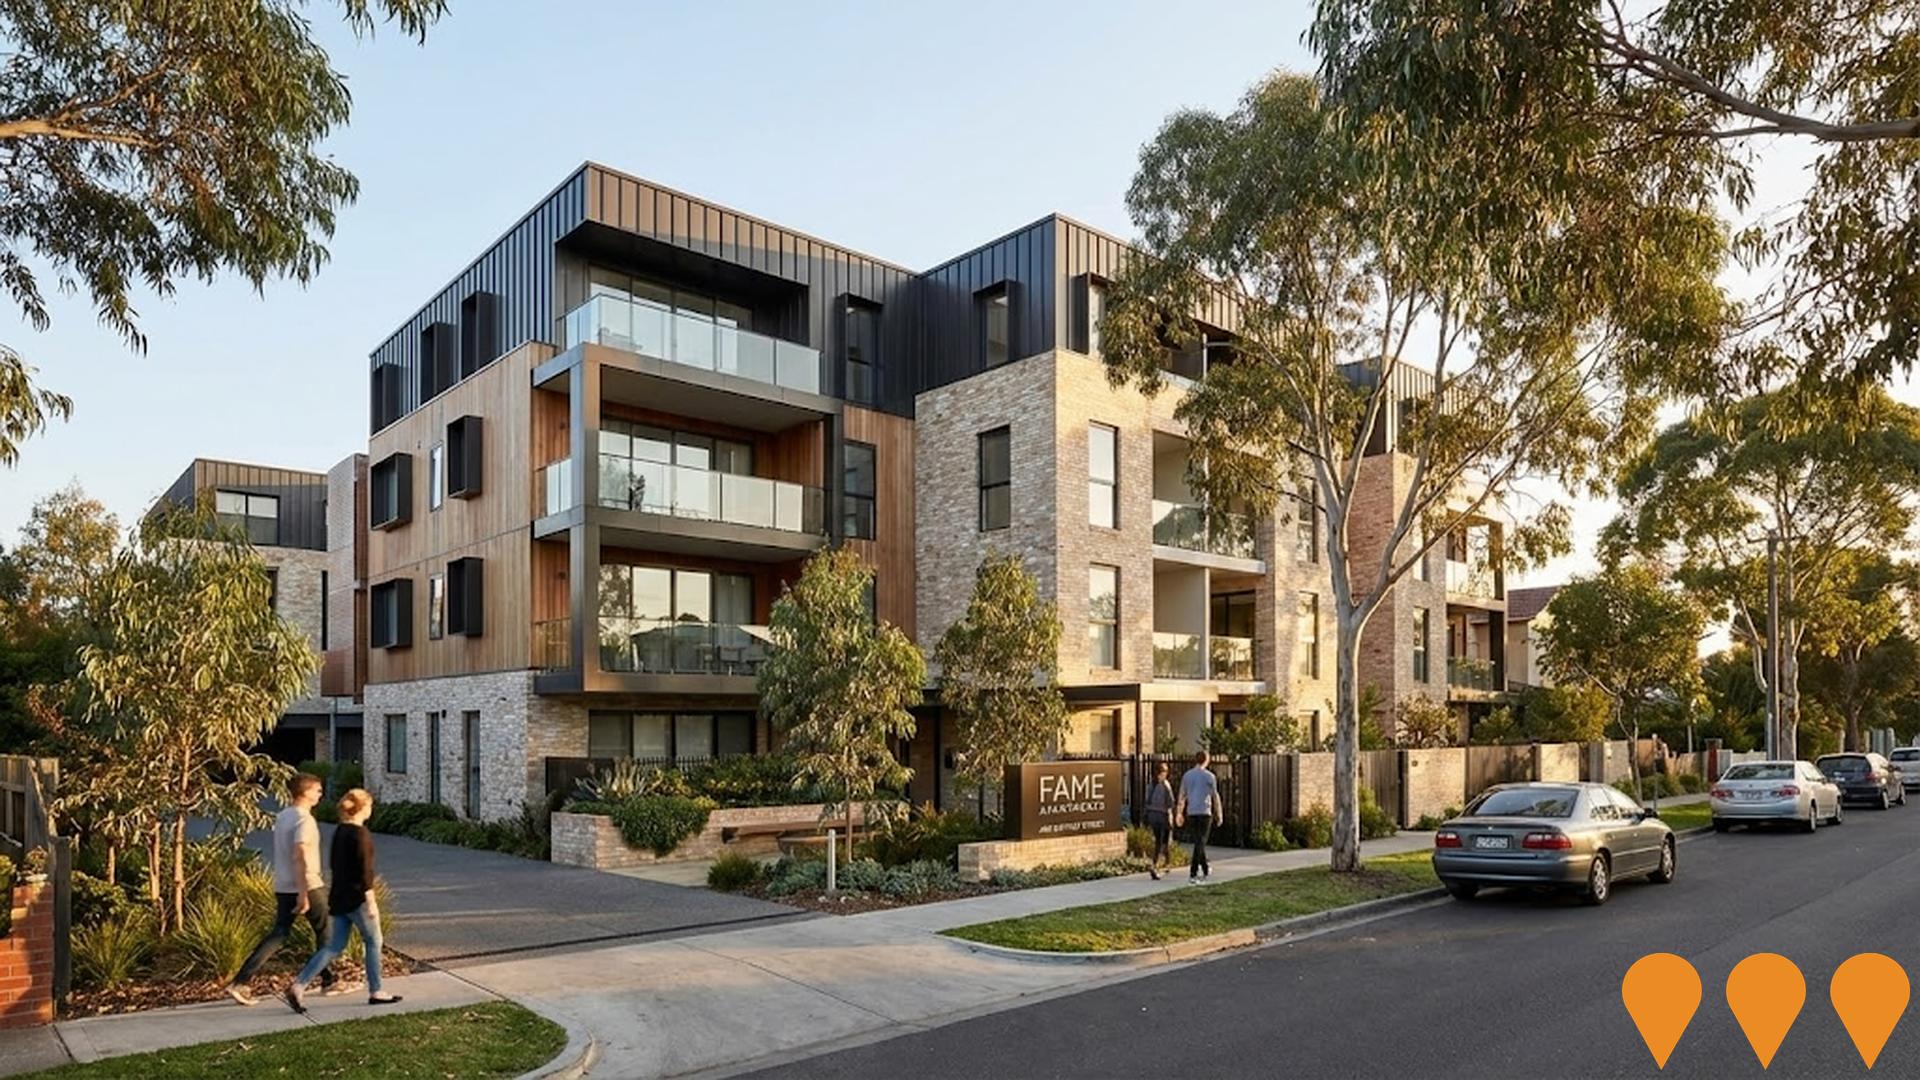
Changes to local infrastructure significantly impact an area's performance. AreaSearch identified 40 projects that could affect this region. Notable ones include Hart Precinct, Oak Park Sports and Aquatic Centre Redevelopment, Airport Toyota Expansion, and 299 Pascoe Vale Road Mixed-Use Development. The following list details those most likely to be relevant.
Professional plan users can use the search below to filter and access additional projects.
INFRASTRUCTURE SEARCH
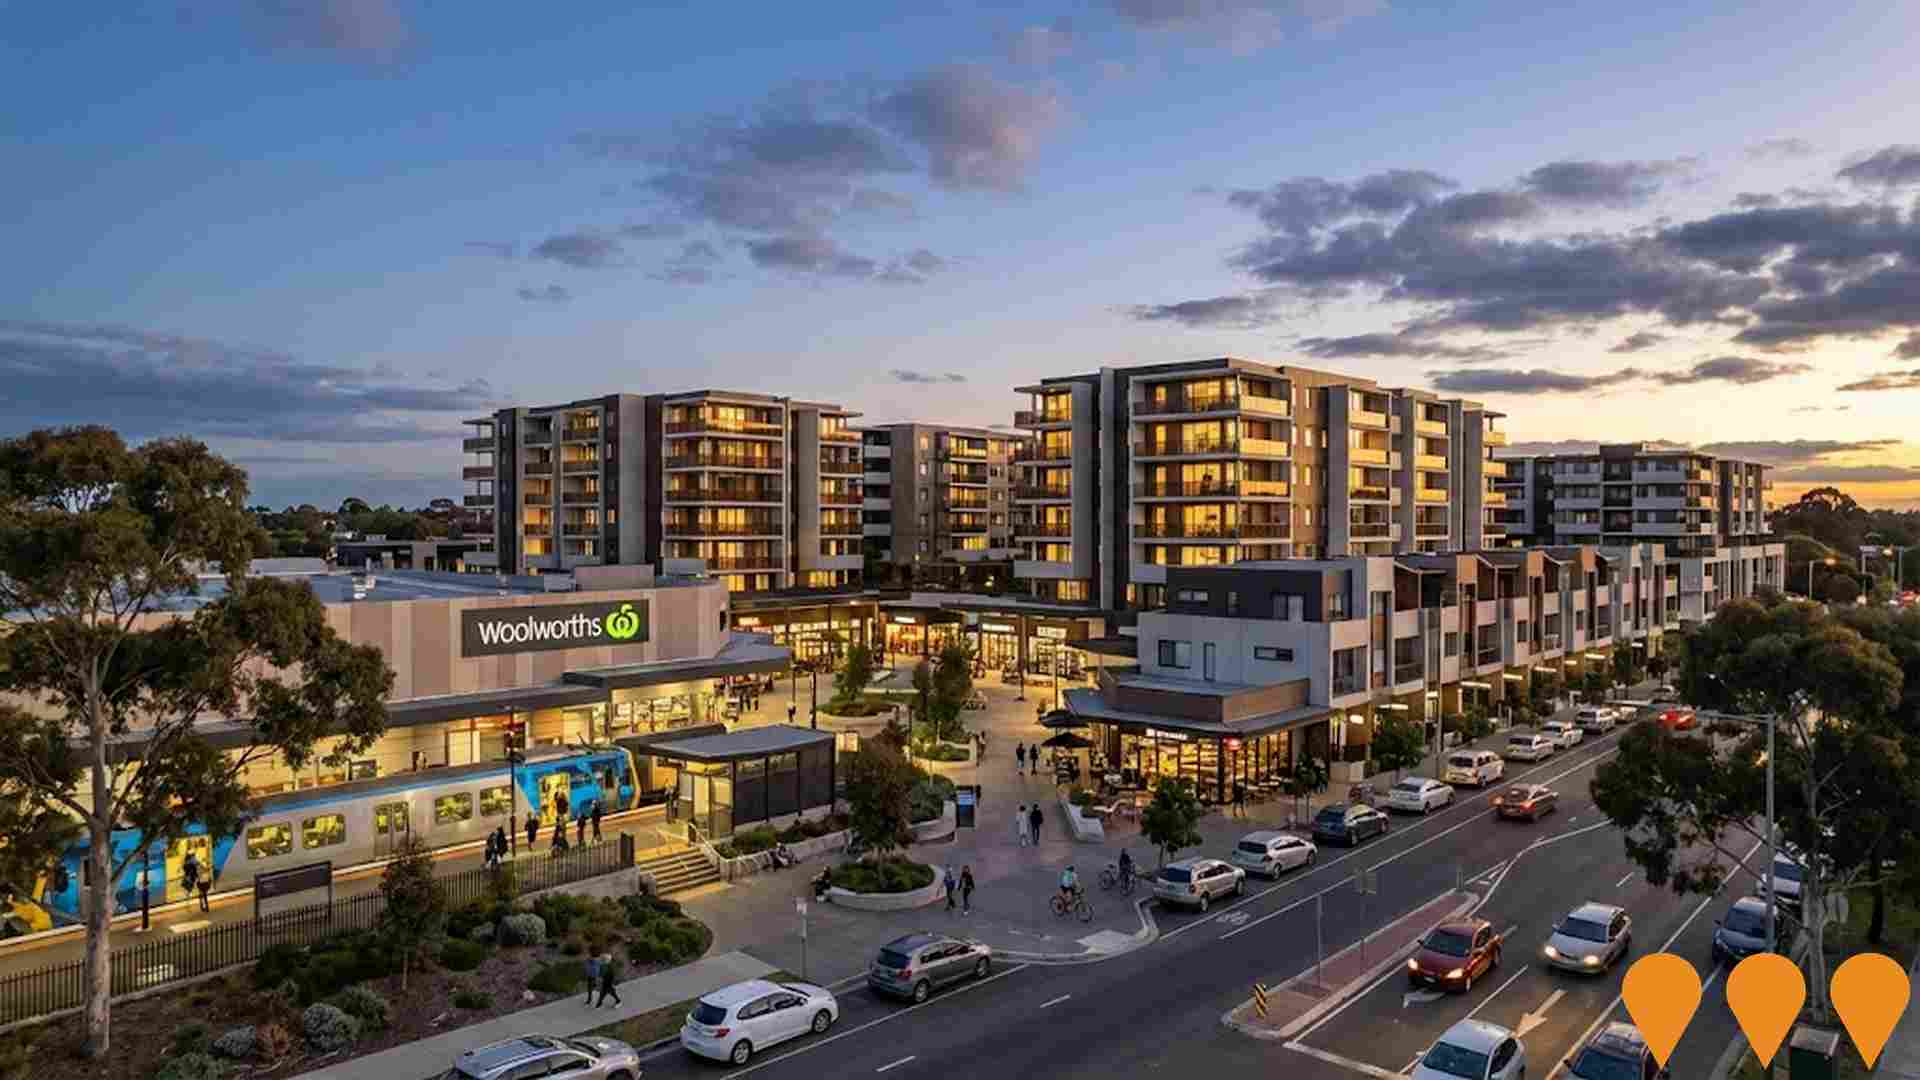
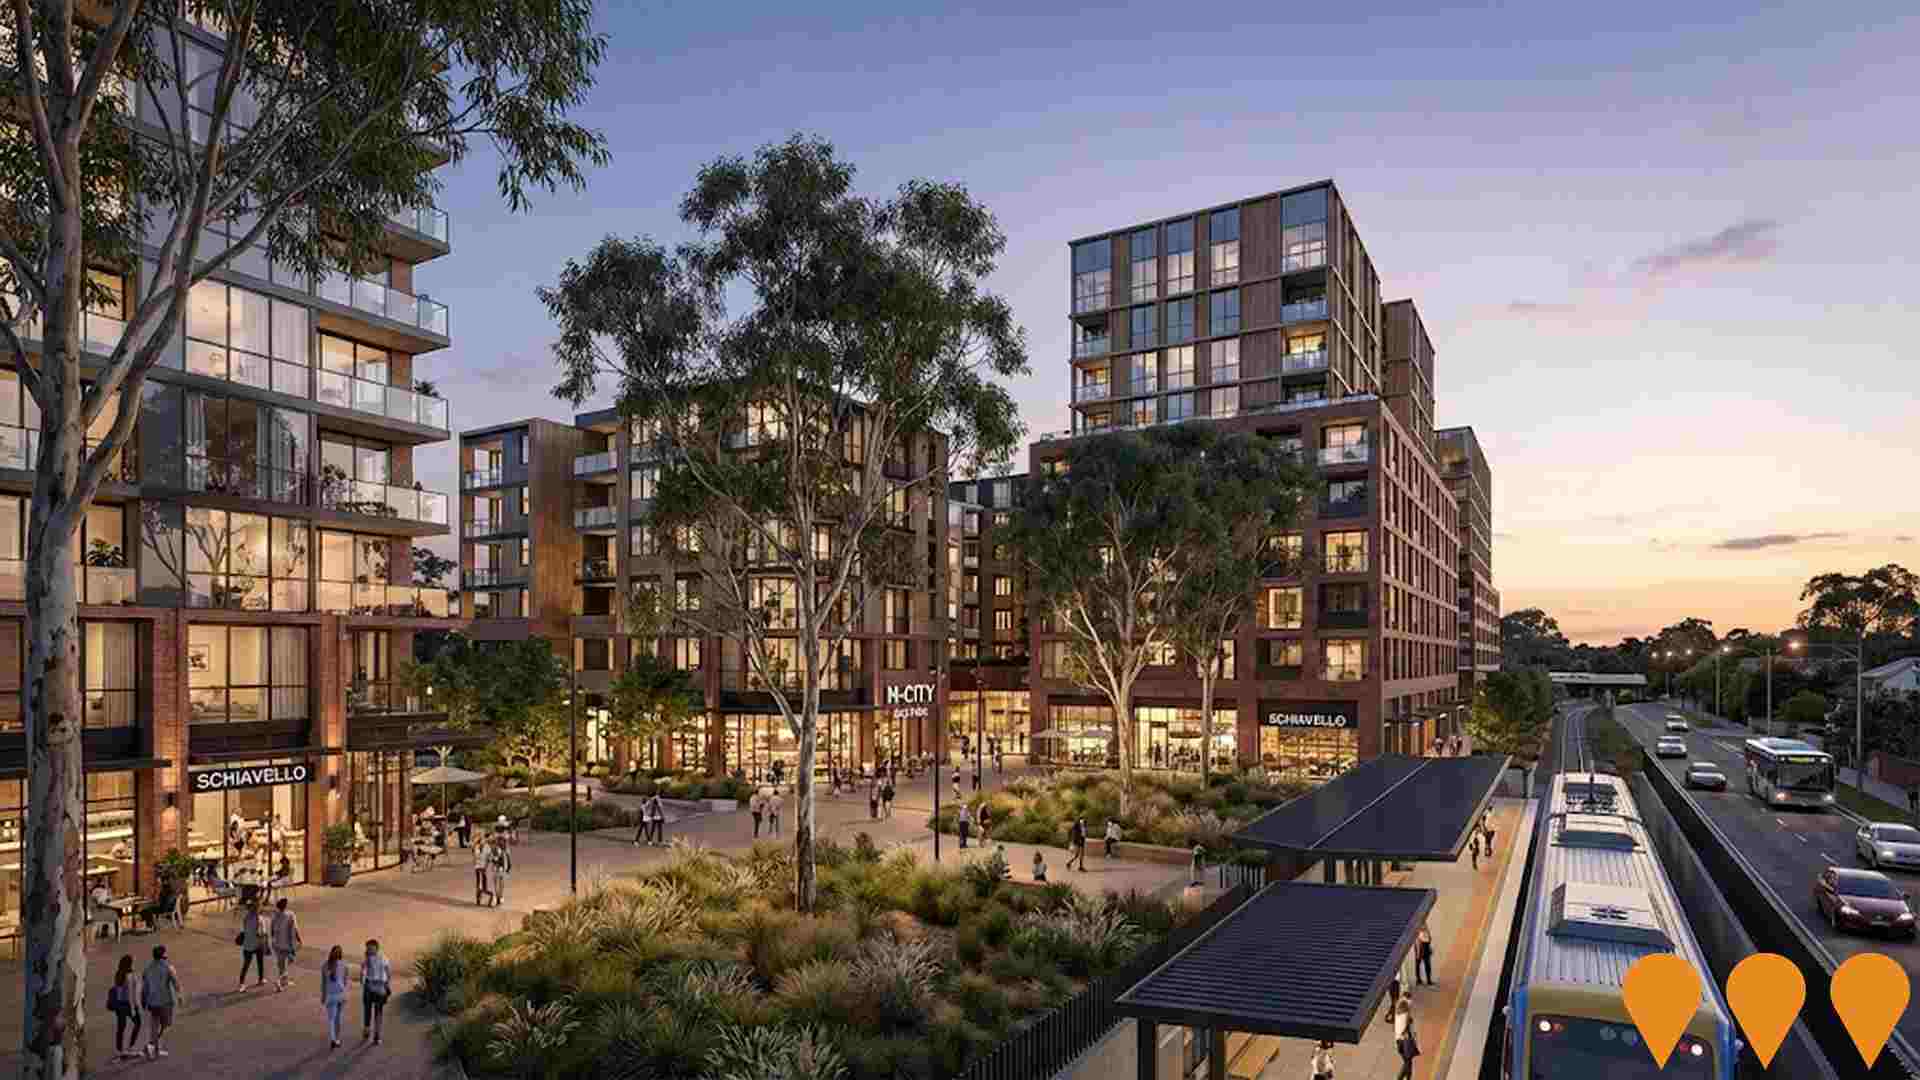
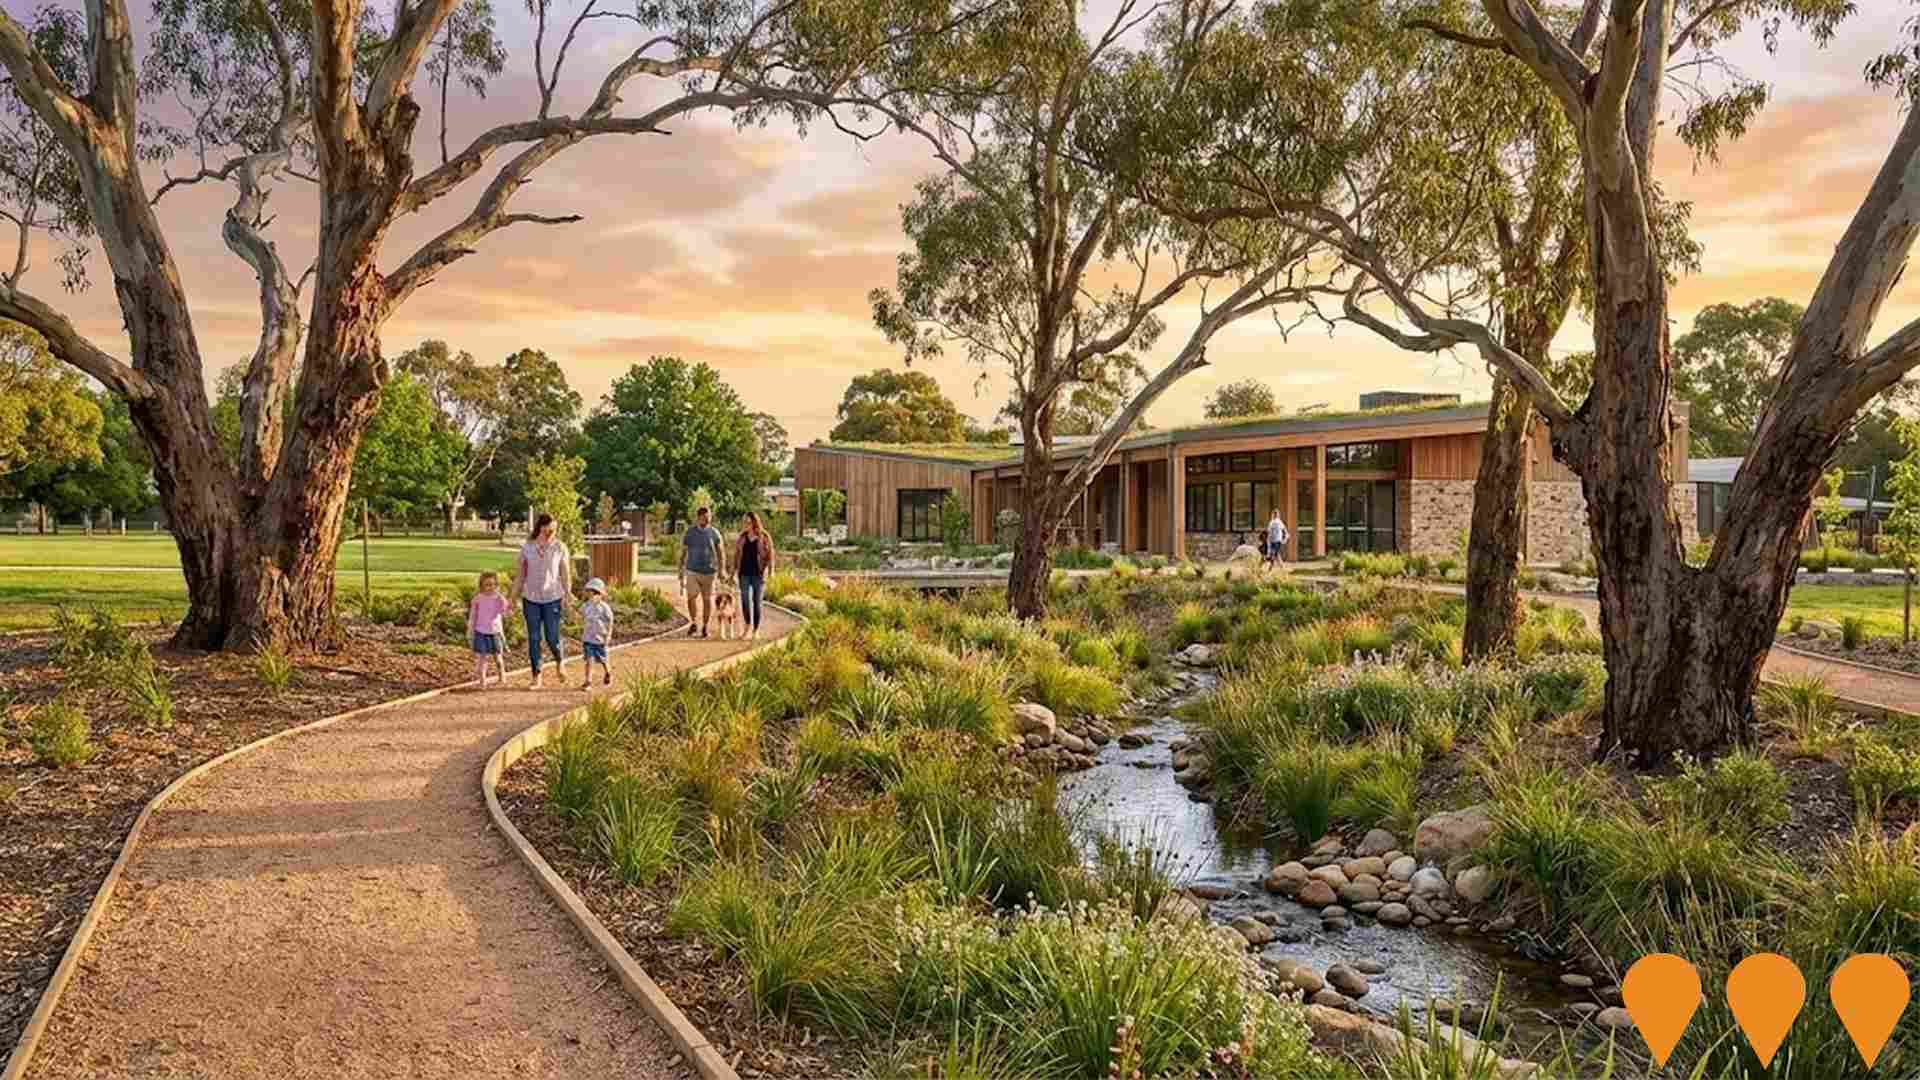
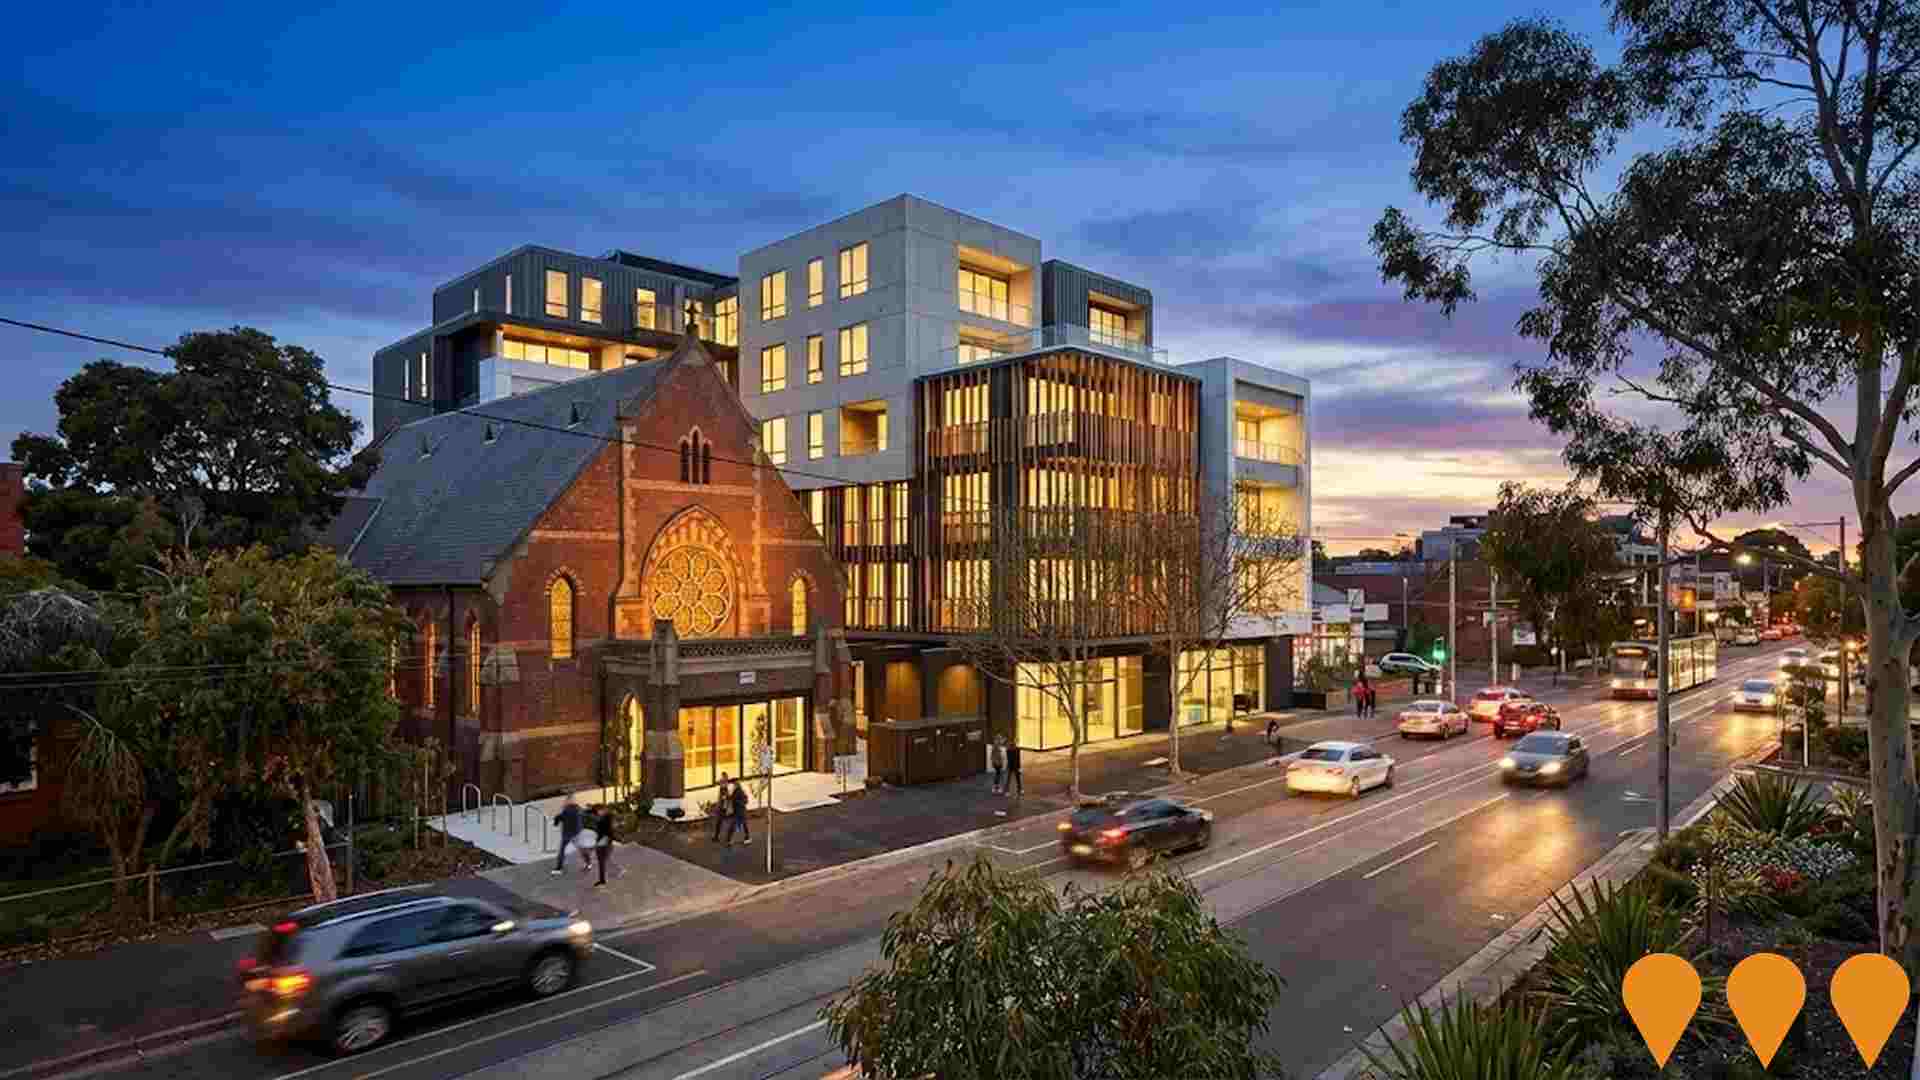
 Denotes AI-based impression for illustrative purposes only, not to be taken as definitive under any circumstances. Please follow links and conduct other investigations from the project's source for actual imagery. Developers and project owners wishing us to use original imagery please Contact Us and we will do so.
Frequently Asked Questions - Infrastructure
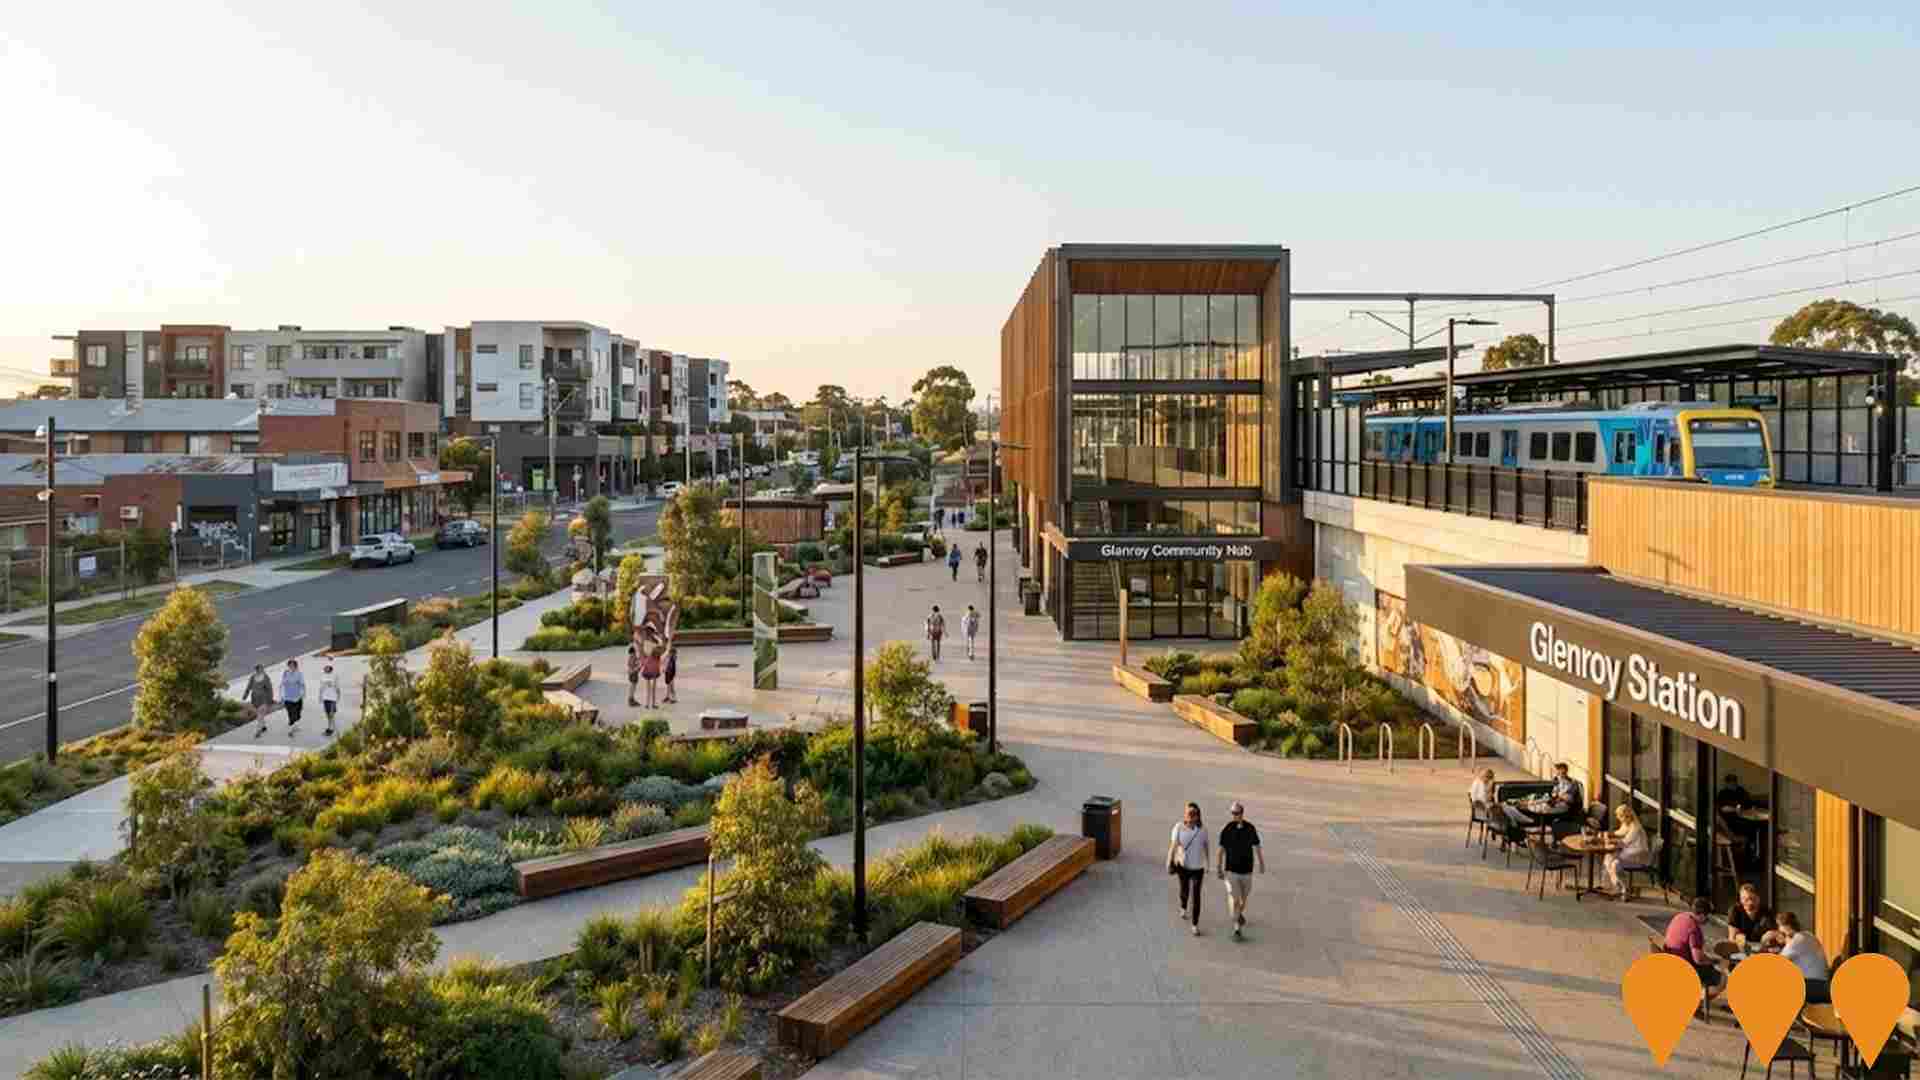
Glenroy Structure Plan
Long-term strategic framework (adopted 2008, refreshed 2021) guiding the regeneration of Glenroy Activity Centre into a vibrant mixed-use precinct. Key completed projects include Glenroy Community Hub (opened 2022) and Glenroy Station redevelopment with level crossing removal (completed 2022). Ongoing works focus on public realm upgrades, new civic spaces, and enabling higher-density mixed-use development around the station precinct.
Niddrie (Keilor Road) Activity Centre) Structure Plan
The Niddrie (Keilor Road) Activity Centre Structure Plan was approved in November 2024 via Amendment GC251 as part of the Victorian Government's Activity Centres Program. It establishes a planning framework to deliver at least 3,400 new dwellings by 2051 through mixed-use development, with building heights up to 10 storeys (36 metres) in the core area and 6-8 storeys elsewhere. The plan rezones land to Activity Centre Zone (ACZ1) and applies new DDOs and parking overlays to guide future development around Keilor Road and North Essendon.
Hart Precinct
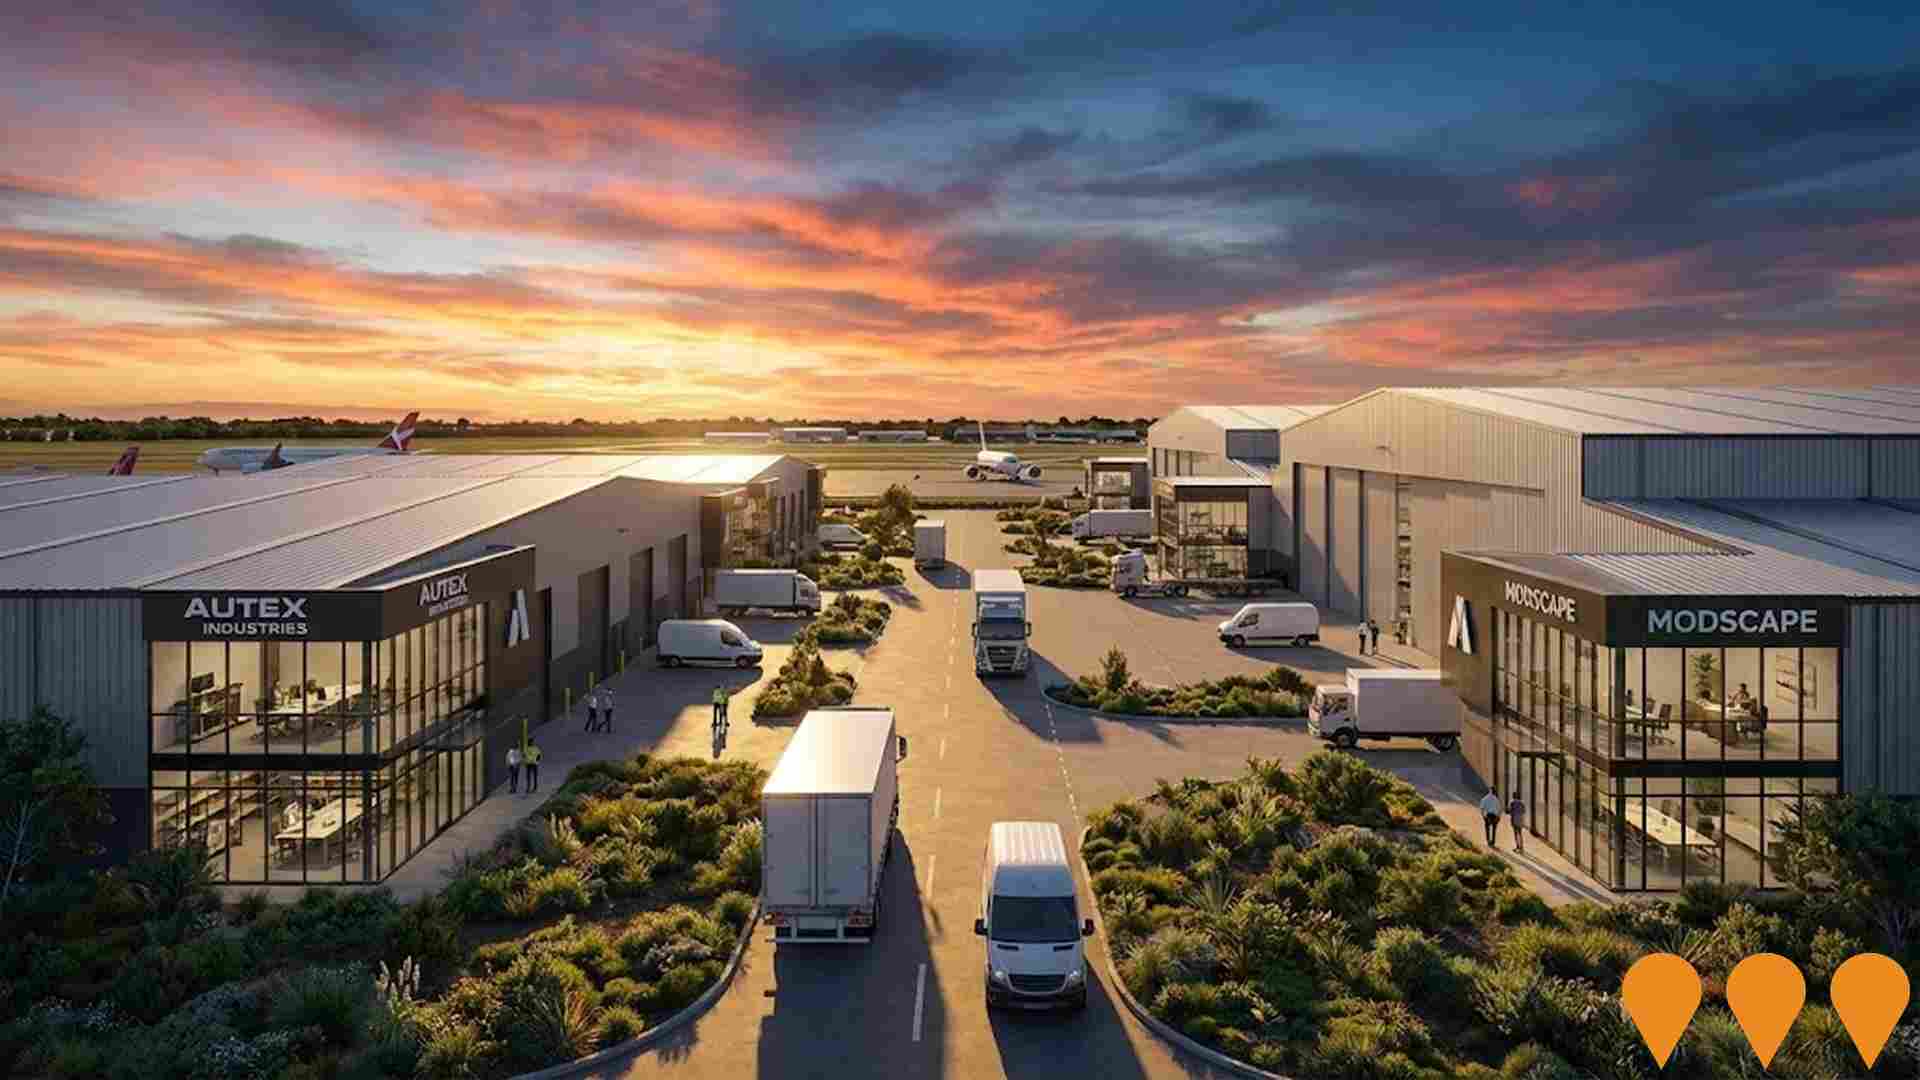
30-hectare greenfield light industrial and aviation business park at Essendon Fields, 15 minutes from Melbourne CBD. Officially opened February 2025 and named after aviation pioneer James 'Bob' Hart. Offers large-format industrial lots with direct taxiway access, modern hangars and commercial facilities. Stage 1 tenants include Autex Industries (50,000 sqm advanced manufacturing facility), Modscape (20,000 sqm modular construction factory) and Dutton Group wholesale vehicle storage. Forms a key part of the ongoing transformation of the former Essendon Airport into a mixed-use employment and lifestyle precinct.
Oak Park Sports and Aquatic Centre Redevelopment
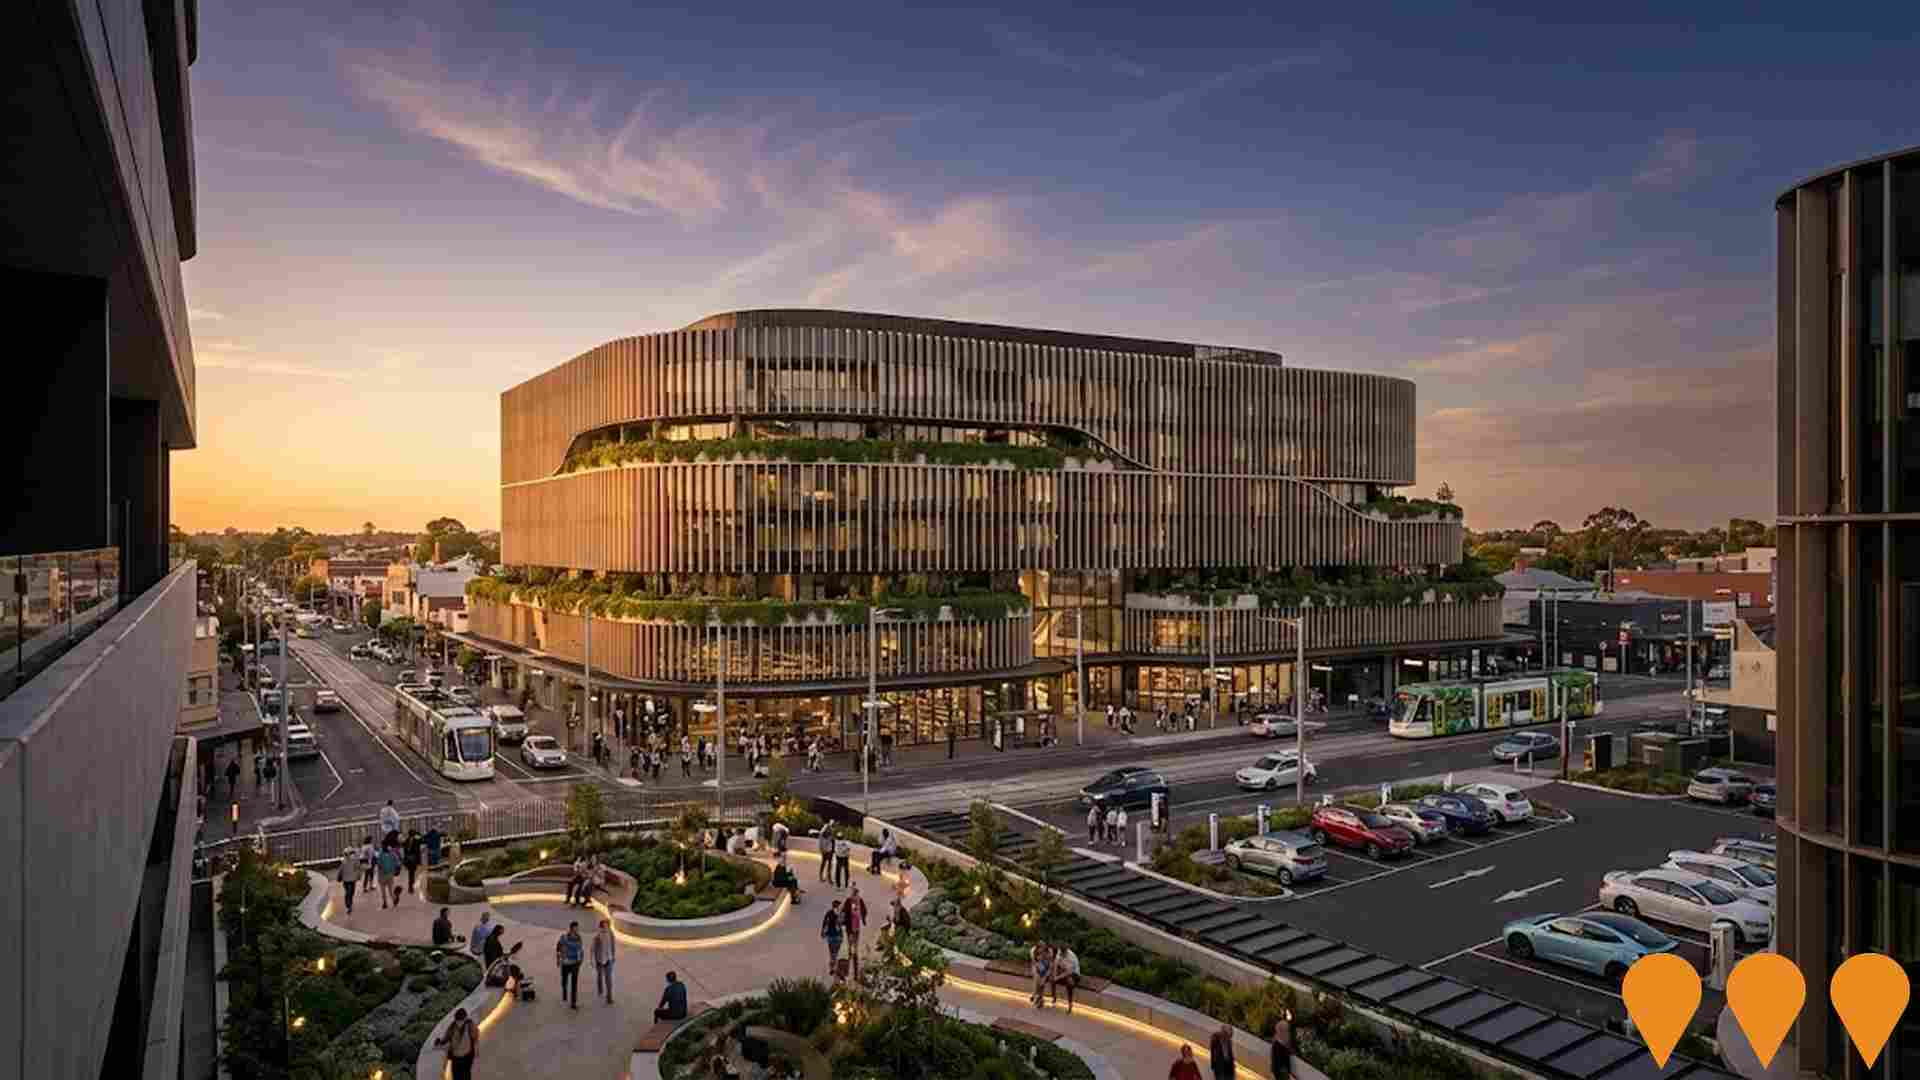
Major $42.5 million redevelopment of the existing Oak Park Sports and Aquatic Centre including a new 25m indoor pool, learn-to-swim pool, warm water program pool, spa/sauna/steam facilities, expanded gym, and multi-purpose community spaces.

Airport Toyota Expansion
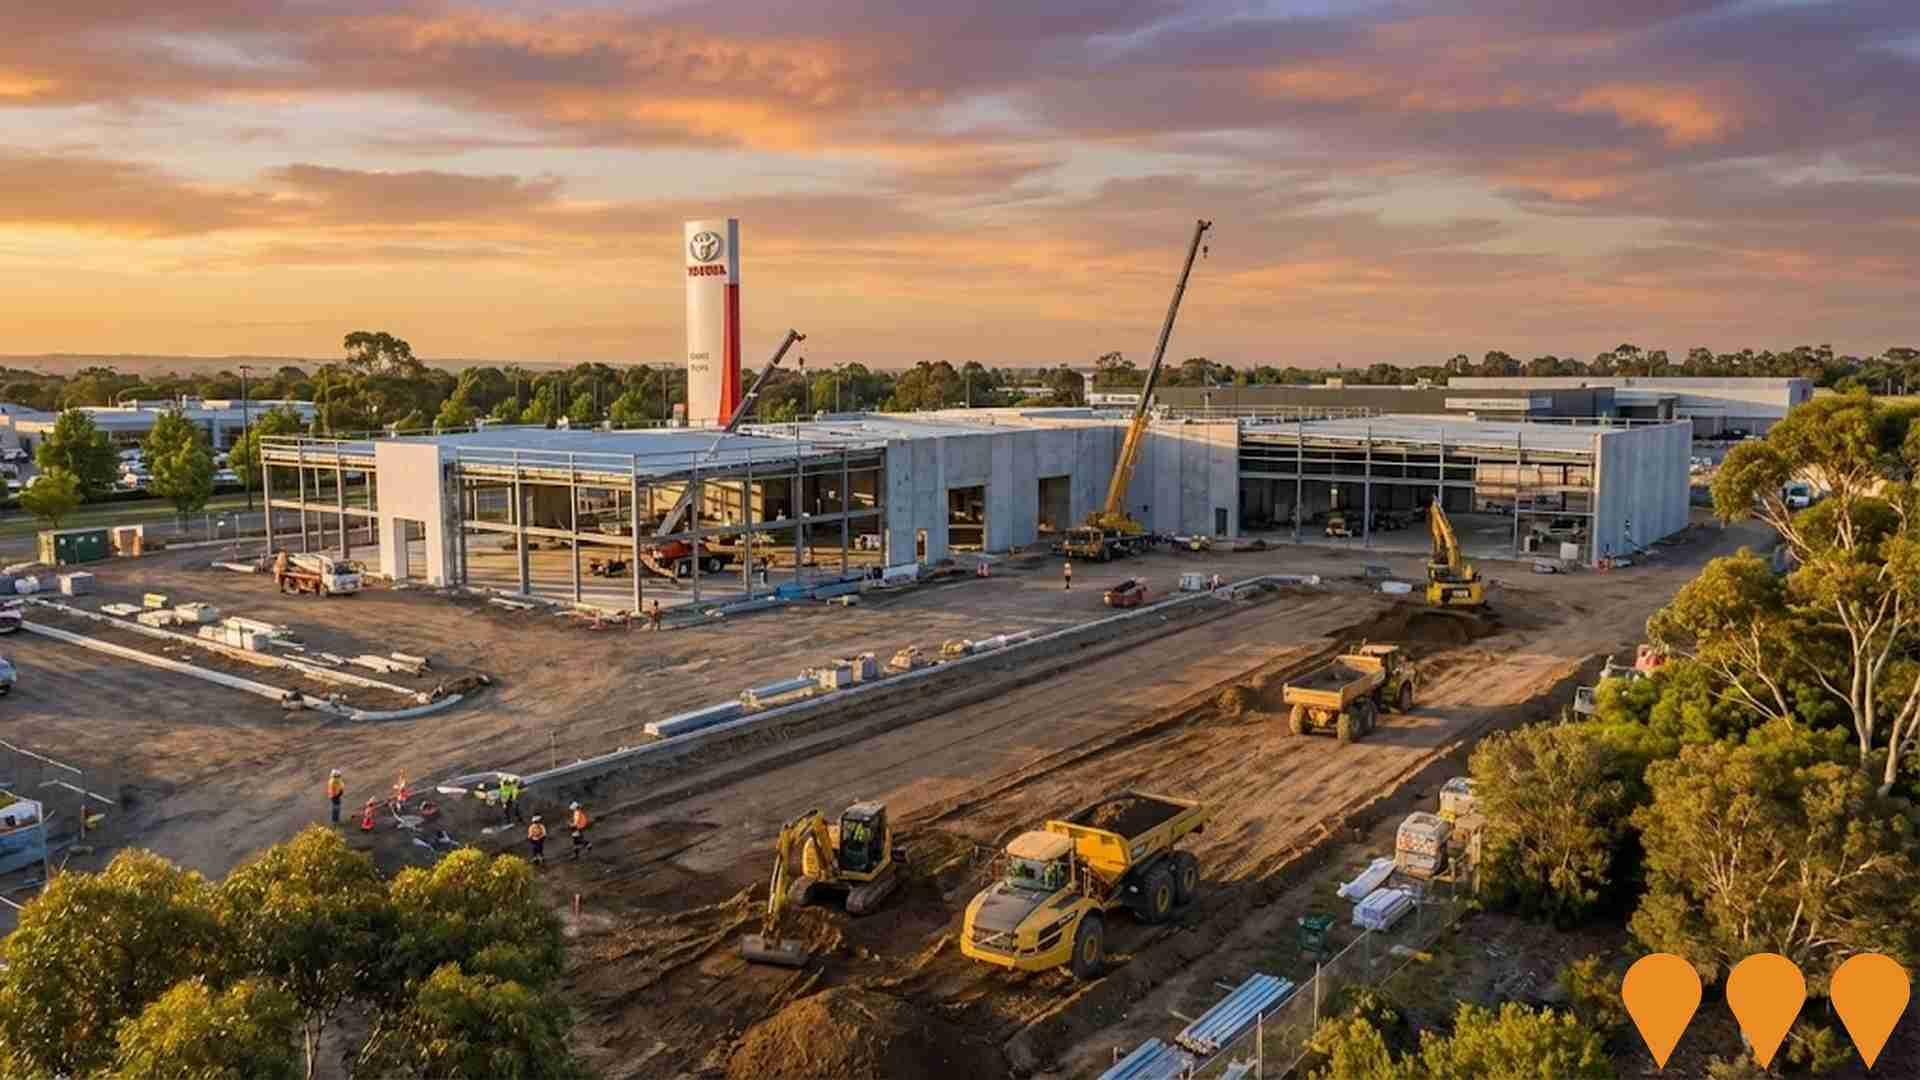
Expansion into larger custom-built 10,900 sqm facility with 2,500 sqm showroom, 2,000 sqm workshop and mezzanine showroom. Designed by JMA Architects, built by 2Construct. Part of Australia's largest automotive precinct with $1 billion annual sales.
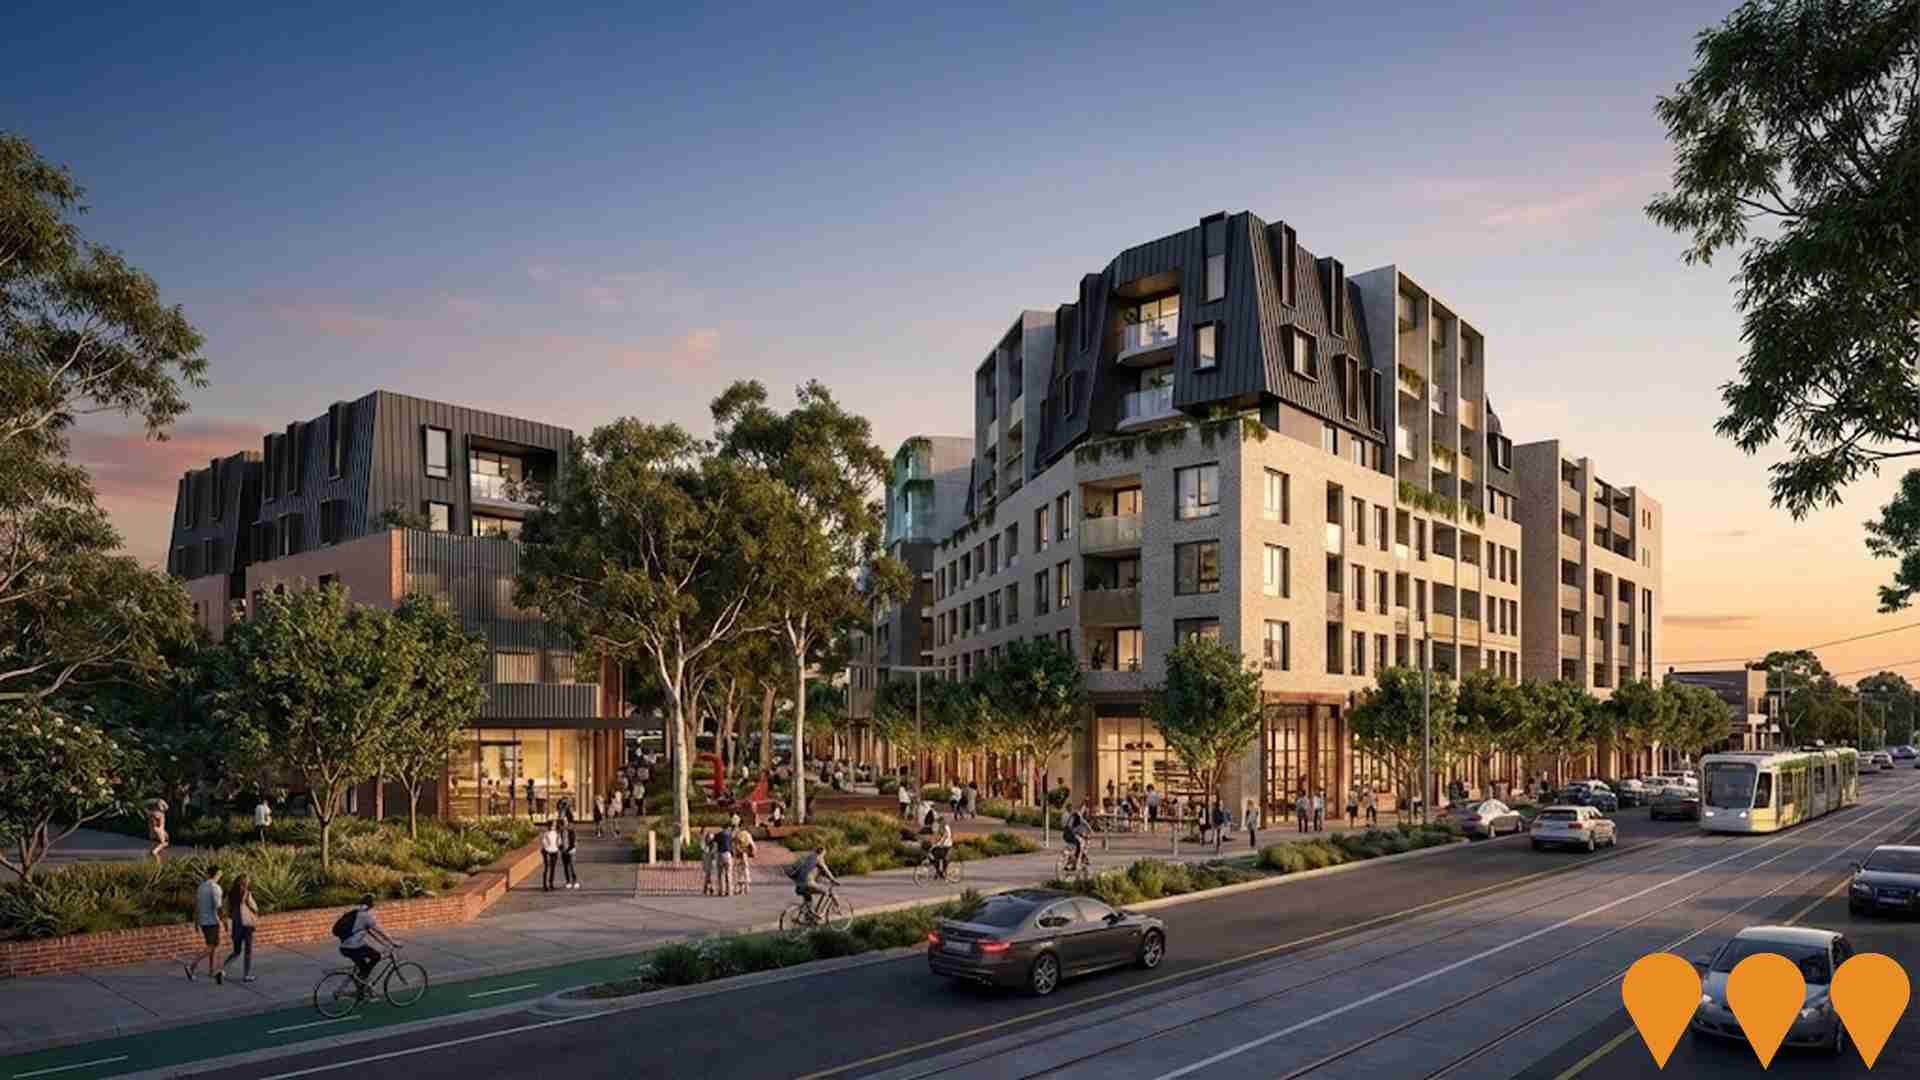
299 Pascoe Vale Road Mixed-Use Development
Multi-stage mixed-use development embracing the 20-minute neighbourhood concept. Stage 1 includes 6-storey mixed-use building with 25,000sqm retail, supermarkets, cinema, entertainment facilities, premium gym, medical centre, veterinary centre, childcare centre, and 20,000sqm car parking. Stage 2 features 2 residential buildings ranging from 7 storeys facing Pascoe Vale Road to 11 storeys facing rail corridor. The development includes green plaza, sustainable elements like solar PV, rainwater harvesting, and EV charging stations.
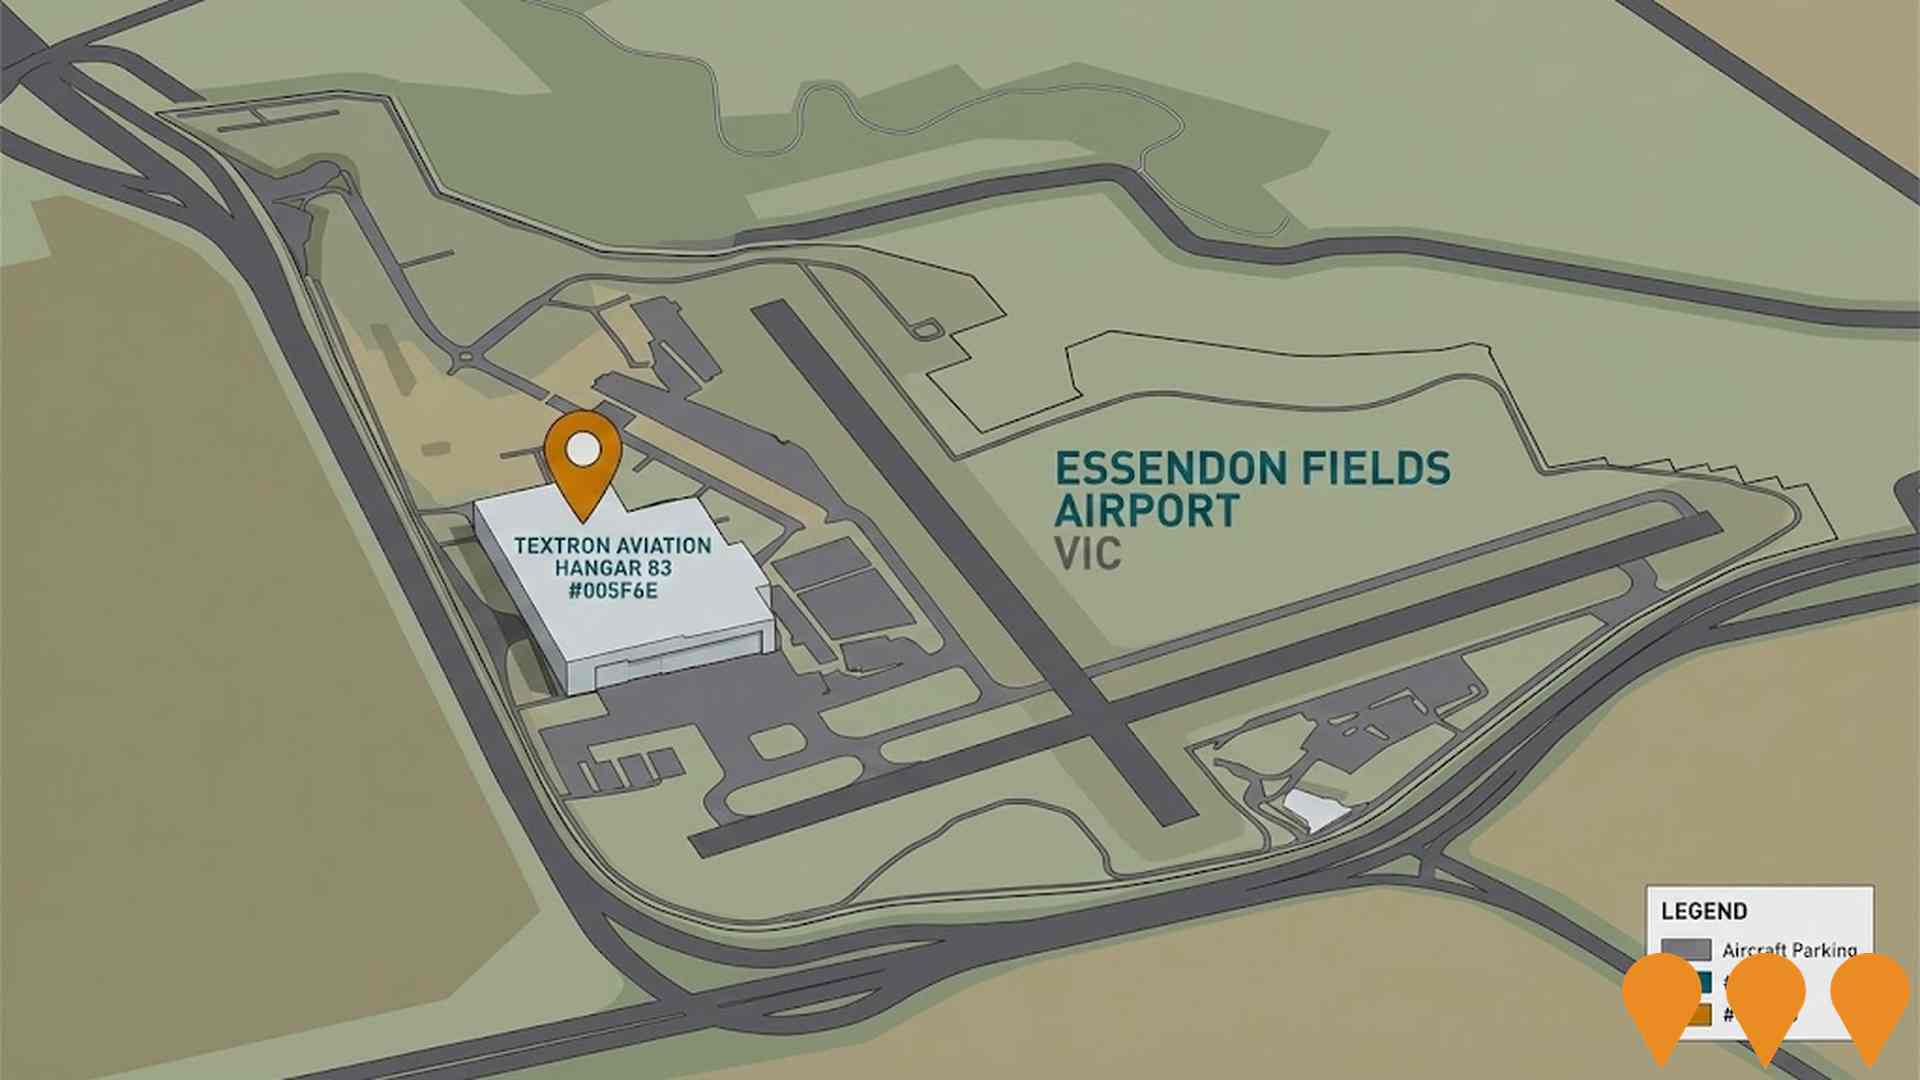
Textron Aviation Hangar 83
A purpose-built 3,343 square meter hangar facility for Textron Aviation's business jet maintenance, repair, and overhaul operations at Essendon Fields Airport. The new facility is twice the size of the existing one and will support increased capacity for servicing Beechcraft, Cessna, and Hawker aircraft, employing approximately 23 staff including engineers and apprentices.
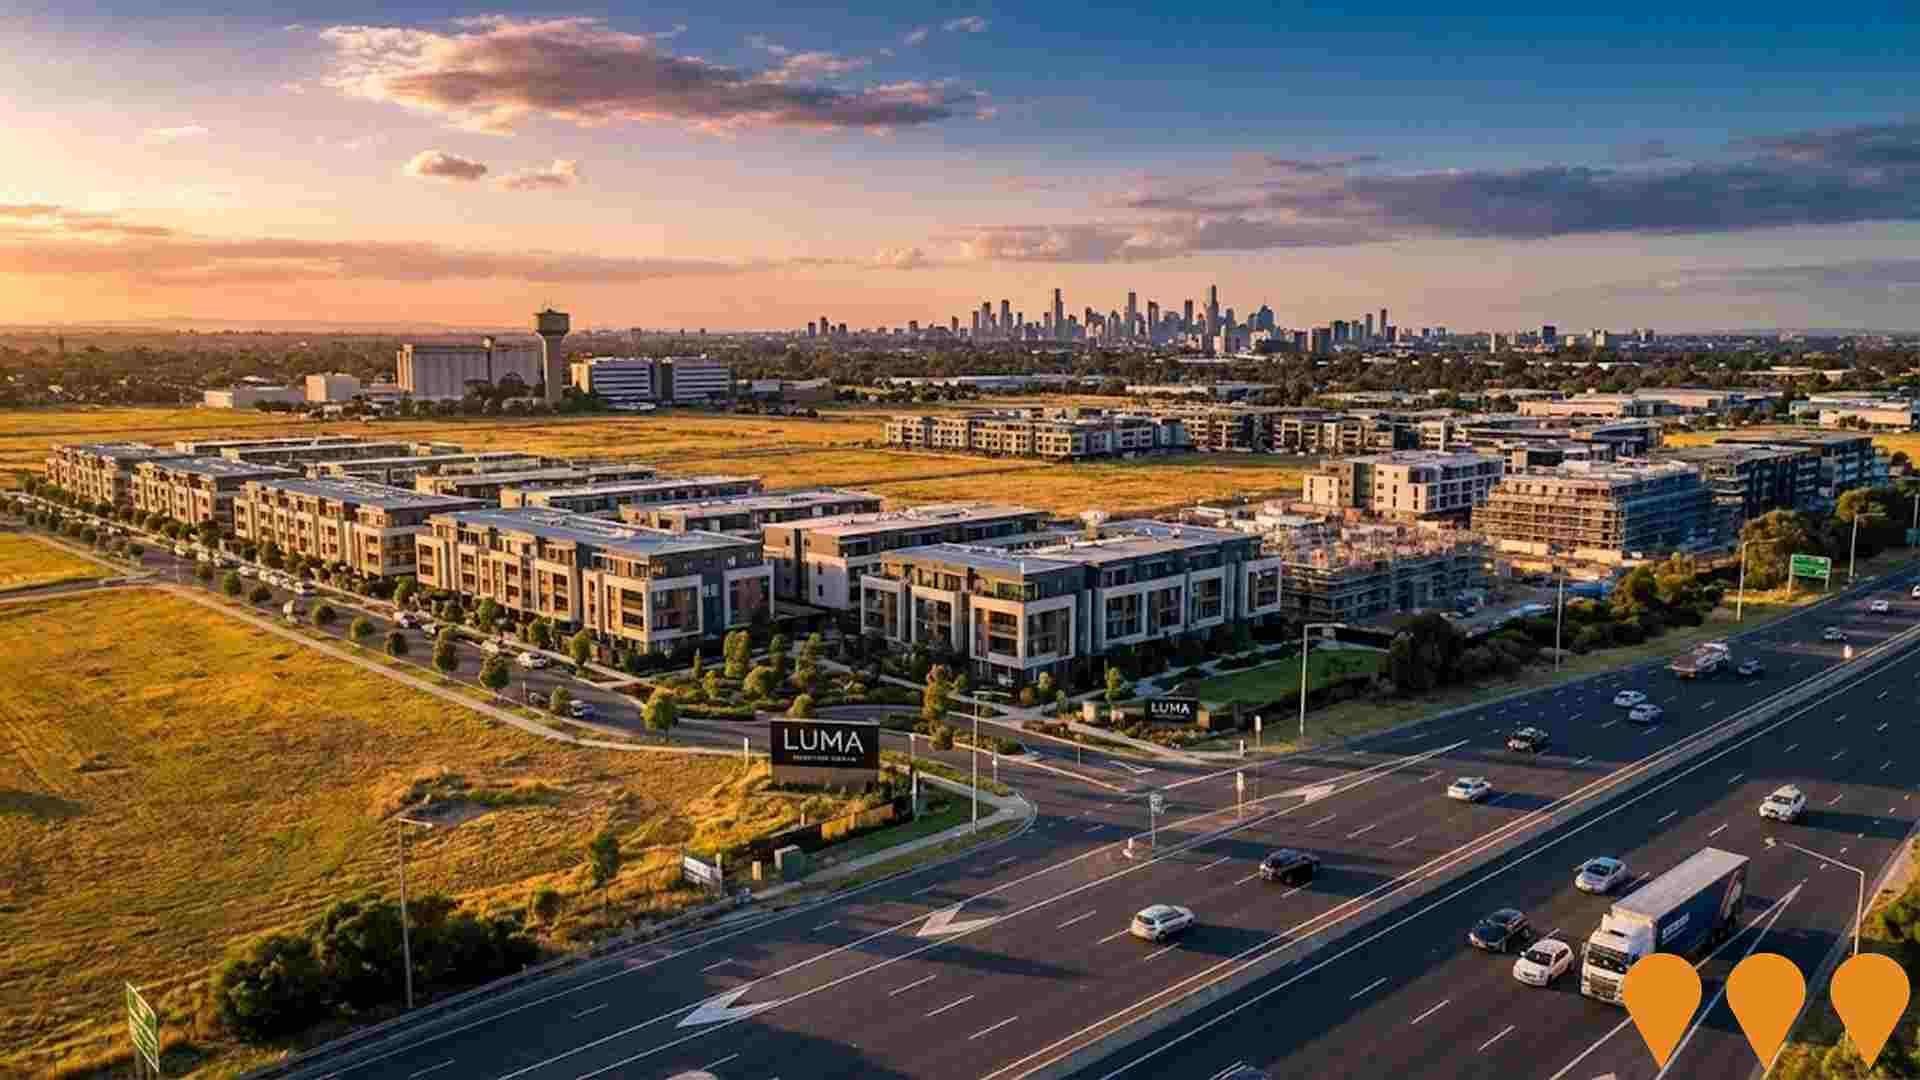
LUMA Sunshine North
Mixed-use development including residential, commercial, and community spaces in Sunshine North. Part of urban renewal initiative for western Melbourne.
Employment
The exceptional employment performance in Strathmore places it among Australia's strongest labour markets
Strathmore has an educated workforce with professional services well-represented. The unemployment rate was 1.7% in September 2025, with an estimated employment growth of 1.3% over the previous year.
As of that date, 6,272 residents were employed while the unemployment rate was 3.0% lower than Greater Melbourne's rate of 4.7%. Workforce participation stood at 67.7%, slightly higher than Greater Melbourne's 64.1%. Key industries for employment among residents included health care & social assistance, education & training, and professional & technical services. The area had a notable concentration in public administration & safety, with employment levels at 1.4 times the regional average.
Conversely, health care & social assistance showed lower representation at 12.1% compared to the regional average of 14.2%. Employment opportunities locally appeared limited, as indicated by the difference between Census working population and resident population. Between September 2024 and September 2025, employment levels increased by 1.3%, labour force grew by 1.5%, resulting in a slight rise in unemployment of 0.2 percentage points. In comparison, Greater Melbourne recorded employment growth of 3.0% over the same period. State-level data from 25-Nov-25 showed Victorian employment had grown by 1.13% year-on-year, with the state unemployment rate at 4.7%, slightly higher than the national rate of 4.3%. Jobs and Skills Australia's national employment forecasts from May-25 projected overall employment growth of 6.6% over five years and 13.7% over ten years. Applying these projections to Strathmore's employment mix suggested local employment should increase by approximately 6.7% over five years and 13.6% over ten years, assuming constant population projections for illustrative purposes.
Frequently Asked Questions - Employment
Income
The economic profile demonstrates exceptional strength, placing the area among the top 10% nationally based on comprehensive AreaSearch income analysis
The Strathmore SA2 had a median income among taxpayers of $63,712 and an average income of $86,592 in the financial year 2022, according to ATO data aggregated by AreaSearch. These figures compare to Greater Melbourne's median income of $54,892 and average income of $73,761 for the same period. By September 2025, estimates based on a 12.16% Wage Price Index growth suggest the median income will be approximately $71,459 and the average income will be around $97,122. The 2021 Census figures indicate that household, family, and personal incomes in Strathmore rank between the 78th and 89th percentiles nationally. Income distribution shows that 27.5% of residents (2,885 people) fall into the $1,500 - $2,999 bracket, similar to the regional level where 32.8% occupy this bracket. Strathmore's affluence is evident with 41.2% earning over $3,000 per week, supporting premium retail and service offerings. After housing costs, residents retain 87.4% of their income, reflecting strong purchasing power. The area's SEIFA income ranking places it in the 9th decile.
Frequently Asked Questions - Income
Housing
Strathmore is characterized by a predominantly suburban housing profile, with ownership patterns similar to the broader region
The dwelling structure in Strathmore, as per the latest Census, consisted of 77.4% houses and 22.5% other dwellings (semi-detached, apartments, 'other' dwellings). This compares to Melbourne metro's 75.8% houses and 24.2% other dwellings. Home ownership in Strathmore was at 43.0%, matching Melbourne metro's figure. Mortgaged dwellings were 39.9%, while rented ones were 17.1%. The median monthly mortgage repayment in the area was $2,500, higher than Melbourne metro's average of $2,167. The median weekly rent figure was recorded at $450, compared to Melbourne metro's $410. Nationally, Strathmore's mortgage repayments were significantly higher than the Australian average of $1,863, and rents were substantially above the national figure of $375.
Frequently Asked Questions - Housing
Household Composition
Strathmore features high concentrations of family households, with a higher-than-average median household size
Family households account for 79.0% of all households, including 45.2% couples with children, 23.7% couples without children, and 9.4% single parent families. Non-family households make up the remaining 21.0%, consisting of 19.1% lone person households and 1.8% group households. The median household size is 2.8 people, larger than the Greater Melbourne average of 2.6.
Frequently Asked Questions - Households
Local Schools & Education
Strathmore shows strong educational performance, ranking in the upper quartile nationally when assessed across multiple qualification and achievement indicators
The area's university qualification rate of 37.5% exceeds the SA4 region average of 27.7% and Australia's national average of 30.4%. Bachelor degrees are most common at 25.4%, followed by postgraduate qualifications at 8.0% and graduate diplomas at 4.1%. Vocational credentials are held by 27.1% of residents aged 15+, including advanced diplomas (11.6%) and certificates (15.5%).
Educational participation is high, with 31.8% of residents currently enrolled in formal education. This includes 10.5% in primary education, 10.1% in secondary education, and 6.3% pursuing tertiary education.
Frequently Asked Questions - Education
Schools Detail
Nearby Services & Amenities
Transport
Transport servicing is moderate compared to other areas nationally based on assessment of service frequency, route connectivity and accessibility
Strathmore's public transport system operates 52 active stops, all serving buses. These are covered by five routes that together facilitate 1,870 weekly passenger trips. Residents enjoy excellent transport accessibility, with an average distance of 177 meters to the nearest stop.
Daily service frequency averages 267 trips across all routes, translating to about 35 weekly trips per individual stop.
Frequently Asked Questions - Transport
Transport Stops Detail
Health
Strathmore's residents are extremely healthy with both young and old age cohorts seeing low prevalence of common health conditions
Analysis of health metrics shows strong performance throughout Strathmore. Both young and old age cohorts experienced low prevalence of common health conditions. The rate of private health cover was exceptionally high at approximately 63% of the total population (6,642 people), compared to 58.6% across Greater Melbourne.
Nationally, the average is 55.3%. The most common medical conditions in the area were asthma and arthritis, impacting 7.1 and 7.0% of residents respectively. A total of 73.1% of residents declared themselves completely clear of medical ailments, compared to 70.1% across Greater Melbourne. Strathmore has 18.3% of residents aged 65 and over (1,920 people), which is lower than the 21.9% in Greater Melbourne. Health outcomes among seniors are particularly strong, broadly aligning with the general population's health profile.
Frequently Asked Questions - Health
Cultural Diversity
The level of cultural diversity witnessed in Strathmore was found to be slightly above average when compared nationally for a number of language and cultural background related metrics
Strathmore's cultural diversity was found to be above average, with 19.8% of its population born overseas and 21.8% speaking a language other than English at home. Christianity is the predominant religion in Strathmore, making up 59.0% of people, compared to 66.4% across Greater Melbourne. The top three ancestry groups are Australian (20.4%), English (19.4%), and Italian (12.6%).
Notably, Maltese representation is higher than average at 2.0%, while Polish remains similar at 1.1%. Greek representation is lower than the regional average at 3.9% versus 5.0%.
Frequently Asked Questions - Diversity
Age
Strathmore's population is slightly older than the national pattern
Strathmore's median age is 41 years, which is significantly higher than Greater Melbourne's average of 37 and slightly older than Australia's median of 38. Comparing Strathmore to Greater Melbourne, the 45-54 cohort is notably over-represented at 16.1%, while the 25-34 age group is under-represented at 8.1%. Post the 2021 Census, the 15-24 age group grew from 14.0% to 15.8%, and the 75-84 cohort increased from 4.6% to 6.0%. Conversely, the 35-44 cohort declined from 12.9% to 11.7%, and the 25-34 group dropped from 9.1% to 8.1%. By 2041, demographic modeling indicates Strathmore's age profile will significantly change. The 55-64 cohort is projected to grow by 31%, adding 416 residents to reach 1,758. Meanwhile, both the 0-4 and 35-44 age groups are expected to decrease in numbers.
