Chart Color Schemes
est. as @ -- *
ABS ERP | -- people | --
2021 Census | -- people
Sales Activity
Curious about local property values? Filter the chart to assess the volume and appreciation (including resales) trends and regional comparisons, or scroll to the map below view this information at an individual property level.
Find a Recent Sale
Sales Detail
Population
Population growth drivers in South Arm are strong compared to national averages based on AreaSearch's ranking of recent, and medium to long-term trends
South Arm's population was approximately 4,684 as of November 2025. Between the 2021 Census and this date, there was an increase of 68 people, representing a 1.5% growth in population from the previously recorded figure of 4,616. This change is inferred from ABS estimates; South Arm's population reached 4,658 by June 2024, with an additional 40 validated new addresses since the Census date. The population density was calculated at 63 persons per square kilometer during this period. Comparing South Arm's growth rate of 1.5% to the SA4 region's 4.3% demonstrates competitive growth fundamentals. Overseas migration contributed approximately 61.4% of overall population gains in recent periods.
AreaSearch uses ABS/Geoscience Australia projections for each SA2 area, released in 2024 with a base year of 2022. For areas not covered by this data and to estimate growth by age group post-2032, Tasmania State Government's Regional/LGA projections are adopted, released in 2022 with a base year of 2021, using a method of weighted aggregation from LGA to SA2 levels. Based on the latest population numbers and projected demographic shifts, South Arm is expected to grow by approximately 363 persons to reach 2041, representing an increase of around 7.2% over these 17 years.
Frequently Asked Questions - Population
Development
Residential development activity is lower than average in South Arm according to AreaSearch's national comparison of local real estate markets
South Arm has averaged approximately 20 new dwelling approvals annually over the past five financial years, totalling 103 homes. As of FY-26, six approvals have been recorded. Between FY-21 and FY-25, an average of 0.9 people moved to the area per year for each dwelling built. This suggests that new supply is keeping pace with or exceeding demand, offering ample buyer choice and creating capacity for population growth beyond current forecasts.
The average construction cost value of new properties is $389,000, indicating a focus on the premium market with high-end developments. In FY-26, commercial approvals totalling $672,000 have been registered, suggesting minimal commercial development activity. Compared to Greater Hobart, South Arm shows approximately 75% of the construction activity per person and ranks among the 61st percentile of areas assessed nationally in terms of building activity.
Recent building activity consists entirely of detached houses, preserving the area's low density nature and attracting space-seeking buyers. With around 246 people per dwelling approval, South Arm exhibits characteristics of a low-density area. Population forecasts indicate that South Arm will gain approximately 336 residents by 2041. At current development rates, new housing supply should comfortably meet demand, providing good conditions for buyers and potentially supporting growth beyond current population projections.
Frequently Asked Questions - Development
Infrastructure
South Arm has limited levels of nearby infrastructure activity, ranking in the 16thth percentile nationally
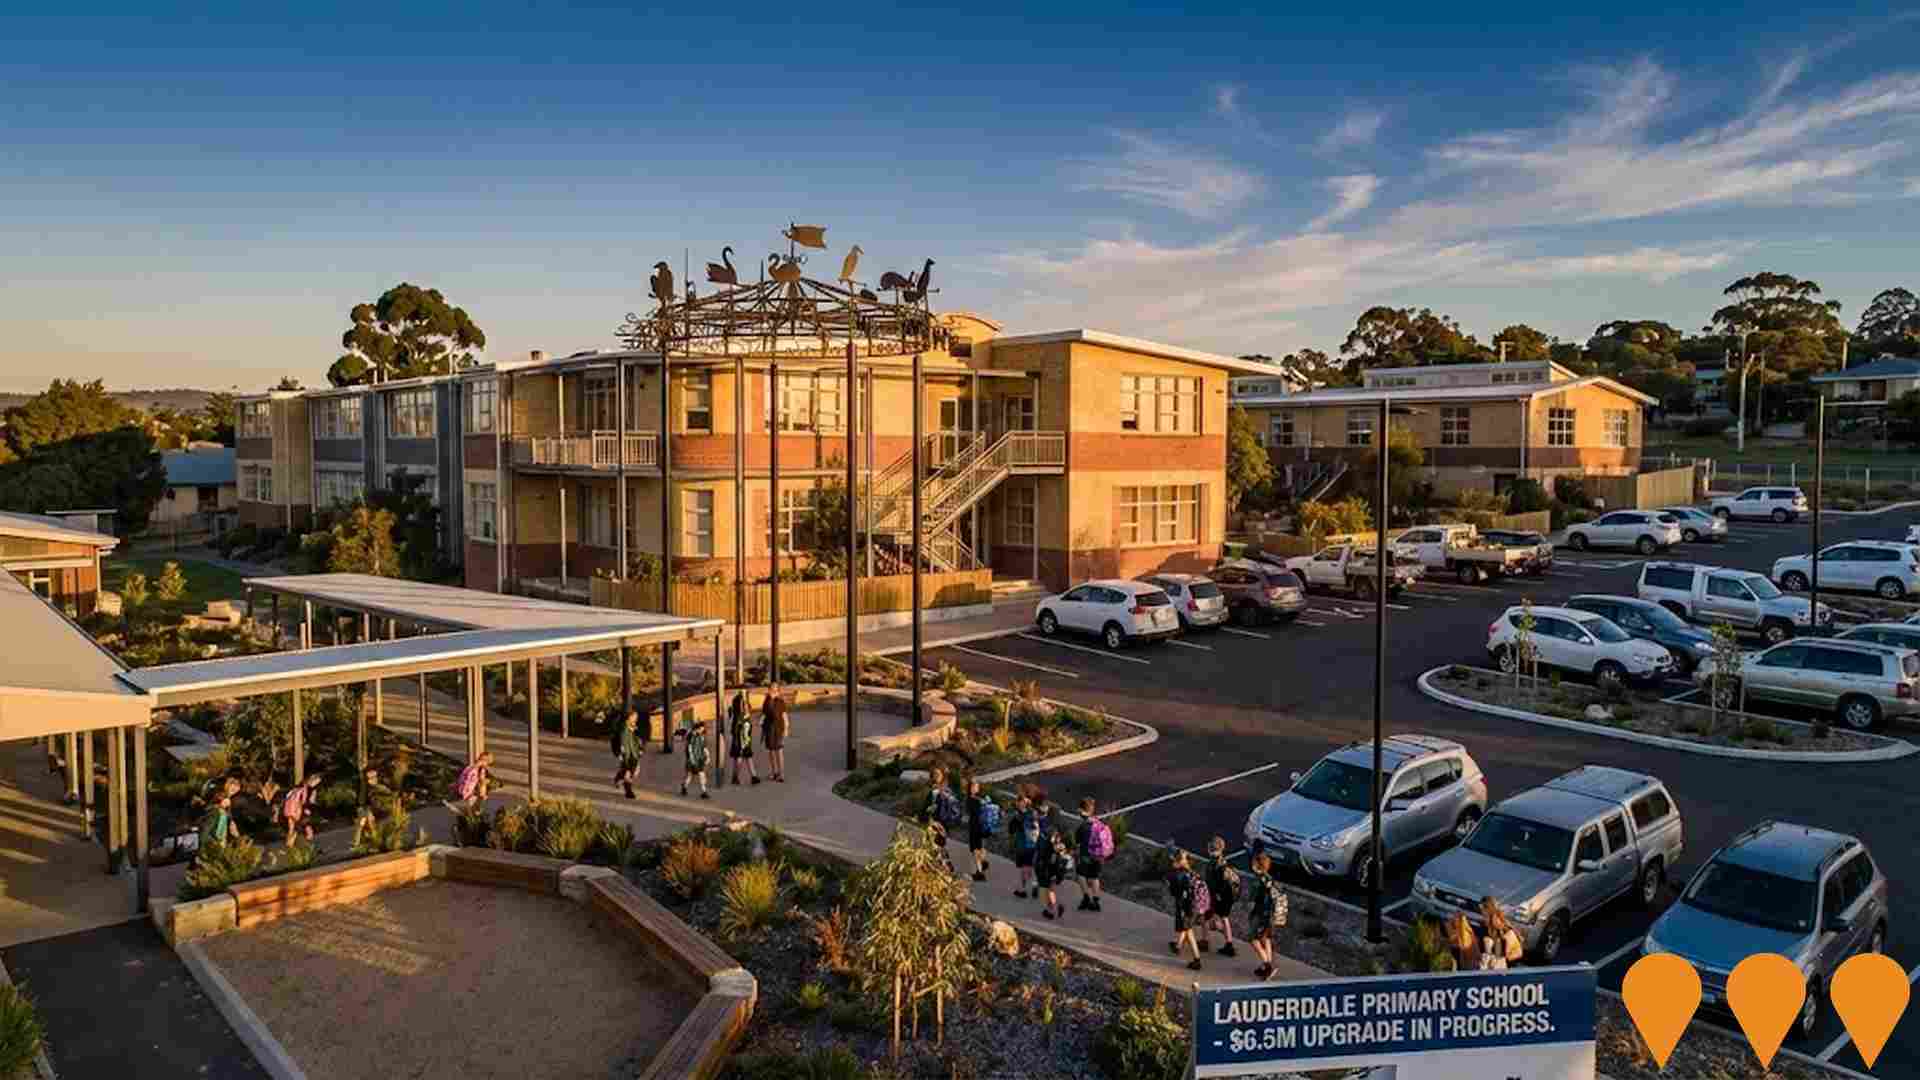
Changes to local infrastructure significantly influence an area's performance. AreaSearch has identified two projects likely to impact this region. Key projects include the Droughty Peninsula Structure Plan, Lauderdale Primary School, Hobart City Deal, and Greater Hobart Urban Growth Boundary Extension. The following details those most relevant:.
Professional plan users can use the search below to filter and access additional projects.
INFRASTRUCTURE SEARCH
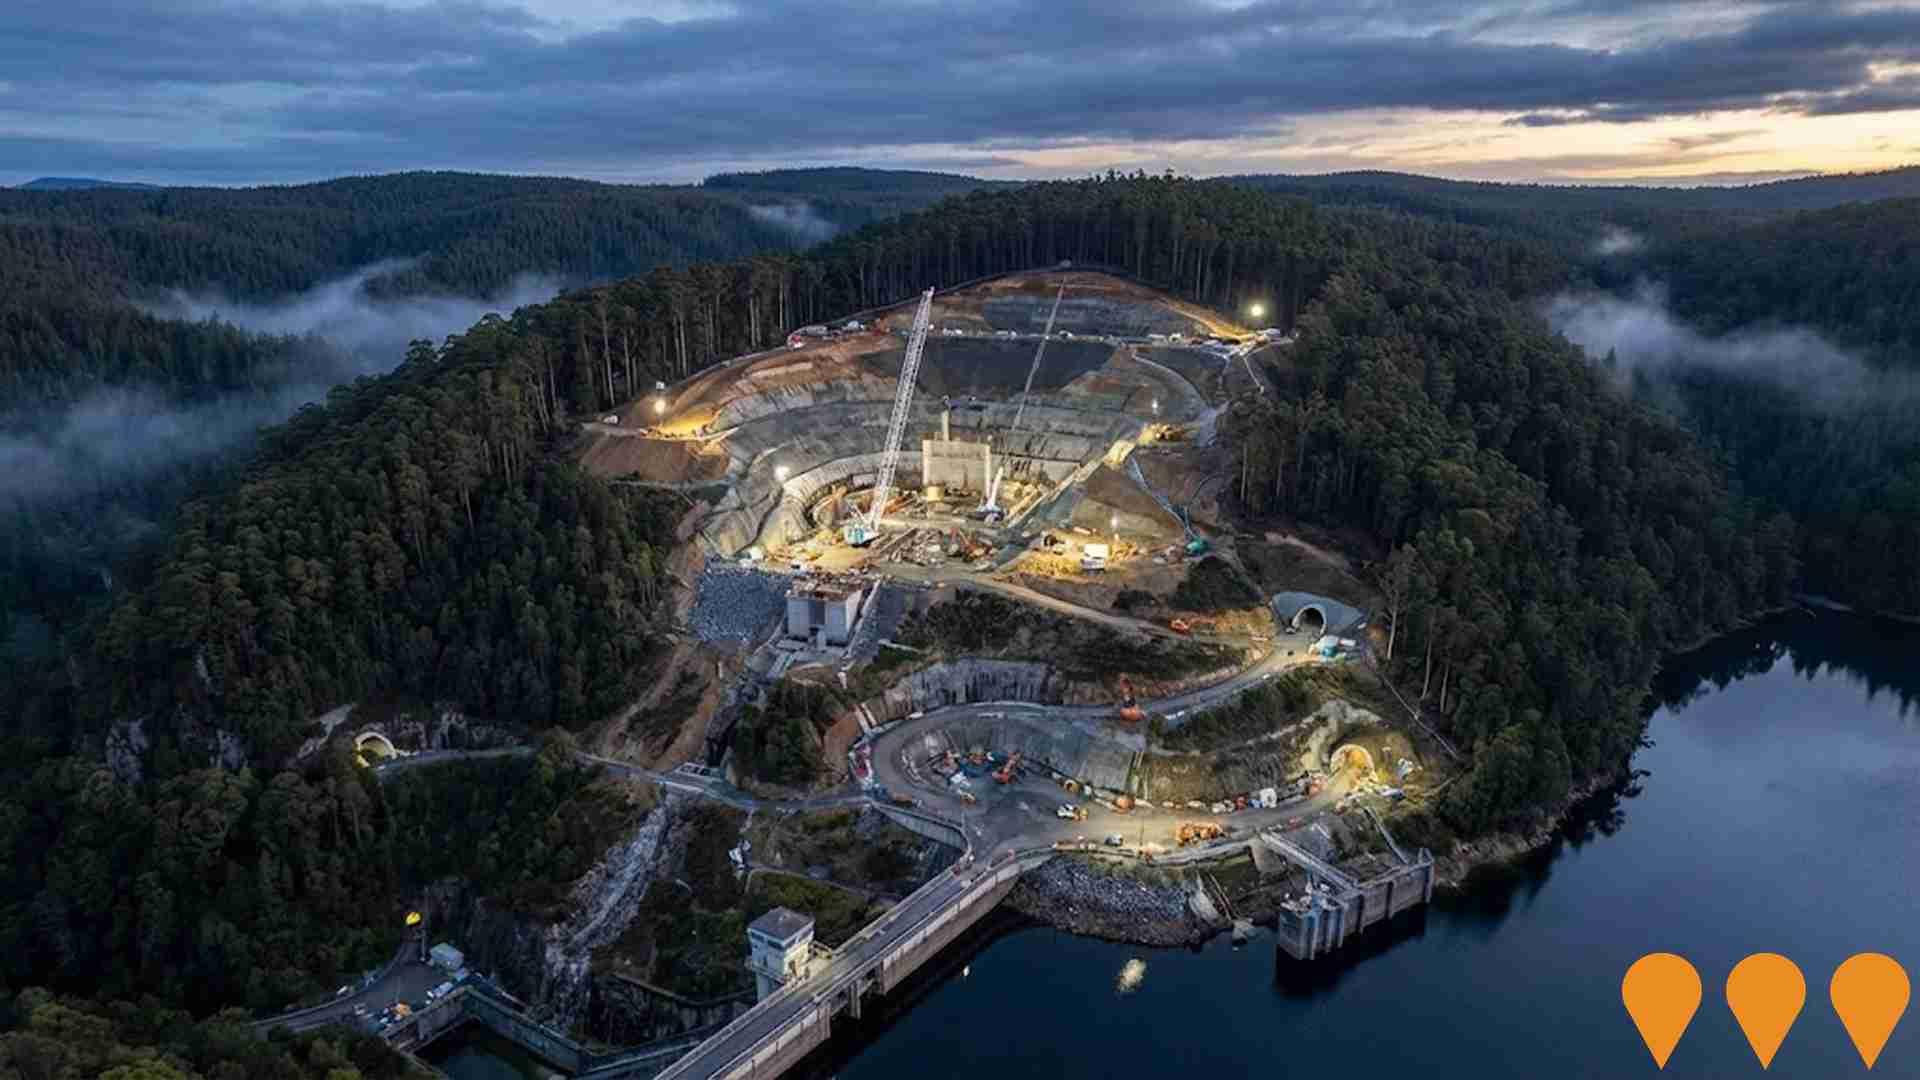
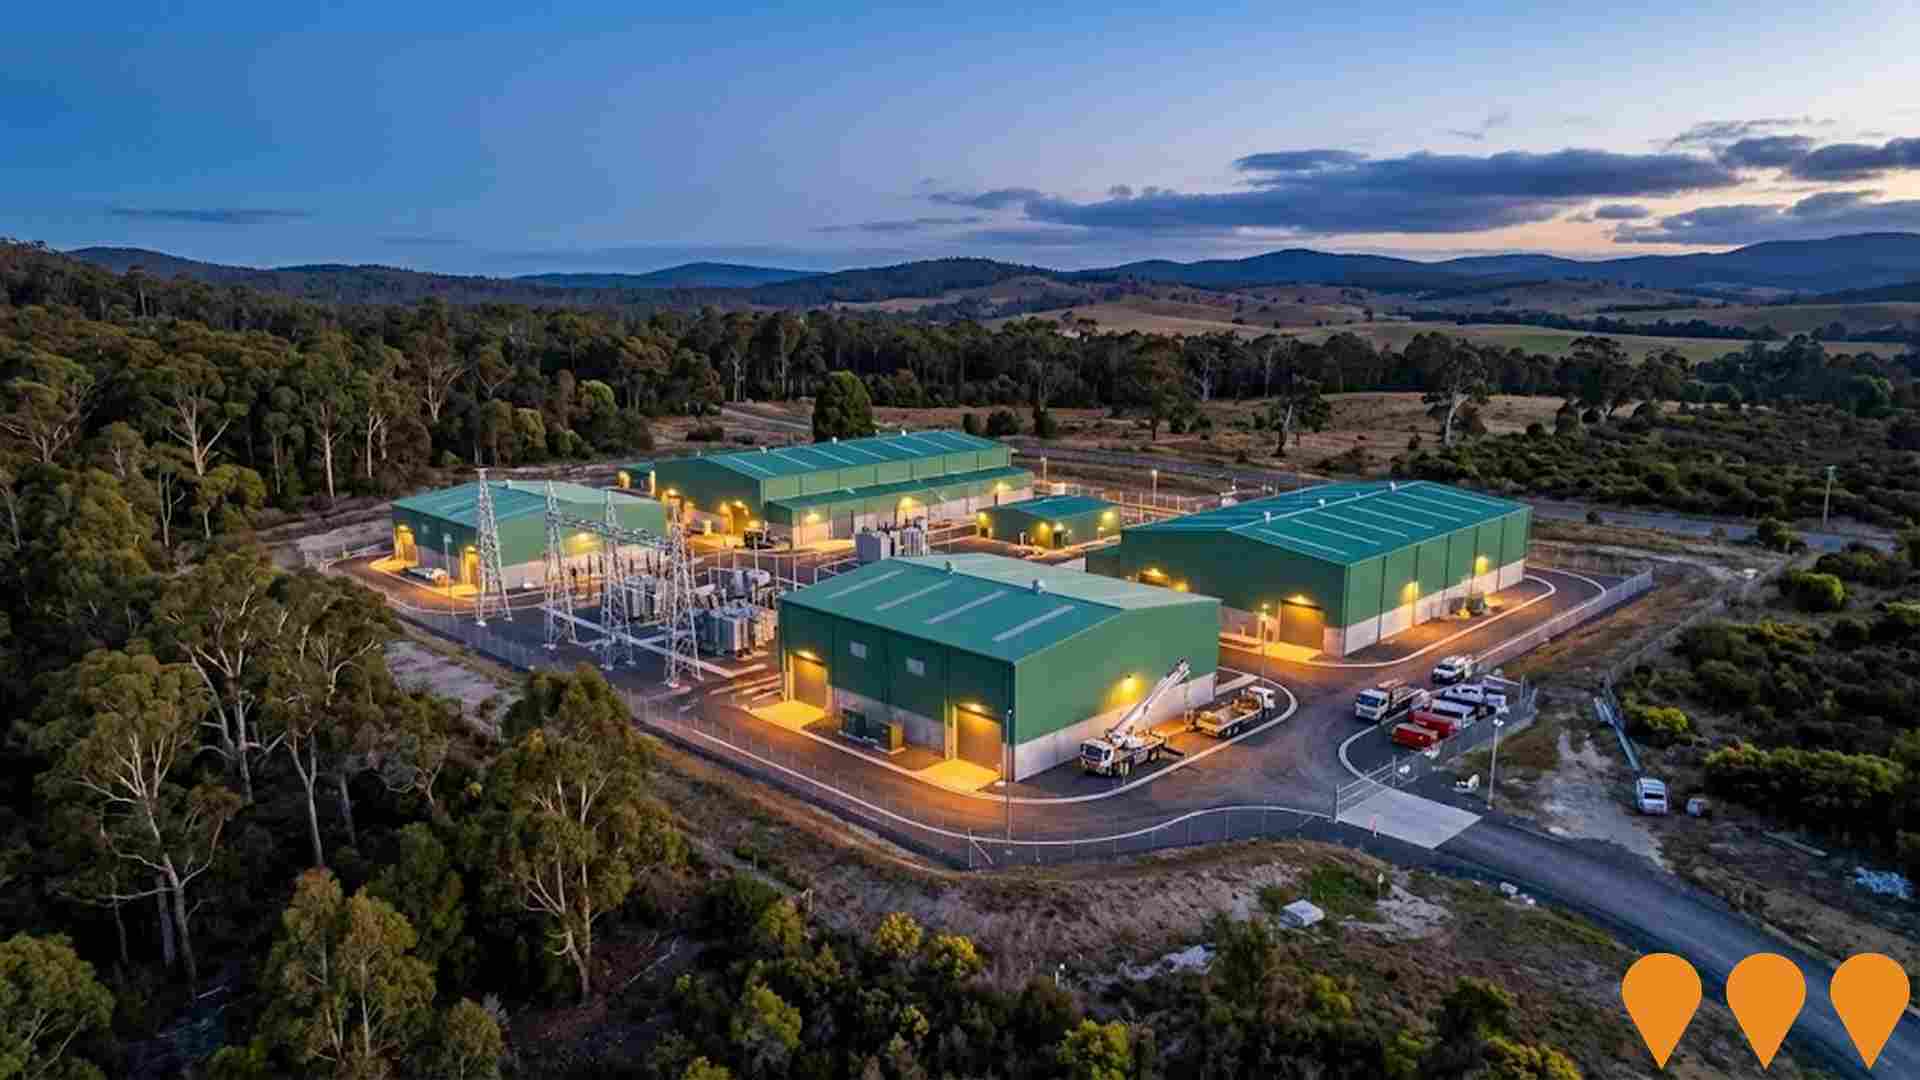
 Denotes AI-based impression for illustrative purposes only, not to be taken as definitive under any circumstances. Please follow links and conduct other investigations from the project's source for actual imagery. Developers and project owners wishing us to use original imagery please Contact Us and we will do so.
Frequently Asked Questions - Infrastructure
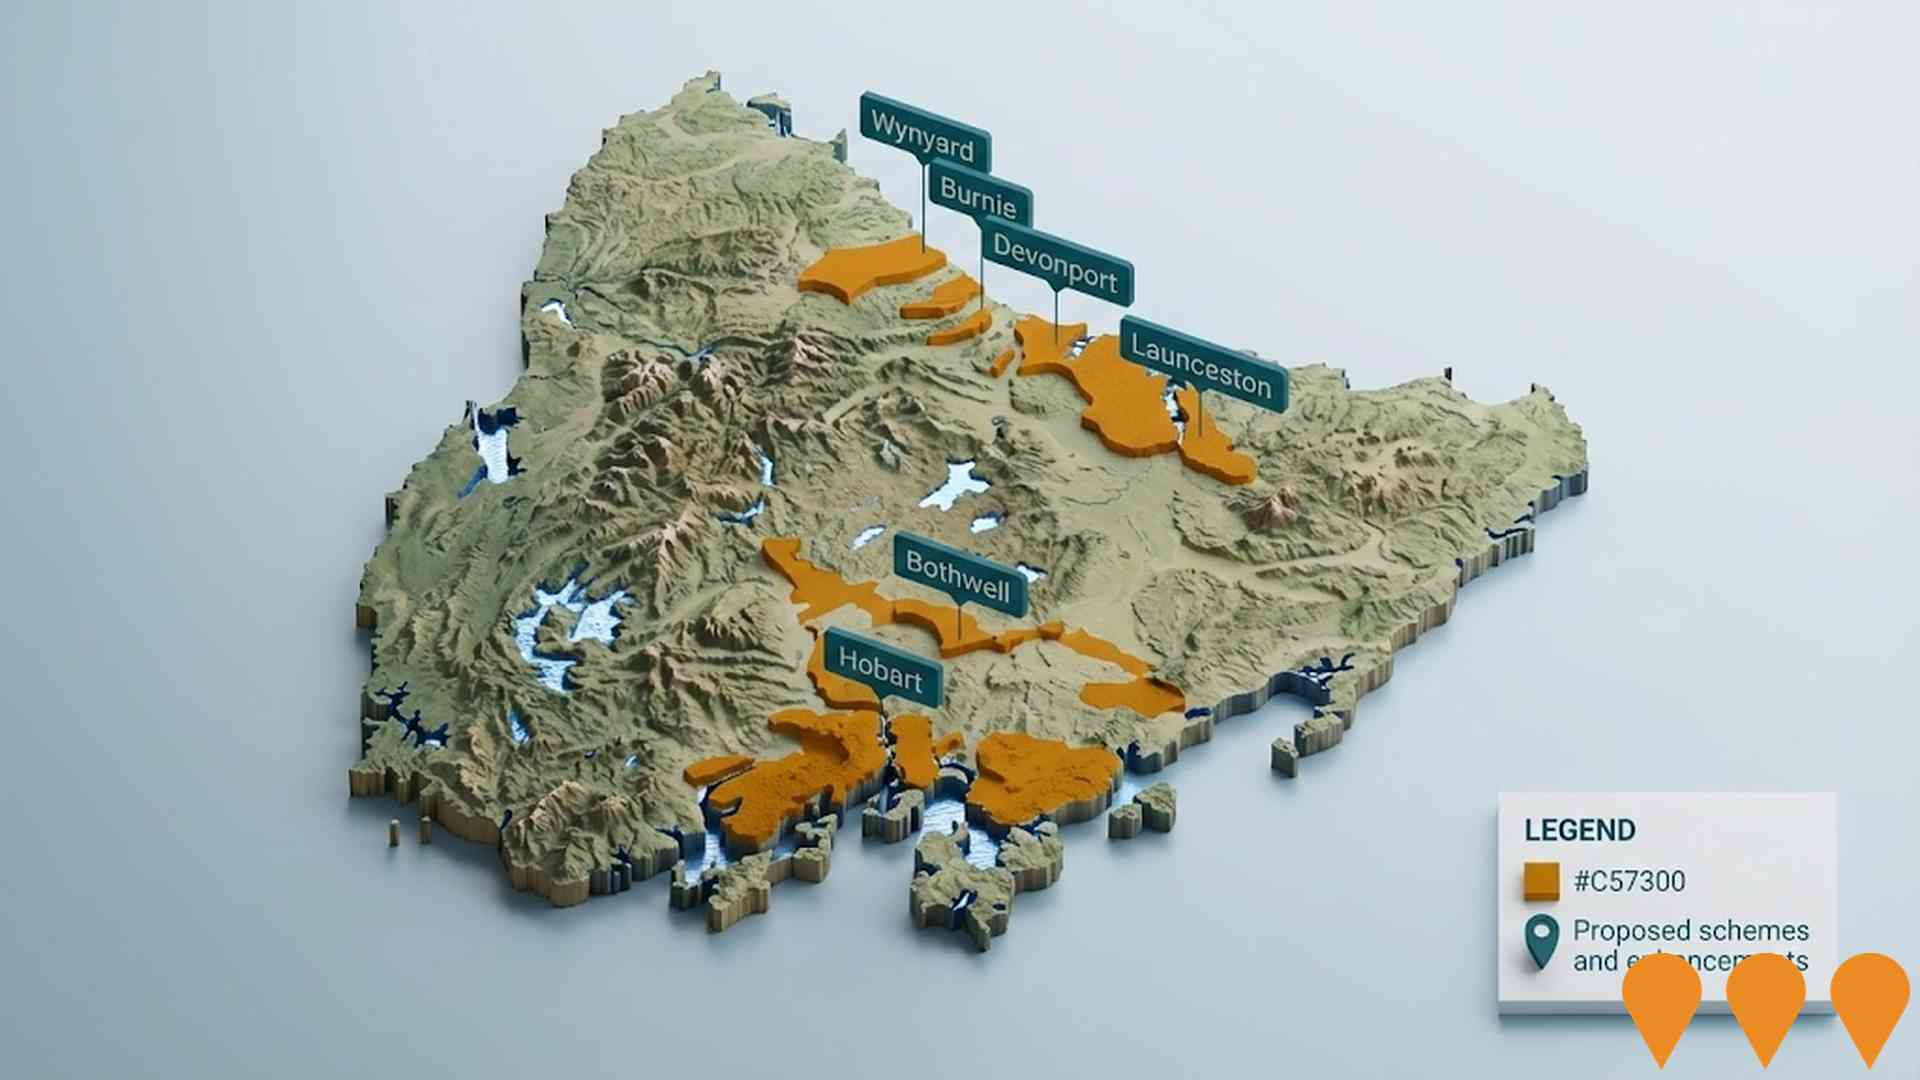
Greater Hobart Urban Growth Boundary Extension
Tasmanian Government initiative to extend the Greater Hobart urban growth boundary by 615 hectares across Brighton, Clarence, Glenorchy, Hobart, Kingborough and Sorell local government areas. Enables release of land for approximately 10,000 new homes over the next 15-20 years to address acute housing supply shortage. Approved by Parliament in November 2024 via the Land Use Planning and Approvals Amendment (Major Projects) Act 2024.
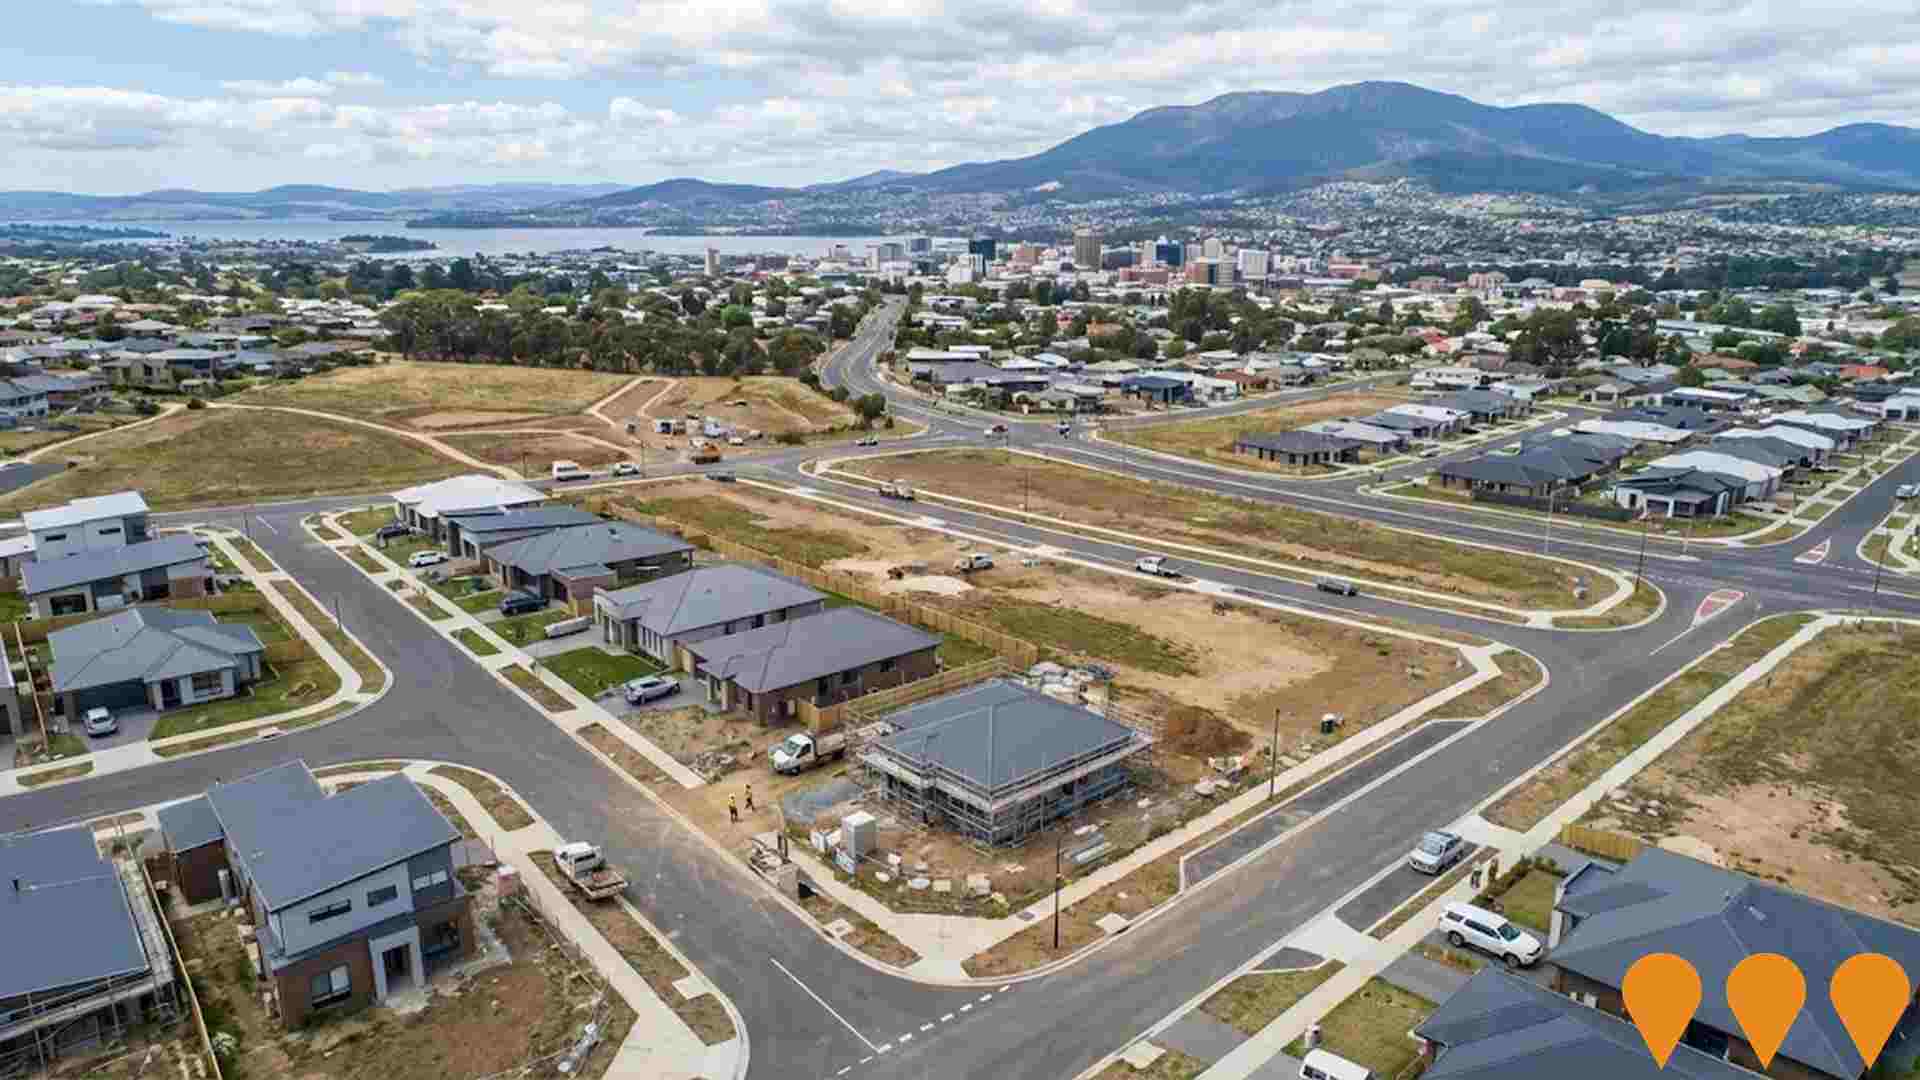
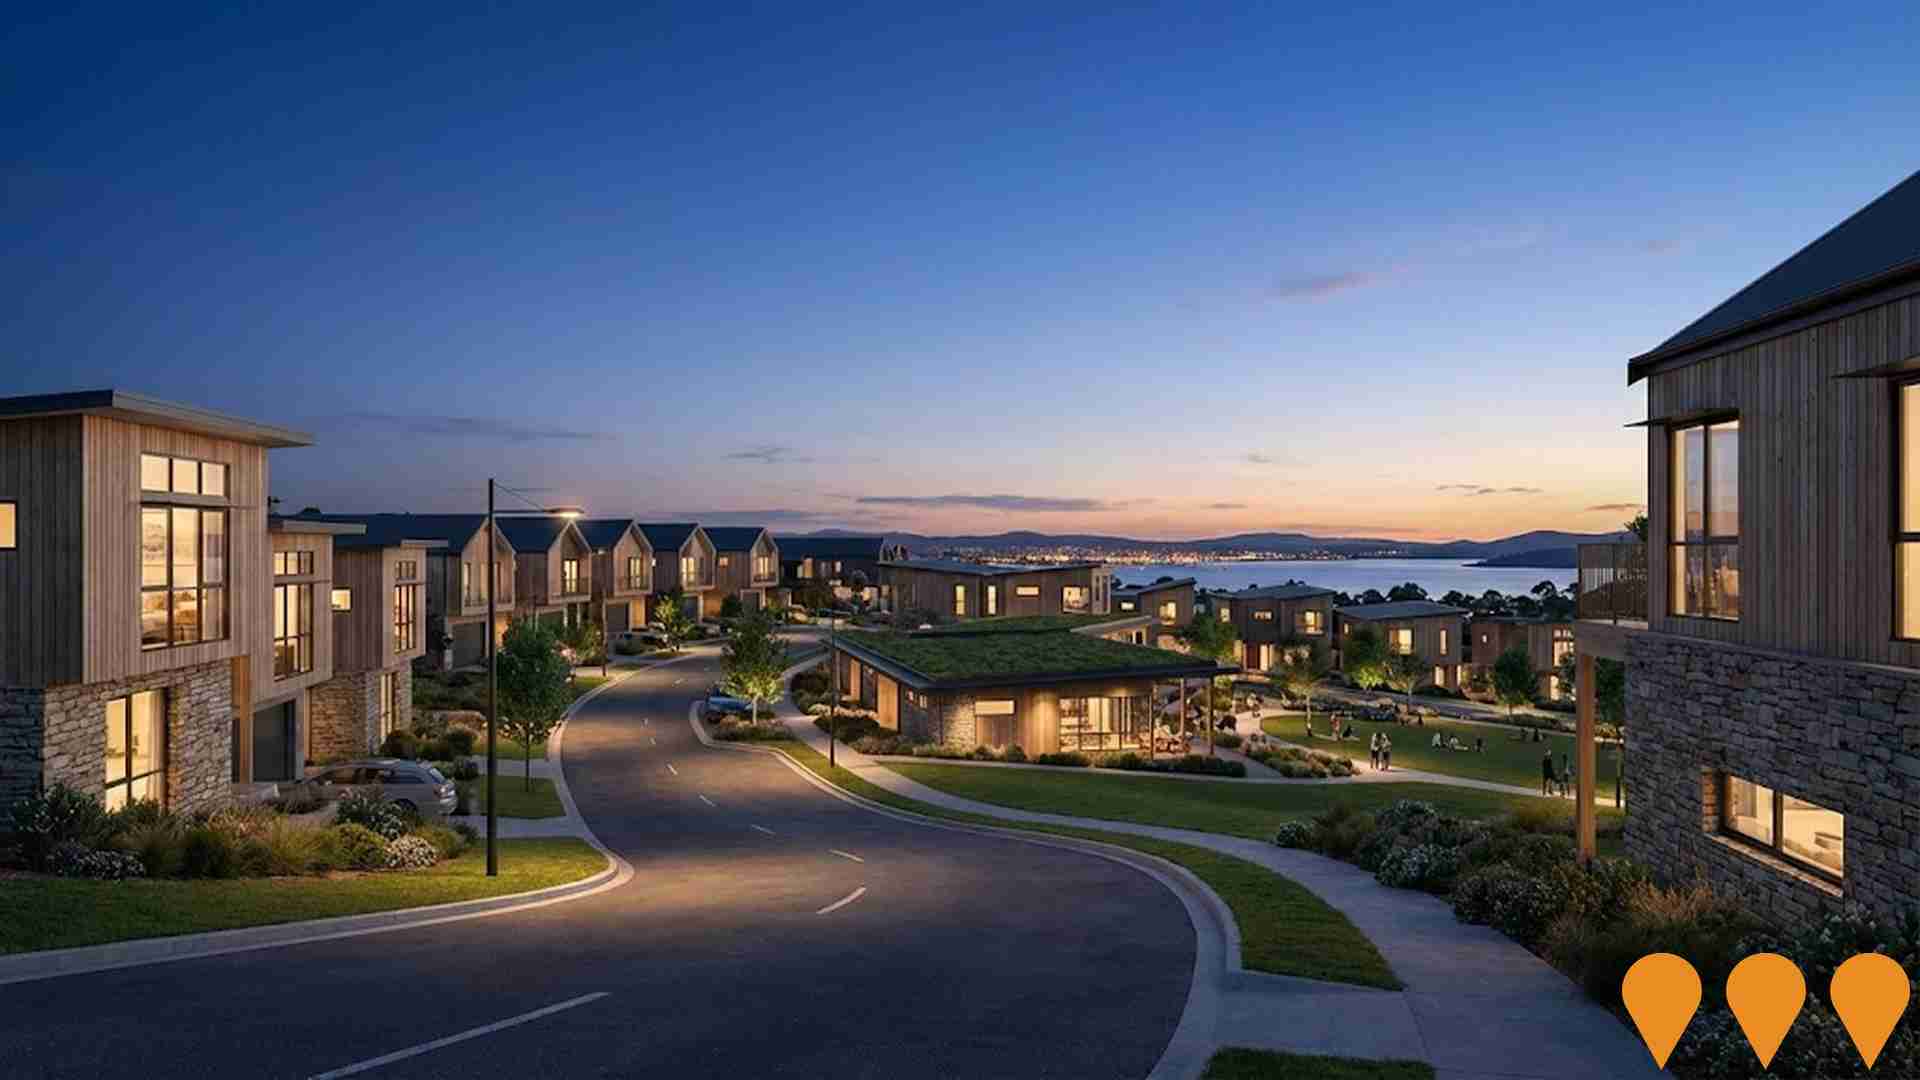
Droughty Peninsula Structure Plan
A long-term planning framework by Clarence City Council for 388 hectares to guide growth and development over 20-25 years on the Droughty Peninsula, based on the approved Skylands Masterplan. It focuses on housing variety, transport, environmental protection, and provision of community services and recreation, and will inform future statutory planning decisions. Phase 2 community engagement on the plan closed in August 2025.
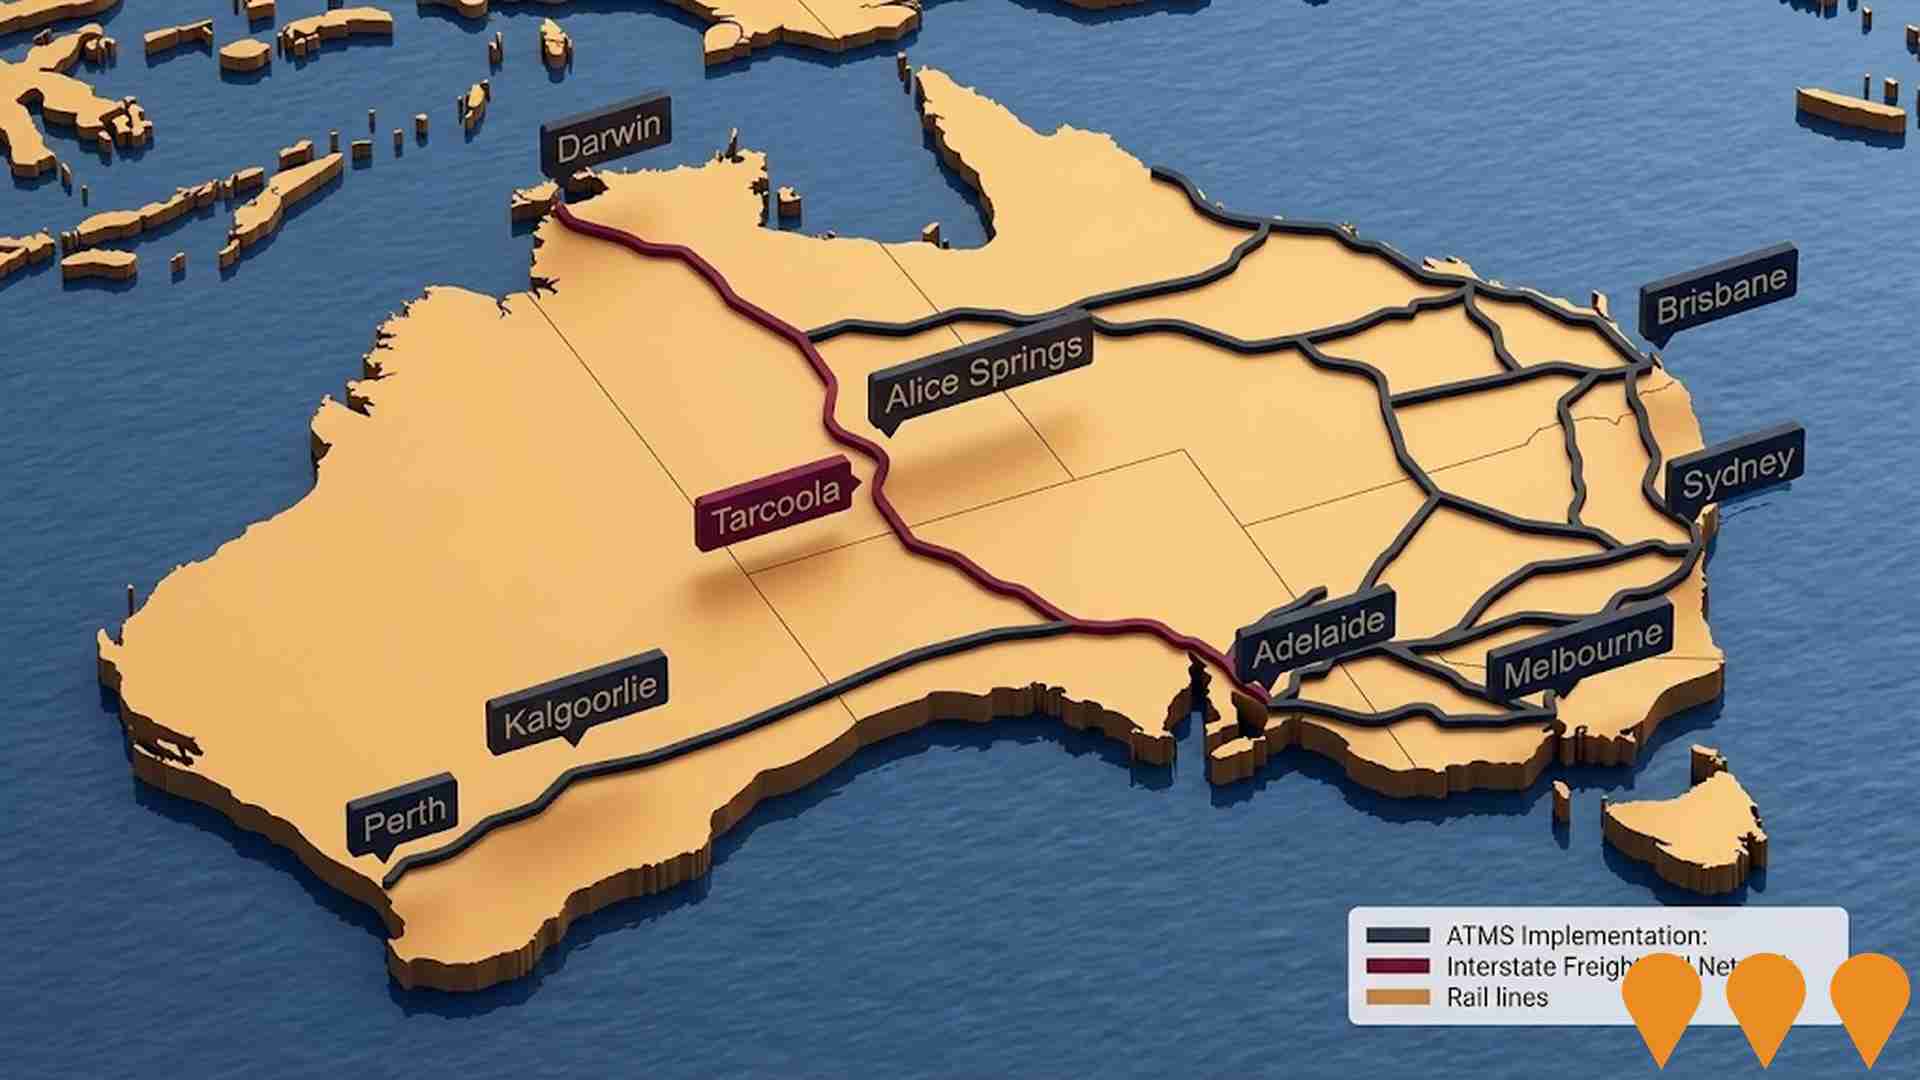
Enabling Infrastructure for Hydrogen Production
Australia has completed the National Hydrogen Infrastructure Assessment (NHIA) to 2050 and refreshed its National Hydrogen Strategy (2024). The programmatic focus has shifted to planning and enabling infrastructure through measures such as ARENA's Hydrogen Headstart and the Hydrogen Production Tax Incentive (from April 2025). Round 2 of Hydrogen Headstart consultation occurred in 2025. Collectively these actions aim to coordinate investment in transport, storage, water and electricity inputs linked to Renewable Energy Zones and priority hubs, supporting large-scale renewable hydrogen production and future export supply chains.
Enabling Digital Health Services for Regional and Remote Australia
National initiative to expand and improve digital health access for people in regional and remote Australia. Focus areas include enabling telehealth and virtual care, upgrading clinical systems and connectivity, supporting secure information exchange, and building workforce capability in digital health, aligned with the Australian Government's Digital Health Blueprint and Action Plan 2023-2033.
Hobart City Deal
A 10-year partnership (2019-2029) between the Australian and Tasmanian Governments and the Clarence, Glenorchy, Hobart and Kingborough councils to deliver coordinated investments across Greater Hobart, including major transport upgrades such as the New Bridgewater Bridge, activation of the Northern Suburbs Transit Corridor, airport border services, Antarctic and science precinct initiatives, housing and urban renewal, and smart city programs.

Homes Tasmania Social Housing Program
Statewide social housing program delivering over 1,000 social housing dwellings under the Community Housing Growth Program. Includes 23 new units approved at Glenorchy site and 15 new units at another Glenorchy location, with modular construction methods to accelerate delivery.
Bulk Water Supply Security
Nationwide program led by the National Water Grid Authority to improve bulk water security and reliability for non-potable and productive uses. Activities include strategic planning, science and business cases, and funding of state and territory projects such as storages, pipelines, dam upgrades, recycled water and efficiency upgrades to build drought resilience and support regional communities, industry and the environment.

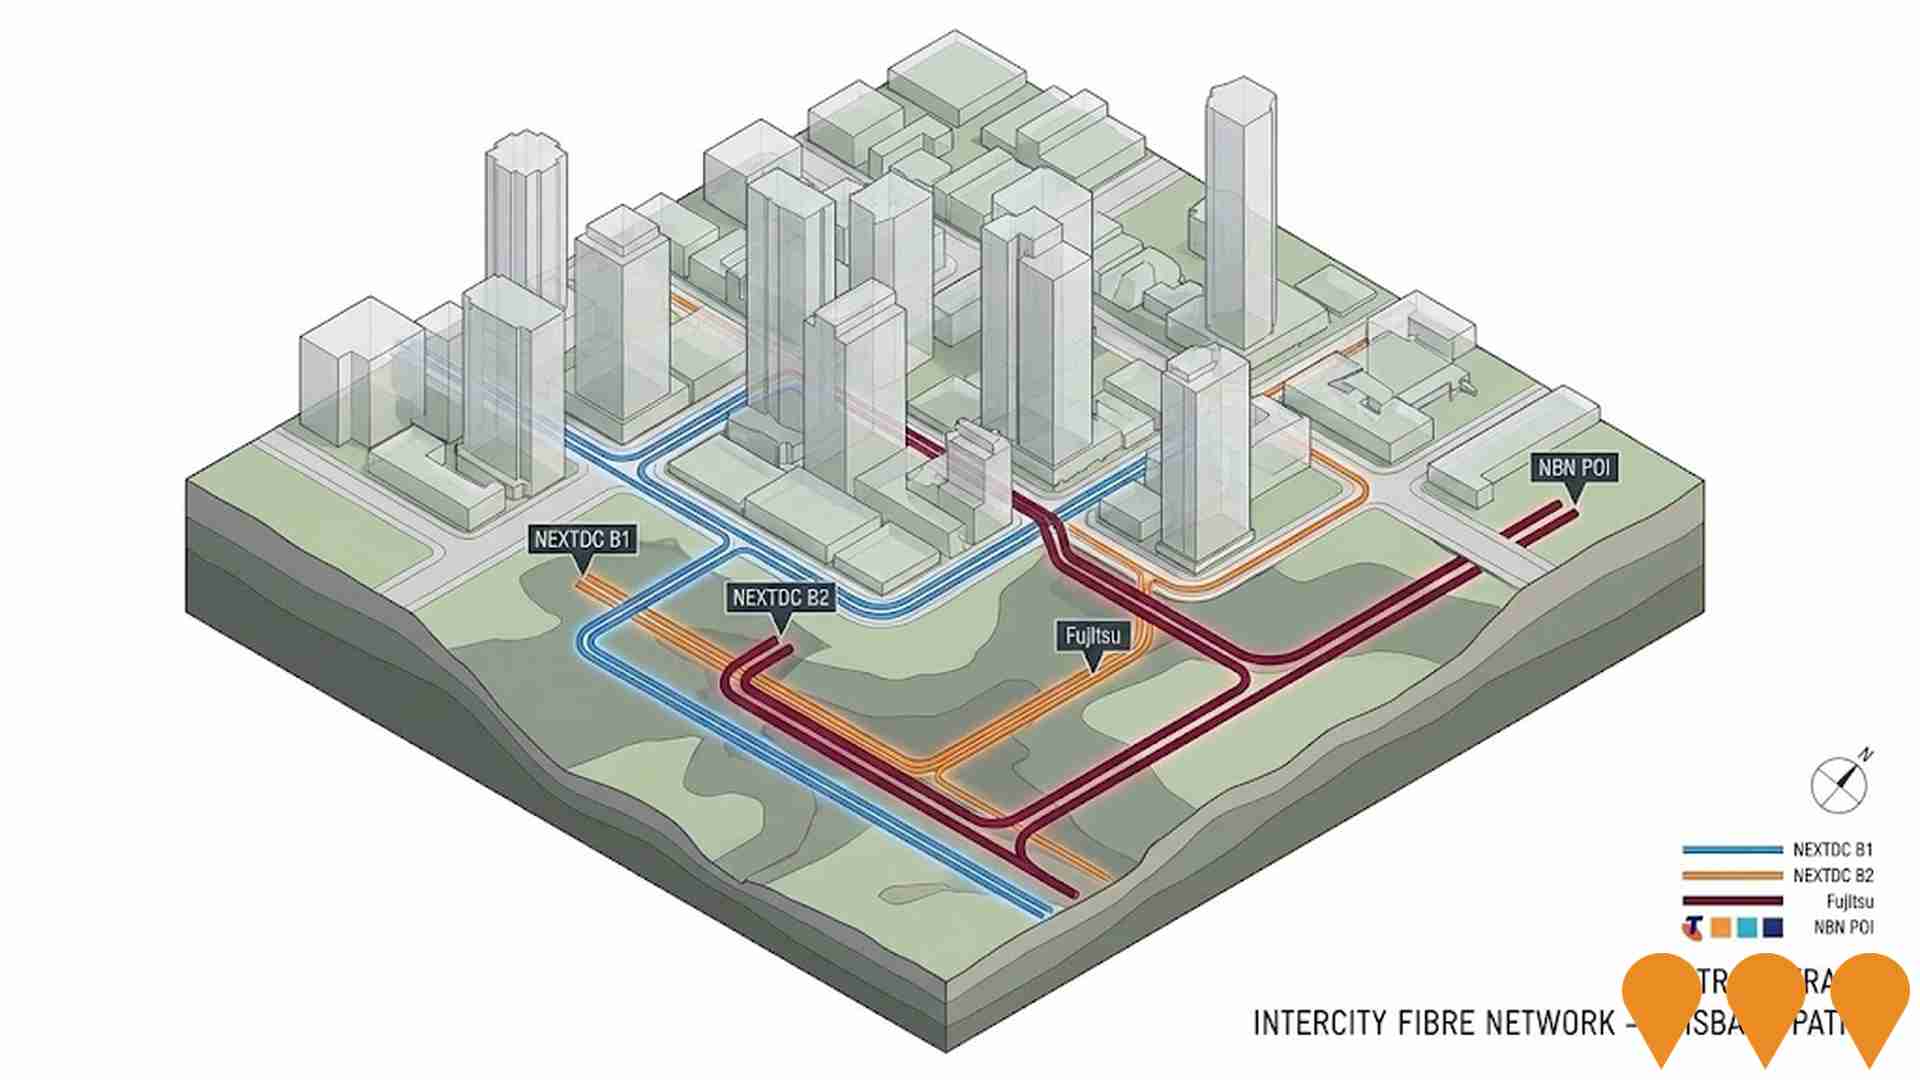
National EV Charging Network (Highway Fast Charging)
Partnership between the Australian Government and NRMA to deliver a backbone EV fast charging network on national highways. Program funds and co-funds 117 DC fast charging sites at roughly 150 km intervals to connect all capital cities and regional routes, reducing range anxiety and supporting EV uptake.

Employment
The labour market in South Arm shows considerable strength compared to most other Australian regions
South Arm has a highly educated workforce with prominent representation in essential services sectors. Its unemployment rate stands at 2.3%.
As of June 2025, 2,537 residents are employed, with an unemployment rate of 1.8% lower than Greater Hobart's rate of 4.1%. Workforce participation is comparable to Greater Hobart's figure at 64.9%. Dominant employment sectors include construction, health care & social assistance, and education & training. Notably, the area has a high concentration in construction, with employment levels at 1.7 times the regional average.
Conversely, accommodation & food services are under-represented, comprising only 4.3% of South Arm's workforce compared to Greater Hobart's 8.0%. The area appears to have limited local employment opportunities, as indicated by the difference between Census working population and resident population figures. Over the 12 months to June 2025, labour force levels decreased by 1.6%, while employment declined by 1.7%, leaving unemployment broadly unchanged. In contrast, Greater Hobart saw an employment decline of 1.5% and a labour force decline of 1.6%, with unemployment falling by 0.2 percentage points. Jobs and Skills Australia's national employment forecasts from May 2025 project overall employment growth of 6.6% over five years and 13.7% over ten years. Applying these projections to South Arm's employment mix suggests local growth of approximately 6.5% over five years and 13.4% over ten years, though this is a simplified extrapolation for illustrative purposes only and does not account for localised population projections.
Frequently Asked Questions - Employment
Income
Income analysis reveals strong economic positioning, with the area outperforming 60% of locations assessed nationally by AreaSearch
South Arm has a median taxpayer income of $55,358 and an average of $65,983 according to postcode level ATO data aggregated by AreaSearch for the financial year 2022. This is slightly above the national average, contrasting with Greater Hobart's median income of $51,272 and average income of $63,777. Based on Wage Price Index growth of 13.83% since the financial year 2022, estimates for September 2025 would be approximately $63,014 (median) and $75,108 (average). According to the 2021 Census figures, incomes in South Arm cluster around the 66th percentile nationally. The income bracket of $1,500 - 2,999 captures 36.0% of the community (1,686 individuals), consistent with regional trends showing 32.2% in the same category. After housing costs, residents retain 89.2% of their income, reflecting strong purchasing power. The area's SEIFA income ranking places it in the 6th decile.
Frequently Asked Questions - Income
Housing
South Arm is characterized by a predominantly suburban housing profile, with above-average rates of outright home ownership
South Arm's dwelling structures, as per the latest Census, consisted of 99.4% houses and 0.6% other dwellings such as semi-detached homes, apartments, and others, compared to Hobart metro's 93.4% houses and 6.6% other dwellings. Home ownership in South Arm stood at 43.7%, with mortgaged dwellings at 47.2% and rented ones at 9.1%. The median monthly mortgage repayment was $1,600, higher than Hobart metro's average of $1,538. Meanwhile, the median weekly rent in South Arm was $370, compared to Hobart metro's $350. Nationally, South Arm's mortgage repayments were lower at $1,600 versus Australia's average of $1,863, and rents were also lower at $370 compared to the national figure of $375.
Frequently Asked Questions - Housing
Household Composition
South Arm features high concentrations of family households, with a higher-than-average median household size
Family households account for 79.4% of all households, consisting of 35.4% couples with children, 34.0% couples without children, and 9.5% single parent families. Non-family households comprise the remaining 20.6%, with lone person households at 18.7% and group households making up 1.7% of the total. The median household size is 2.6 people, which is larger than the Greater Hobart average of 2.4.
Frequently Asked Questions - Households
Local Schools & Education
The educational profile of South Arm exceeds national averages, with above-average qualification levels and academic performance metrics
South Arm has a higher percentage of university-qualified residents aged 15 and above (29.7%) compared to the Tasmania average (25.5%). Bachelor degrees are the most common qualification at 19.0%, followed by postgraduate qualifications (6.8%) and graduate diplomas (3.9%). Vocational credentials are also prevalent, with 39.2% of residents holding such qualifications, including advanced diplomas (11.6%) and certificates (27.6%).
Educational participation is high in South Arm, with 27.0% of residents currently enrolled in formal education. This includes primary education (10.7%), secondary education (7.9%), and tertiary education (3.7%). South Arm Primary School serves the local community, enrolling 67 students as of a certain date. The school's ICSEA score is 1032, indicating typical Australian school conditions with balanced educational opportunities. It caters exclusively to primary education, with secondary options available in nearby areas. However, there are limited local school capacities (1.4 places per 100 residents compared to the regional average of 14.3), leading many families to travel for schooling.
Frequently Asked Questions - Education
Schools Detail
Nearby Services & Amenities
Transport
Transport servicing is high compared to other areas nationally based on assessment of service frequency, route connectivity and accessibility
The analysis of public transport in South Arm indicates that there are 66 active transport stops currently operating within the area. These stops offer a mix of bus services, with a total of 105 individual routes serving them. Collectively, these routes facilitate 14,508 weekly passenger trips.
The accessibility of transport in South Arm is rated as moderate, with residents typically located approximately 574 meters away from the nearest transport stop. On average, service frequency across all routes amounts to 2,072 trips per day, which equates to around 219 weekly trips per individual stop.
Frequently Asked Questions - Transport
Transport Stops Detail
Health
South Arm's residents are relatively healthy in comparison to broader Australia with a fairly standard level of common health conditions seen across both young and old age cohorts
South Arm's health metrics closely align with national benchmarks, exhibiting typical levels of common health conditions across both younger and older age groups.
Approximately 52% (~2,454 people) of residents have private health cover, slightly higher than the average SA2 area. The most prevalent medical conditions are arthritis (10.2%) and mental health issues (8.1%), while 68.2% report no medical ailments, compared to 64.2% in Greater Hobart. Residents aged 65 and over comprise 23.0% (1,079 people) of the population, exceeding Greater Hobart's 21.8%. Notably, health outcomes among seniors in South Arm are particularly strong, outperforming those of the general population in various health metrics.
Frequently Asked Questions - Health
Cultural Diversity
The latest Census data sees South Arm placing among the least culturally diverse areas in the country when compared across a range of language and cultural background related metrics
South Arm's population showed lower cultural diversity, with 89.3% born in Australia, 93.7% being citizens, and 97.8% speaking English only at home. Christianity was the predominant religion, comprising 35.9%. Buddhism, however, was slightly overrepresented at 0.8%, compared to Greater Hobart's 1.0%.
The top three ancestral groups were English (36.0%), Australian (30.0%), and Irish (9.1%). Notably, Dutch ancestry was overrepresented at 1.7% versus the regional average of 1.3%, Scottish at 8.4% compared to 7.3%, and Australian Aboriginal remained consistent at 2.8%.
Frequently Asked Questions - Diversity
Age
South Arm hosts an older demographic, ranking in the top quartile nationwide
South Arm's median age is 45 years, which is higher than Greater Hobart's average of 39 years and exceeds the national average of 38 years. The 65-74 age group constitutes 15.0% of South Arm's population, compared to Greater Hobart's percentage, while the 25-34 age group makes up 7.2%, which is less prevalent than in Greater Hobart. This concentration of the 65-74 age group is significantly higher than the national average of 9.4%. According to post-2021 Census data, the 15-24 age group has increased from 9.0% to 11.4%, and the 75-84 cohort has risen from 4.1% to 6.5%. Conversely, the 55-64 cohort has decreased from 17.6% to 14.7%, and the 5-14 age group has dropped from 13.3% to 11.1%. Demographic modeling indicates that South Arm's age profile will change significantly by 2041. The 75-84 cohort is projected to grow by 80%, adding 244 residents to reach 548. Residents aged 65 and above will drive 52% of population growth, emphasizing demographic aging trends. Meanwhile, population declines are projected for the 65-74 and 25-34 age groups.

