Chart Color Schemes
est. as @ -- *
ABS ERP | -- people | --
2021 Census | -- people
Sales Activity
Curious about local property values? Filter the chart to assess the volume and appreciation (including resales) trends and regional comparisons, or scroll to the map below view this information at an individual property level.
Find a Recent Sale
Sales Detail
Population
Population growth drivers in Cambridge are strong compared to national averages based on AreaSearch's ranking of recent, and medium to long-term trends
As of November 2025, Cambridge's population is approximately 8,998, indicating a growth of 425 individuals (5.0%) since the 2021 Census which recorded a population of 8,573. This increase is inferred from ABS' estimated resident population of 8,856 in June 2024 and an additional 317 validated new addresses post-Census date. This results in a population density ratio of 88 persons per square kilometer. Cambridge's growth rate since the 2021 Census exceeds both the SA4 region (4.3%) and metropolitan area, positioning it as a regional growth leader. Natural growth contributed approximately 54.0% to overall population gains during recent periods. AreaSearch employs ABS/Geoscience Australia projections for each SA2 area released in 2024 with a base year of 2022.
For areas not covered by this data, Tasmania State Government's Regional/LGA projections released in 2022 with a base year of 2021 are adopted and adjusted using weighted aggregation from LGA to SA2 levels. Based on projected demographic shifts, Cambridge is expected to experience population growth just below the national median by 2041, with an increase of approximately 1,127 persons (10.9% overall) over the seventeen-year period.
Frequently Asked Questions - Population
Development
Residential development activity is slightly higher than average within Cambridge when compared nationally
Cambridge averaged approximately 33 new dwelling approvals annually. Between financial years FY-21 and FY-25167 homes were approved, with an additional 23 approved so far in FY-26. Over these past five financial years, an average of 4.2 people moved to the area for each dwelling built.
This high demand outpaces supply, exerting upward pressure on prices and intensifying competition among buyers. The average construction value of new properties is $374,000, indicating a focus on premium developments. In FY-26, $40.2 million in commercial development approvals have been recorded, suggesting robust local business investment.
Compared to Greater Hobart, Cambridge shows about 63% of the construction activity per person, placing it at the 38th percentile nationally. This means limited buyer options and strengthened demand for established dwellings. Recent building activity consists solely of detached houses, maintaining Cambridge's low-density nature while attracting space-seeking buyers. The estimated population per dwelling approval is 487 people. Future projections anticipate an addition of 982 residents by 2041. Current construction rates appear balanced with future demand, fostering steady market conditions without excessive price pressure.
Frequently Asked Questions - Development
Infrastructure
Cambridge has limited levels of nearby infrastructure activity, ranking in the 6thth percentile nationally
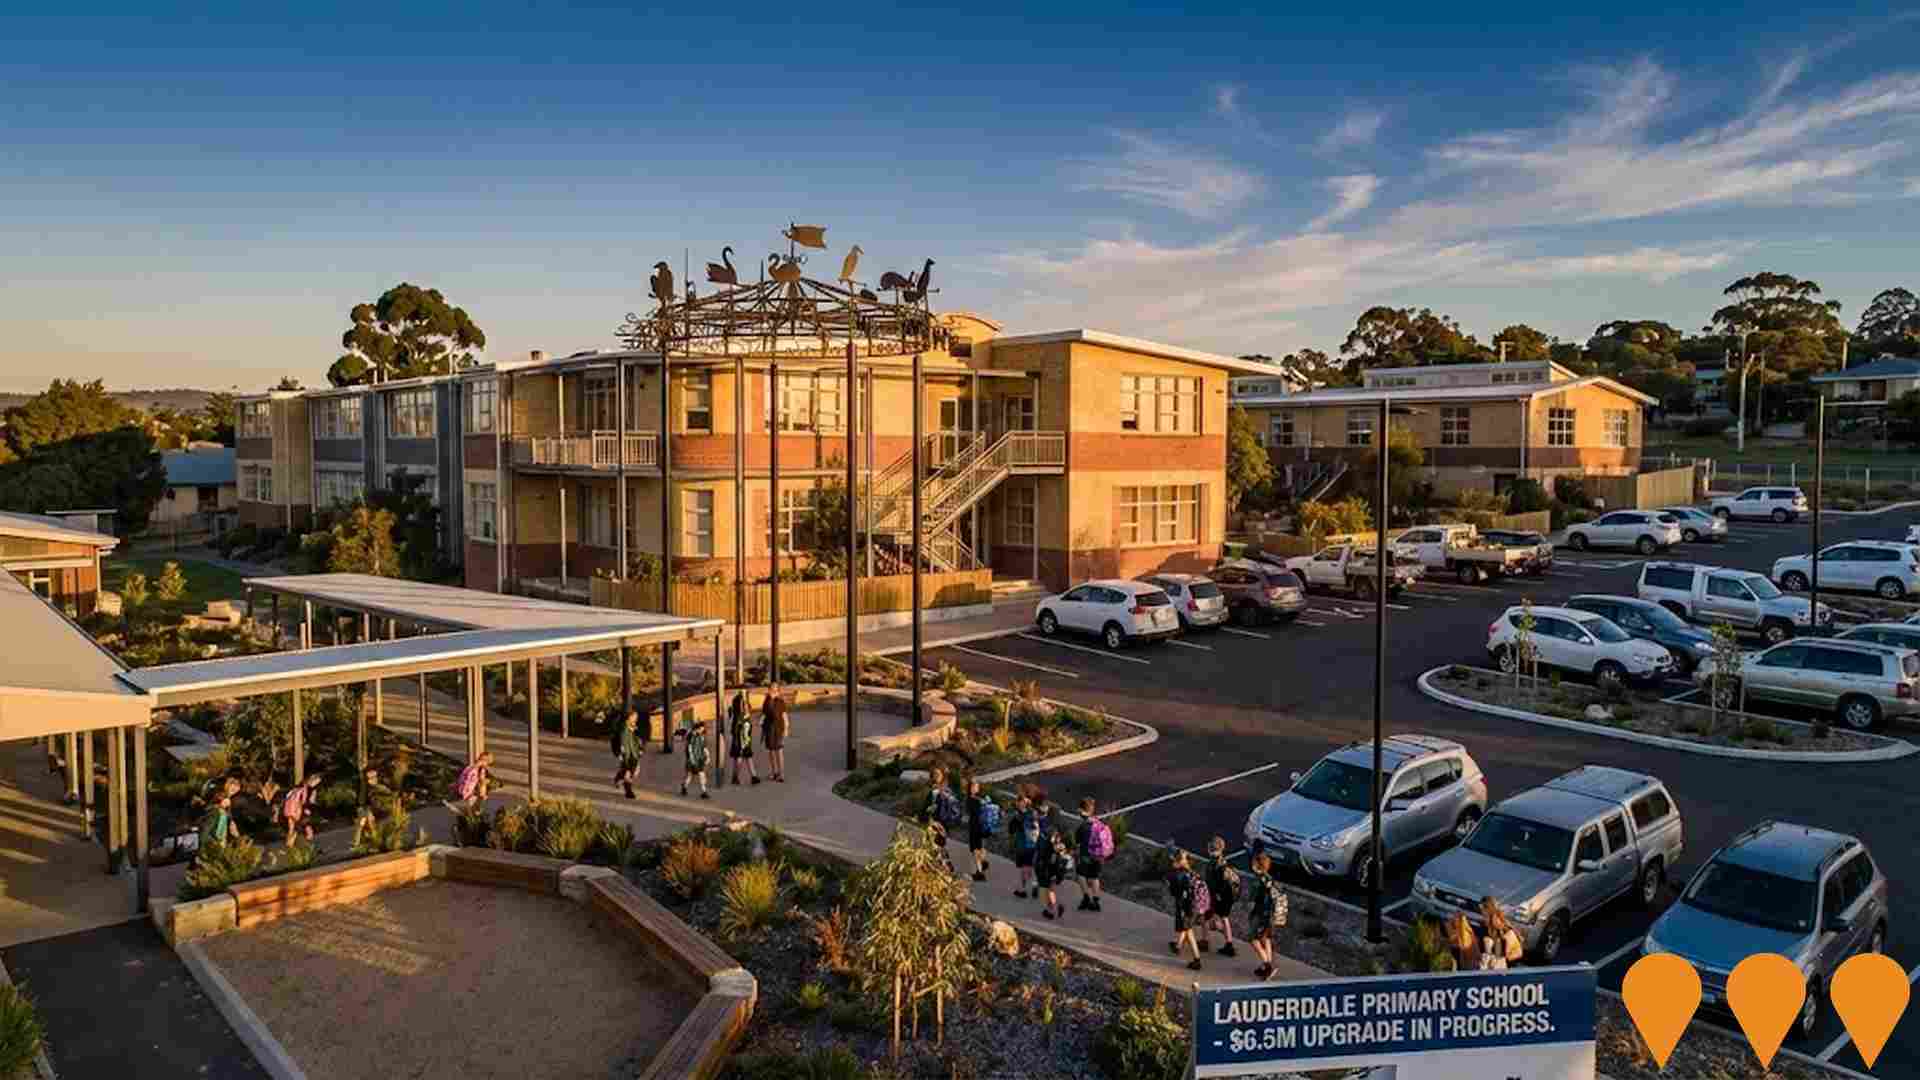
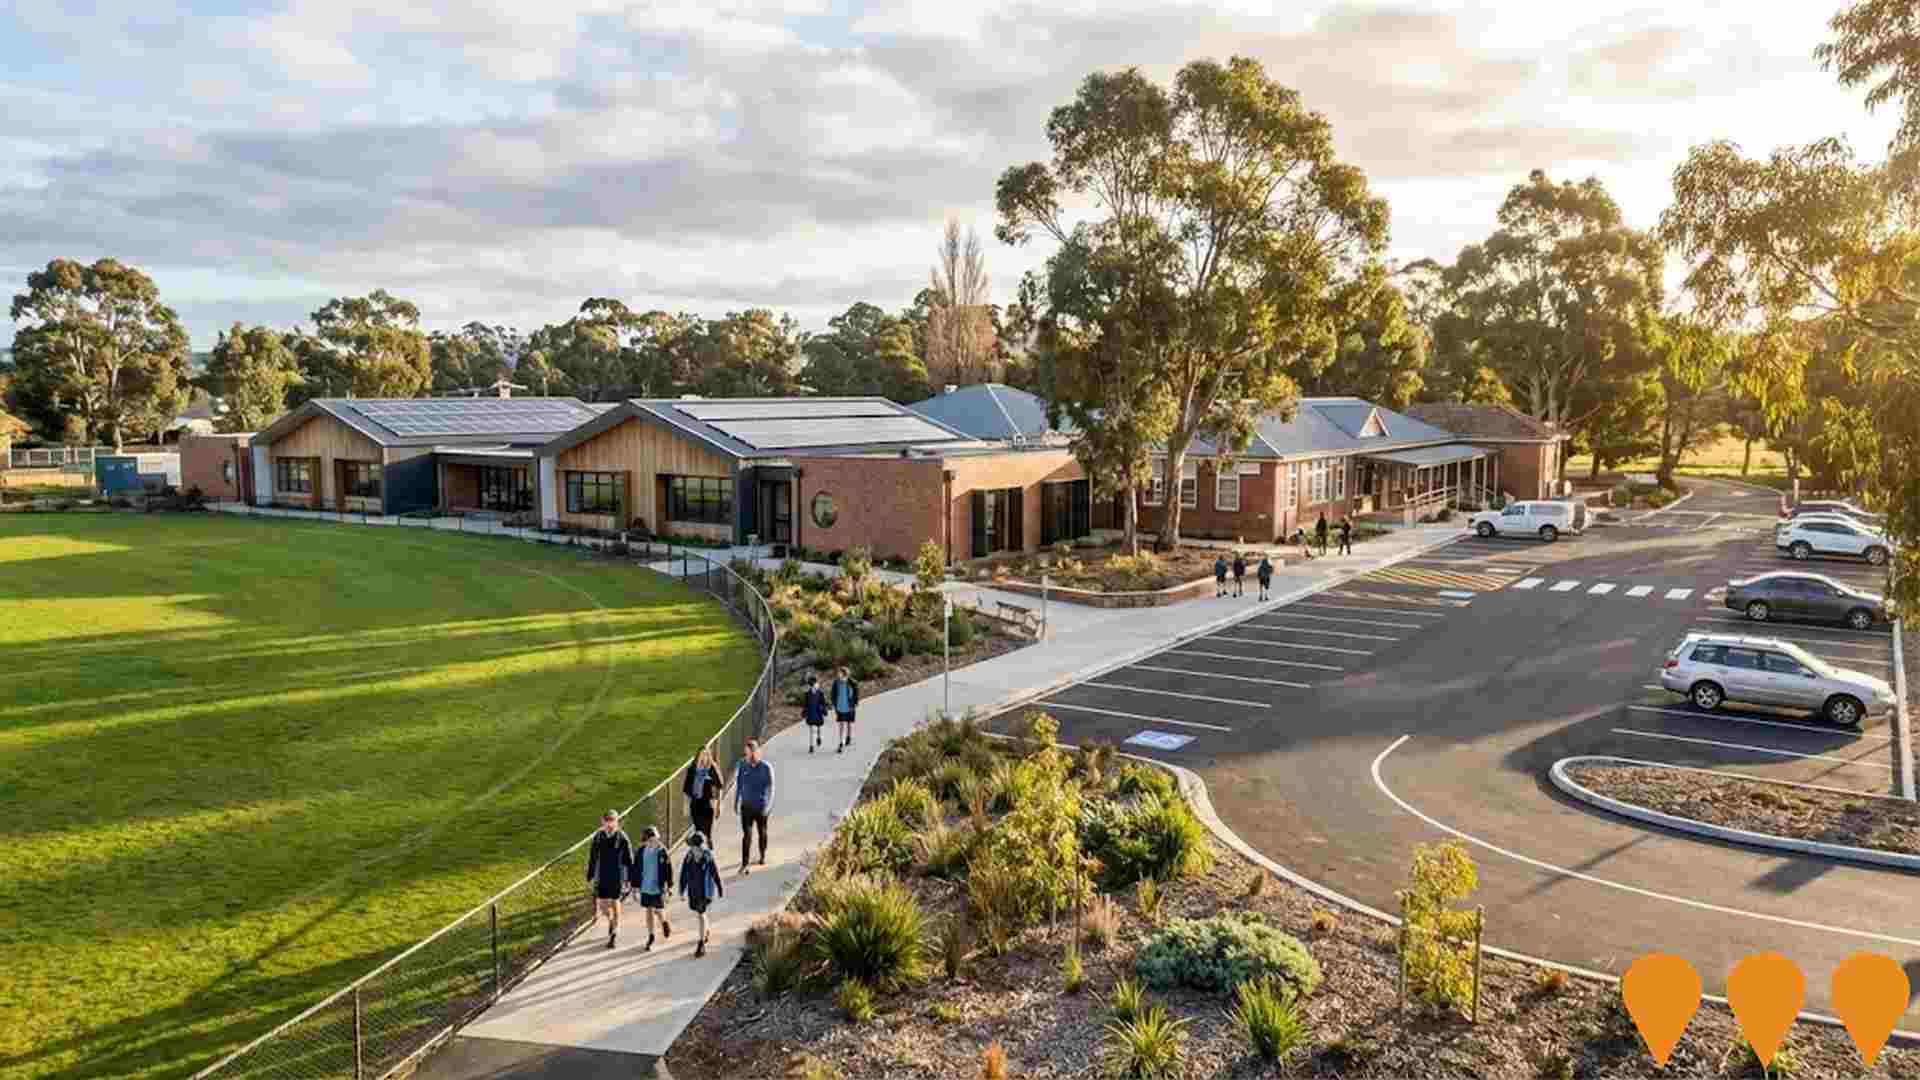
Changes to local infrastructure significantly influence an area's performance. AreaSearch has identified 16 projects likely to impact the area. Key projects include the Tasman Highway Duplication Project, Cambridge-Clarence Recycled Water Interconnector, Lauderdale Primary School project, and Cambridge Primary School Redevelopment. The following list details those most relevant.
Professional plan users can use the search below to filter and access additional projects.
INFRASTRUCTURE SEARCH
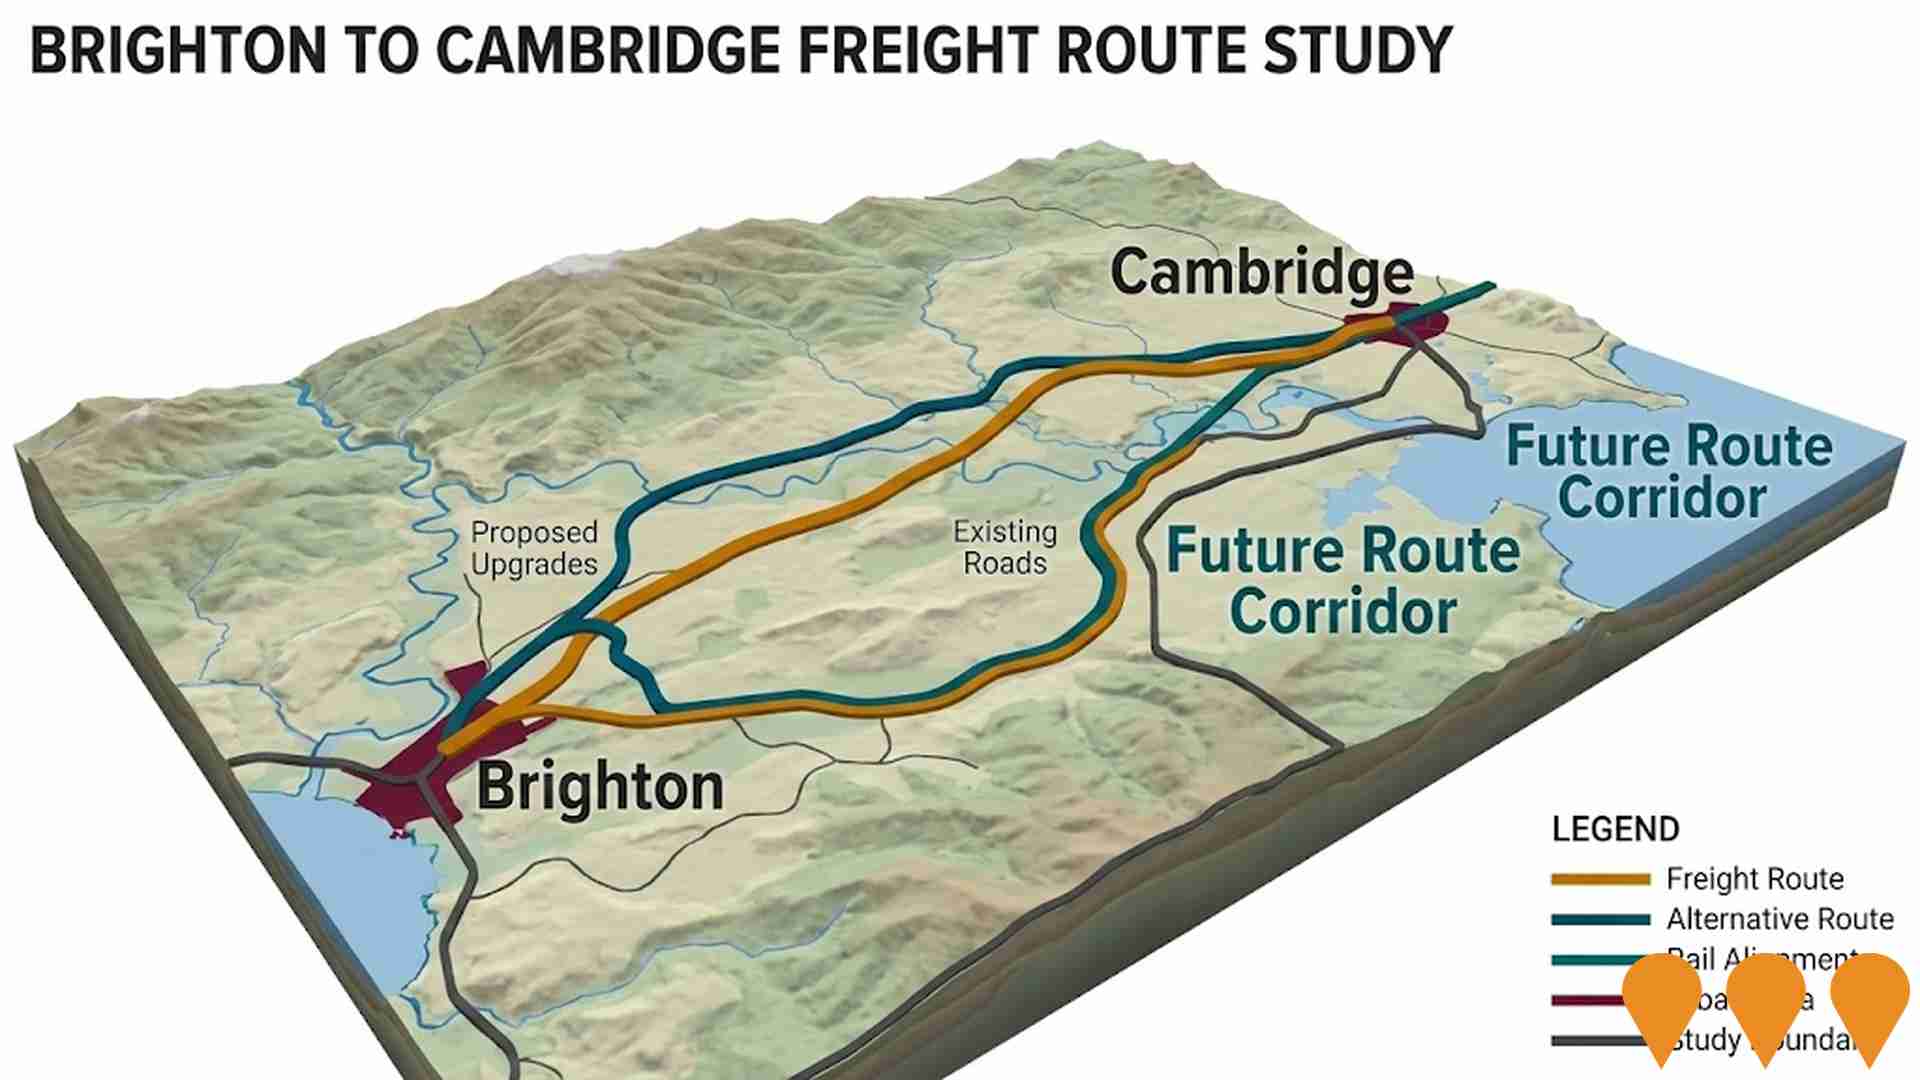
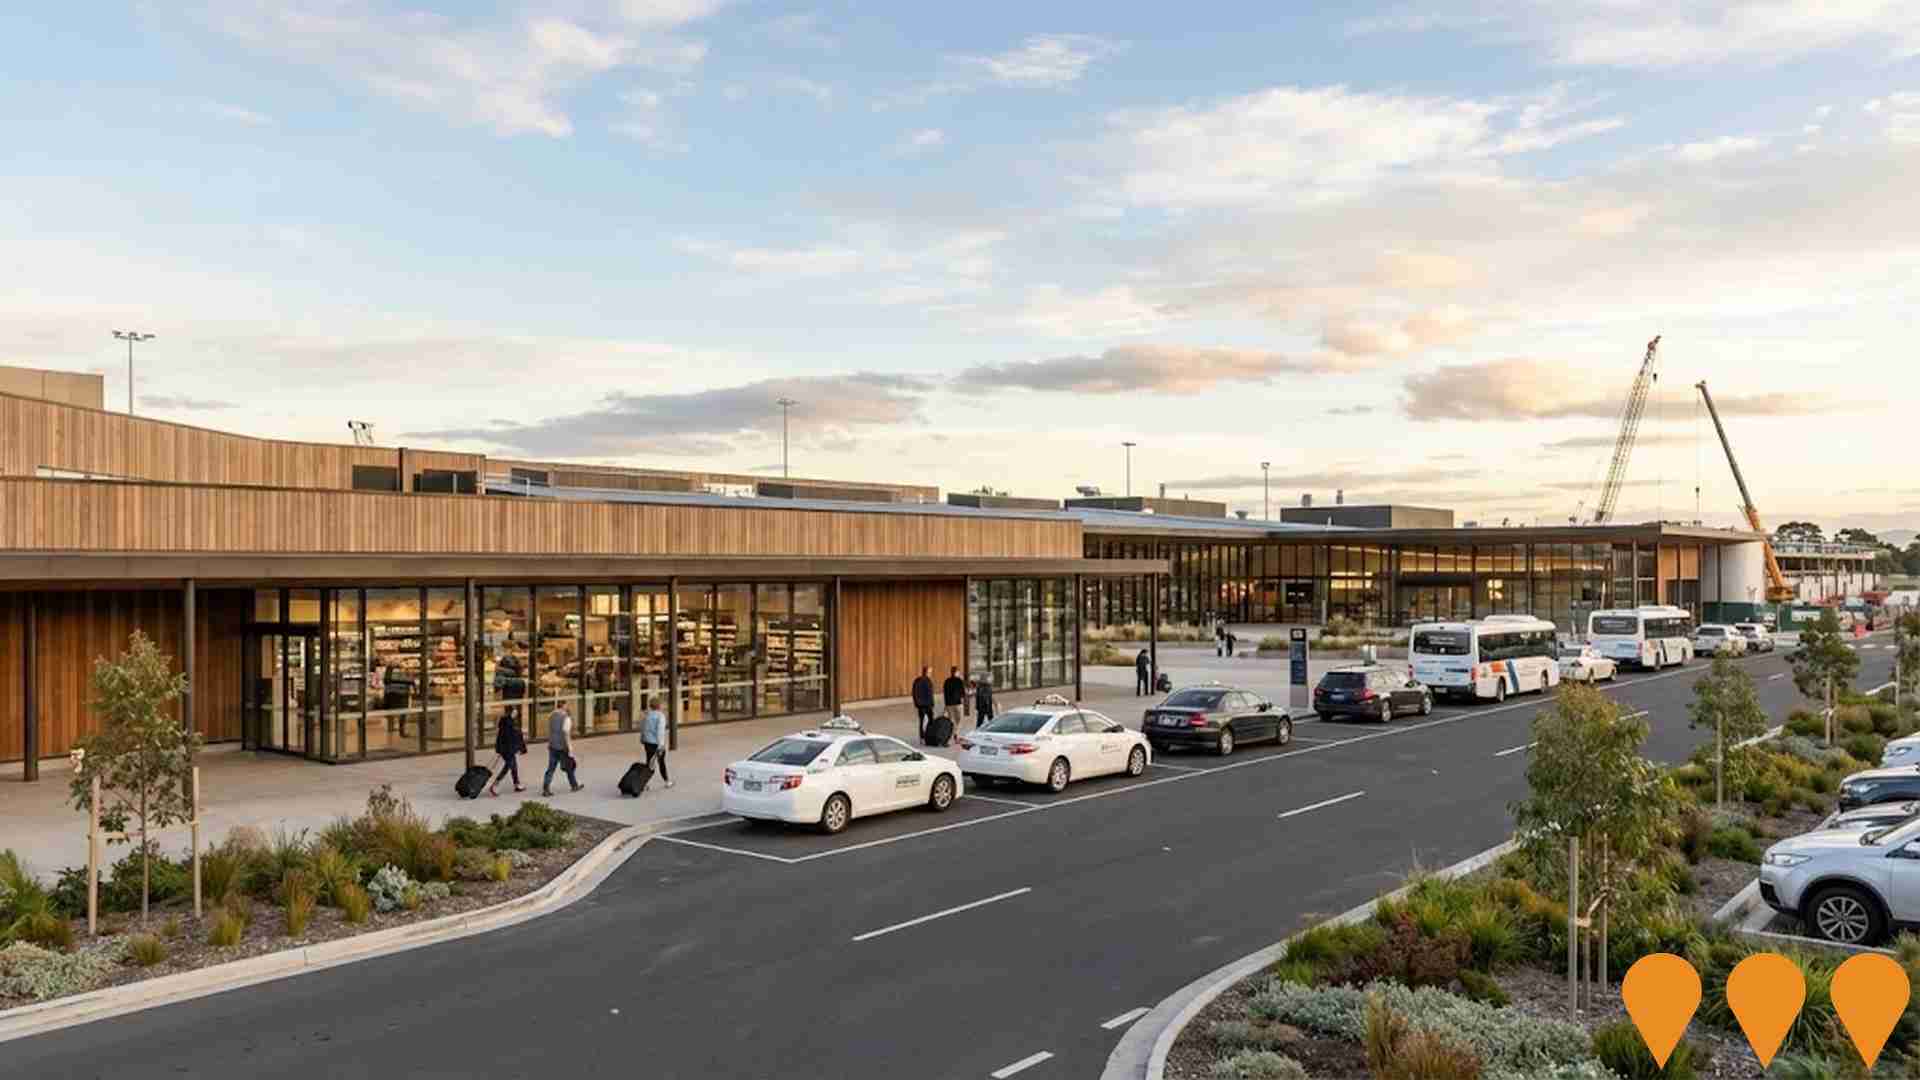
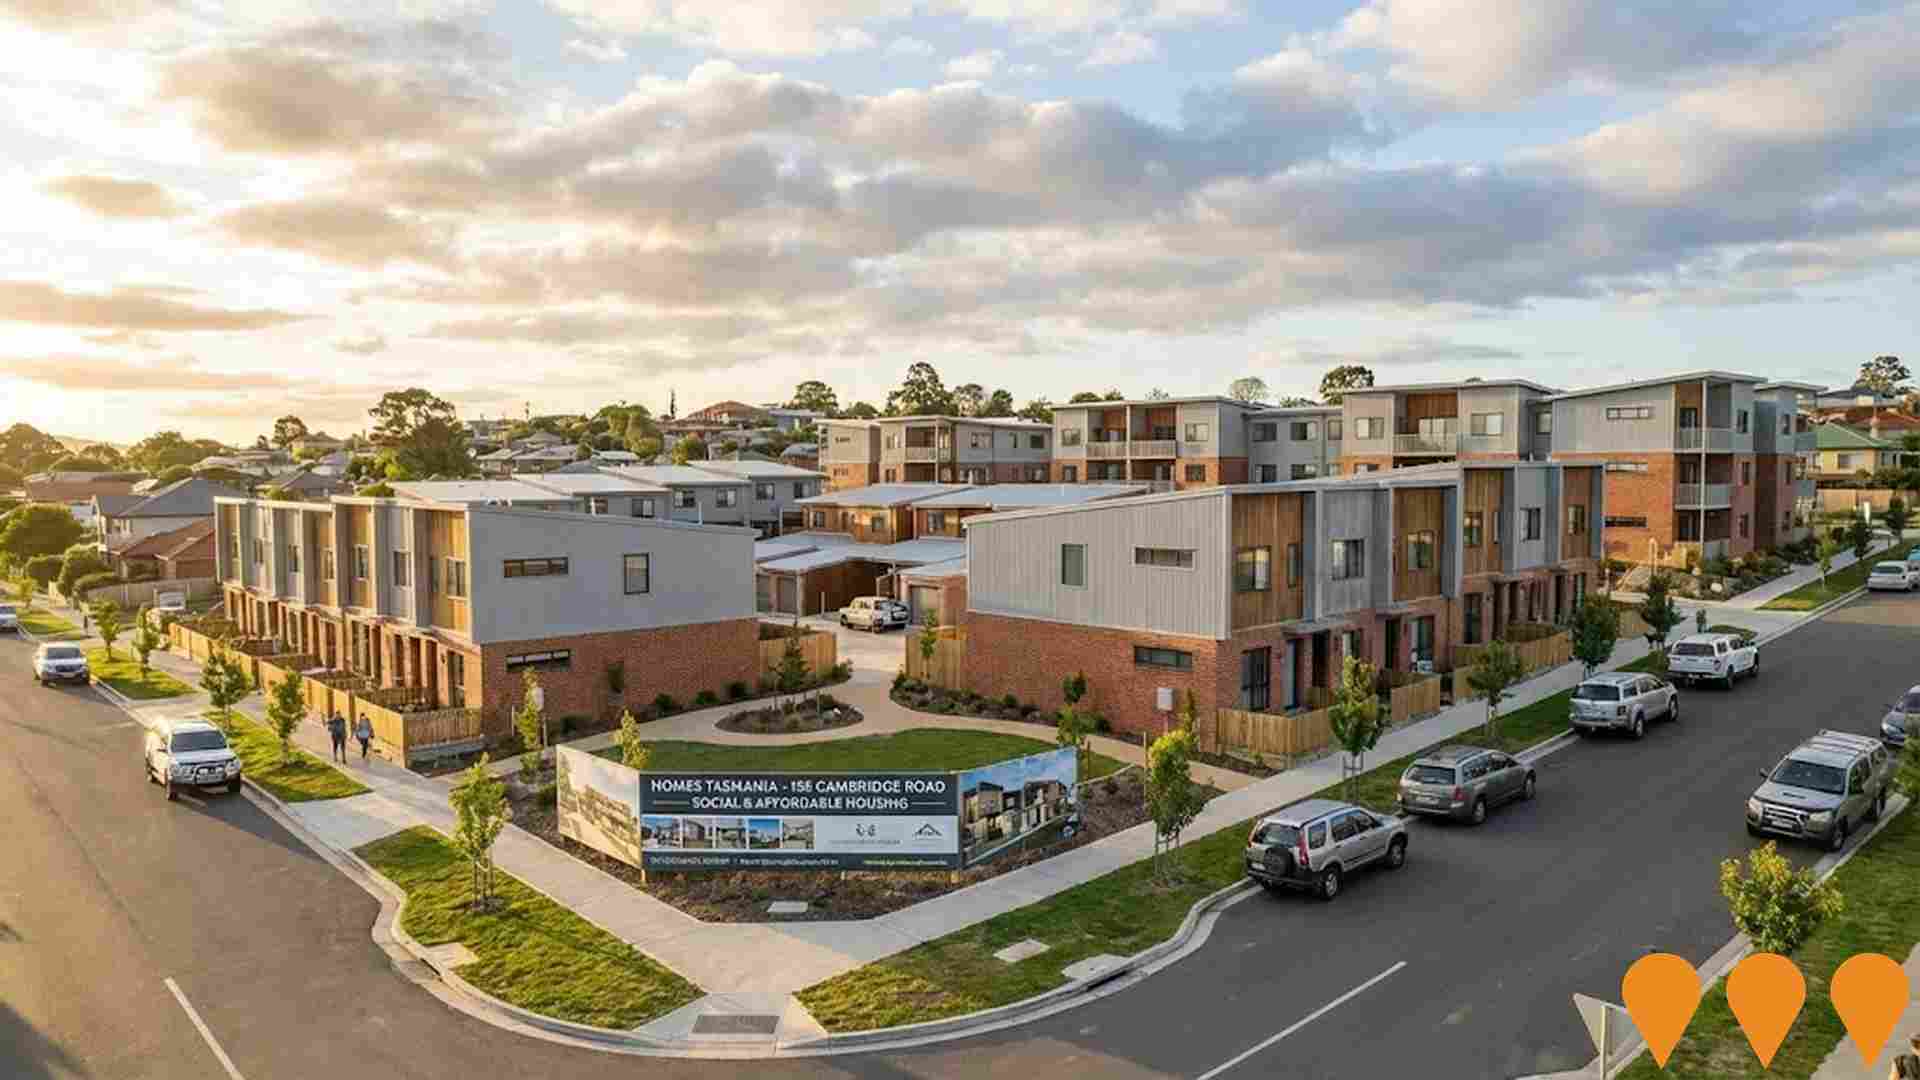
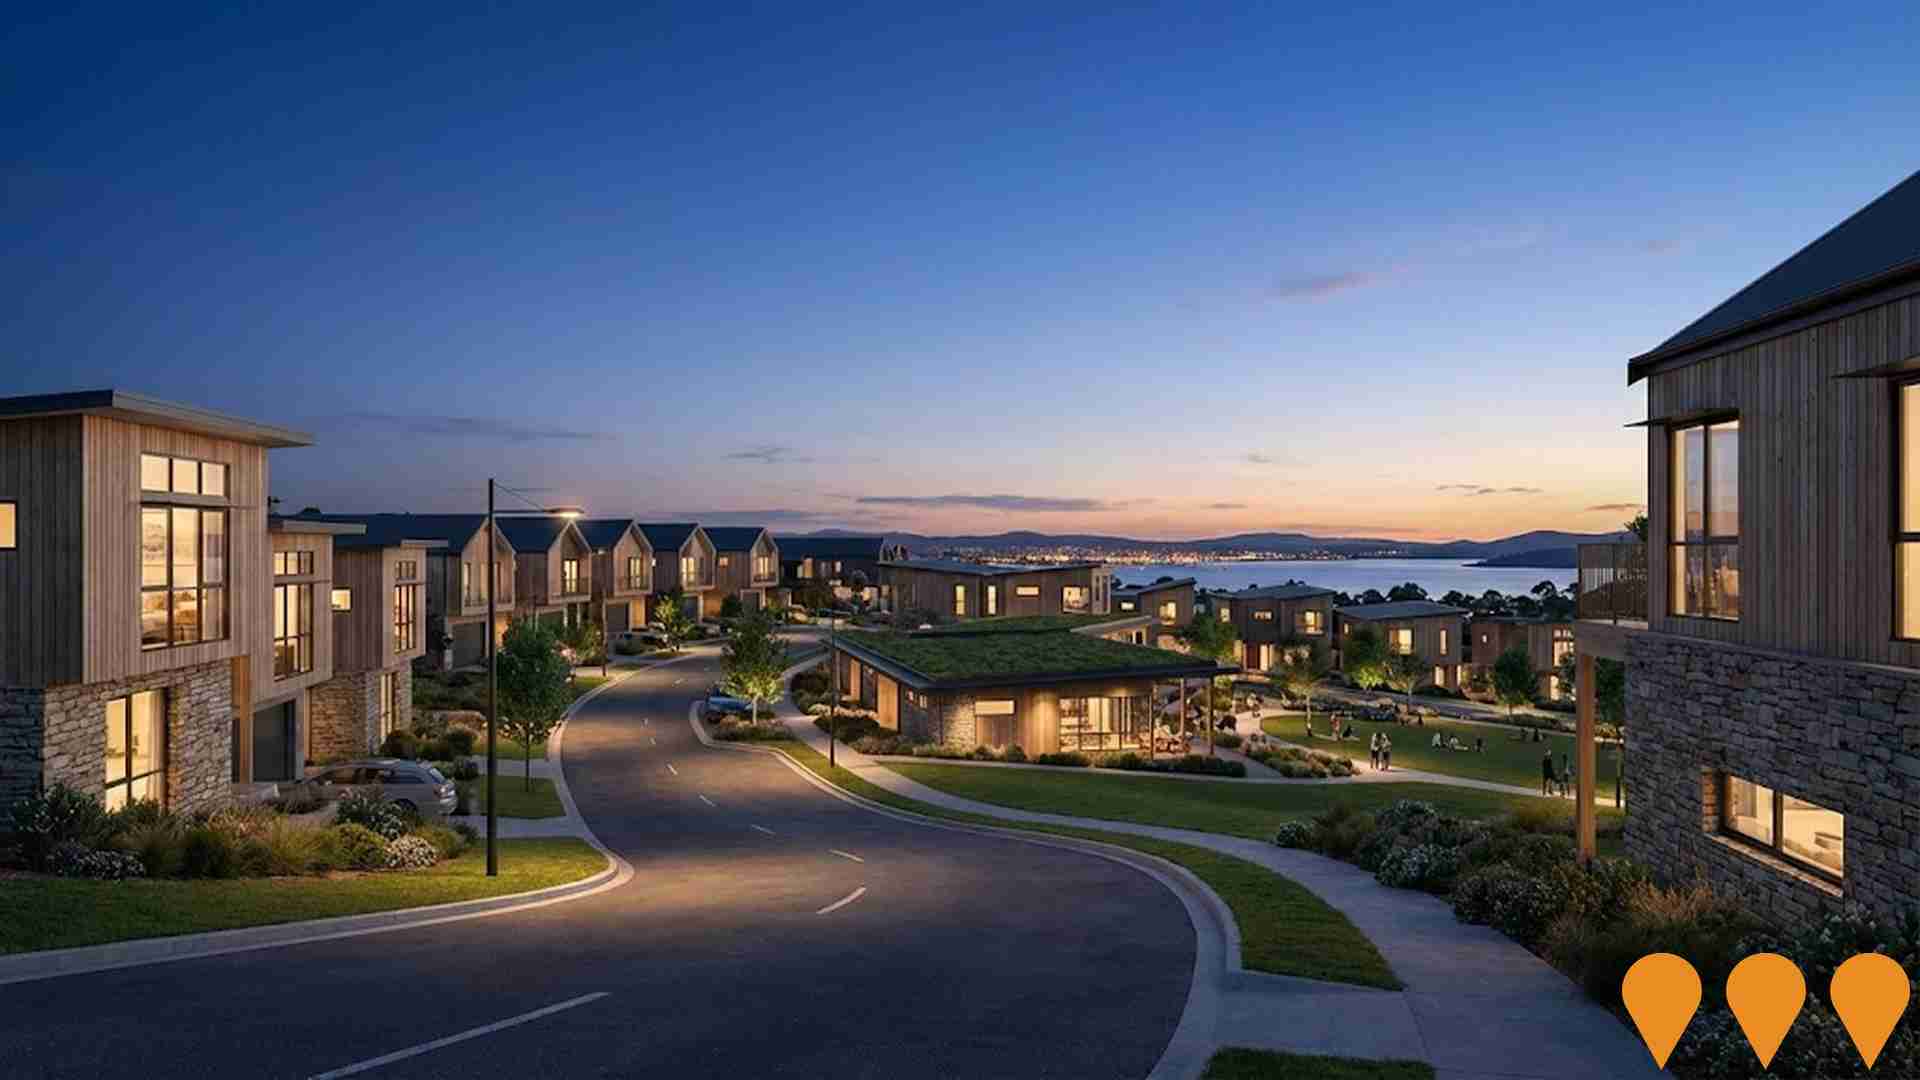
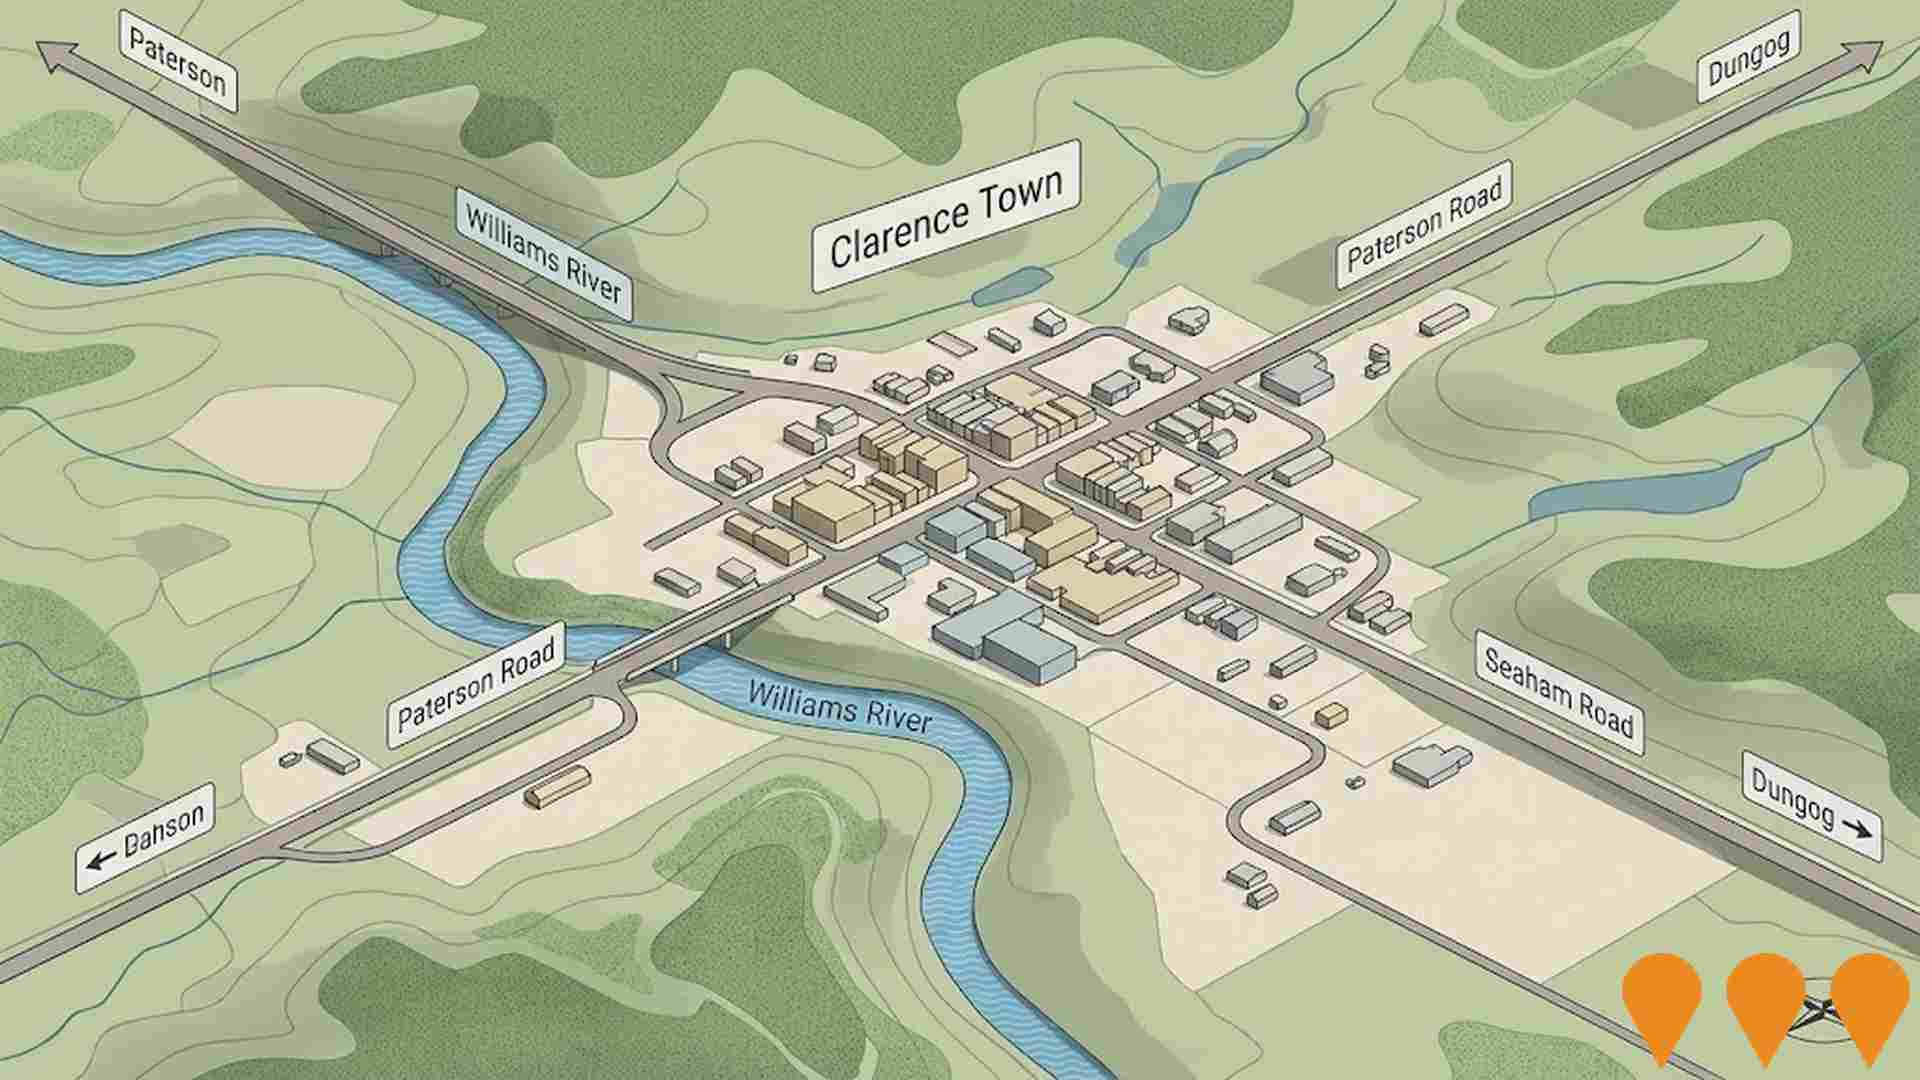
 Denotes AI-based impression for illustrative purposes only, not to be taken as definitive under any circumstances. Please follow links and conduct other investigations from the project's source for actual imagery. Developers and project owners wishing us to use original imagery please Contact Us and we will do so.
Frequently Asked Questions - Infrastructure
Droughty Peninsula Structure Plan
A long-term planning framework by Clarence City Council for 388 hectares to guide growth and development over 20-25 years on the Droughty Peninsula, based on the approved Skylands Masterplan. It focuses on housing variety, transport, environmental protection, and provision of community services and recreation, and will inform future statutory planning decisions. Phase 2 community engagement on the plan closed in August 2025.
Glebe Hill Village
A 6,002 square metre neighbourhood shopping centre anchored by Coles and a 24-hour McDonald's drive-thru, plus Priceline Pharmacy, Liquorland, and 16 specialty stores. Opened in August 2022, it is noted as Tasmania's most technologically and environmentally advanced neighbourhood centre with solar array, EV chargers, and smart-tech features. The centre was sold by Tipalea Partners to a Charter Hall managed fund for $50.25 million in January 2025.

Clarence City Heart Plan
A council-led precinct and urban renewal framework for Clarence's city centre covering Rosny Park, Kangaroo Bay and Bellerive. The 2024-25 final draft identifies eight linked precincts and sets long-term directions for housing diversity, public spaces, culture, movement and economic growth. Community re-engagement ran Dec 2024 to Feb 2025 with strong support reported in March 2025; the plan remains in the planning phase pending final endorsement.
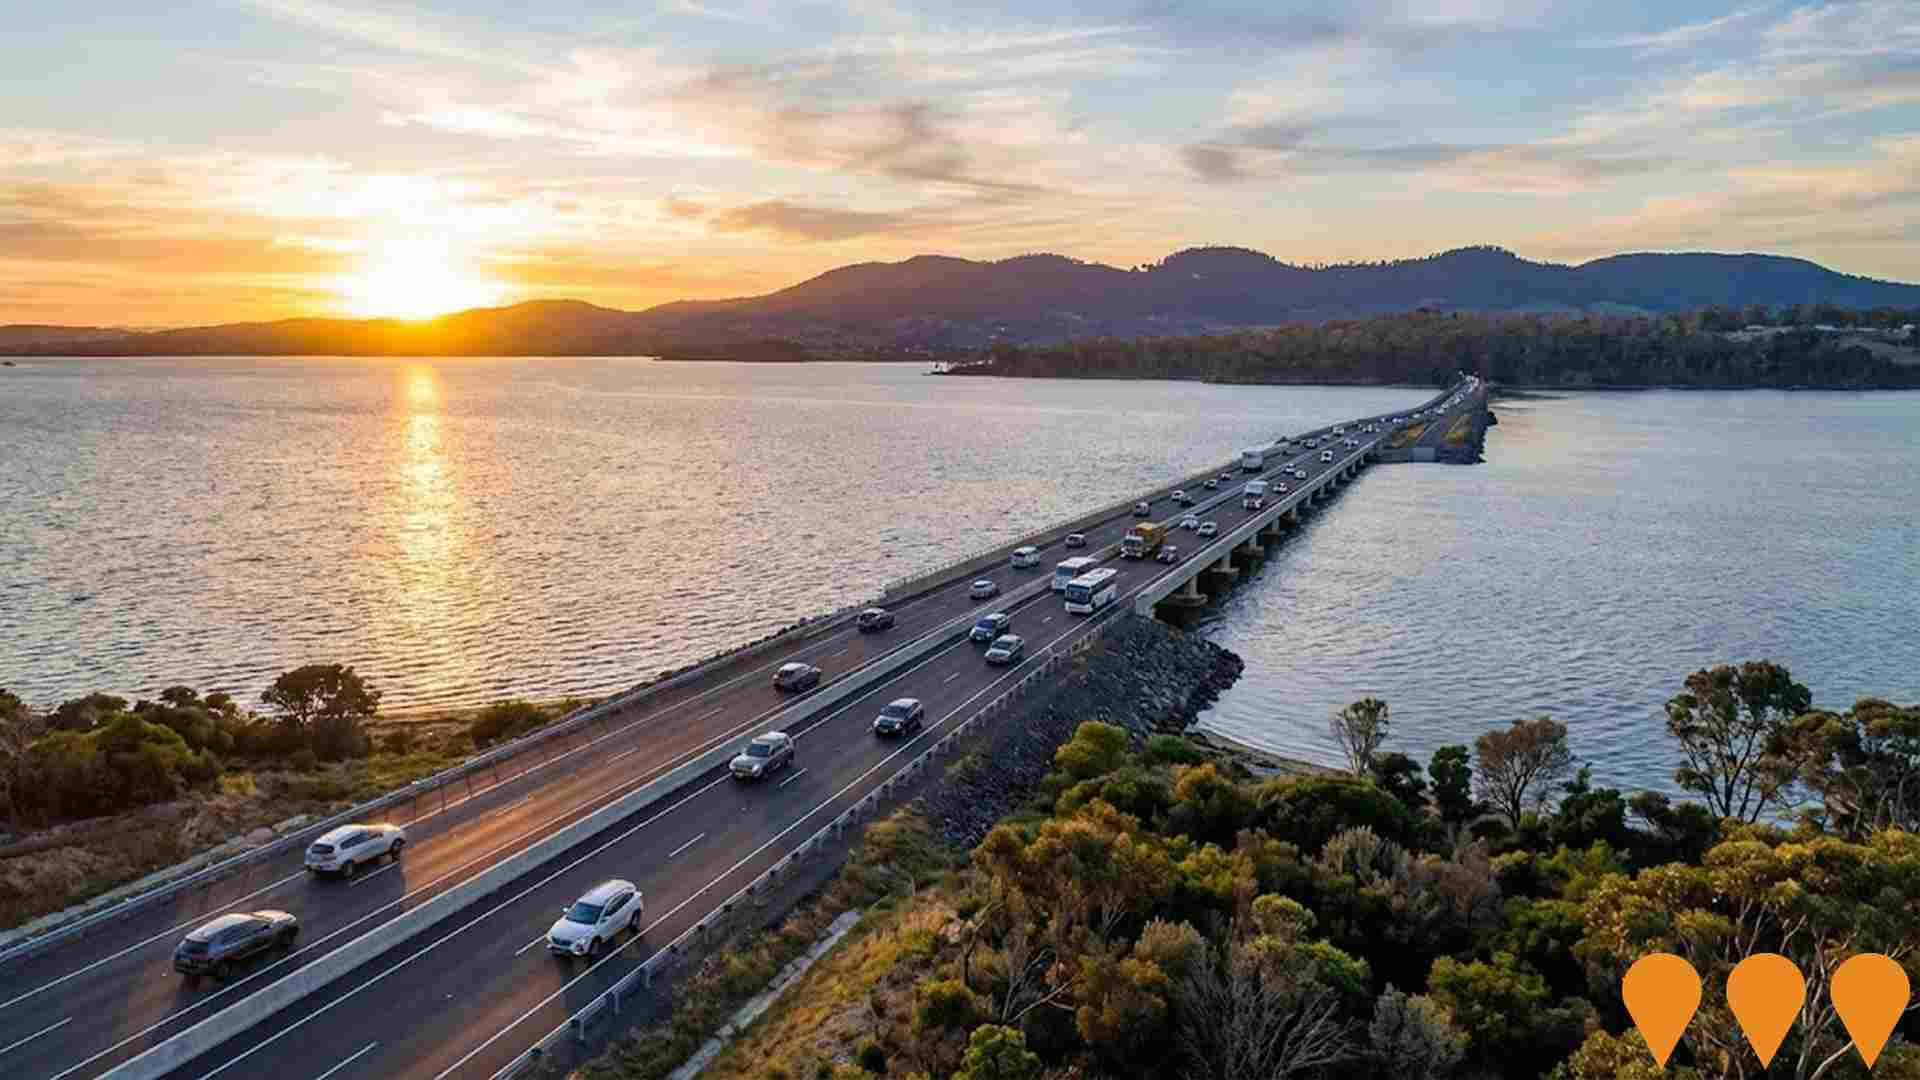
Tasman Highway Duplication Project
Transforming the Tasman Highway between Hobart and Sorell into a consistent four-lane connection, including duplication of Midway Point and Sorell Causeways, subject to Commonwealth environmental approvals.
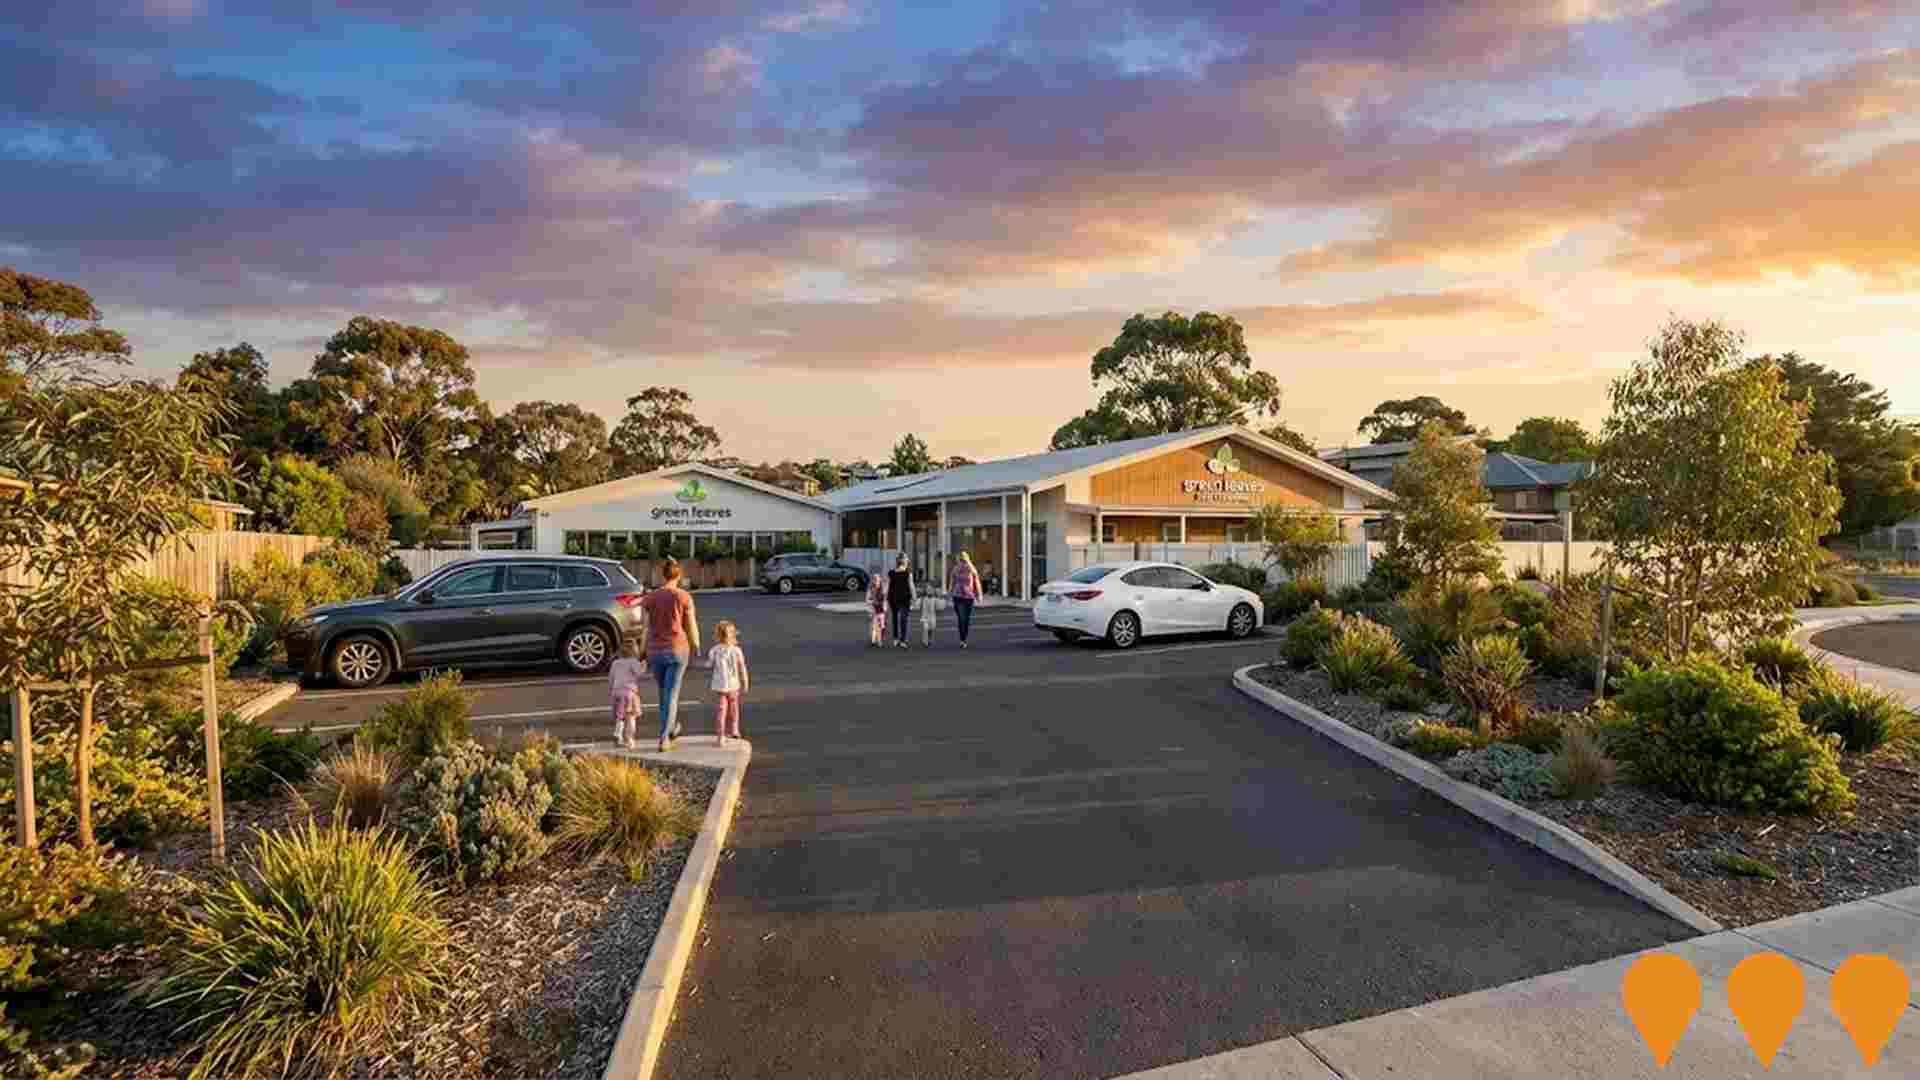
Glebe Hill Childcare Centre
A $9 million, 106-place early learning childcare centre developed by Tipalea Partners adjacent to the Glebe Hill Village shopping precinct. Construction commenced in July 2025 by Bennett Construction, with completion scheduled for April 2026. The centre will be tenanted by national operator Green Leaves Early Learning and is designed to address a critical childcare shortage in Hobart's south-east.
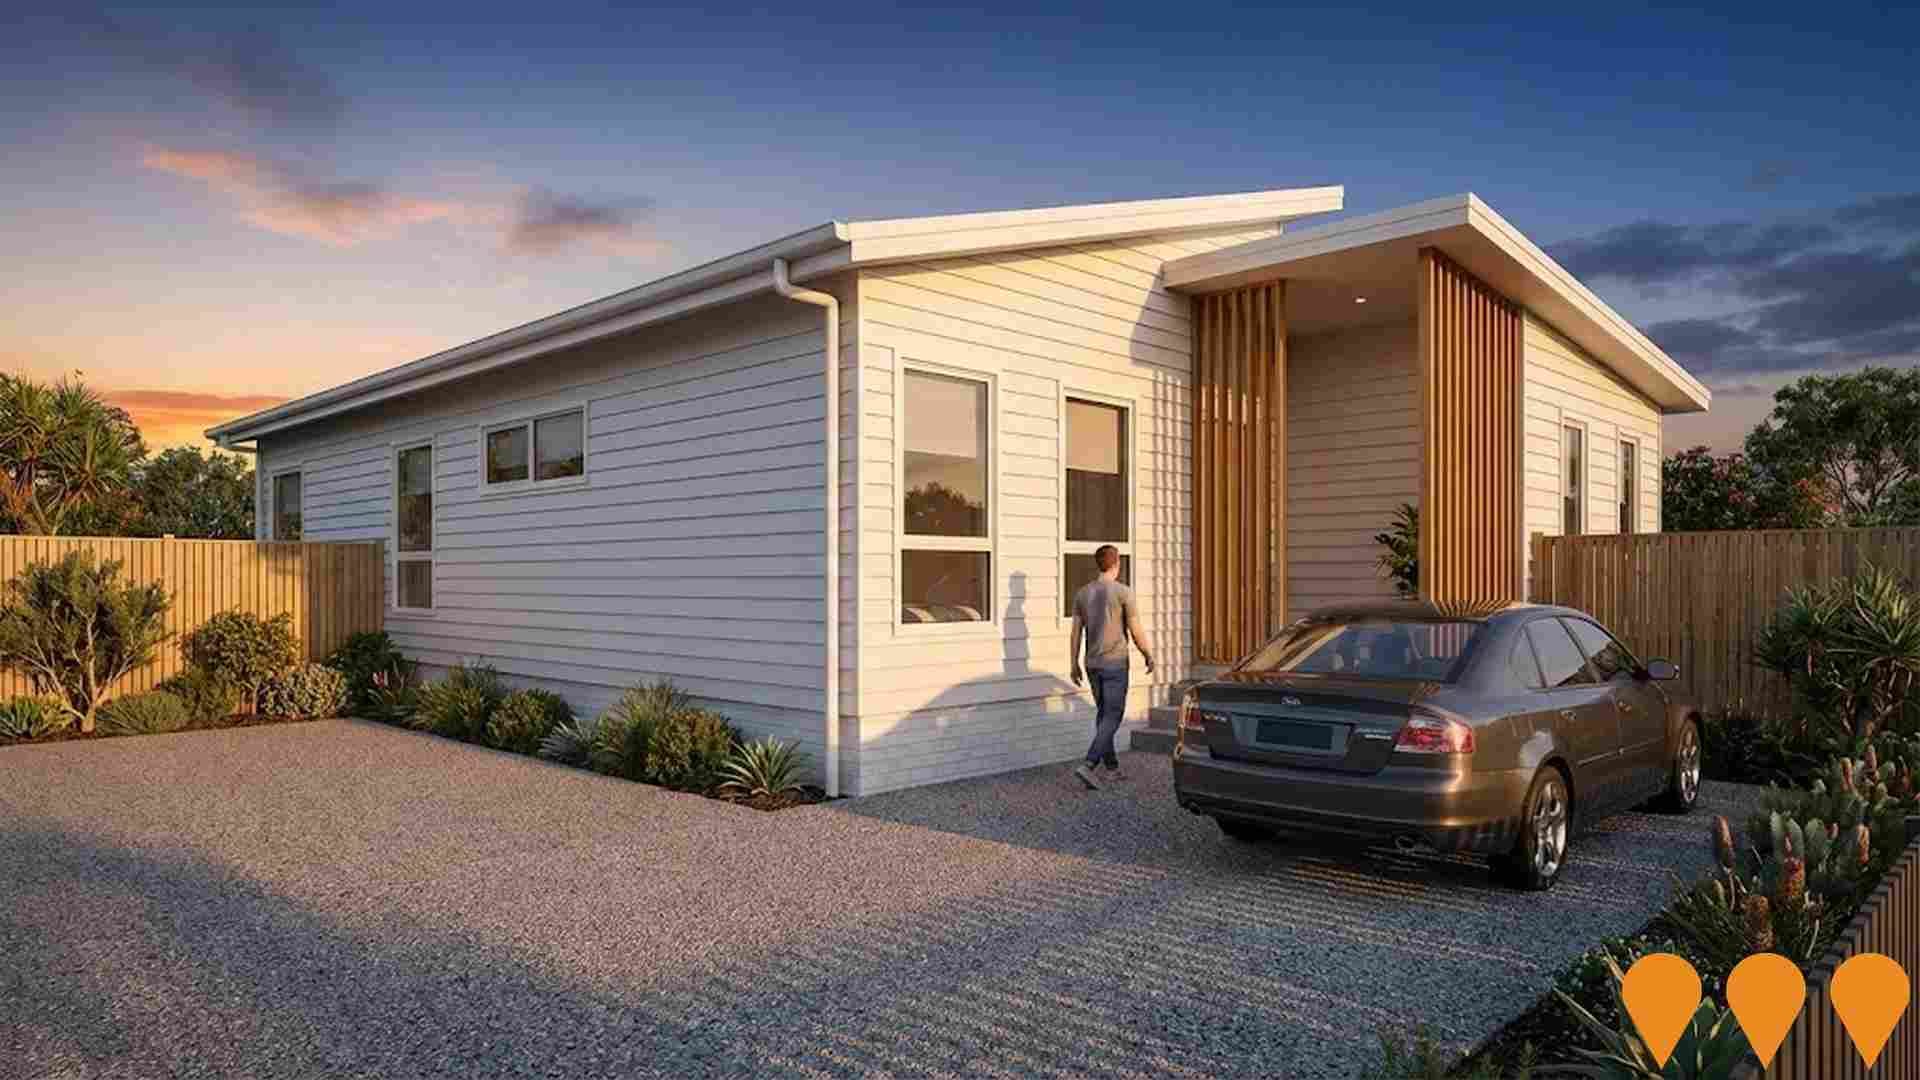
Clarence Street, Howrah Affordable Housing Development
Rezoning of approximately 1300 square meters of surplus land from Utilities to General Residential Zone via a Housing Land Supply Order (effective June 14, 2023) to enable the development of up to 4 dwelling units for social and affordable housing. The land is currently being prepared for transfer to Homes Tasmania, after which new titles will be created and development plans will be considered for a subdivision application to Clarence City Council.
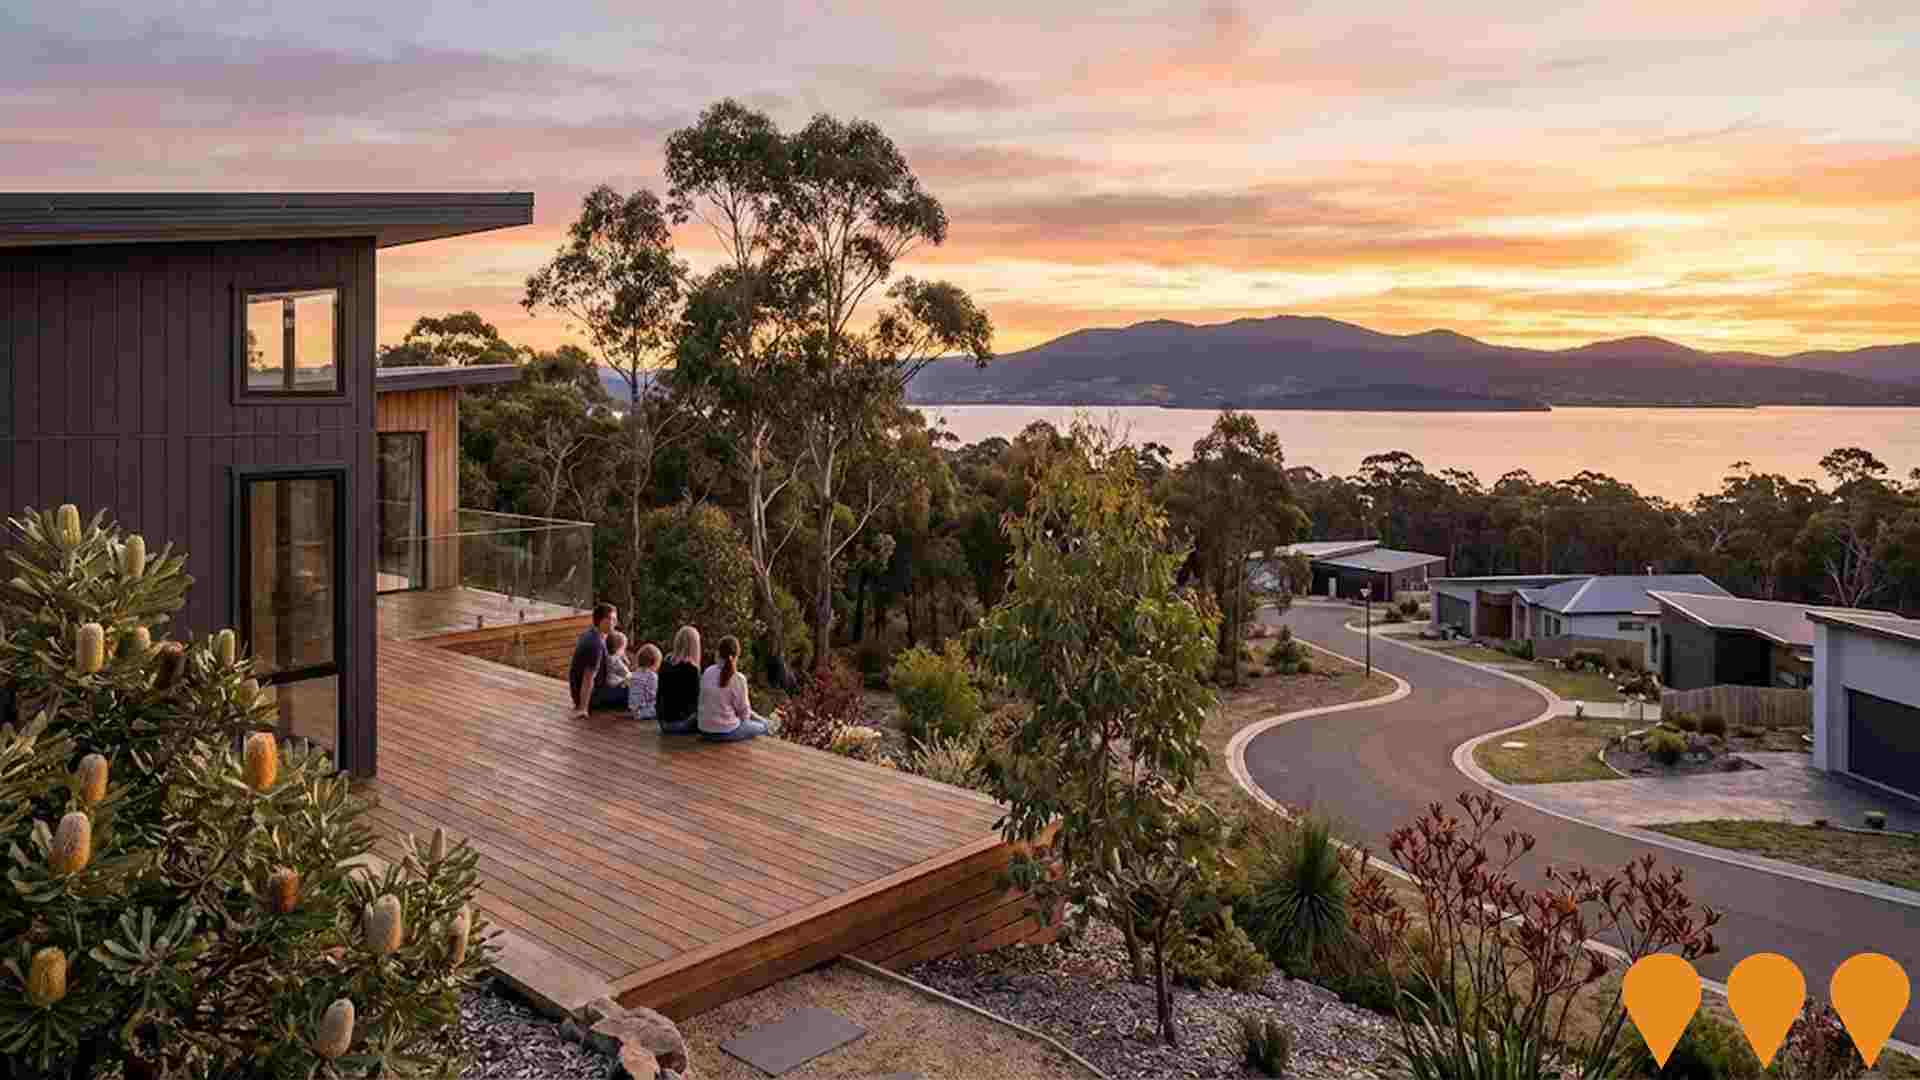
Oceana Phase 2 Master Plan
An approved master plan for integrated conservation management and limited residential development (Coventry Rise and Oceana Rise) on the Rokeby Hills above Howrah and Tranmere. It proposes bushland lots and residential clusters close to nature, providing for various residential living styles and maintaining bushland for conservation and public open space. The Master Plan was approved by Clarence City Council for re-zoning and subdivision. The proposed development includes bushland edge lots and standard lots. The development is being rolled out in stages, such as the Coventry Rise lots which have been for sale.
Sorell School Redevelopment
A $27 million redevelopment has transformed Sorell School into a modern, unified Kindergarten to Year 12 campus, delivering a combination of new buildings and refurbishment of existing facilities, including a new Child and Family Learning Centre.

Employment
Cambridge ranks among the top 25% of areas assessed nationally for overall employment performance
Cambridge has an educated workforce with key industries being health care & social assistance, construction, and public administration & safety. As of June 2025, the unemployment rate is 1.5%.
The area has a higher employment participation rate at 67.4% compared to Greater Hobart's 61.6%. Employment specialization in construction is high, with an employment share 1.4 times the regional level. Conversely, accommodation & food services are under-represented at 5.0%, compared to Greater Hobart's 8.0%. The ratio of workers per resident, as at the Census, indicates ample local employment opportunities.
Between June 2024 and June 2025, Cambridge's labour force decreased by 1.6% and employment declined by 1.7%, maintaining a stable unemployment rate. In contrast, Greater Hobart experienced a 1.5% employment decline and a 1.6% labour force decline, with a slight increase in unemployment rate of 0.2 percentage points. National employment forecasts from Jobs and Skills Australia (May 2025) project a 6.6% growth over five years and 13.7% over ten years. Applying these projections to Cambridge's employment mix suggests local growth of approximately 6.6%% over five years and 13.6% over ten years, though this is a simple extrapolation for illustrative purposes only.
Frequently Asked Questions - Employment
Income
Income metrics indicate excellent economic conditions, with the area achieving higher performance than 75% of national locations assessed by AreaSearch
Cambridge shows a median taxpayer income of $58,607 and an average of $72,088 according to the latest postcode level ATO data aggregated by AreaSearch for financial year 2022. This is high nationally, contrasting with Greater Hobart's median income of $51,272 and average income of $63,777. Based on Wage Price Index growth of 13.83% since financial year 2022, current estimates would be approximately $66,712 (median) and $82,058 (average) as of September 2025. Census data reveals household, family and personal incomes all rank highly in Cambridge, between the 77th and 77th percentiles nationally. The earnings profile shows the largest segment comprises 33.7% earning $1,500 - 2,999 weekly (3,032 residents), aligning with the surrounding region where this cohort likewise represents 32.2%. Cambridge demonstrates considerable affluence with 32.3% earning over $3,000 per week, supporting premium retail and service offerings. After housing costs, residents retain 89.2% of income, reflecting strong purchasing power. The area's SEIFA income ranking places it in the 7th decile.
Frequently Asked Questions - Income
Housing
Cambridge is characterized by a predominantly suburban housing profile, with above-average rates of outright home ownership
In Cambridge, as per the latest Census evaluation, 96.5% of dwellings were houses, with 3.4% being other types such as semi-detached homes, apartments, and 'other' dwellings. In comparison, Hobart metro had 93.4% houses and 6.6% other dwellings. Home ownership in Cambridge stood at 42.7%, with the rest of the dwellings either mortgaged (49.8%) or rented (7.5%). The median monthly mortgage repayment was $1,800, higher than Hobart metro's average of $1,538. The median weekly rent in Cambridge was $400, compared to Hobart metro's $350. Nationally, Cambridge's mortgage repayments were lower than the Australian average of $1,863, while rents exceeded the national figure of $375.
Frequently Asked Questions - Housing
Household Composition
Cambridge features high concentrations of family households, with a higher-than-average median household size
Family households constitute 81.1% of all households, including 39.6% couples with children, 32.0% couples without children, and 8.7% single parent families. Non-family households comprise the remaining 18.9%, with lone person households at 17.4% and group households making up 1.5%. The median household size is 2.8 people, larger than the Greater Hobart average of 2.4.
Frequently Asked Questions - Households
Local Schools & Education
The educational profile of Cambridge exceeds national averages, with above-average qualification levels and academic performance metrics
University qualification levels in Cambridge are at 28.9%, slightly below the SA4 region average of 32.8%. Bachelor degrees are most common at 19.4%, followed by postgraduate qualifications at 5.9% and graduate diplomas at 3.6%. Vocational credentials are held by 37.5% of residents aged 15 and above, with advanced diplomas at 11.7% and certificates at 25.8%.
Educational participation is high, with 27.3% of residents currently enrolled in formal education. This includes 10.8% in primary, 7.8% in secondary, and 3.9% in tertiary education. Lauderdale Primary School and Cambridge Primary School serve a total of 1,033 students, with typical Australian school conditions (ICSEA: 1045) indicating balanced educational opportunities. These two schools focus on primary education, while secondary options are available nearby.
Frequently Asked Questions - Education
Schools Detail
Nearby Services & Amenities
Transport
Transport servicing is good compared to other areas nationally based on assessment of service frequency, route connectivity and accessibility
Transport analysis indicates 109 active transport stops in Cambridge, served by a mix of buses via 97 routes. These routes facilitate 8,605 weekly passenger trips. Residents' average proximity to the nearest stop is 478 meters, indicating moderate accessibility.
Daily service frequency averages 1,229 trips across all routes, translating to approximately 78 weekly trips per individual stop.
Frequently Asked Questions - Transport
Transport Stops Detail
Health
Cambridge's residents are healthier than average in comparison to broader Australia with prevalence of common health conditions quite low across both younger and older age cohorts
Health data shows relatively positive outcomes for Cambridge residents. Prevalence of common health conditions is quite low across both younger and older age cohorts.
Approximately 55% (~4,975 people) have private health cover, compared to 51.4% across Greater Hobart. The most common medical conditions are arthritis and mental health issues, affecting 9.9 and 7.6% of residents respectively. 68.7% declare themselves completely clear of medical ailments, compared to 64.2% across Greater Hobart. As of 2016, 22.2% (1,993 people) are aged 65 and over. Health outcomes among seniors are particularly strong, performing better than the general population in health metrics.
Frequently Asked Questions - Health
Cultural Diversity
Cambridge is considerably less culturally diverse than average when assessed alongside AreaSearch's national rankings for language and cultural background related metrics
Cambridge's cultural diversity was found to be below average, with 88.6% of its population born in Australia, 94.2% being citizens, and 96.4% speaking English only at home. The predominant religion in Cambridge is Christianity, comprising 46.1% of the population, compared to 42.6% across Greater Hobart. Regarding ancestry (country of birth of parents), the top three represented groups are English (36.5%), Australian (30.4%), and Irish (8.8%).
Notably, Dutch ethnicity is overrepresented in Cambridge at 1.5%, compared to 1.3% regionally, Welsh at 0.6% versus 0.5%, and Polish at 0.7%.
Frequently Asked Questions - Diversity
Age
Cambridge hosts an older demographic, ranking in the top quartile nationwide
The median age in Cambridge is 43 years, which is significantly higher than Greater Hobart's average of 39 years and Australia's median age of 38 years. Compared to Greater Hobart, Cambridge has a higher proportion of residents aged 55-64 (14.1%) but fewer residents aged 25-34 (7.7%). According to the 2021 Census, the 75 to 84 age group increased from 5.3% to 7.3%, and the 65 to 74 cohort grew from 11.8% to 13.3%. Conversely, the 25 to 34 age group decreased from 9.9% to 7.7%, and the 55 to 64 group fell from 15.7% to 14.1%. By 2041, demographic projections indicate significant shifts in Cambridge's age structure. The 45 to 54 age group is expected to grow by 44%, reaching 1,727 people from 1,203. Notably, the combined 65+ age groups will account for 58% of total population growth, reflecting the area's aging demographic profile. In contrast, both the 15 to 24 and 0 to 4 age groups are projected to decrease in number.
