Chart Color Schemes
This analysis uses ABS Statistical Areas Level 2 (SA2) boundaries, which can materially differ from Suburbs and Localities (SAL) even when sharing similar names.
SA2 boundaries are defined by the Australian Bureau of Statistics and are designed to represent communities for statistical reporting (e.g., census and ERP).
Suburbs and Localities (SAL) represent commonly-used suburb/locality names (postal-style areas) and may use different geographic boundaries. For comprehensive analysis, consider reviewing both boundary types if available.
est. as @ -- *
ABS ERP | -- people | --
2021 Census | -- people
Sales Activity
Curious about local property values? Filter the chart to assess the volume and appreciation (including resales) trends and regional comparisons, or scroll to the map below view this information at an individual property level.
Find a Recent Sale
Sales Detail
Population
Yarrabilba lies within the top 10% of areas nationally in terms of population growth performance according to AreaSearch analysis of short and medium-term trends
Yarrabilba's population is approximately 16,037 as of November 2025. This figure represents an increase of 5,331 people since the 2021 Census, which reported a population of 10,706 people. The growth from June 2024's estimated resident population of 14,642, combined with an additional 1,855 validated new addresses since the Census date, accounts for this increase. This results in a density ratio of 410 persons per square kilometer, providing significant space per person and potential room for further development. Yarrabilba's population growth rate of 49.8% since the 2021 census exceeded both national (8.9%) and state averages, positioning it as a growth leader in the region. Interstate migration contributed approximately 73.8% of overall population gains during recent periods, with all drivers including natural growth and overseas migration being positive factors.
AreaSearch adopts ABS/Geoscience Australia projections for each SA2 area, released in 2024 using 2022 as the base year. For areas not covered by this data and years post-2032, Queensland State Government's SA2 area projections are adopted, released in 2023 based on 2021 data. However, these state projections do not provide age category splits, so AreaSearch applies proportional growth weightings in line with the ABS Greater Capital Region projections for each age cohort, released in 2023 using 2022 data as the base year. Looking ahead, demographic trends predict exceptional growth over the period to 2041, with the area expected to increase by 11,756 persons based on the latest annual ERP population numbers, reflecting a gain of 64.6% in total over the 17 years.
Frequently Asked Questions - Population
Development
The level of residential development activity in Yarrabilba was found to be higher than 90% of real estate markets across the country
Yarrabilba averaged approximately 405 new dwelling approvals annually over the past five financial years, totalling 2,027 homes. As of FY-26145 approvals have been recorded. Each year, an average of 2.8 new residents were gained per dwelling built between FY-21 and FY-25, indicating strong demand that supports property values. New homes are constructed at an average cost of $275,000, aligning with broader regional development trends.
This financial year has seen $19.6 million in commercial approvals, demonstrating moderate levels of commercial development. Compared to Greater Brisbane, Yarrabilba's construction levels are 48.0% higher per person over the past five years, offering reasonable buyer options while sustaining existing property demand. This rate is above the national average, reflecting developers' confidence in the area. Recent construction comprises 95.0% standalone homes and 5.0% medium to high-density housing, maintaining Yarrabilba's traditional low-density character focused on family homes.
With around 31 people per dwelling approval, it exhibits characteristics of a growth area. According to AreaSearch's latest quarterly estimate, Yarrabilba is expected to grow by 10,360 residents by 2041. At current development rates, new housing supply should comfortably meet demand, providing good conditions for buyers and potentially supporting population growth beyond current projections.
Frequently Asked Questions - Development
Infrastructure
Yarrabilba has moderate levels of nearby infrastructure activity, ranking in the top 50% nationally
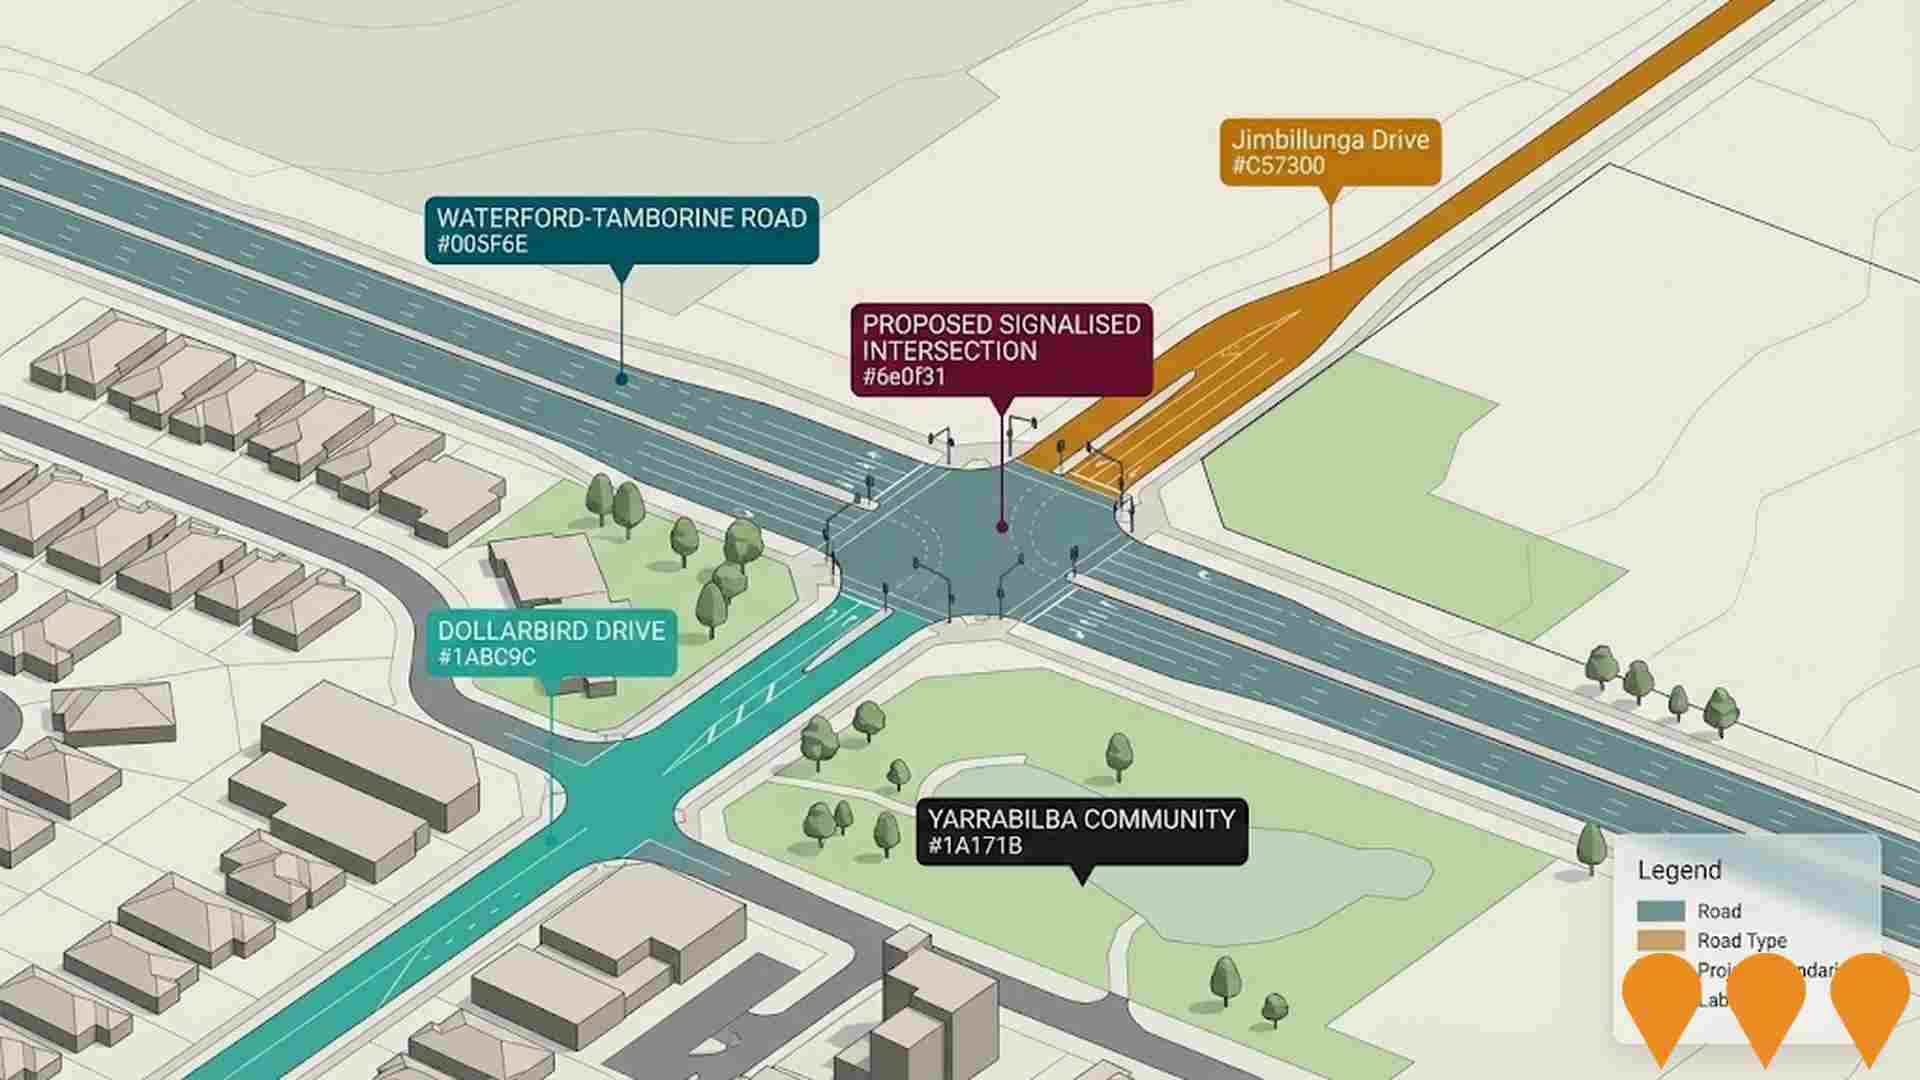
Area infrastructure changes significantly influence local performance. AreaSearch identified nine projects potentially impacting the area. Notable ones are Yarrabilba Dollarbird Drive Intersection, Yarrabilba Central, Yarrabilba Second Access & Road Network Upgrades, and The Buzz at Yarrabilba. Below lists those likely most relevant.
Professional plan users can use the search below to filter and access additional projects.
INFRASTRUCTURE SEARCH
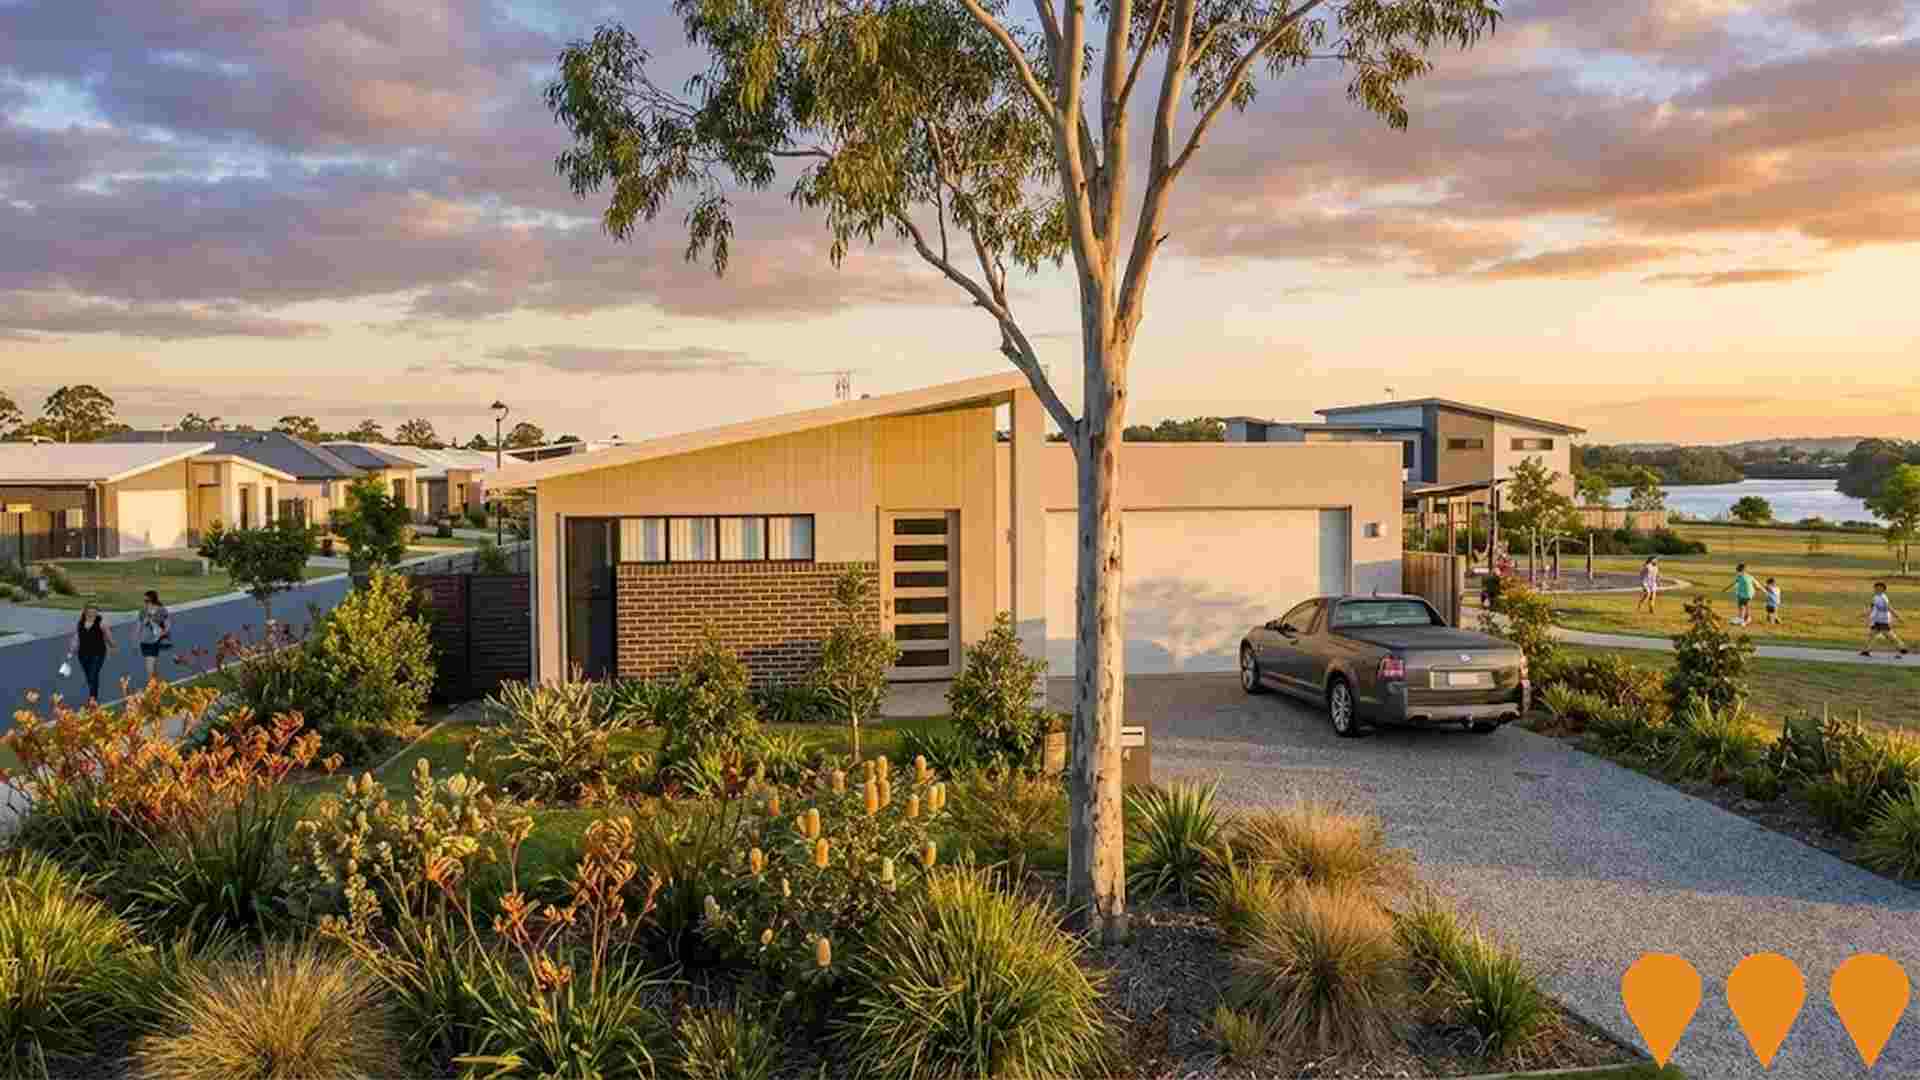
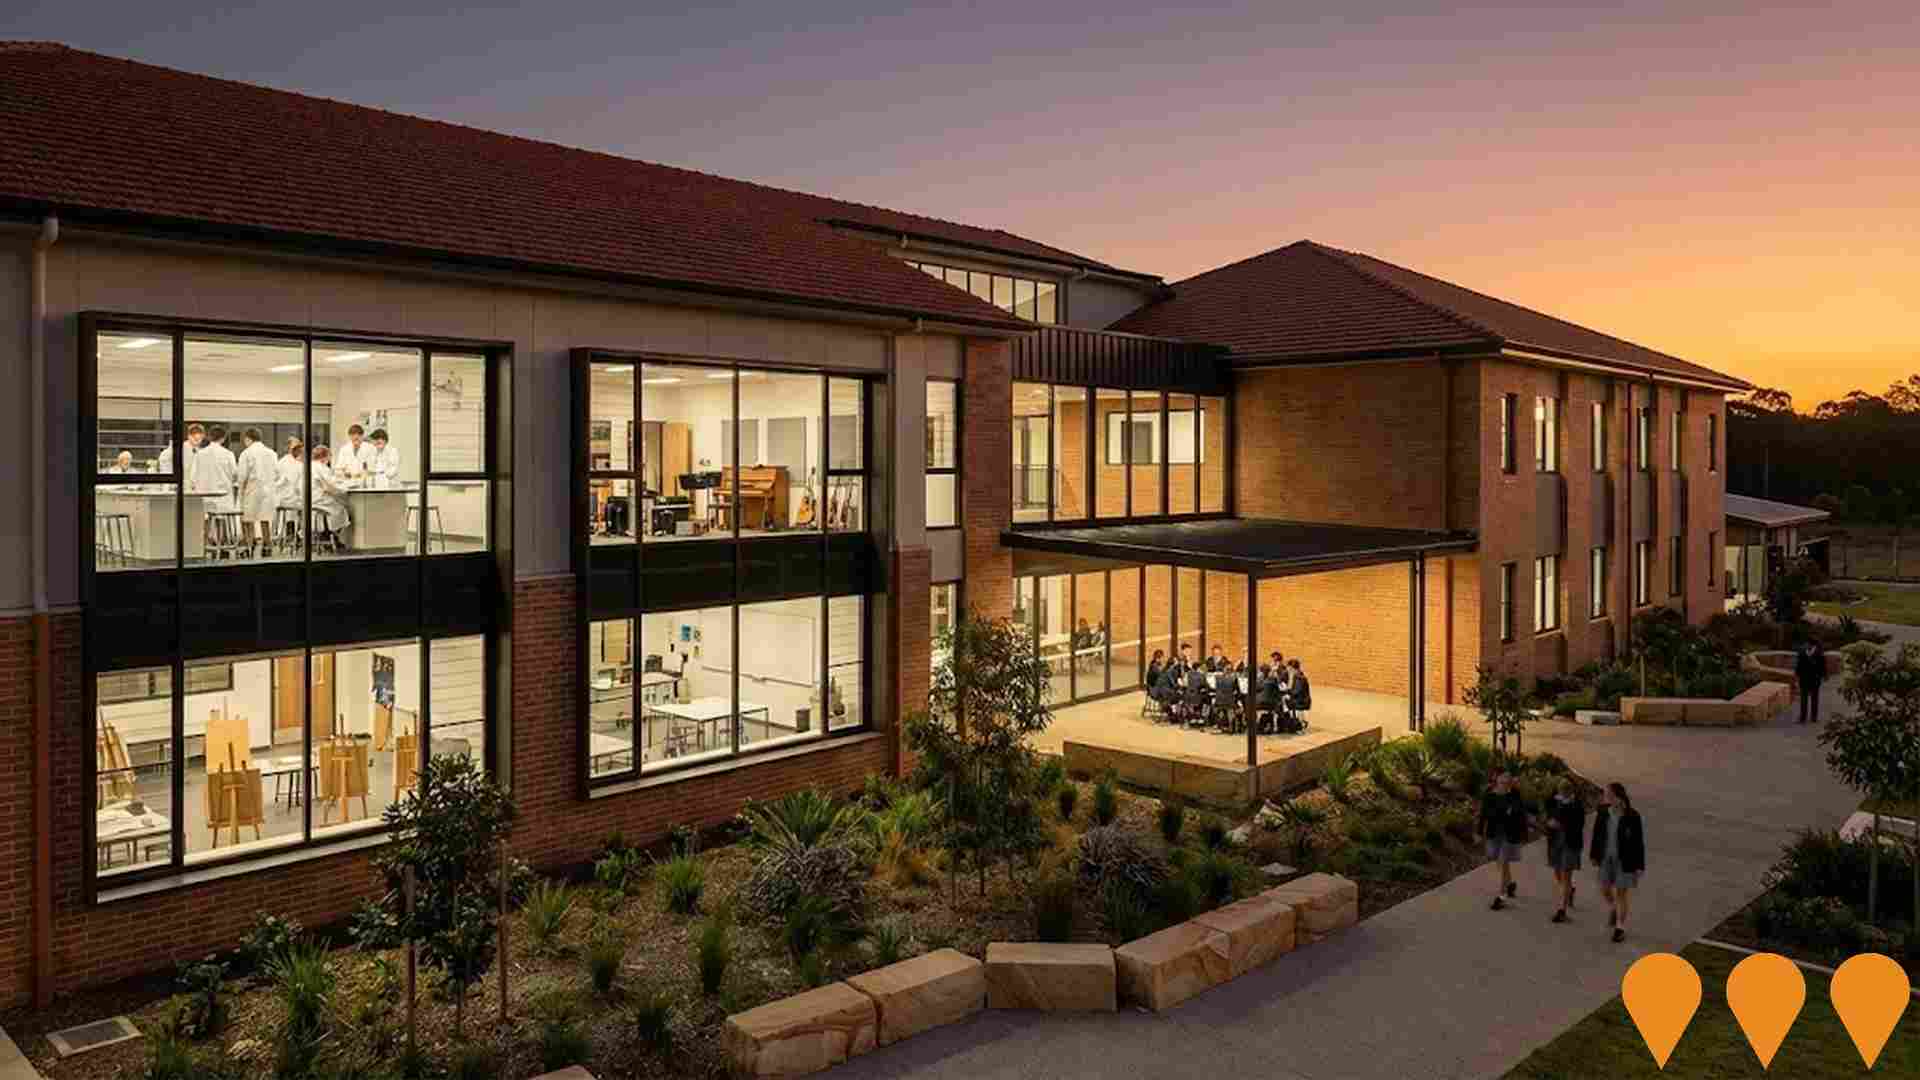
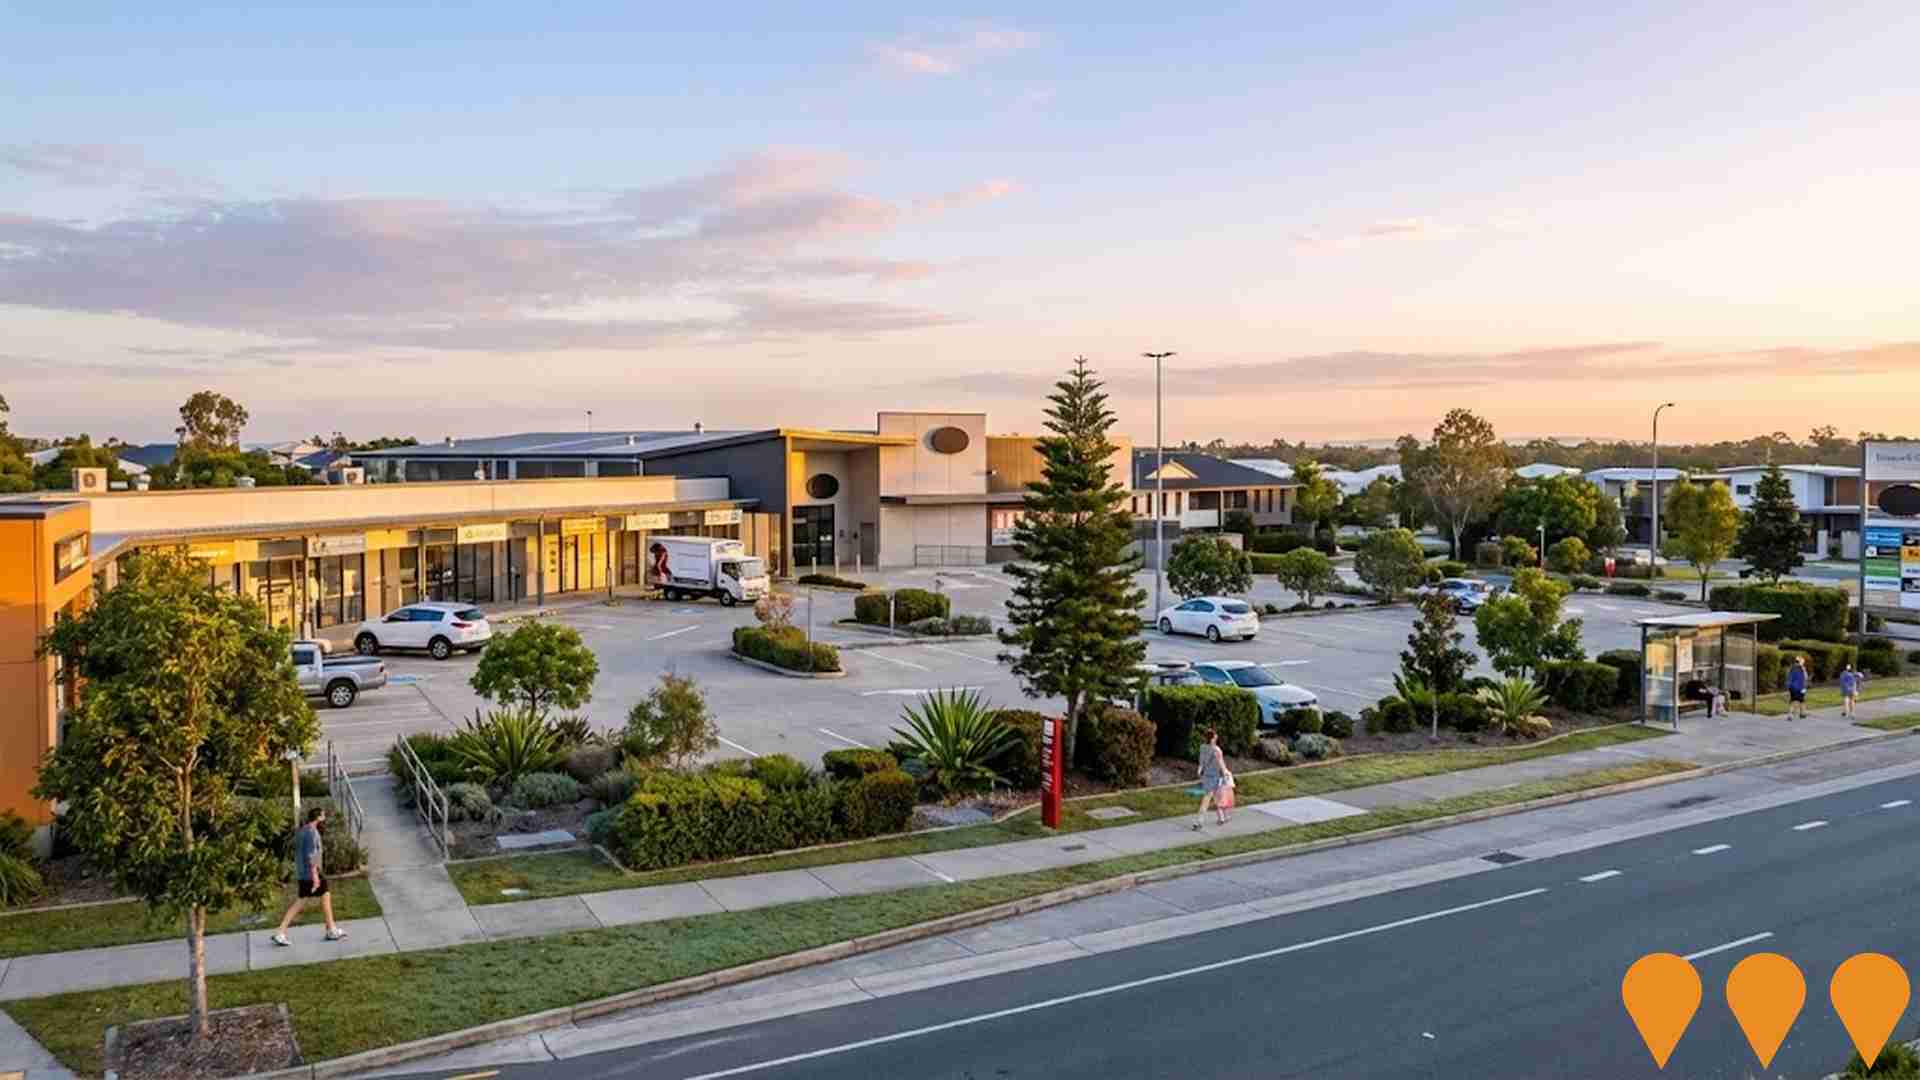
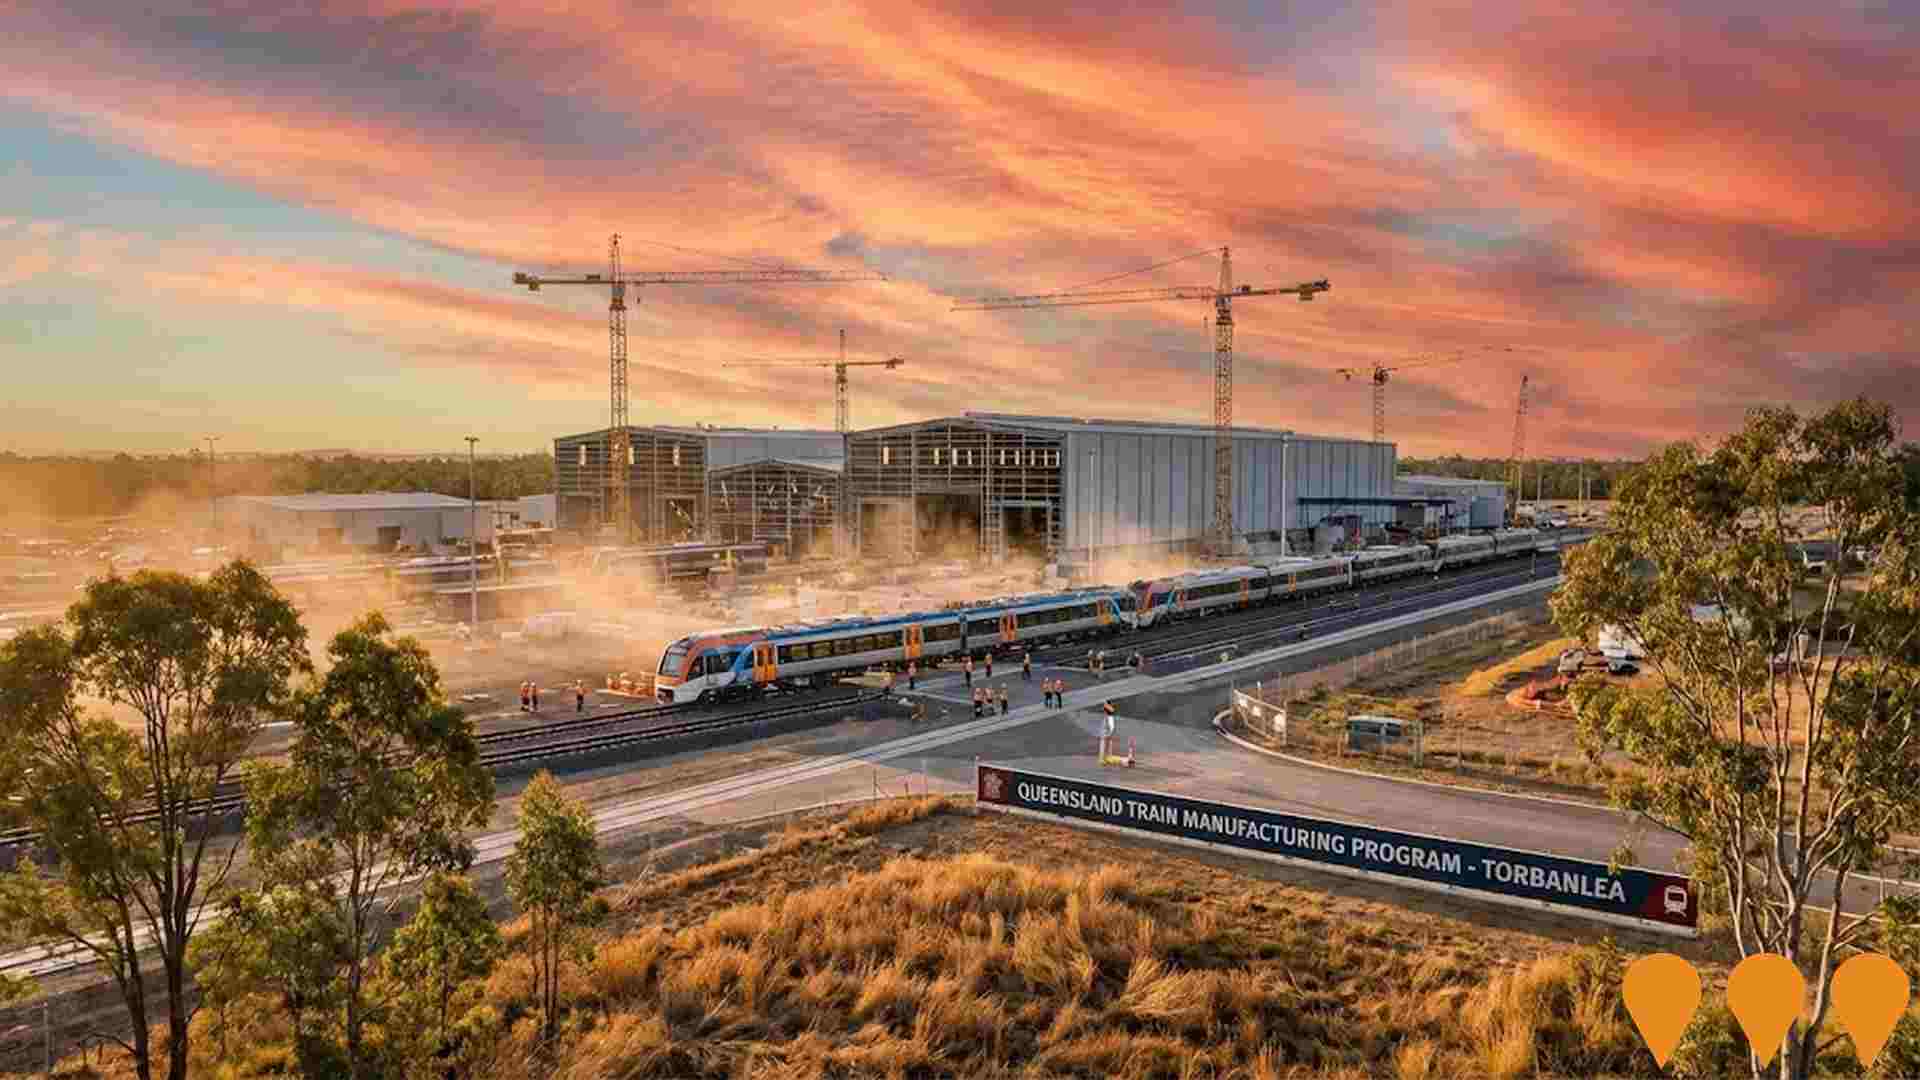
 Denotes AI-based impression for illustrative purposes only, not to be taken as definitive under any circumstances. Please follow links and conduct other investigations from the project's source for actual imagery. Developers and project owners wishing us to use original imagery please Contact Us and we will do so.
Frequently Asked Questions - Infrastructure
Yarrabilba Master Planned Community
Australia's first circular economy community located between Brisbane and Gold Coast. When complete, the Priority Development Area (PDA) will provide up to 20,000 dwellings to house a population of up to 50,000 people. It features over 20 parks, quality schools, community hubs, a future Town Centre, and is developed with sustainable design principles. The project is an ongoing, long-term development with various stages of construction for different components (e.g., residential stages, business park, road extensions, and sports parks). The project was acquired by Stockland Supalai Residential Communities Partnership Pty Ltd on November 29, 2024.
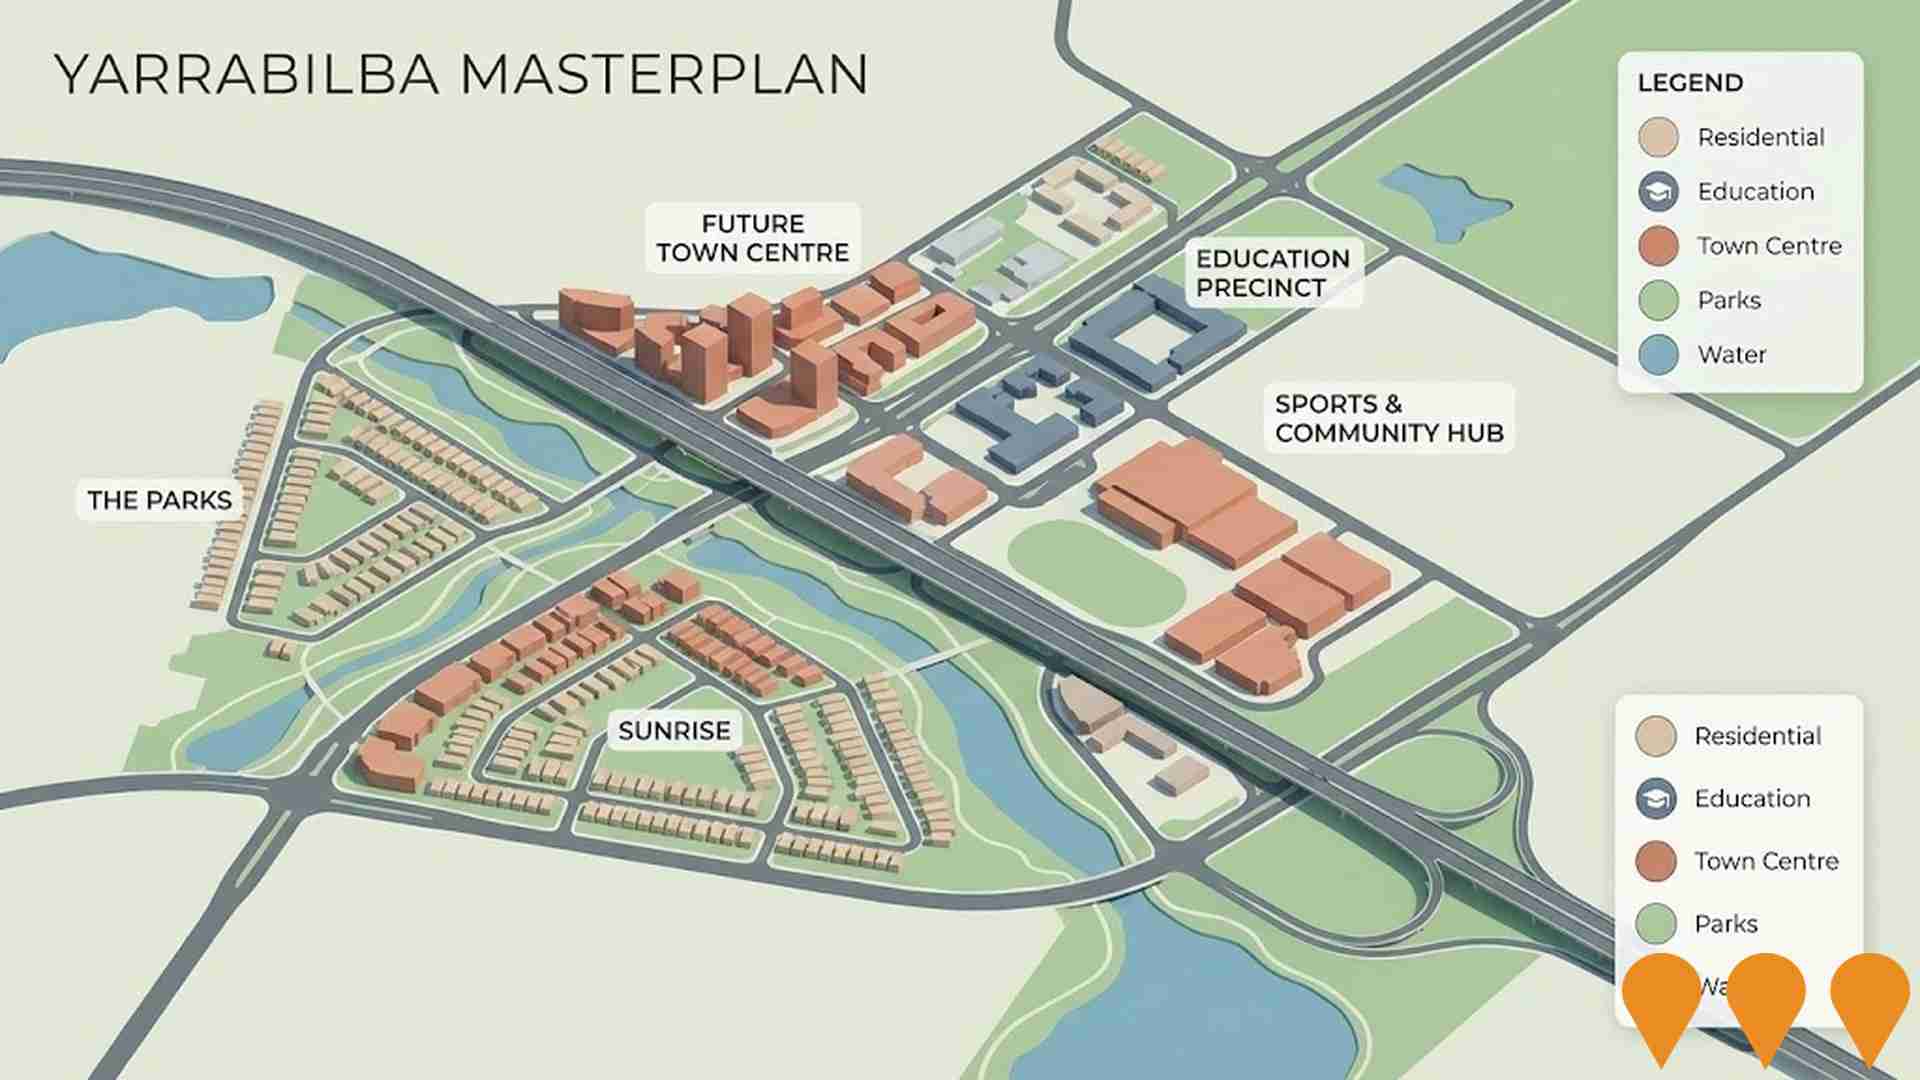
Yarrabilba Master Planned Community
Long-term master planned community development by Stockland (acquired from Lendlease in November 2024) spanning 2,222 hectares to accommodate up to 50,000 residents across 20,000 dwellings. The project is a Priority Development Area (PDA) under Economic Development Queensland and is expected to take 20-30 years for full development. Ongoing work includes: construction of the **Yarrabilba Business Park** (forecast opening Late 2026), **Jimbillunga Drive** road extension (forecast completion Mid 2027), and continued development in the **Ridgeline** precinct. Planning is underway for the major **Yarrabilba Town Centre** (Precinct 7), which is anticipated to provide approximately 215,000mý of commercial and retail space, up to 8 storeys of high-density development, and approximately 4,500 dwellings.
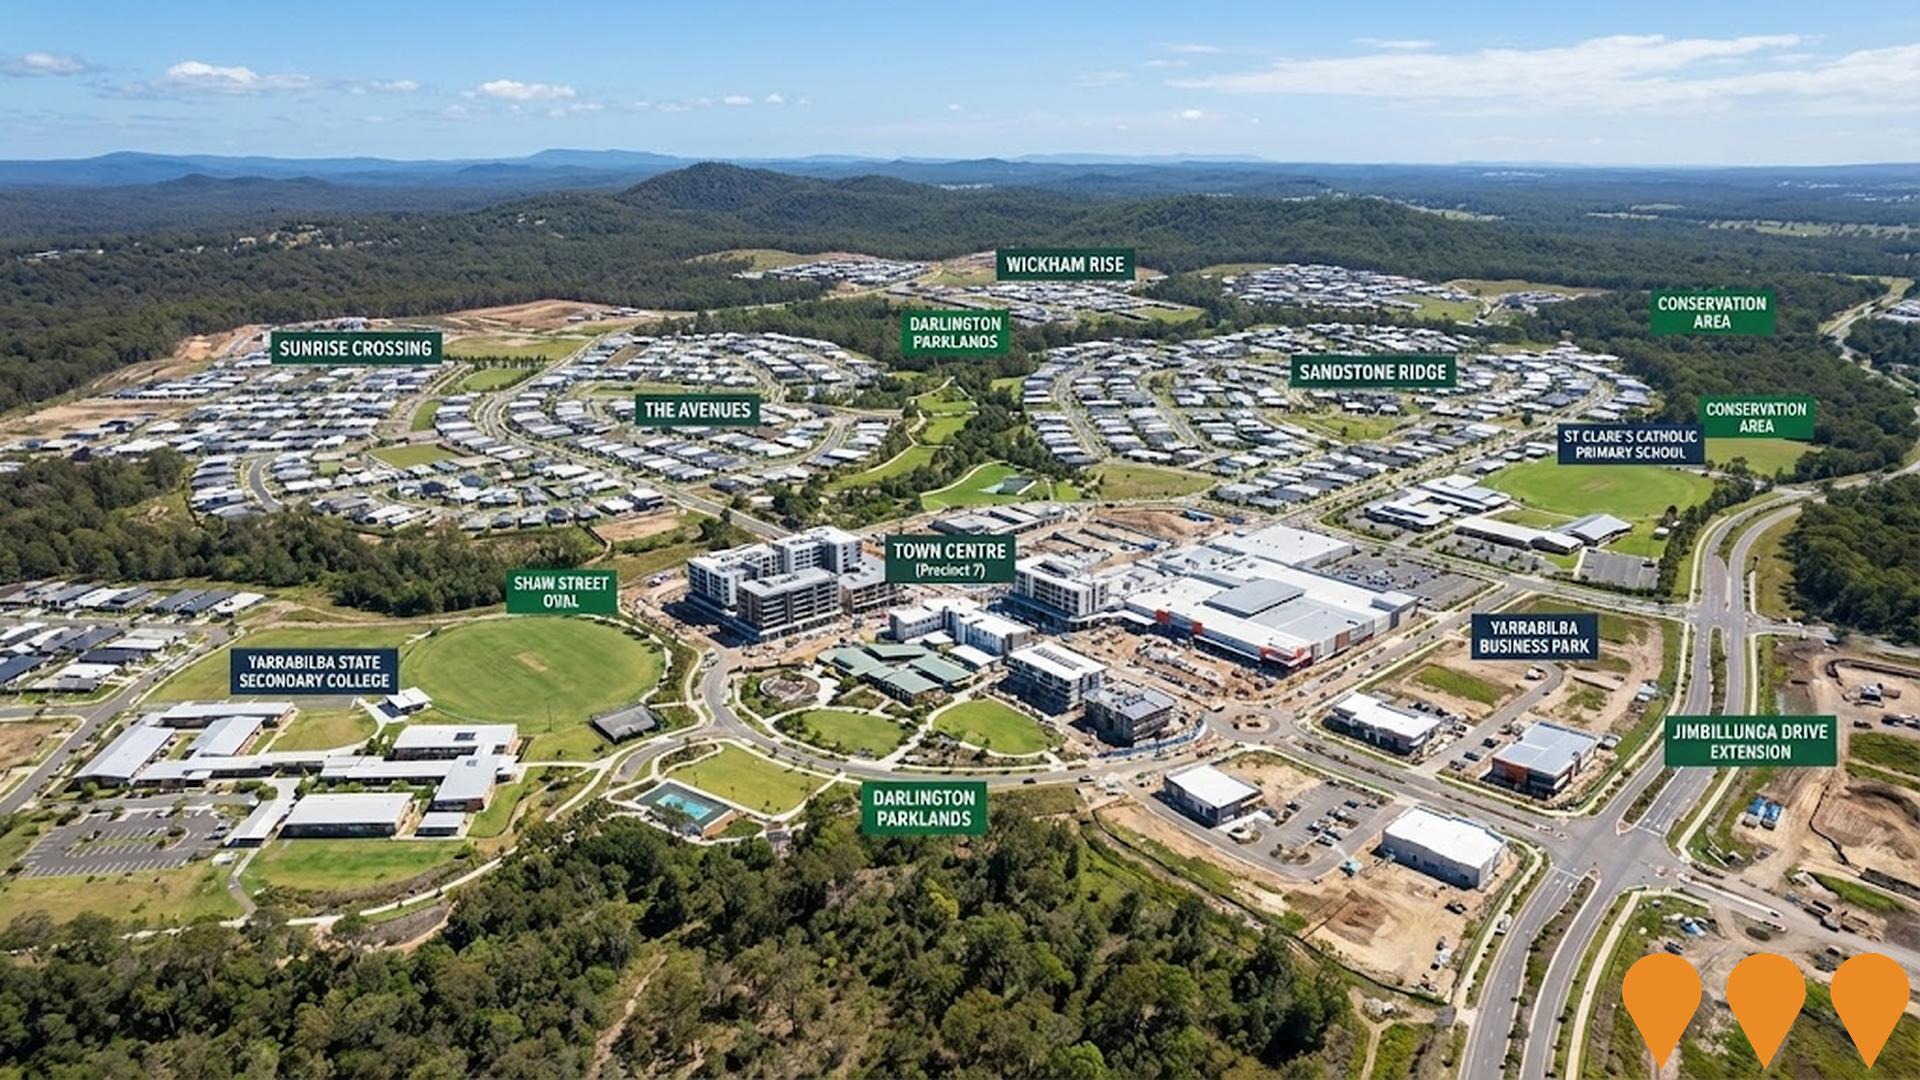
Yarrabilba and Greater Flagstone Infrastructure Funding Agreement
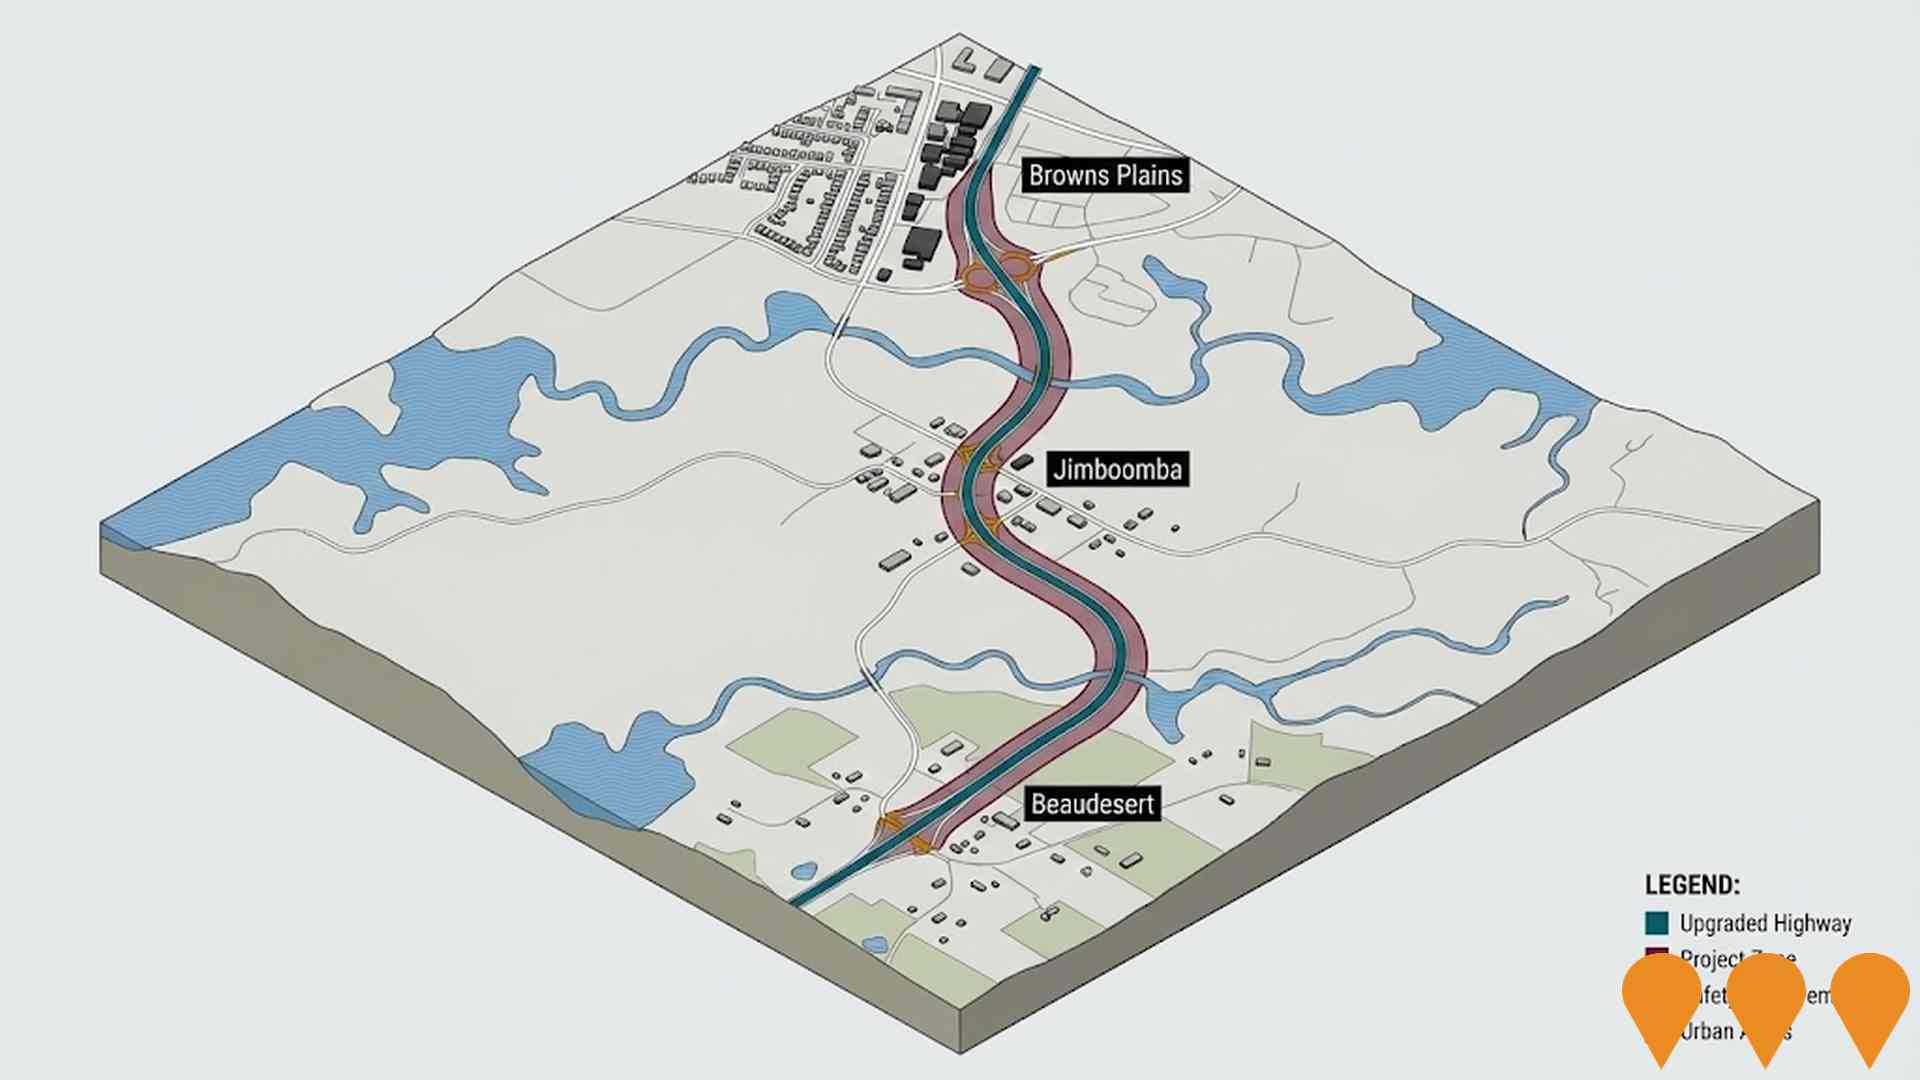
A $1.2 billion, 45-year infrastructure funding and delivery agreement signed in 2019 between Economic Development Queensland (EDQ), Logan City Council and nine private developers to deliver trunk roads, water, sewer, parks and community facilities supporting the Yarrabilba and Greater Flagstone Priority Development Areas. Multiple packages are currently under construction or completed, with works continuing progressively until approximately 2060-2065.
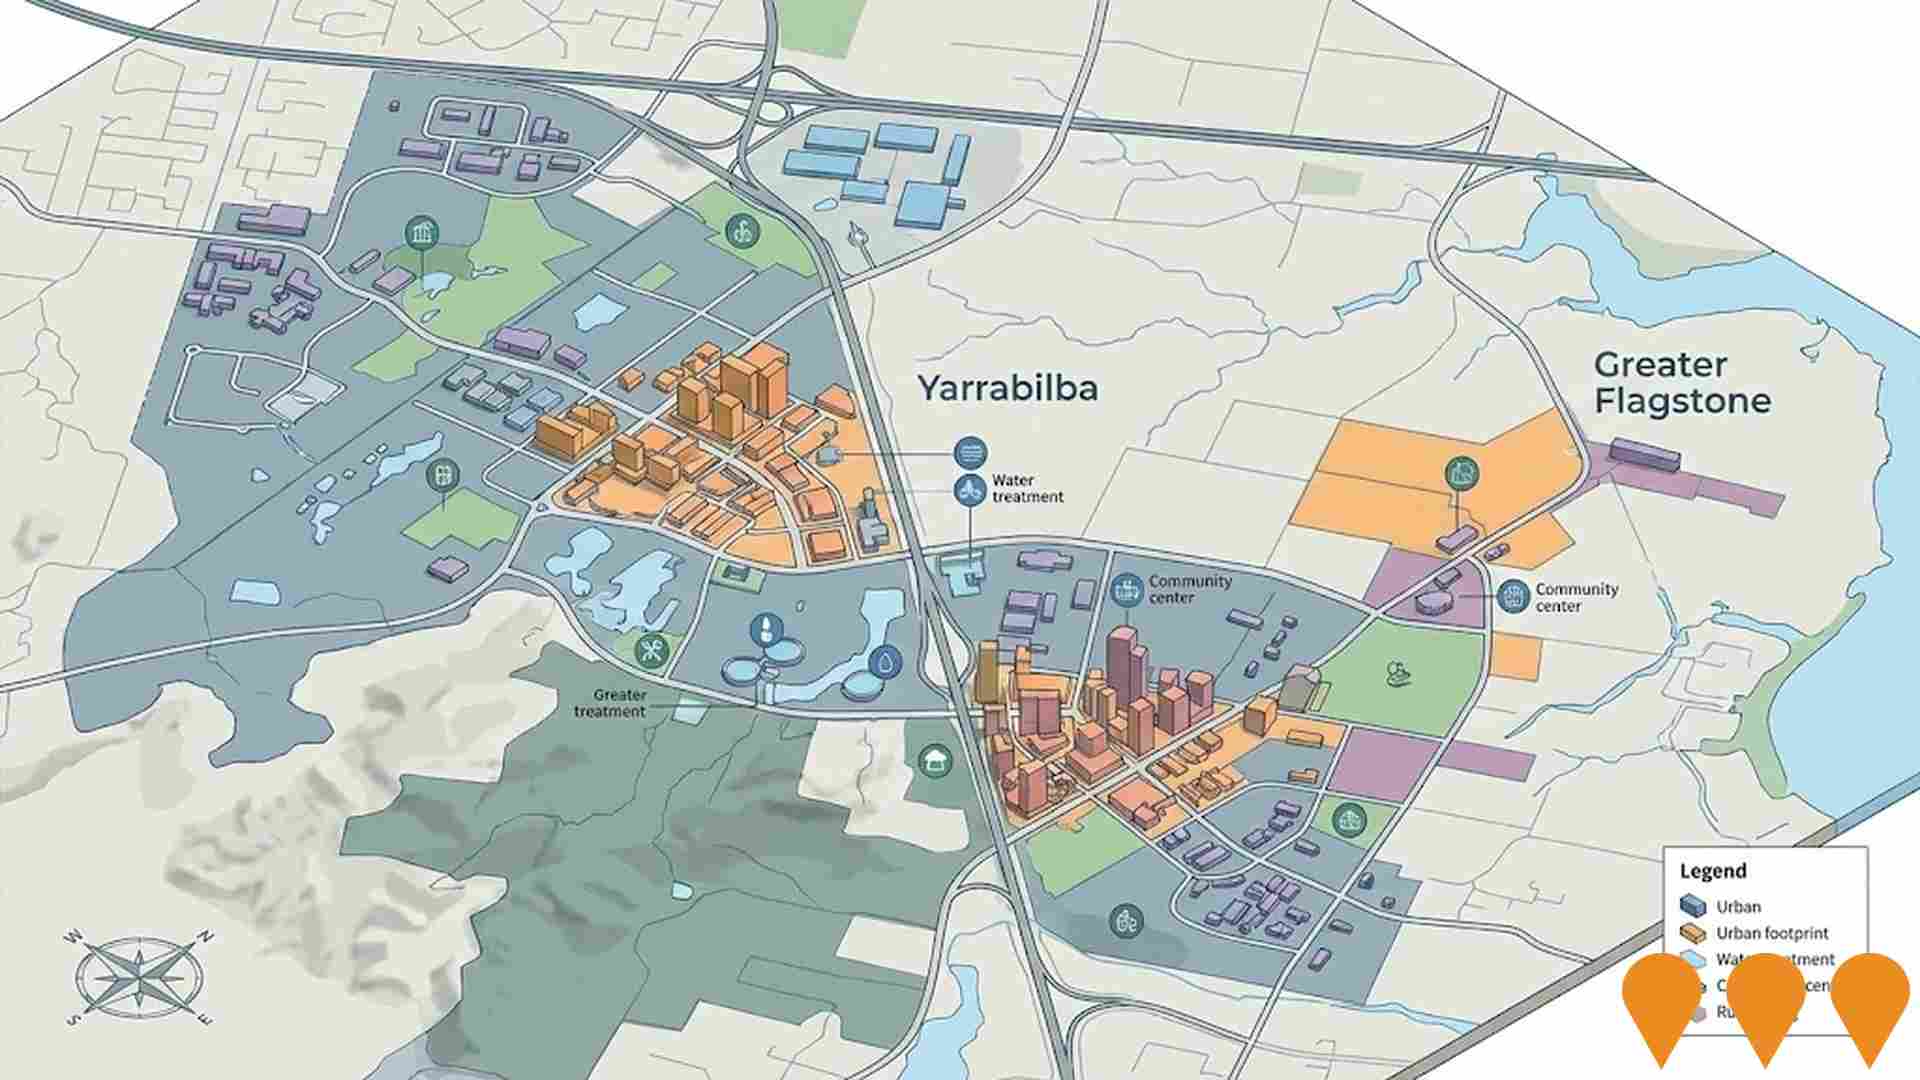
Greater Flagstone Priority Development Area
The Greater Flagstone Priority Development Area is a 7,188-hectare masterplanned community led by Peet Limited, planned to accommodate up to 138,000 residents and 51,500 dwellings over 30-40 years. It is currently in the construction phase, with a major new precinct of over 1,600 homes recently approved and earthworks/servicing for multiple stages ongoing. The ultimate plan includes a 126-hectare CBD, 330 hectares of green space, and major health, education, and business precincts.
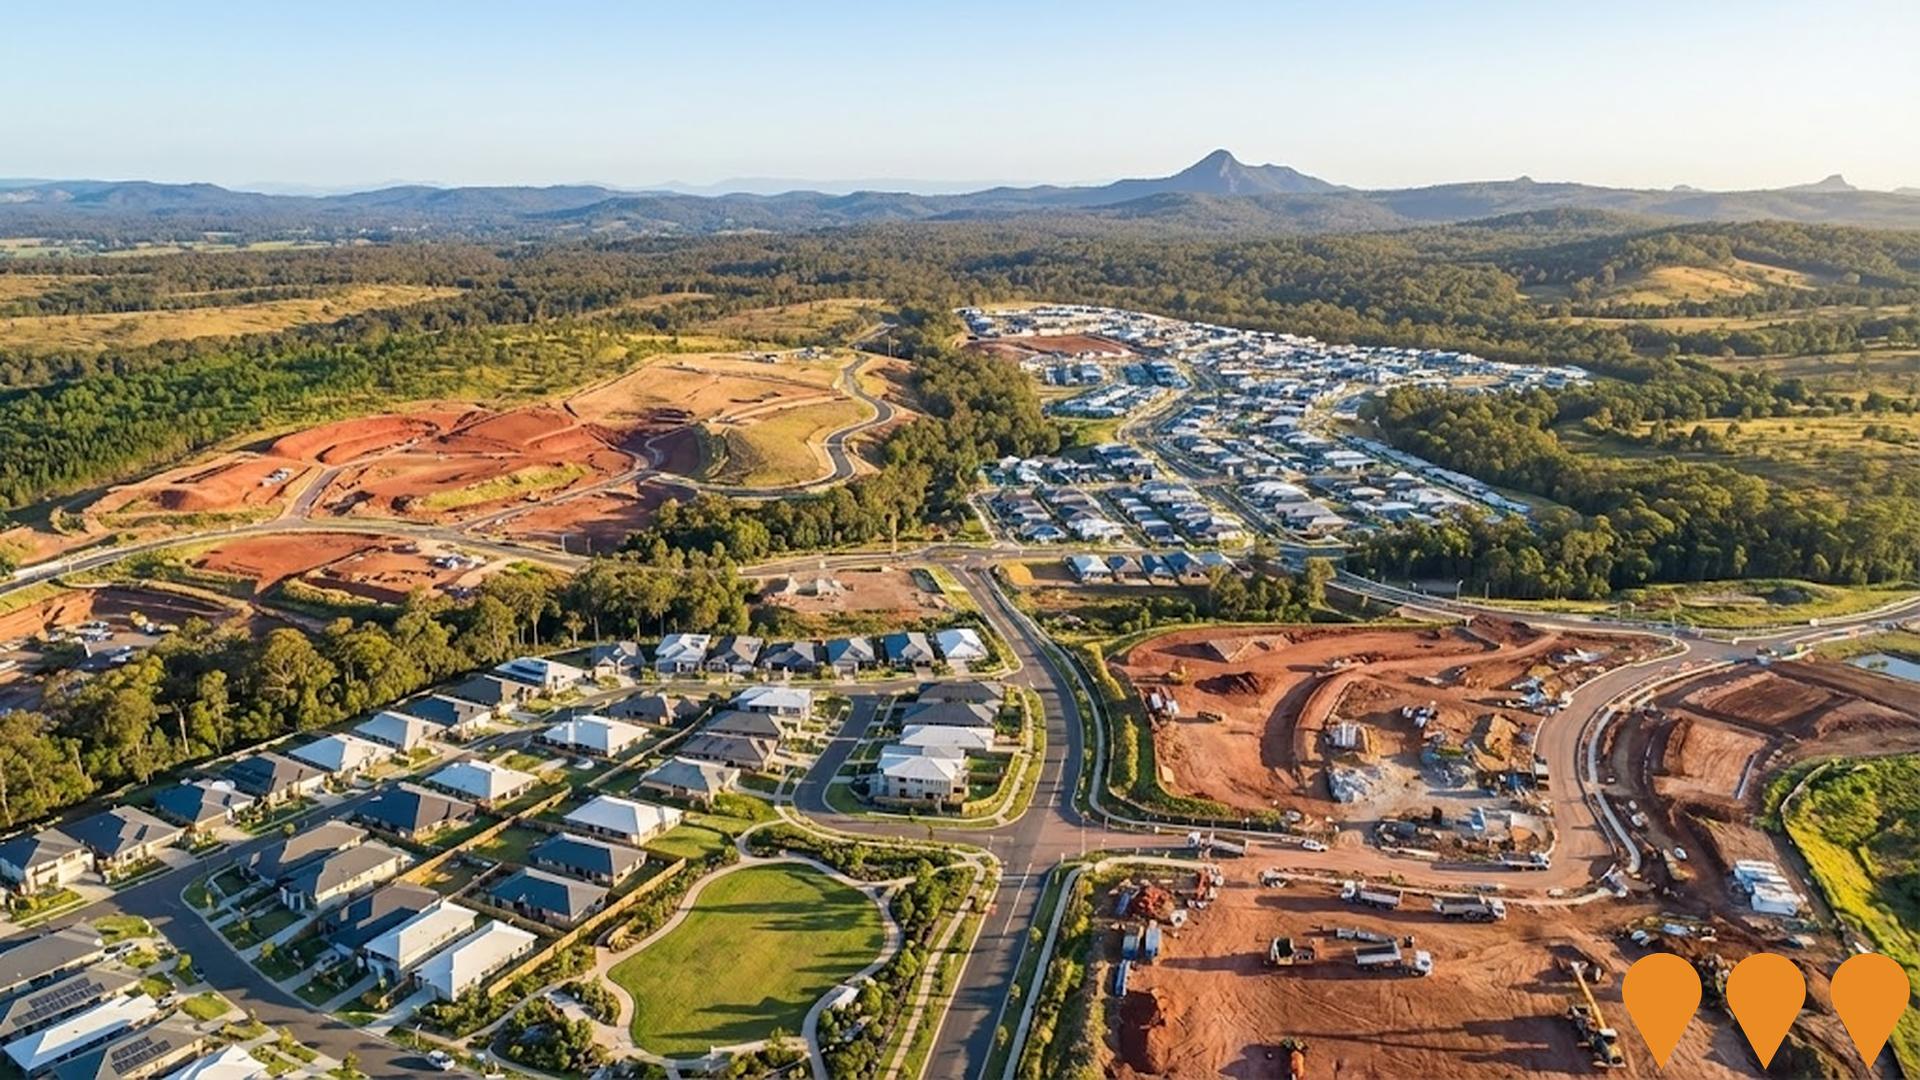
Yarrabilba Central
Yarrabilba Central is the future principal town centre for the Yarrabilba masterplanned community, planned to deliver a major mixed-use precinct with regional retail, commercial offices, civic and community facilities, entertainment, dining and higher-density residential uses. The centre will serve the ultimate population of approximately 45,000 residents across the Yarrabilba PDA and surrounding areas.
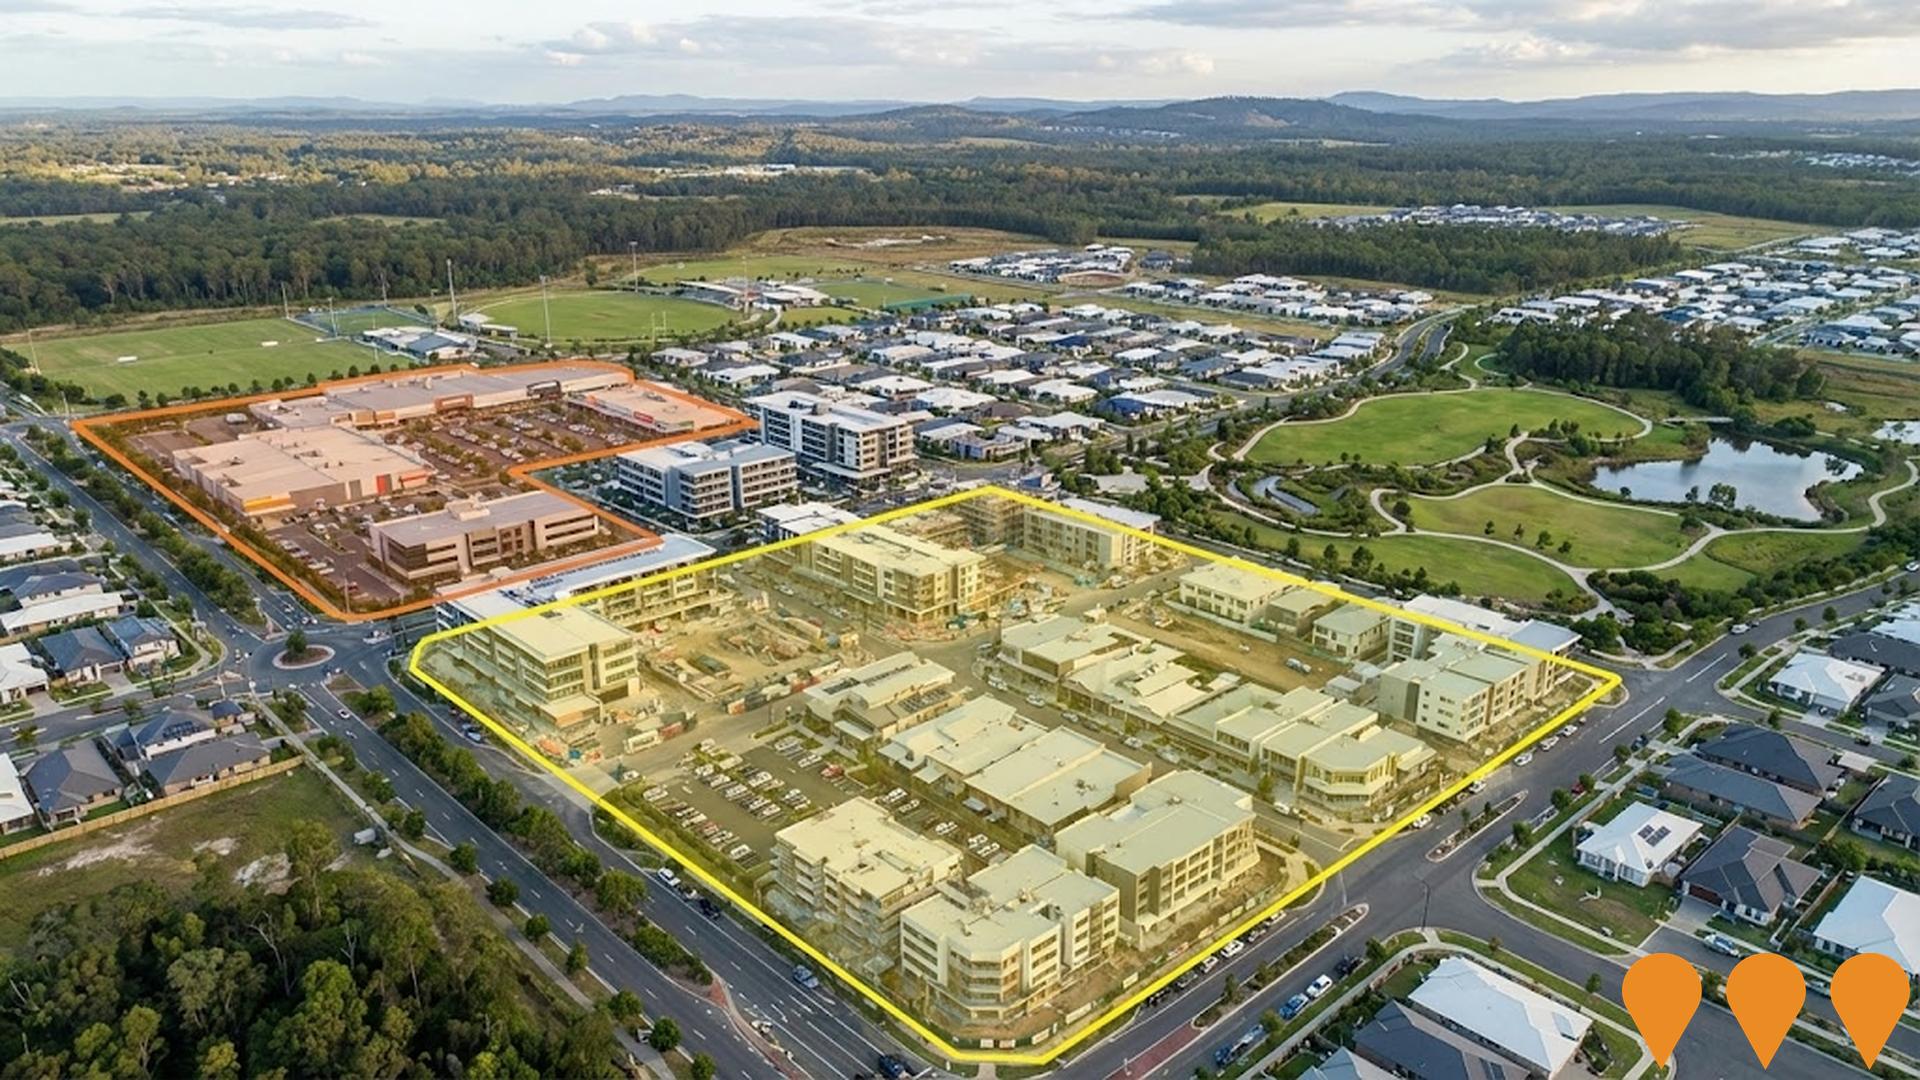
Yarrabilba Second Access & Road Network Upgrades
Construction of a new signalised intersection on Waterford-Tamborine Road to provide a second access point to Yarrabilba via Dollarbird Drive, including a 2.5km extension of Jimbillunga Drive and Wentland Avenue to improve connectivity and relieve congestion.
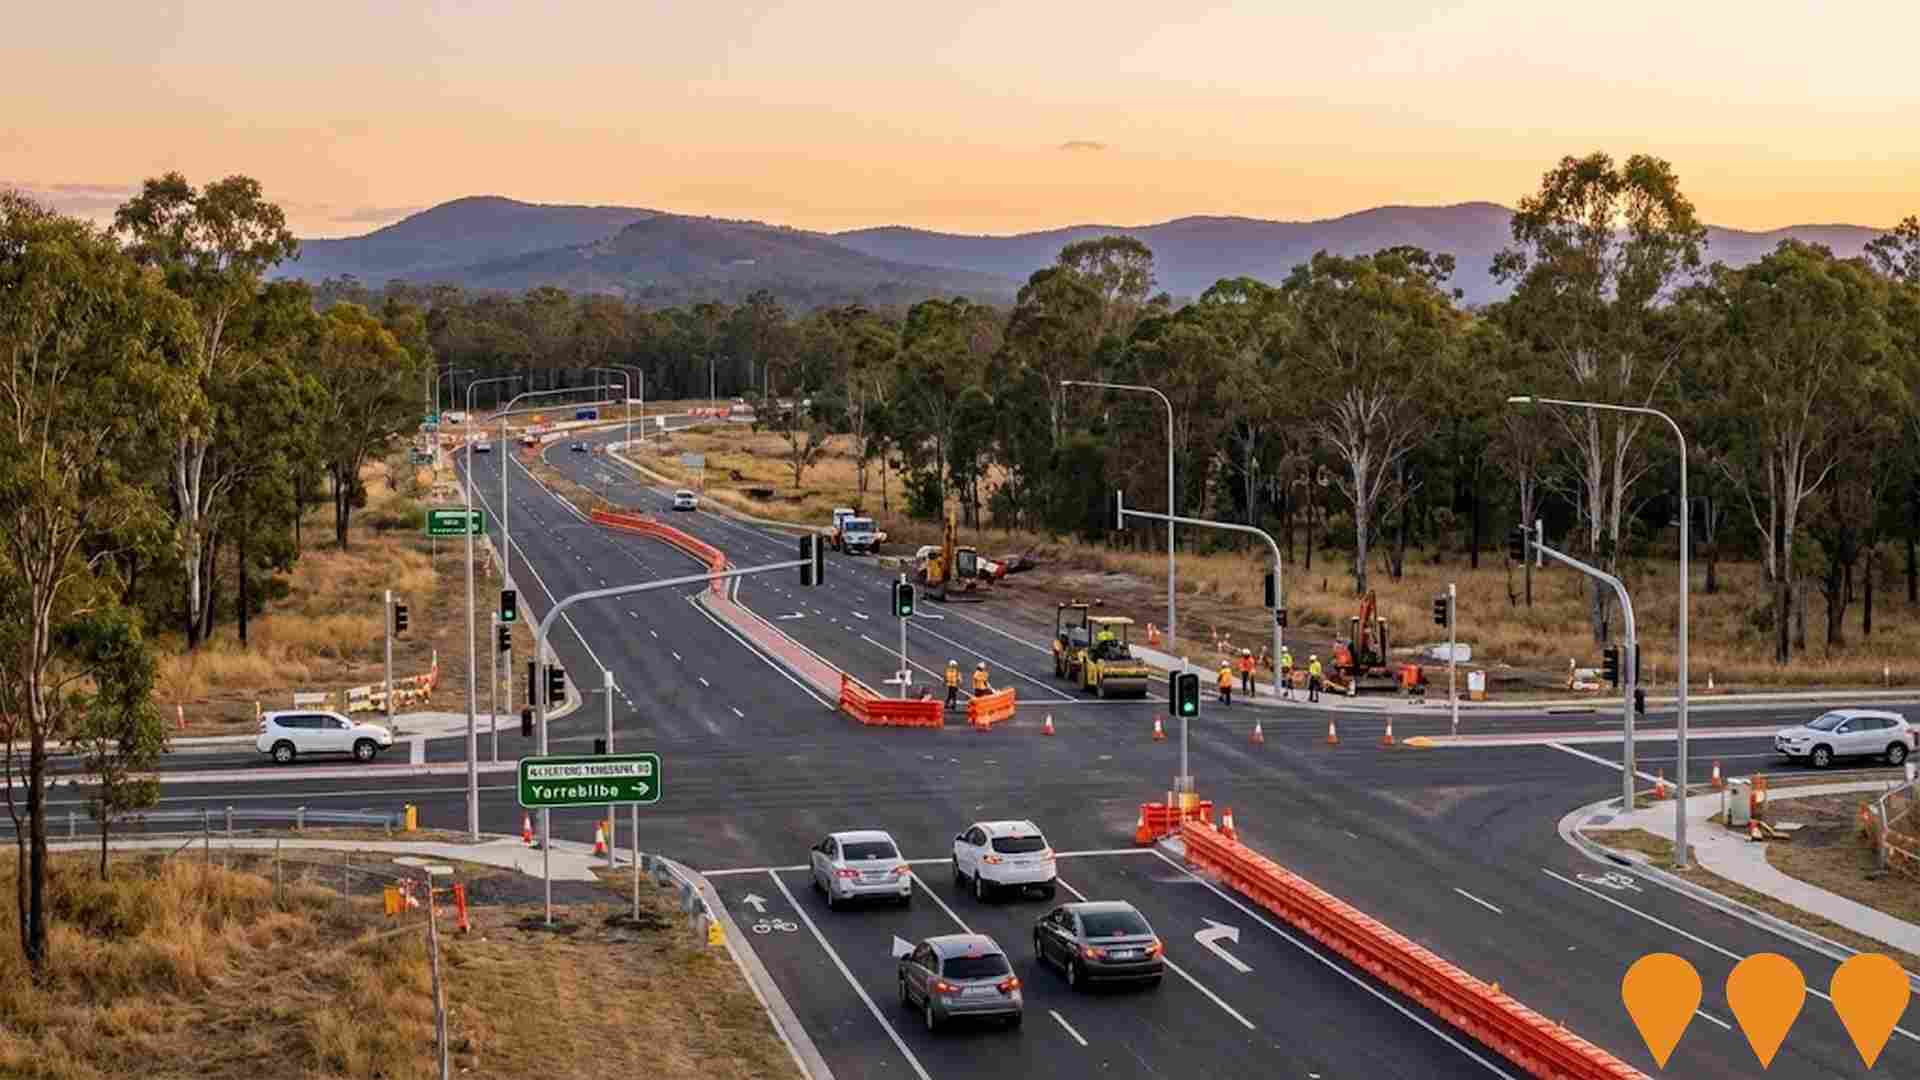
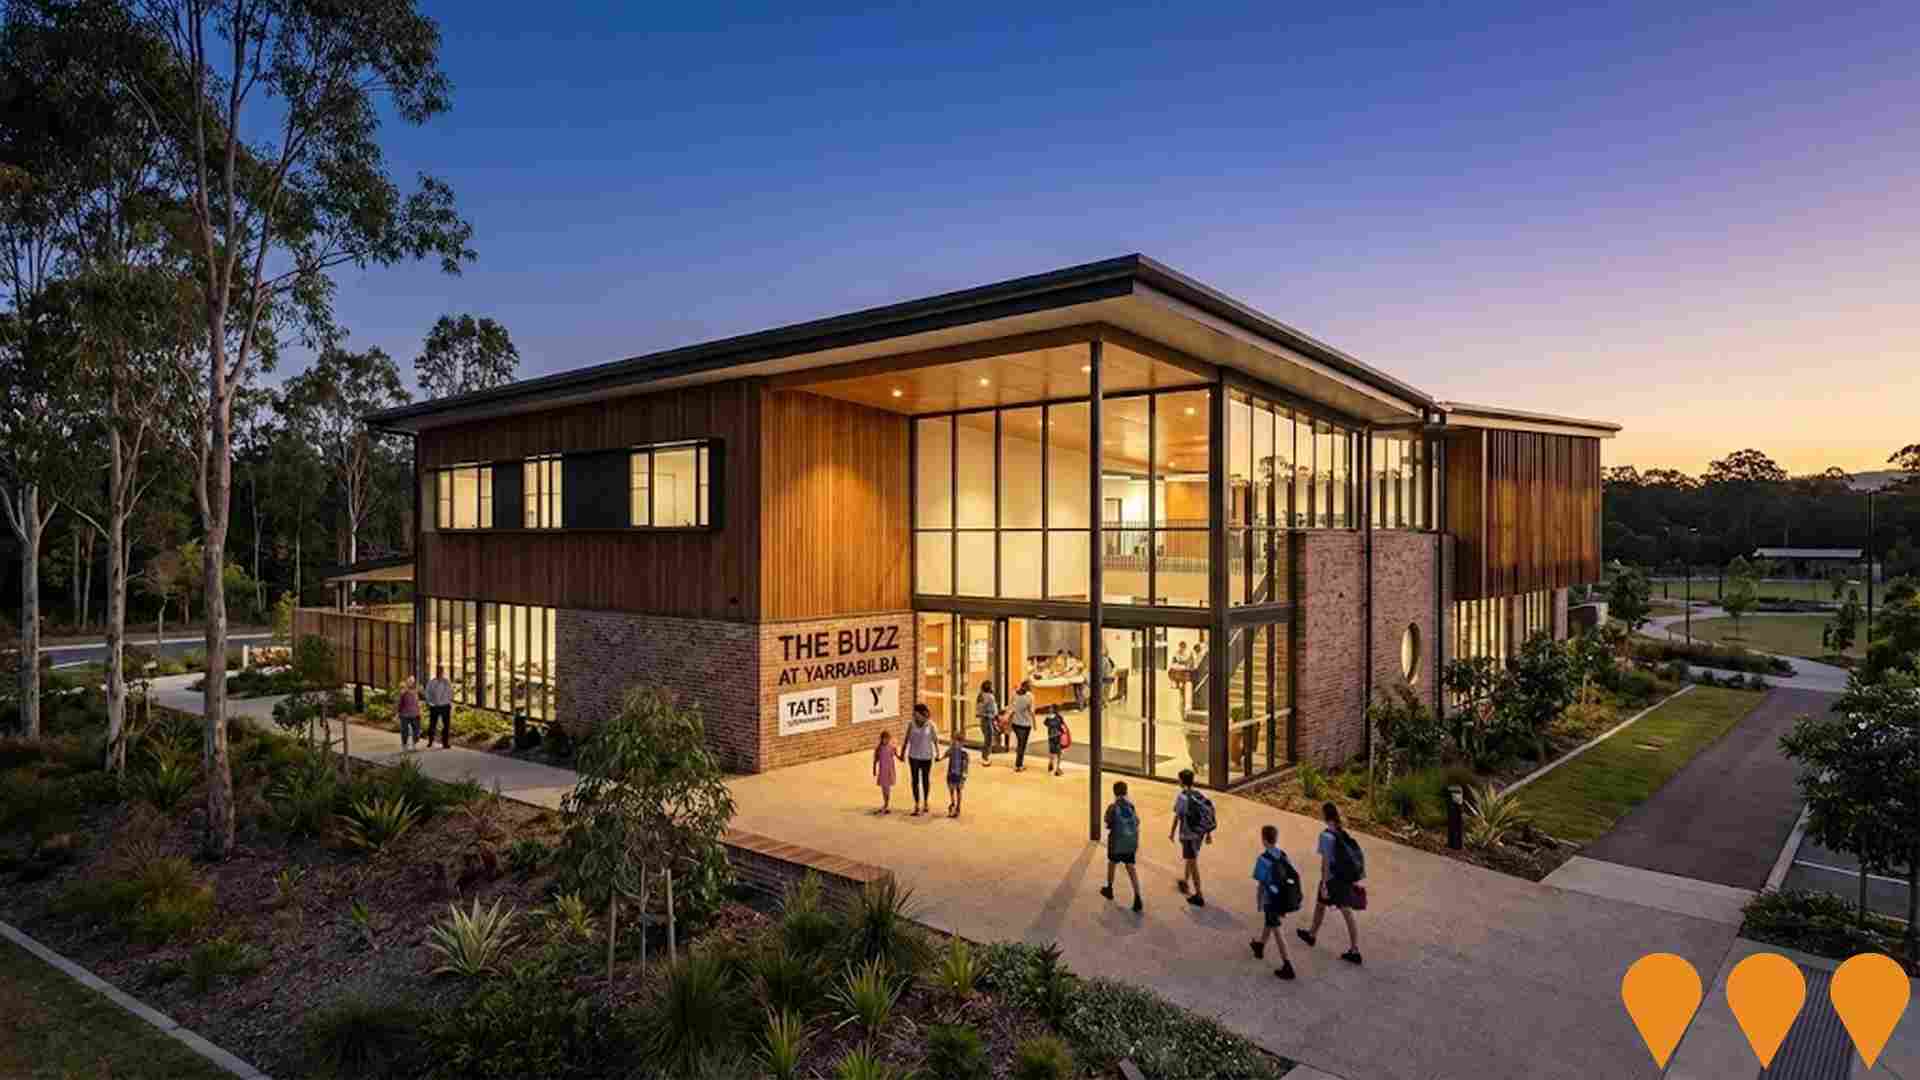
The Buzz at Yarrabilba
A $7.4 million community hub delivered through a partnership between the Queensland Government, Logan City Council, Brisbane Catholic Education, and Lendlease. It is a welcoming, inclusive space enabling the community to connect, learn, earn, and innovate, with facilities including community spaces, TAFE Queensland campus, youth areas, and employment services. Managed by YMCA Queensland.
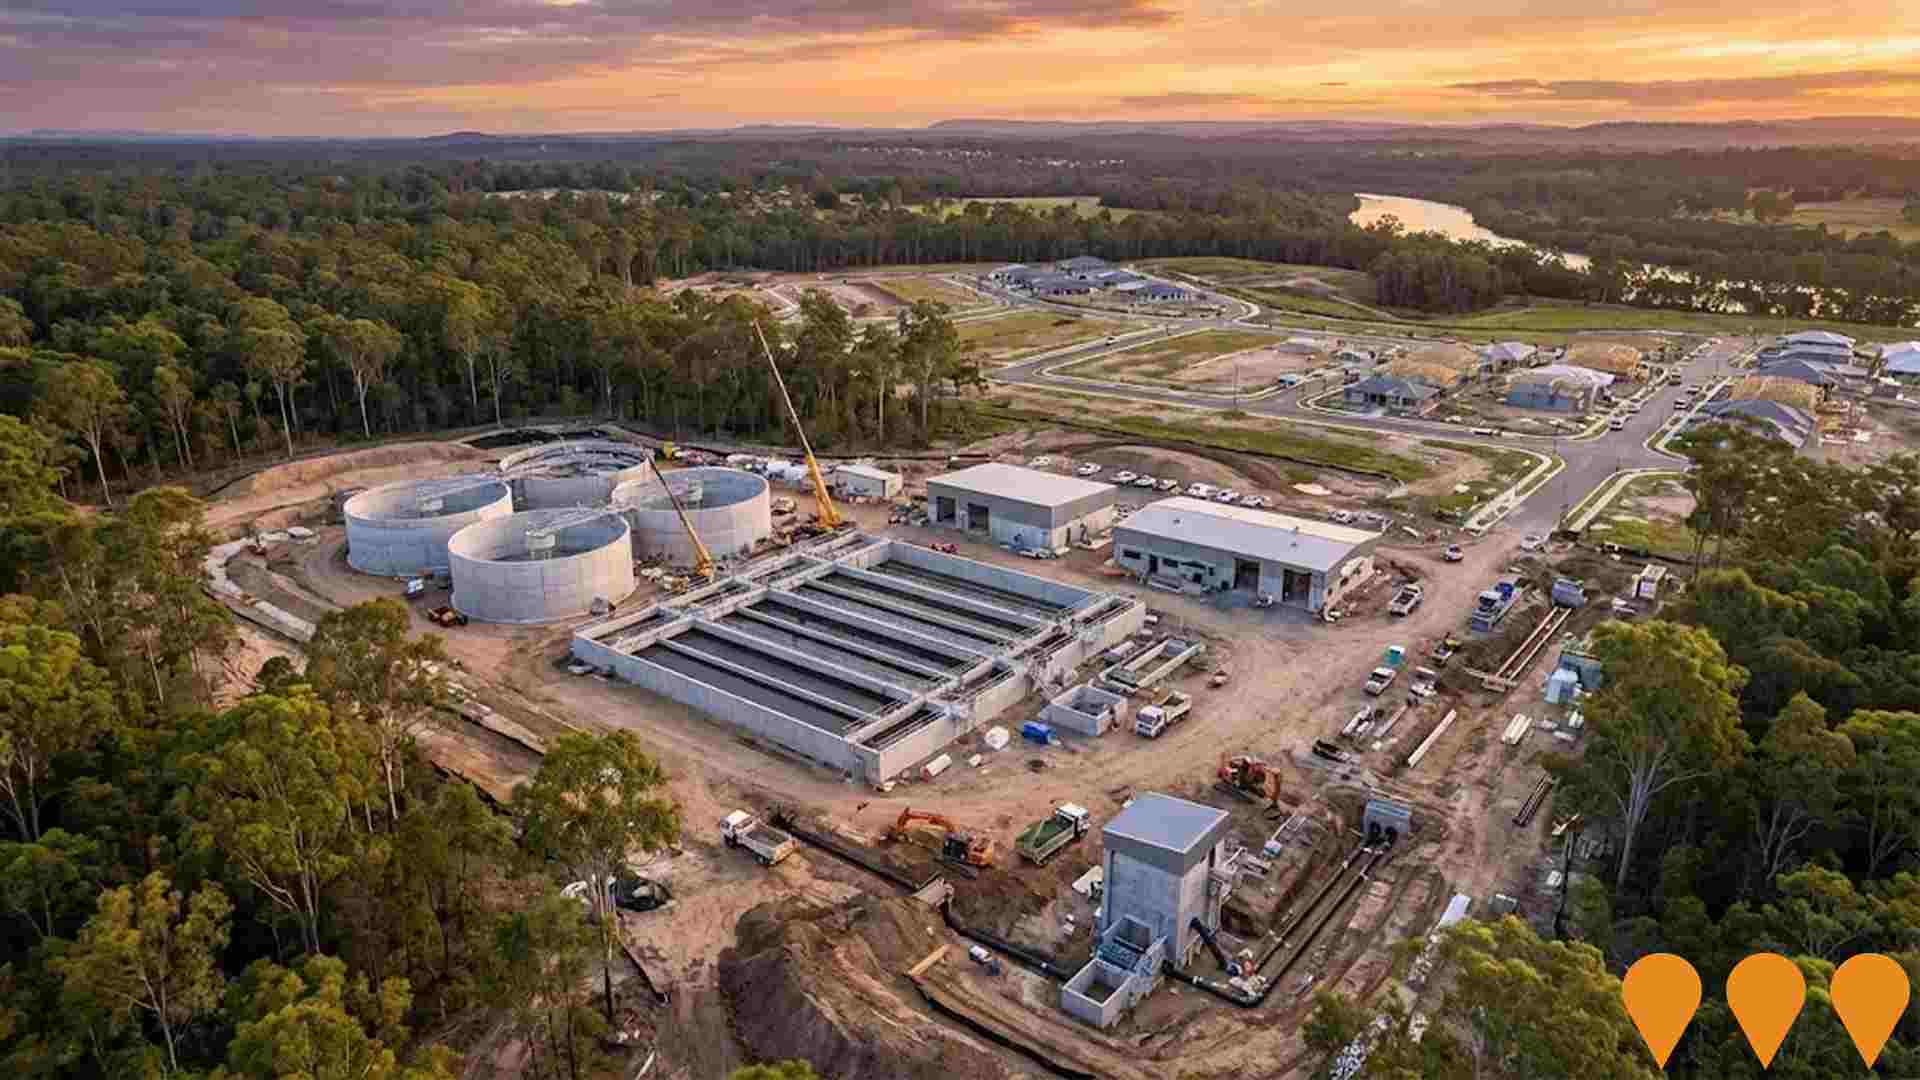
Chambers Flat Wastewater Treatment Plant
Logan Water is planning a new wastewater treatment plant at Chambers Flat to initially service around 60,000 equivalent persons and unlock more than 20,000 new homes across Yarrabilba, Park Ridge and Logan Village. The Queensland Government has committed $135.98 million towards the $334.53 million project under the Residential Activation Fund. Early enabling works include pipelines and pump stations, with staged connections targeted from 2028.
Employment
Employment performance in Yarrabilba has been broadly consistent with national averages
Yarrabilba's workforce is balanced across white and blue collar jobs. The construction sector stands out with a high representation, an unemployment rate of 4.4%, and estimated employment growth of 5.1% in the past year as of September 2025.
There are 7,374 residents employed while the unemployment rate is 0.4% higher than Greater Brisbane's rate of 4.0%. Workforce participation is at 67.5%, slightly above Greater Brisbane's 64.5%. Key industries include health care & social assistance, construction, and retail trade. Construction employment is particularly high, with a share 1.4 times the regional level.
Conversely, professional & technical jobs are lower at 4.0% compared to the regional average of 8.9%. Employment opportunities locally appear limited based on Census data comparisons. Between September 2024 and September 2025, employment levels increased by 5.1%, labour force grew by 3.8%, reducing unemployment by 1.2 percentage points. In comparison, Greater Brisbane saw employment growth of 3.8% and a 0.5 percentage point decrease in unemployment. Statewide, Queensland employment contracted slightly by 0.01% (losing 1,210 jobs) as of 25-Nov, with an unemployment rate of 4.2%. Nationally, the unemployment rate is 4.3%. Jobs and Skills Australia's national employment forecasts from May-25 project overall growth of 6.6% over five years and 13.7% over ten years, but industry-specific projections vary significantly. Applying these projections to Yarrabilba's employment mix suggests local employment should increase by 6.1% over five years and 13.0% over ten years, though this is a simplified extrapolation for illustrative purposes only.
Frequently Asked Questions - Employment
Income
Income levels sit below national averages according to AreaSearch assessment
The Yarrabilba SA2 had a median taxpayer income of $50,427 and an average of $56,403 in the financial year 2022, according to postcode level ATO data aggregated by AreaSearch. This was below the national average, with Greater Brisbane having a median income of $55,645 and an average income of $70,520. By September 2025, based on Wage Price Index growth of 13.99%, estimated incomes would be approximately $57,482 (median) and $64,294 (average). In Yarrabilba, household, family, and personal incomes ranked modestly between the 41st and 52nd percentiles in 2021 Census figures. Income distribution showed that 42.2% of locals (6,767 people) fell into the $1,500 - 2,999 category, similar to the broader area where 33.3% occupied this range. Housing affordability pressures were severe, with only 77.9% of income remaining after housing costs, ranking at the 35th percentile.
Frequently Asked Questions - Income
Housing
Yarrabilba is characterized by a predominantly suburban housing profile, with a higher proportion of rental properties than the broader region
In Yarrabilba, as per the latest Census, 92.8% of dwellings were houses with the remaining 7.2% being semi-detached, apartments or other types of dwellings. This compares to Brisbane metropolitan area's figures of 97.3% houses and 2.7% other dwellings. Home ownership in Yarrabilba stood at 71%, with mortgaged properties making up 33.4% and rented dwellings accounting for 59.5%. The median monthly mortgage repayment in the area was $1,703, lower than Brisbane metro's average of $2,000. The median weekly rent figure was recorded at $375, similar to Brisbane metro's $390 and comparable to the national average of $375. Nationally, Yarrabilba's mortgage repayments were below the Australian average of $1,863.
Frequently Asked Questions - Housing
Household Composition
Yarrabilba features high concentrations of family households, with a lower-than-average median household size
Family households constitute 82.5% of all households, including 38.7% couples with children, 18.1% couples without children, and 24.8% single parent families. Non-family households comprise the remaining 17.5%, with lone person households at 14.5% and group households making up 3.0%. The median household size is 3.1 people, which is smaller than the Greater Brisbane average of 3.2.
Frequently Asked Questions - Households
Local Schools & Education
Educational outcomes in Yarrabilba fall within the lower quartile nationally, indicating opportunities for improvement in qualification attainment
The area's university qualification rate is 12.8%, significantly lower than Greater Brisbane's average of 30.5%. Bachelor degrees are the most common at 9.3%, followed by postgraduate qualifications (1.9%) and graduate diplomas (1.6%). Vocational credentials are prevalent, with 47.1% of residents aged 15+ holding such qualifications, including advanced diplomas (11.5%) and certificates (35.6%). Educational participation is high, with 37.4% of residents currently enrolled in formal education.
This includes primary education (17.1%), secondary education (8.7%), and tertiary education (3.2%).
Frequently Asked Questions - Education
Schools Detail
Nearby Services & Amenities
Transport
Transport servicing is very low compared to other areas nationally based on assessment of service frequency, route connectivity and accessibility
Yarrabilba has 14 operational public transport stops. All of these are bus stops. There is one route serving these stops, which together facilitate 123 weekly passenger trips.
The accessibility of transport in the area is limited, with residents on average located 671 meters away from the nearest stop. On average, there are 17 trips per day across all routes, equating to approximately 8 weekly trips per individual stop.
Frequently Asked Questions - Transport
Transport Stops Detail
Health
The level of general health in Yarrabilba is notably higher than the national average with prevalence of common health conditions low among the general population though higher than the nation's average across older, at risk cohorts
Yarrabilba shows better-than-average health outcomes, with a low prevalence of common health conditions among its general population compared to national averages. However, certain cohorts such as older adults and those at risk have higher prevalence rates.
Private health cover is found to be quite low in Yarrabilba, at approximately 48% (around 7,697 people), which is lower than the national average of 55.3%. Mental health issues and asthma are the most common medical conditions in the area, affecting 11.2% and 10.1% of residents respectively. Notably, 71.6% of residents report having no medical ailments, compared to 69.6% across Greater Brisbane. The population aged 65 and over is lower than the Greater Brisbane average at 5.7% (around 914 people), but health outcomes among seniors require more attention due to specific challenges faced by this cohort.
Frequently Asked Questions - Health
Cultural Diversity
In terms of cultural diversity, Yarrabilba records figures broadly comparable to the national average, as found in AreaSearch's assessment of a number of language and cultural background related metrics
Yarrabilba's cultural diversity is above average, with 20.8% of its population born overseas and 11.7% speaking a language other than English at home. Christianity is the dominant religion in Yarrabilba, accounting for 37.3% of the population. The most notable overrepresentation is in the 'Other' religious category, comprising 1.5% compared to 1.0% across Greater Brisbane.
In terms of ancestry, the top three groups are Australian (28.1%), English (27.6%), and Other (9.4%). There are significant differences in the representation of certain ethnic groups: Maori at 3.2% (vs regional 1.4%), New Zealand at 2.1% (vs 1.6%), and Samoan at 2.3% (vs 0.7%).
Frequently Asked Questions - Diversity
Age
Yarrabilba hosts a very young demographic, ranking in the bottom 10% of areas nationwide
The median age in Yarrabilba is 27 years, which is notably lower than Greater Brisbane's average of 36 years and considerably younger than Australia's median age of 38 years. Compared to the Greater Brisbane average, the cohort aged 5-14 is notably over-represented at 21.1% in Yarrabilba, while those aged 55-64 are under-represented at 5.5%. This concentration of 5-14 year-olds is well above the national average of 12.2%. Post-Census data from 2021 shows that the age group 35 to 44 has grown from 14.1% to 16.1% of the population, while those aged 15 to 24 increased from 12.8% to 14.1%. Conversely, the cohort aged 0 to 4 has declined from 13.3% to 10.0%, and the age group 25 to 34 has dropped from 21.4% to 18.9%. Looking ahead to 2041, demographic projections reveal significant shifts in Yarrabilba's age structure, with the strongest projected growth in the cohort aged 15 to 24 at 90%, adding 2,024 residents to reach a total of 4,279.
