Chart Color Schemes
This analysis uses ABS Statistical Areas Level 2 (SA2) boundaries, which can materially differ from Suburbs and Localities (SAL) even when sharing similar names.
SA2 boundaries are defined by the Australian Bureau of Statistics and are designed to represent communities for statistical reporting (e.g., census and ERP).
Suburbs and Localities (SAL) represent commonly-used suburb/locality names (postal-style areas) and may use different geographic boundaries. For comprehensive analysis, consider reviewing both boundary types if available.
est. as @ -- *
ABS ERP | -- people | --
2021 Census | -- people
Sales Activity
Curious about local property values? Filter the chart to assess the volume and appreciation (including resales) trends and regional comparisons, or scroll to the map below view this information at an individual property level.
Find a Recent Sale
Sales Detail
Population
Bellbird Park lies within the top 10% of areas nationally in terms of population growth performance according to AreaSearch analysis of short and medium-term trends
Bellbird Park's population was approximately 10,644 as of November 2025. This figure represents an increase of 1,453 people from the 2021 Census count of 9,191. The growth is inferred from ABS estimates: 10,595 in June 2024 and additional validated new addresses since the Census date. The population density was around 1,635 persons per square kilometer, higher than the national average assessed by AreaSearch. Bellbird Park's growth rate of 15.8% since the 2021 Census exceeded both national (8.9%) and state averages, making it a growth leader in the region. Interstate migration contributed approximately 44.1% to overall population gains during recent periods.
For projections, AreaSearch uses ABS/Geoscience Australia data from 2024 with a base year of 2022 for each SA2 area. Post-2032 and for areas not covered by this data, Queensland State Government's SA2 area projections released in 2023 based on 2021 data are adopted, applying proportional growth weightings from ABS Greater Capital Region projections released in 2023 with a base year of 2022. Future population projections indicate exceptional growth, placing Bellbird Park in the top 10 percent of national statistical areas. The area is expected to grow by 6,110 persons by 2041, reflecting an increase of 56.9% over the 17-year period based on latest annual ERP population numbers.
Frequently Asked Questions - Population
Development
The level of residential development activity in Bellbird Park was found to be higher than 90% of real estate markets across the country
Bellbird Park approved around 110 dwellings each year. From FY21 to FY25552 homes were approved, with 9 more in FY26 so far.
Over the past five financial years, an average of 3.6 new residents per home was recorded. This supply lagged demand, leading to heightened buyer competition and pricing pressures. New properties were constructed at an average value of $241,000, reflecting more affordable housing options compared to regional norms. Bellbird Park had elevated construction relative to Greater Brisbane (14.0% above the regional average per person over five years), balancing buyer choice with property values support.
However, development activity has moderated recently. New development comprised 93.0% detached houses and 7.0% townhouses or apartments, preserving Bellbird Park's suburban nature and attracting space-seeking buyers. The location had approximately 125 people per dwelling approval, indicating an expanding market. By 2041, Bellbird Park is expected to grow by 6,061 residents (AreaSearch quarterly estimate). Building activity is keeping pace with growth projections, though buyers may experience heightened competition as the population grows.
Frequently Asked Questions - Development
Infrastructure
Bellbird Park has moderate levels of nearby infrastructure activity, ranking in the top 50% nationally
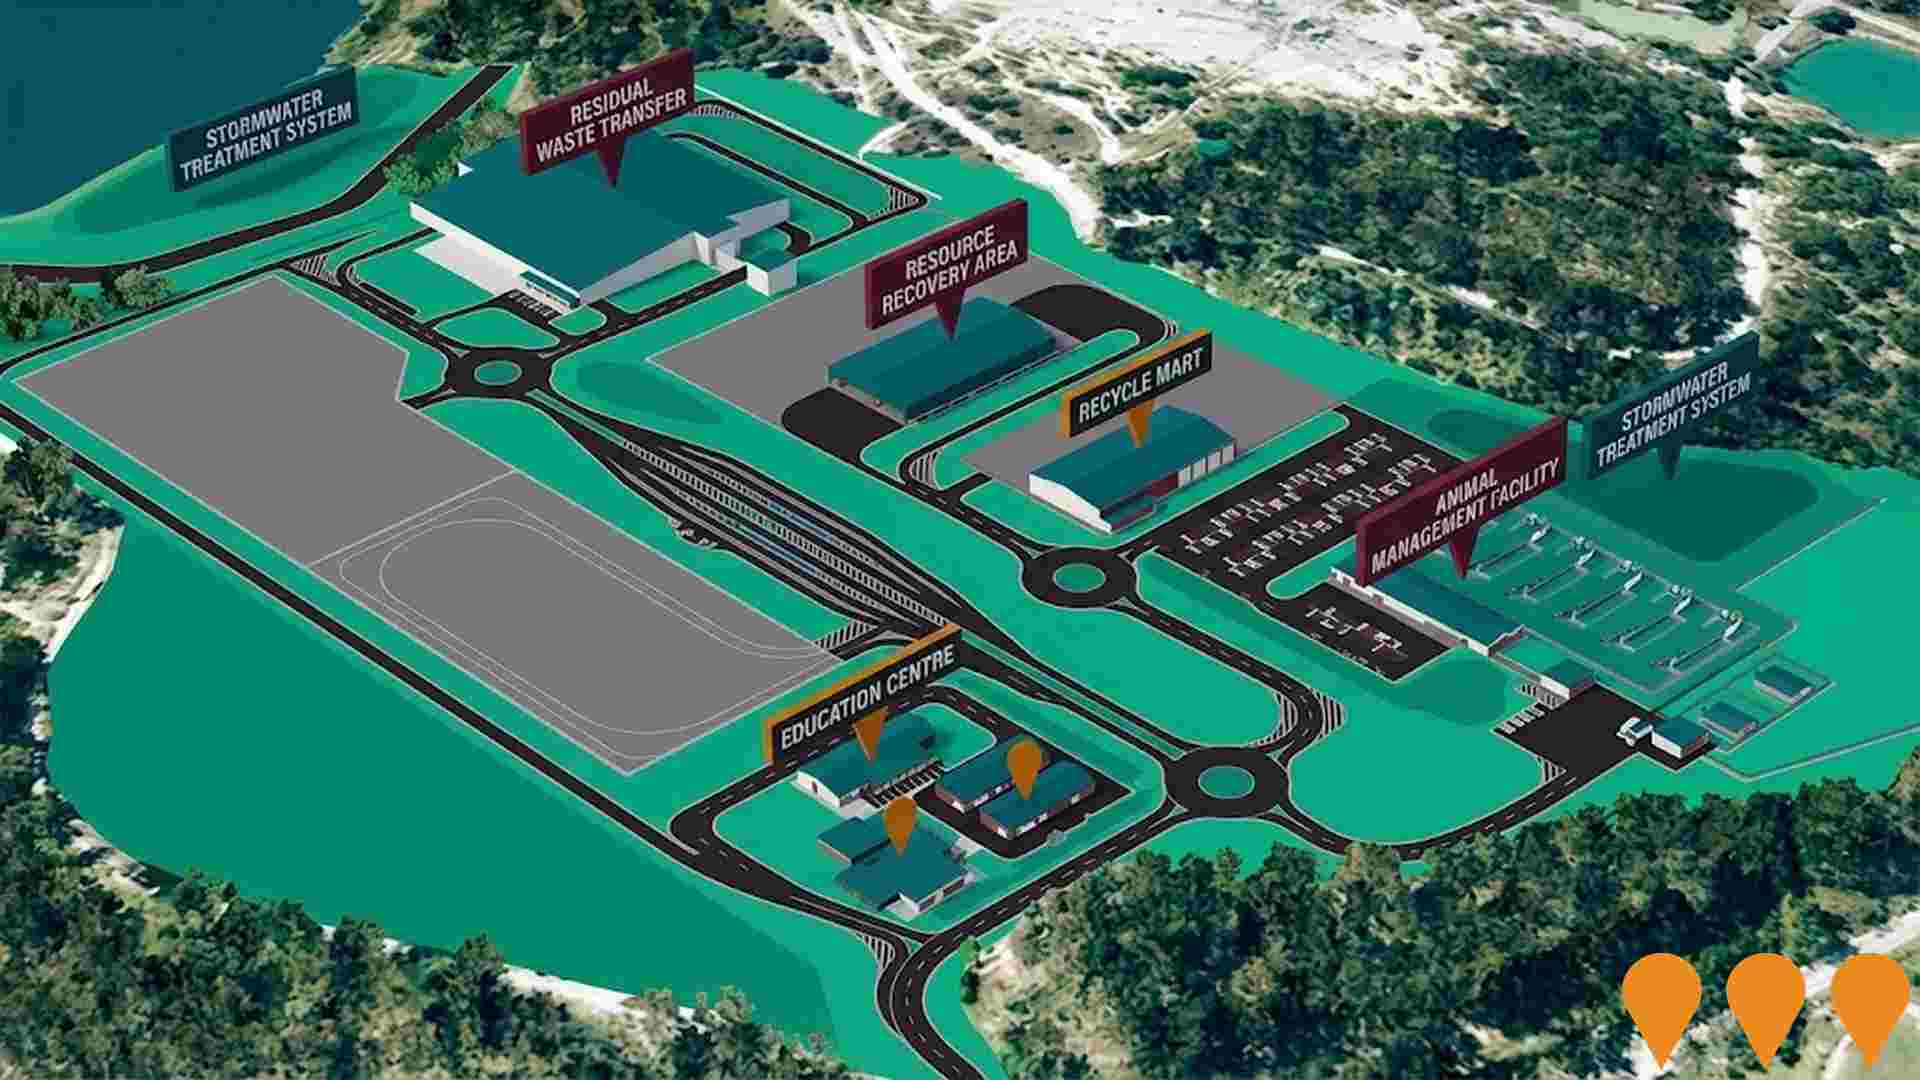
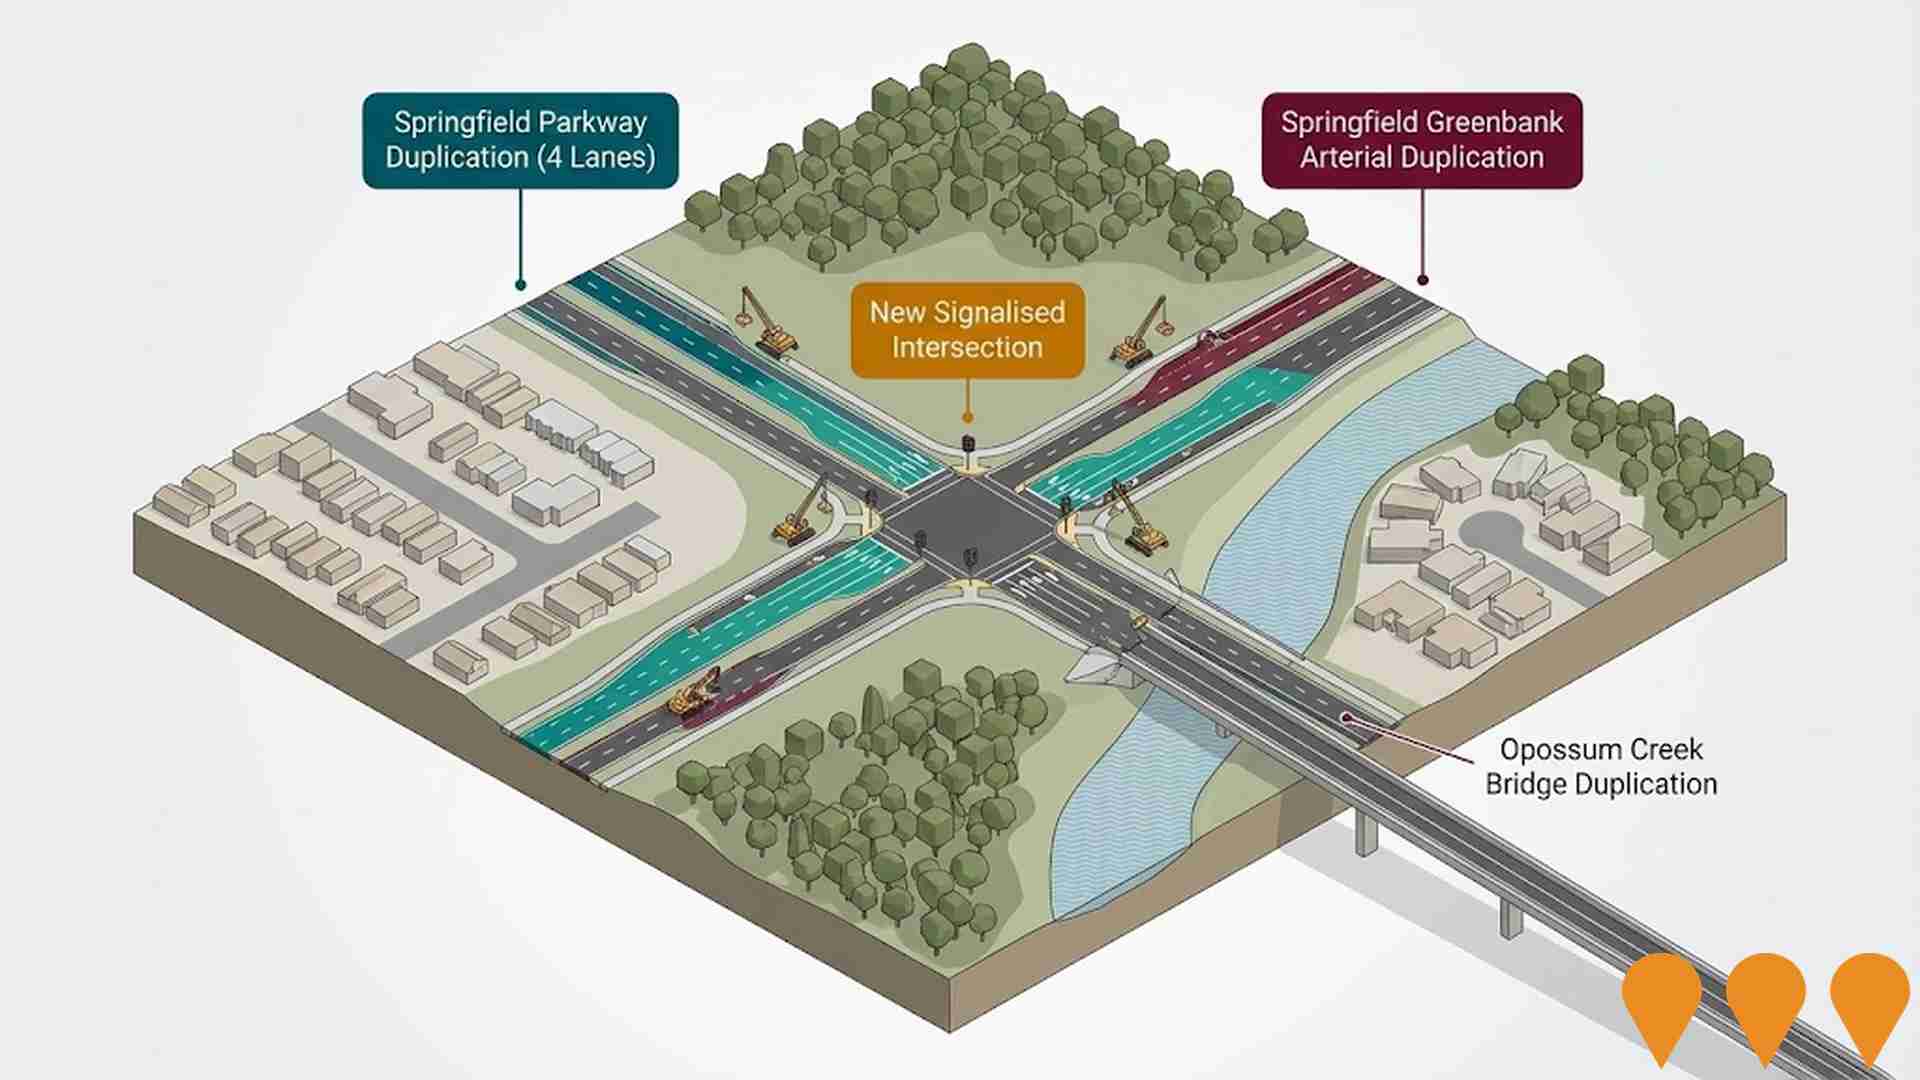
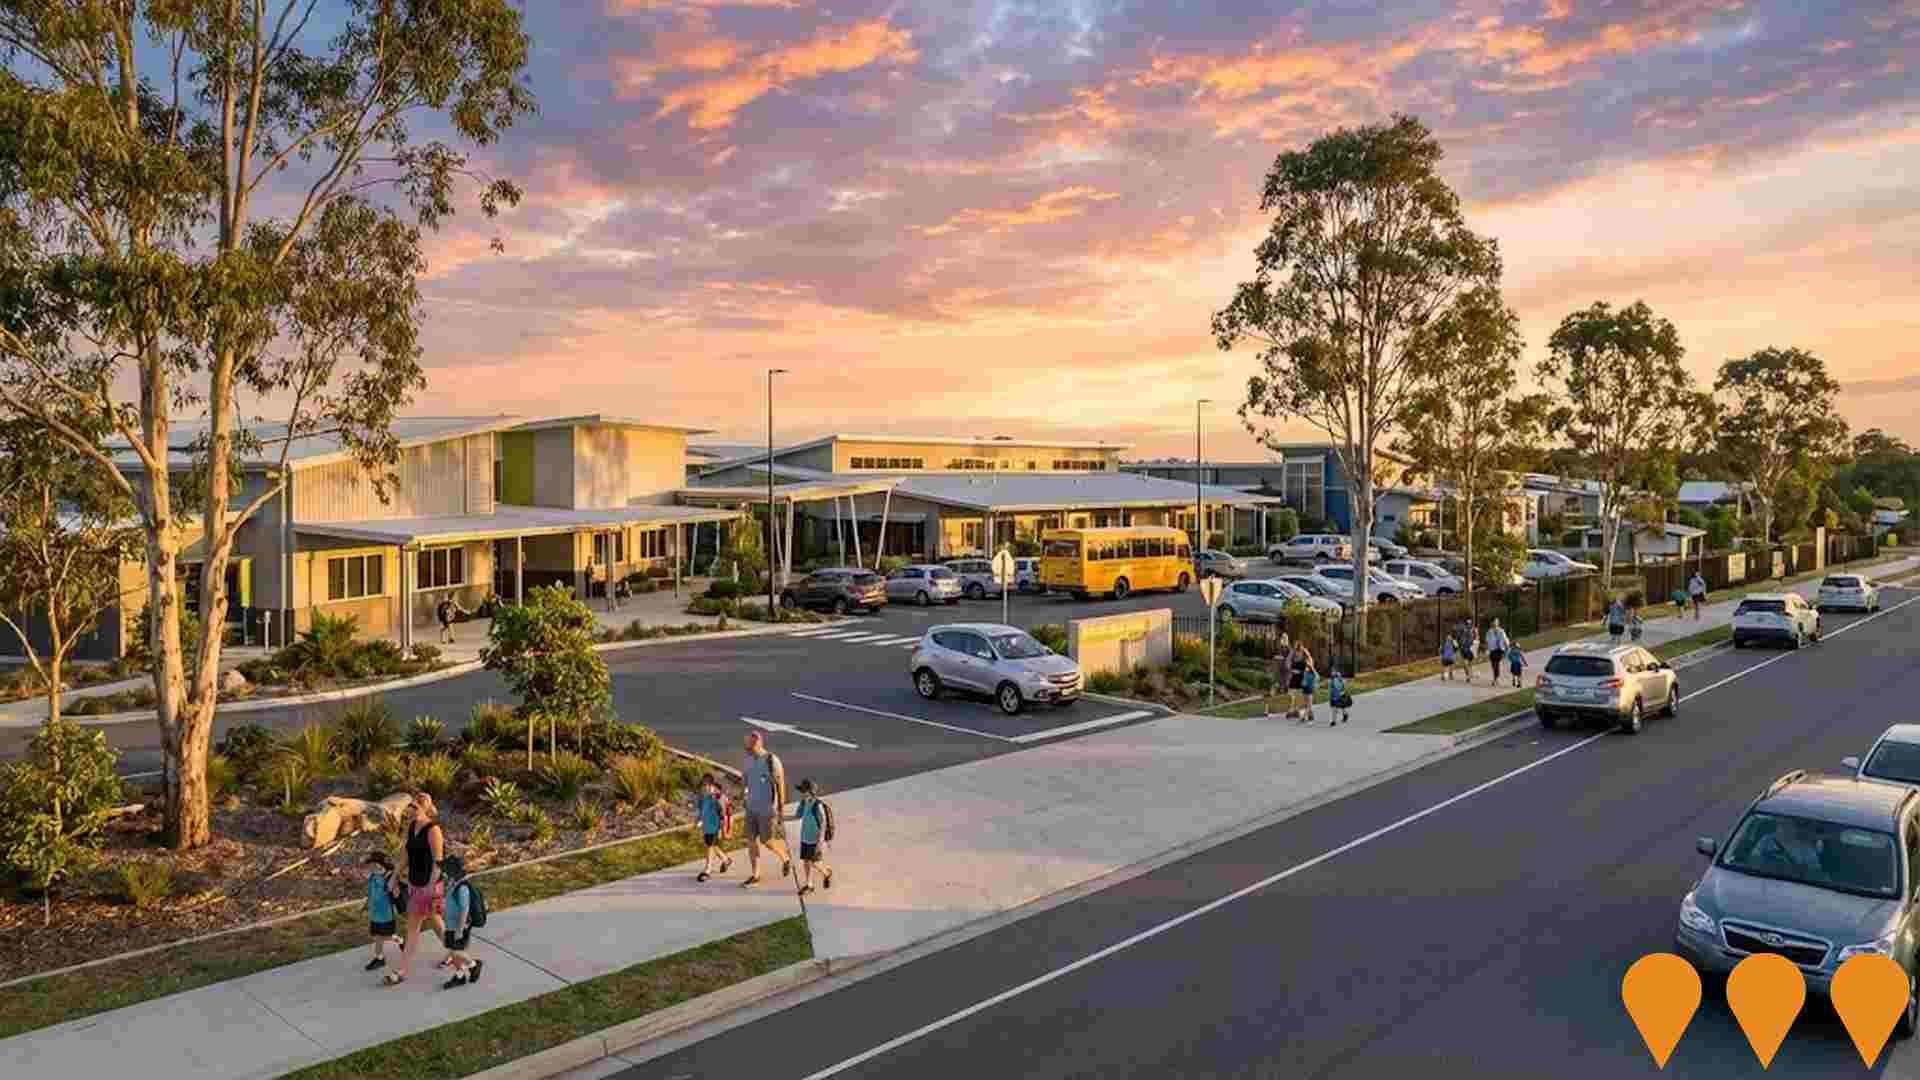
Changes to local infrastructure significantly influence an area's performance. AreaSearch has identified 17 projects likely to impact the area. Notable projects include Southern Resource Recovery and Recycling Facility - Redbank Plains, Mountview Shopping Centre, Bellbird Park State School, and Redbank Plains Road Upgrade Stage 4. The following list details those most relevant.
Professional plan users can use the search below to filter and access additional projects.
INFRASTRUCTURE SEARCH
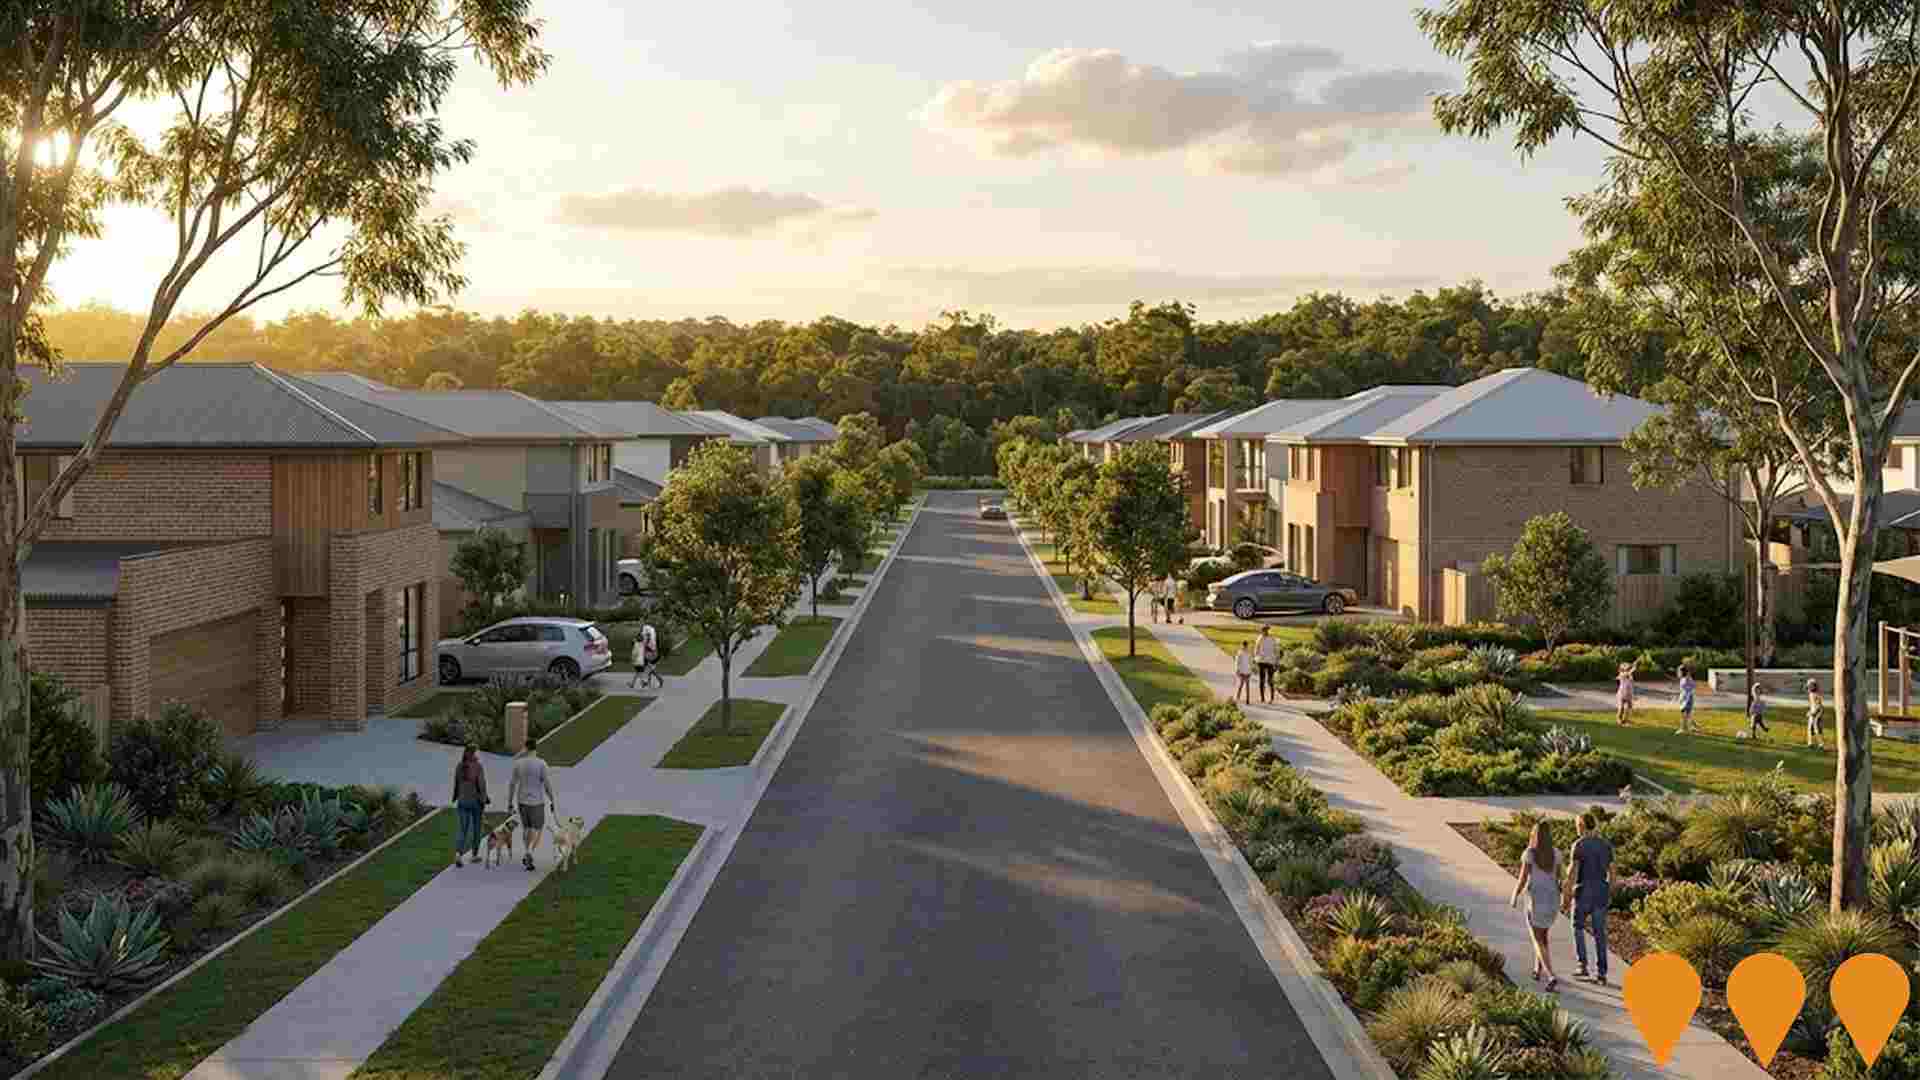
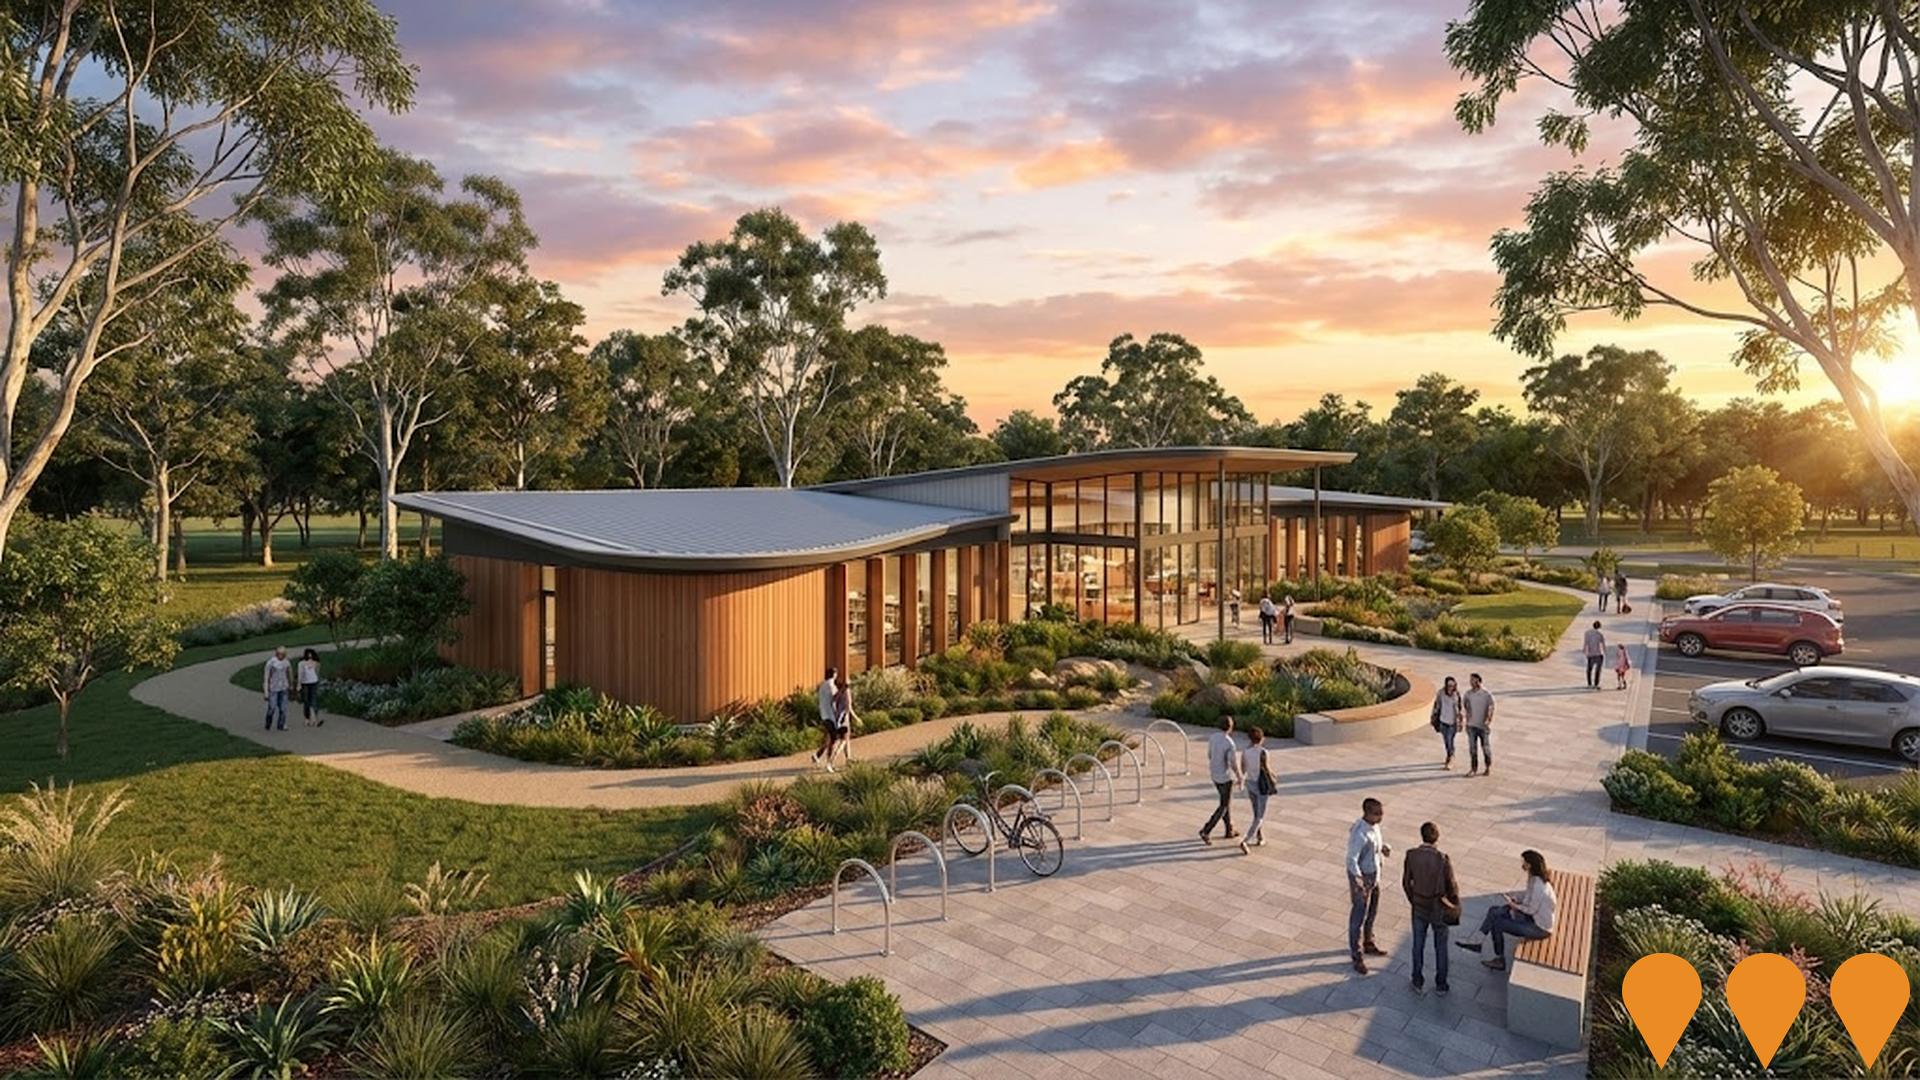
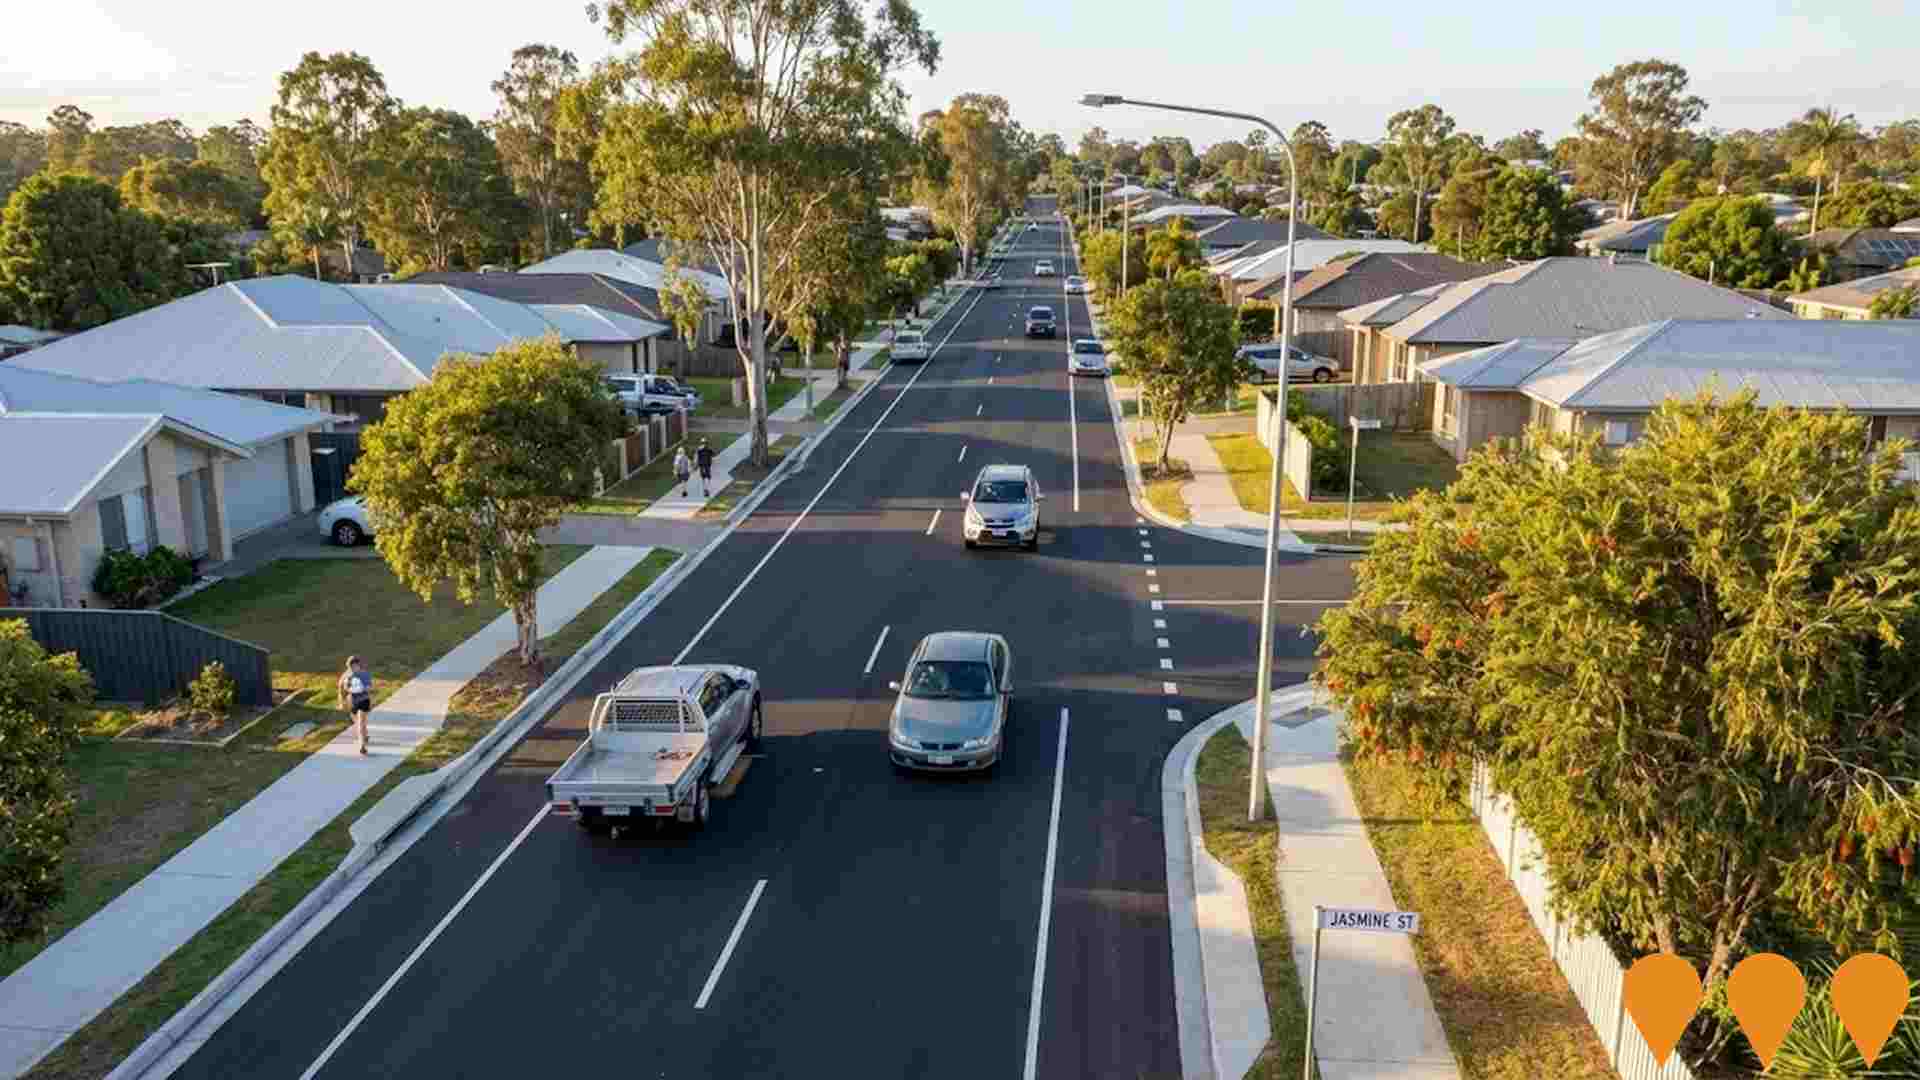
 Denotes AI-based impression for illustrative purposes only, not to be taken as definitive under any circumstances. Please follow links and conduct other investigations from the project's source for actual imagery. Developers and project owners wishing us to use original imagery please Contact Us and we will do so.
Frequently Asked Questions - Infrastructure
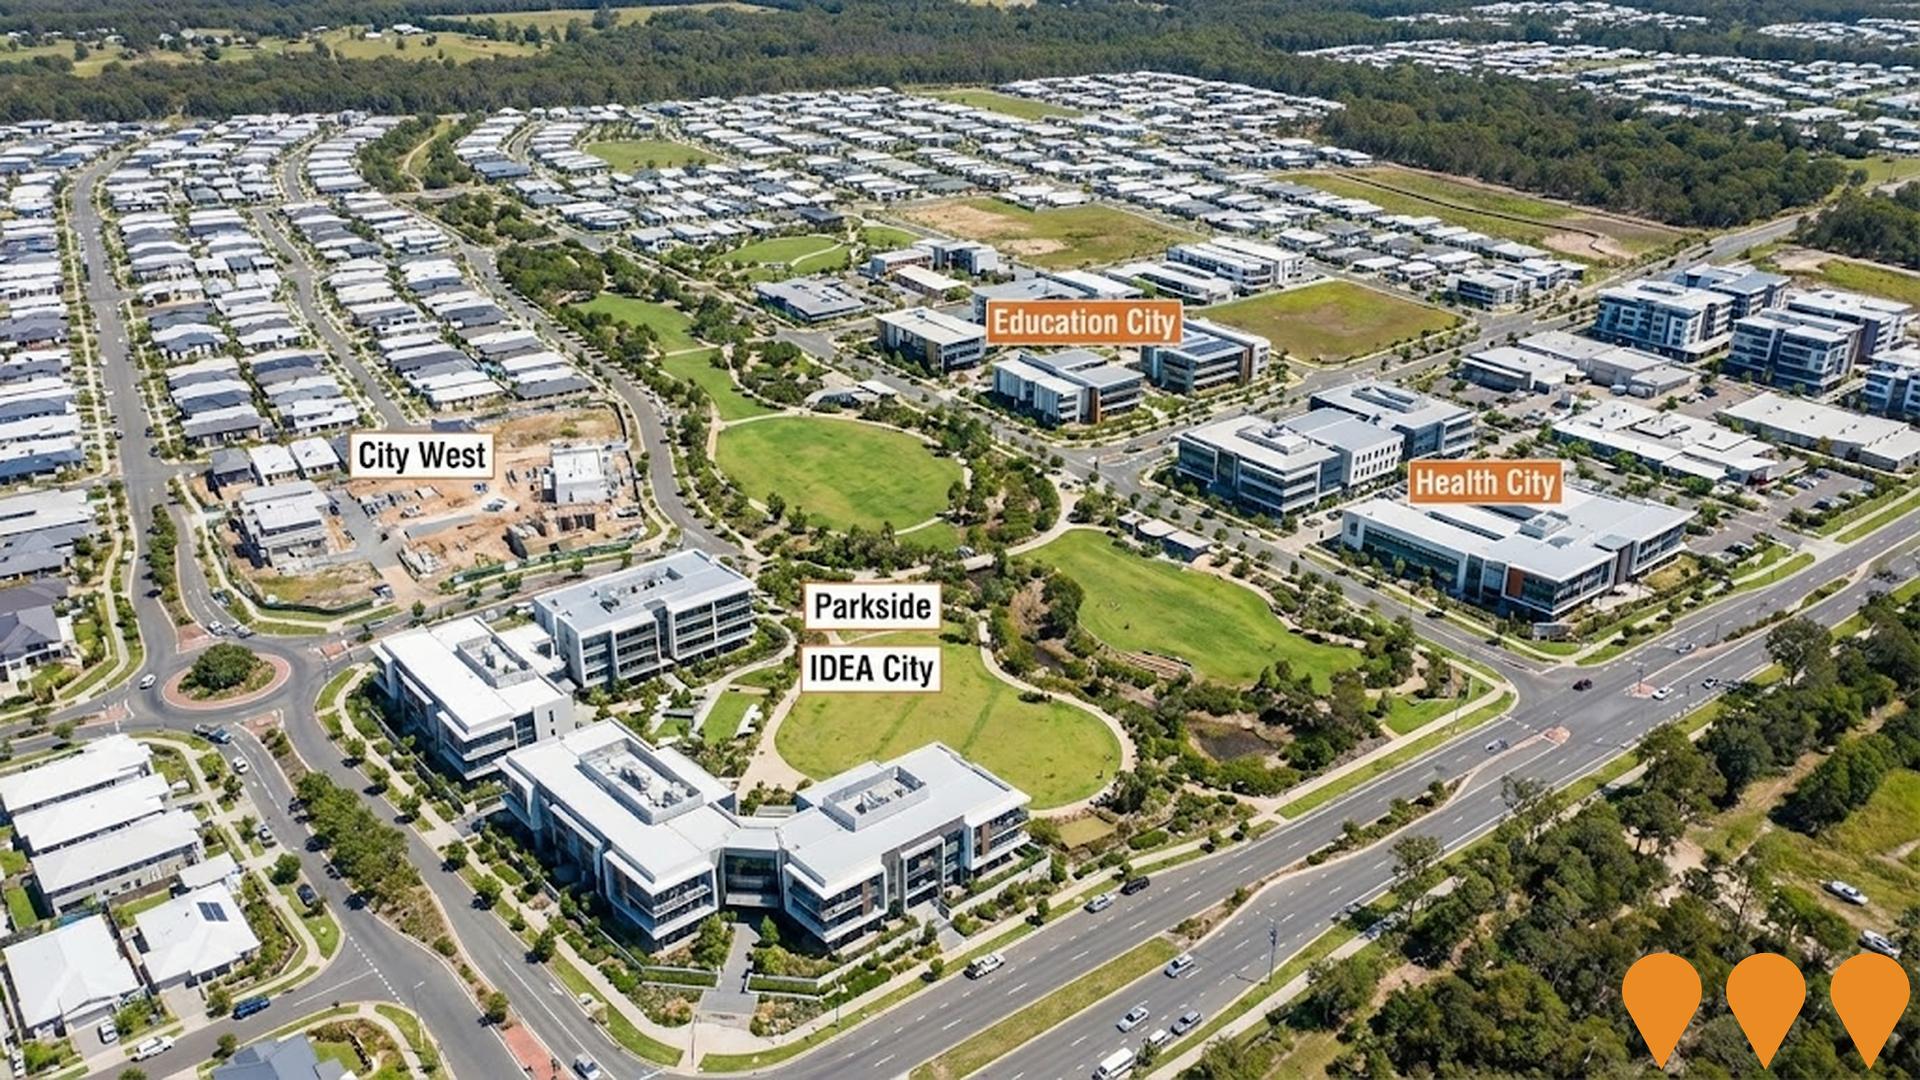
Greater Springfield Master Planned Community
Australia's largest master-planned community spanning 2,860 hectares in South-East Queensland. Currently home to over 55,000 residents (2025), the $88+ billion privately funded city is projected to reach 138,000 residents and 105,000 jobs by 2045. Key pillars include health, education, technology, and connectivity, with more than $20 billion invested to date. Ongoing construction across multiple residential, commercial, education, health and retail precincts.
Town Square Redbank Plains
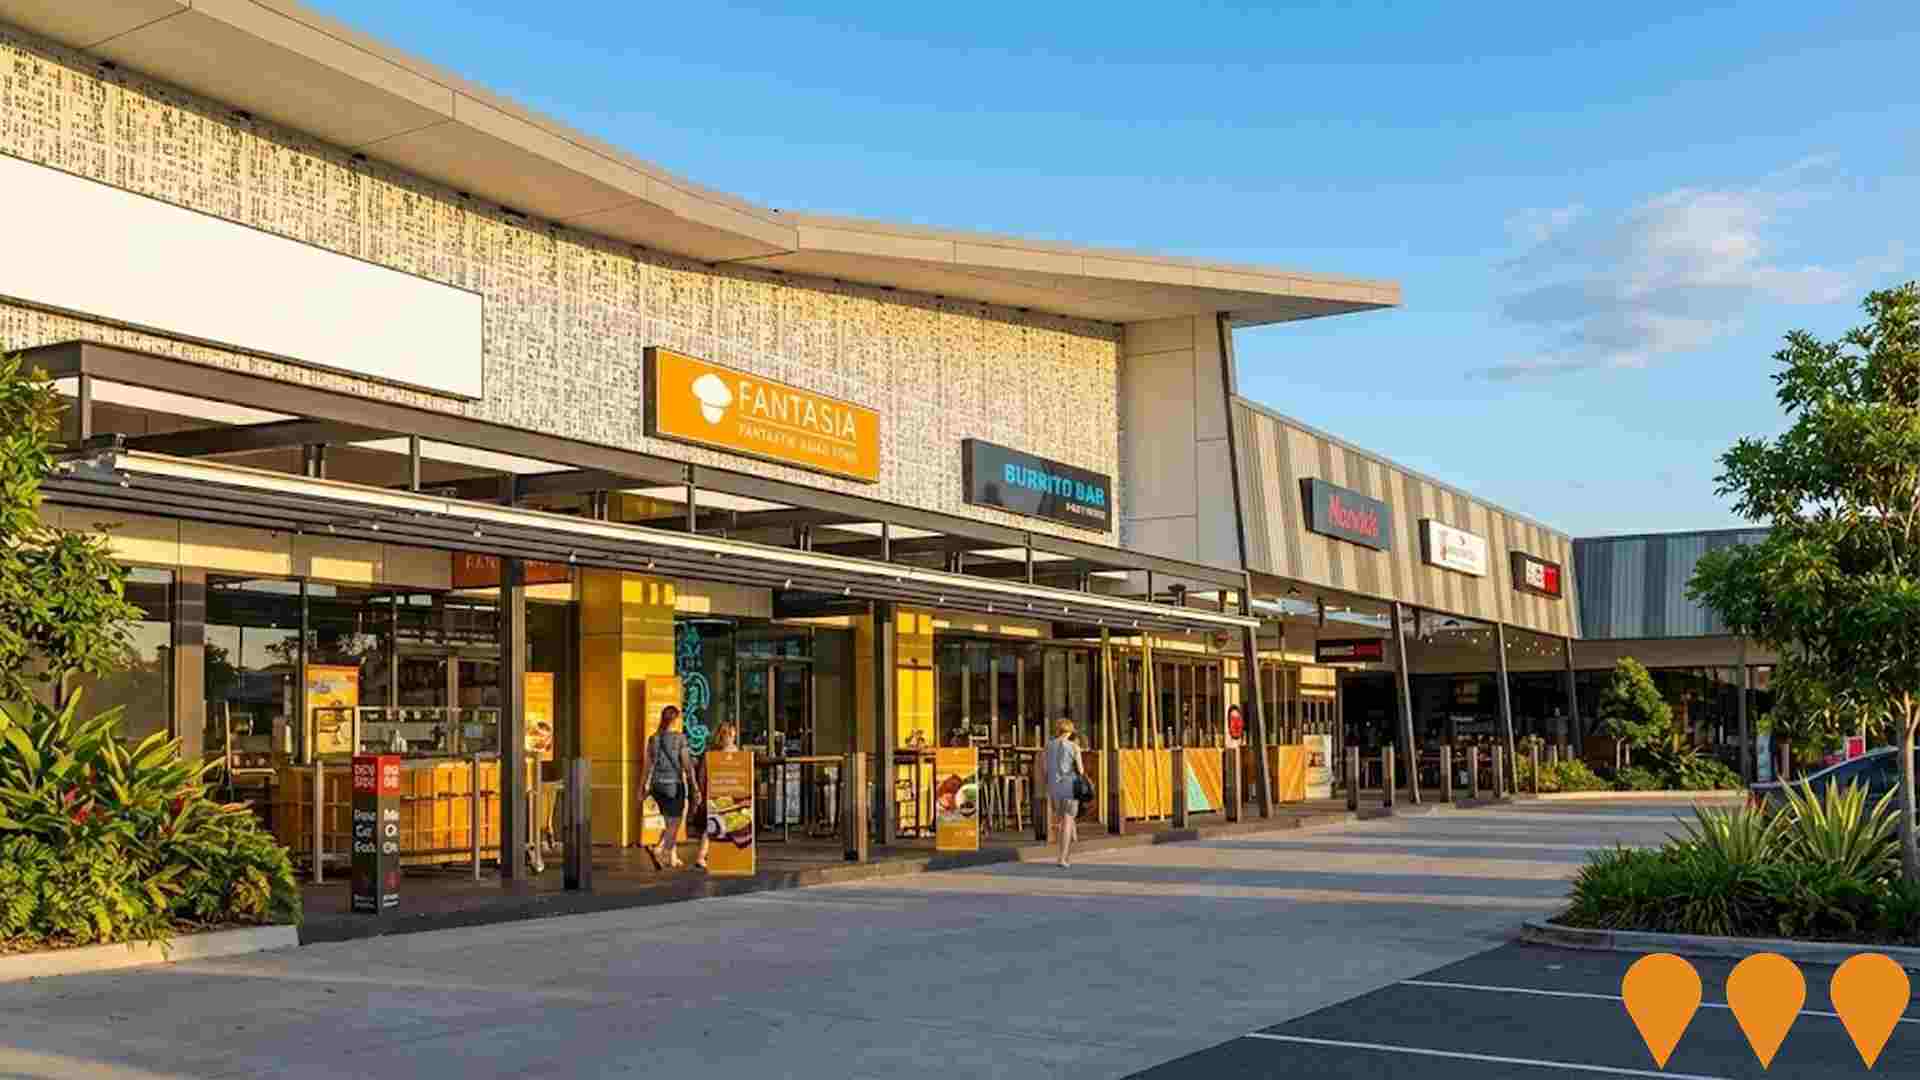
State-of-the-art shopping destination developed by Sim Lian Metro Capital featuring major retailers including Coles, Woolworths, Aldi, Target, and Australia Post along with 43 specialty stores across 5 distinct retail precincts. The redeveloped and expanded shopping center serves as the heart of Redbank Plains with over 1,200 car parks, dining, medical services, and community facilities across a 6.5 hectare site.
Darra to Springfield Transport Corridor
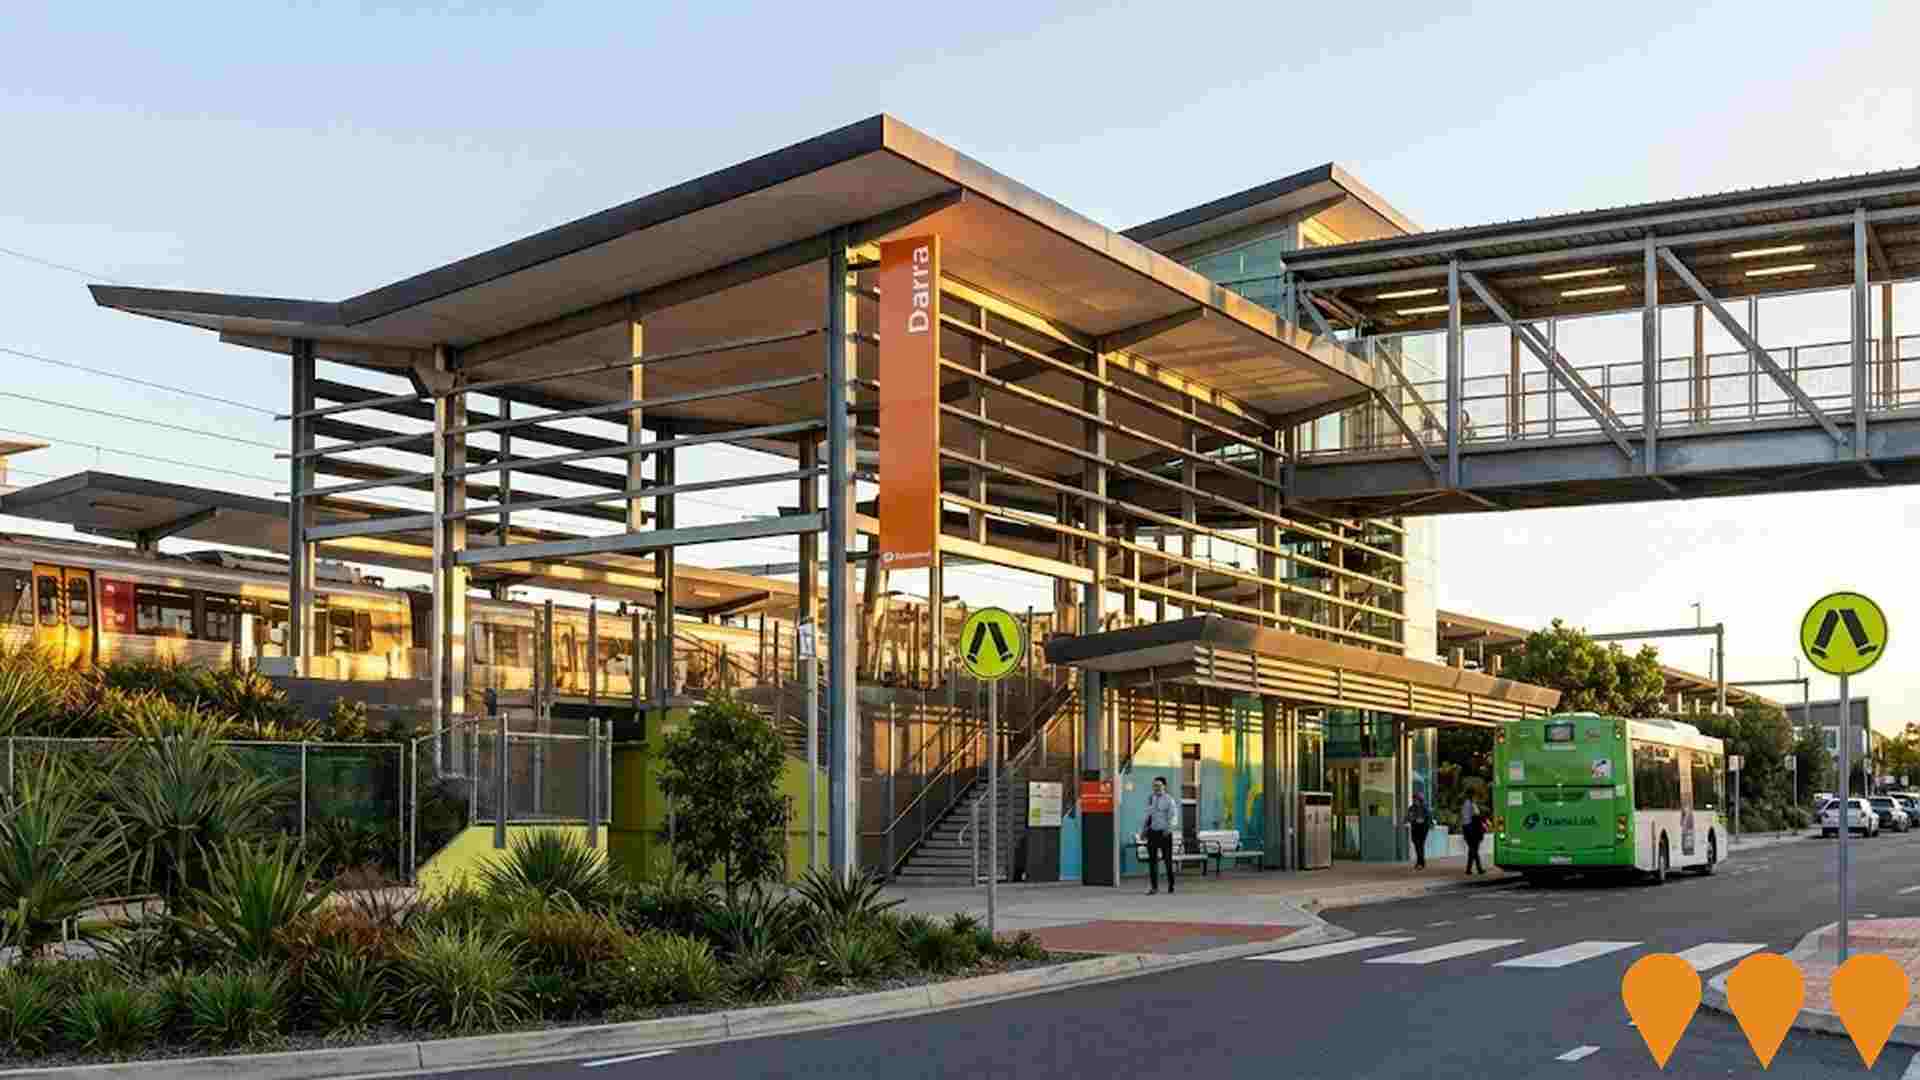
Completed $1.2 billion integrated transport corridor including 14km dual track railway, expansion of Springfield Central Station, park-and-ride facilities, and supporting road infrastructure. Connects Springfield to Brisbane CBD via Springfield Central, Darra, and Ipswich lines.
Ipswich to Springfield Central Public Transport Corridor (I2S)
The Ipswich to Springfield Central Public Transport Corridor (I2S) is a proposed 25 km dedicated mass transit corridor linking Ipswich Central and Springfield Central via Ripley and Redbank Plains. The project includes nine new stations and will support future growth in one of South East Queenslands fastest-growing regions. The Options Analysis was completed in late 2024. A Detailed Business Case, jointly funded by the Australian Government, Queensland Government and Ipswich City Council under the South East Queensland City Deal, is scheduled to commence in 2026. Delivery mode (heavy rail, trackless tram or other) and final alignment are still under investigation.

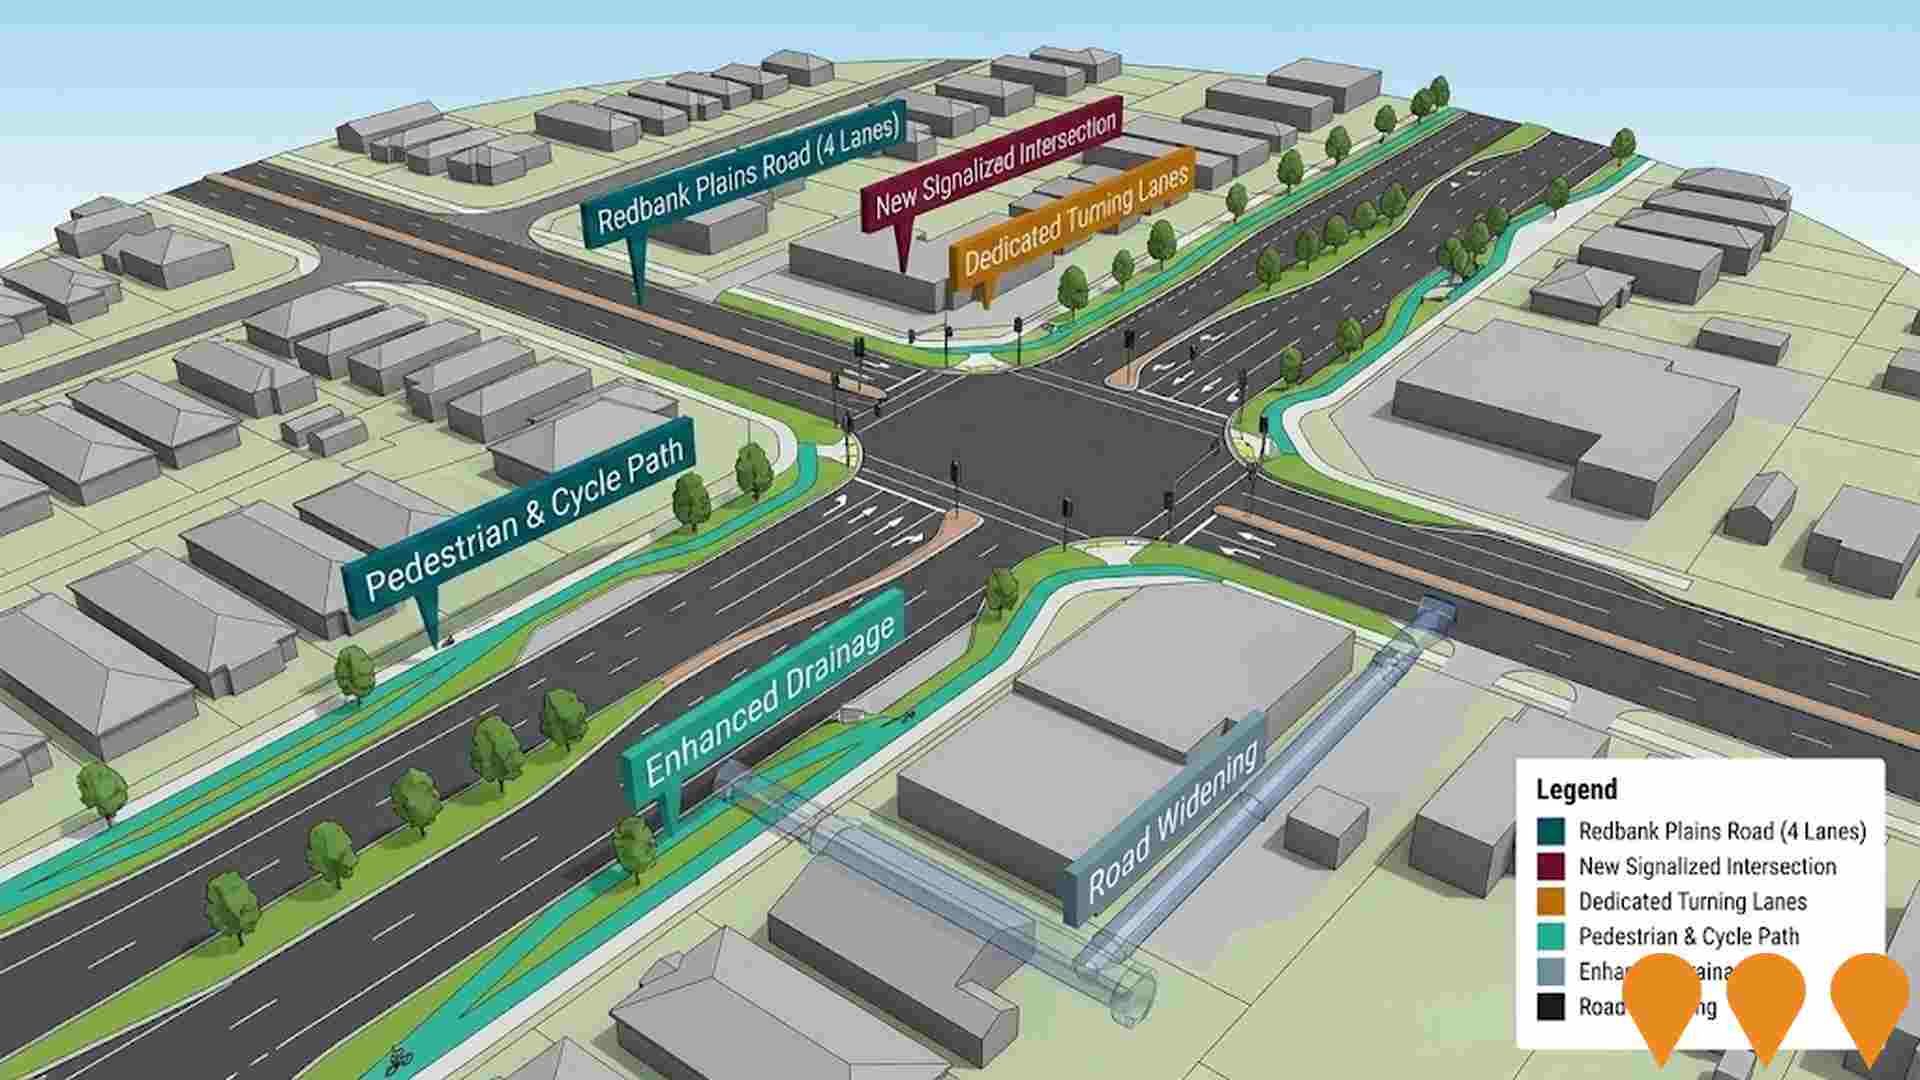
Redbank Plains Road Upgrade - Stage 3
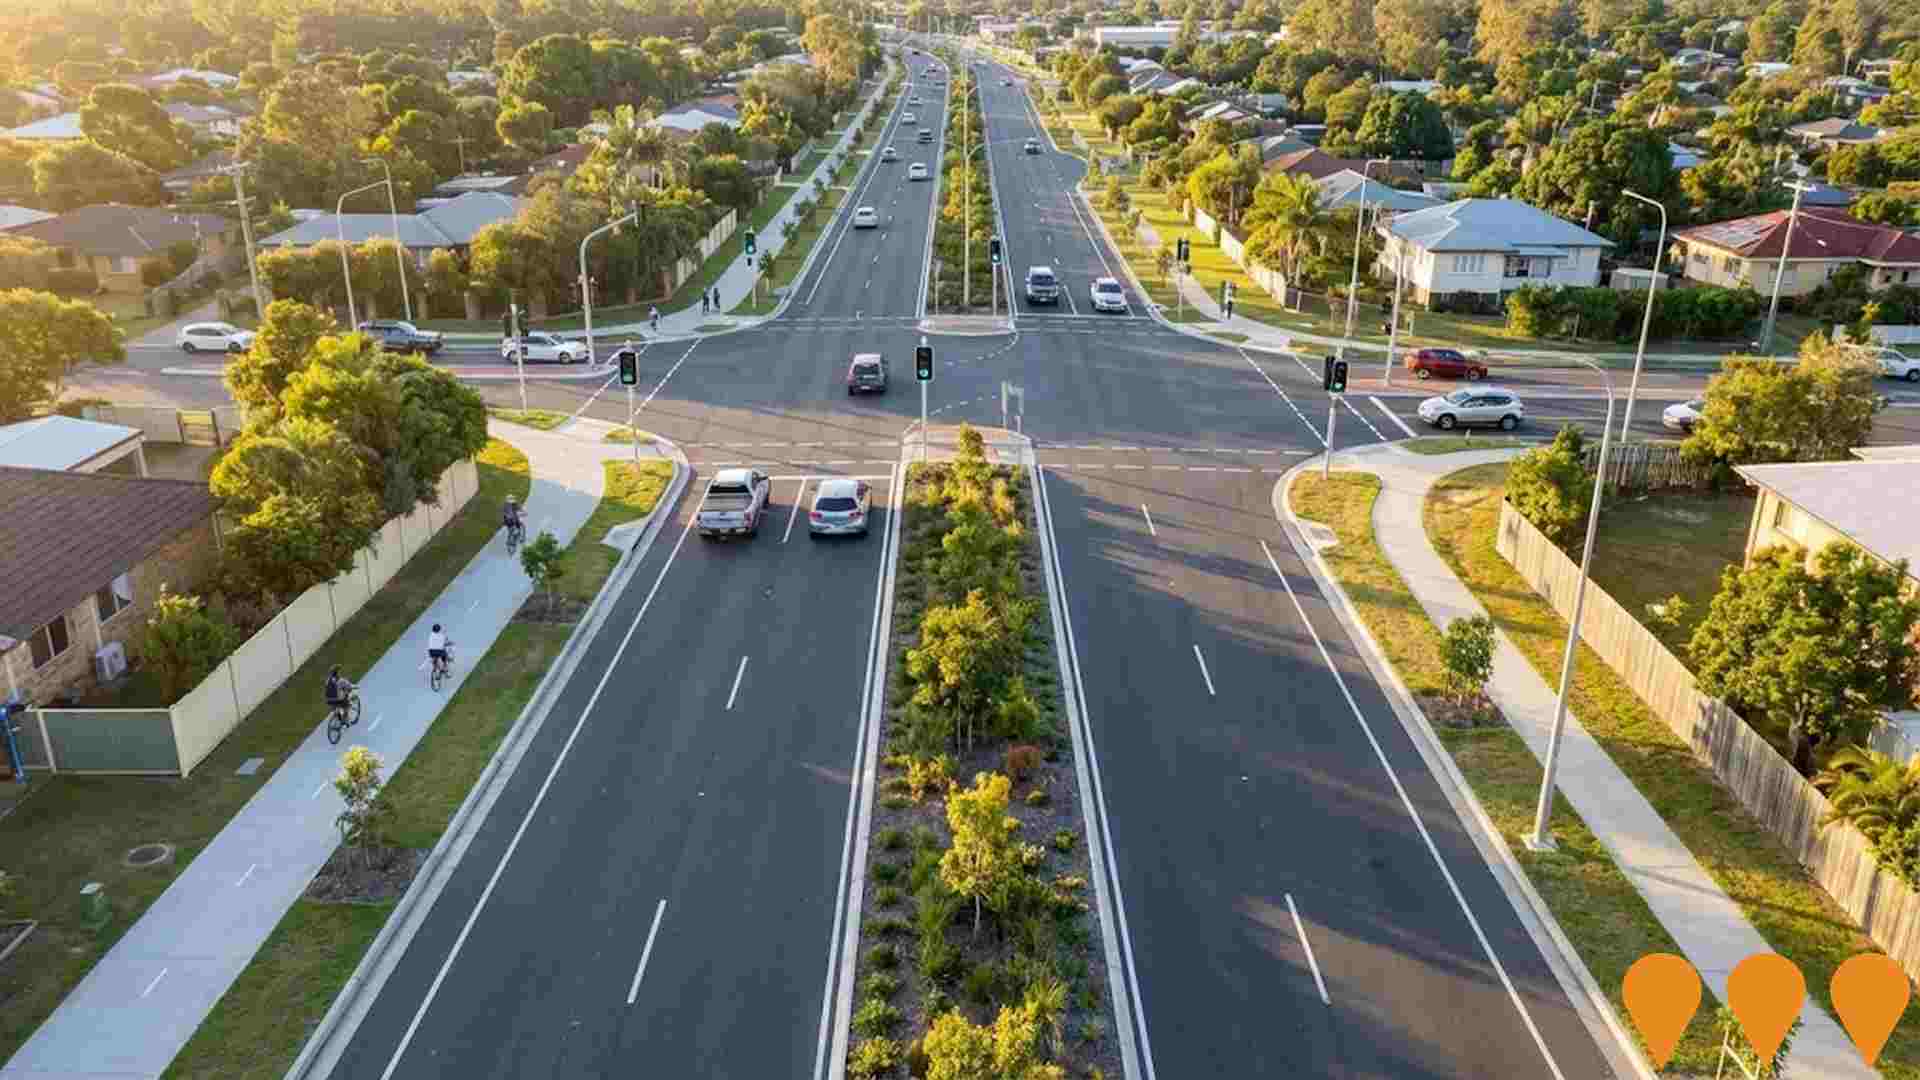
Major upgrade of Redbank Plains Road (Keidges Road to Kruger Parade) to a four-lane divided carriageway. Includes road widening, intersection upgrades (including signalisation at Kruger Parade), dedicated cycling infrastructure, 3m shared pathway on the western side, 1.5m pathway on the eastern side, and enhanced pedestrian facilities to improve traffic flow, safety, and capacity in the growing western corridor.
HQ Community (Hardrock Quarry Redevelopment)
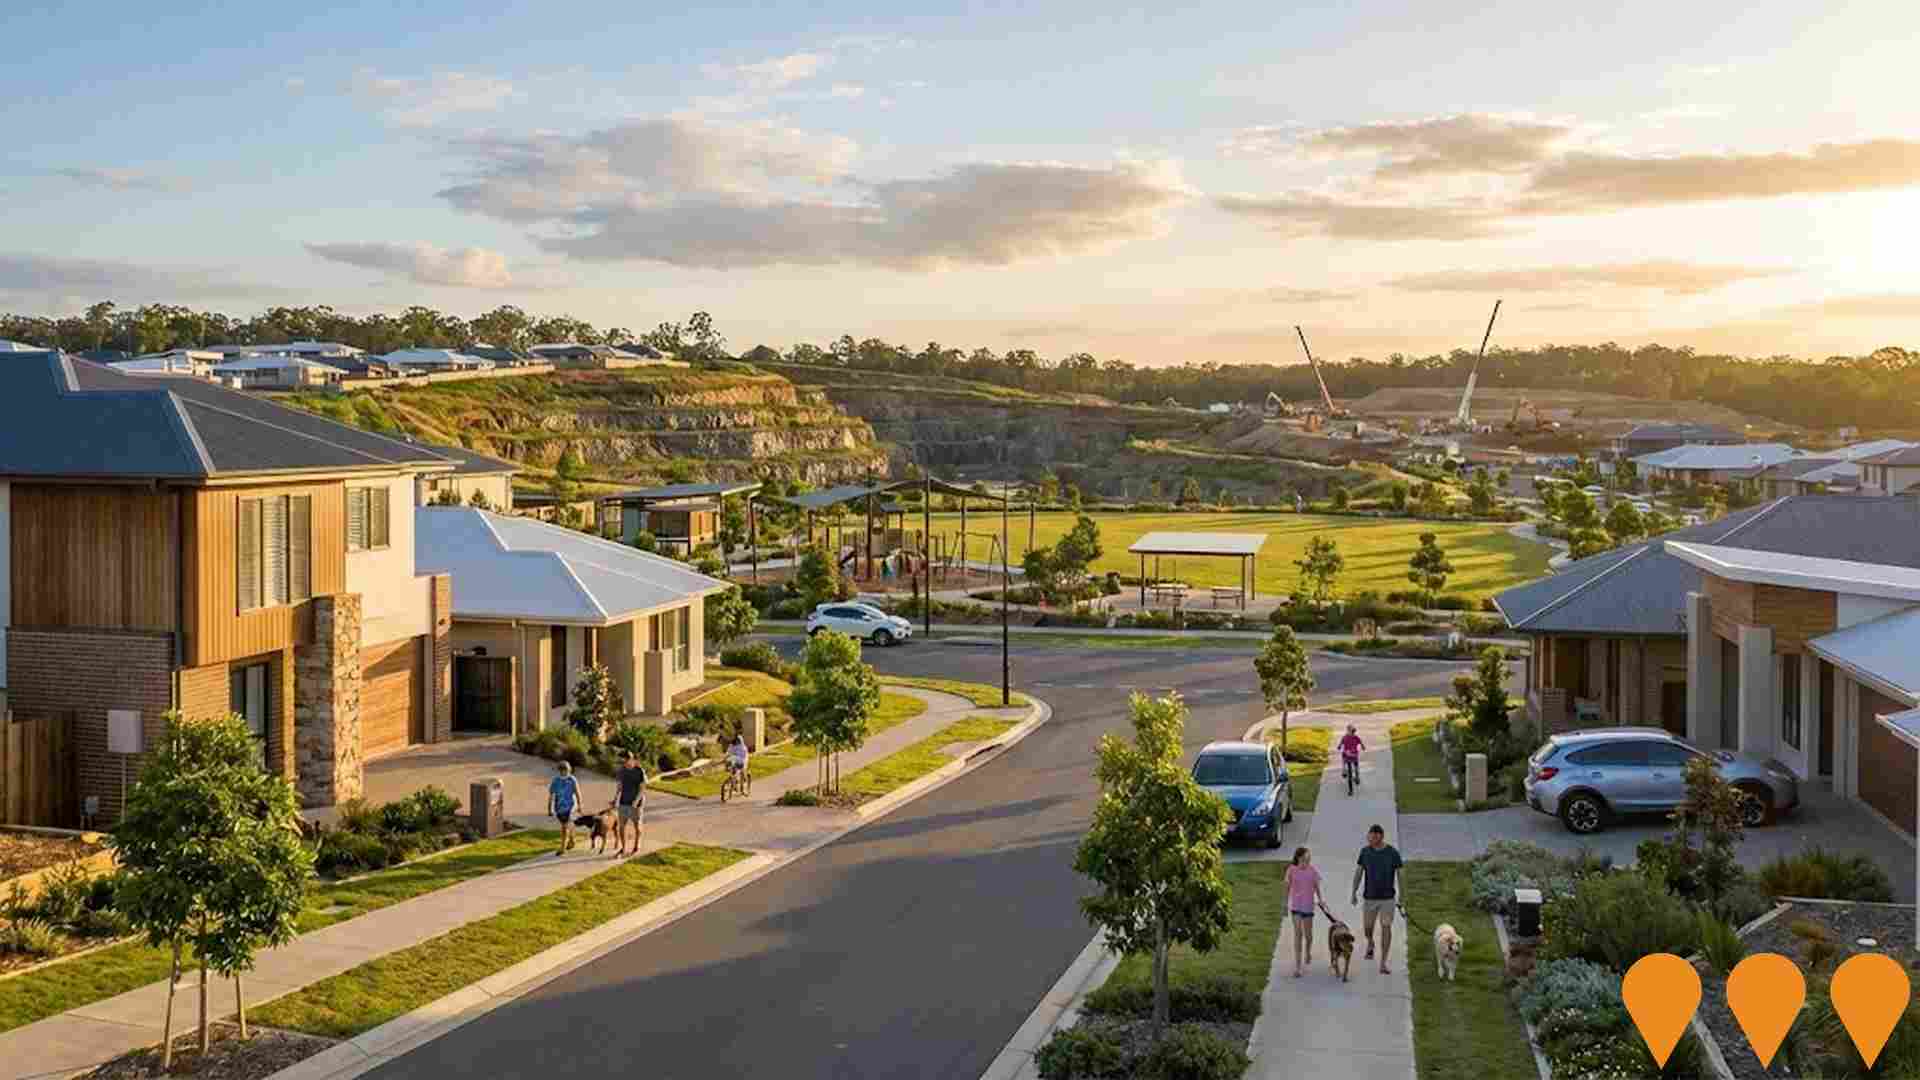
Transformation of the 186-hectare operational Hardrock Quarry into a major masterplanned residential community. The project will deliver approximately 1,800 homes, a retail hub, and over 90 hectares of dedicated open space, including three local parks and a district park. The development focuses on rehabilitating the site and connecting with the adjacent Brookwater community.
Mountview Shopping Centre
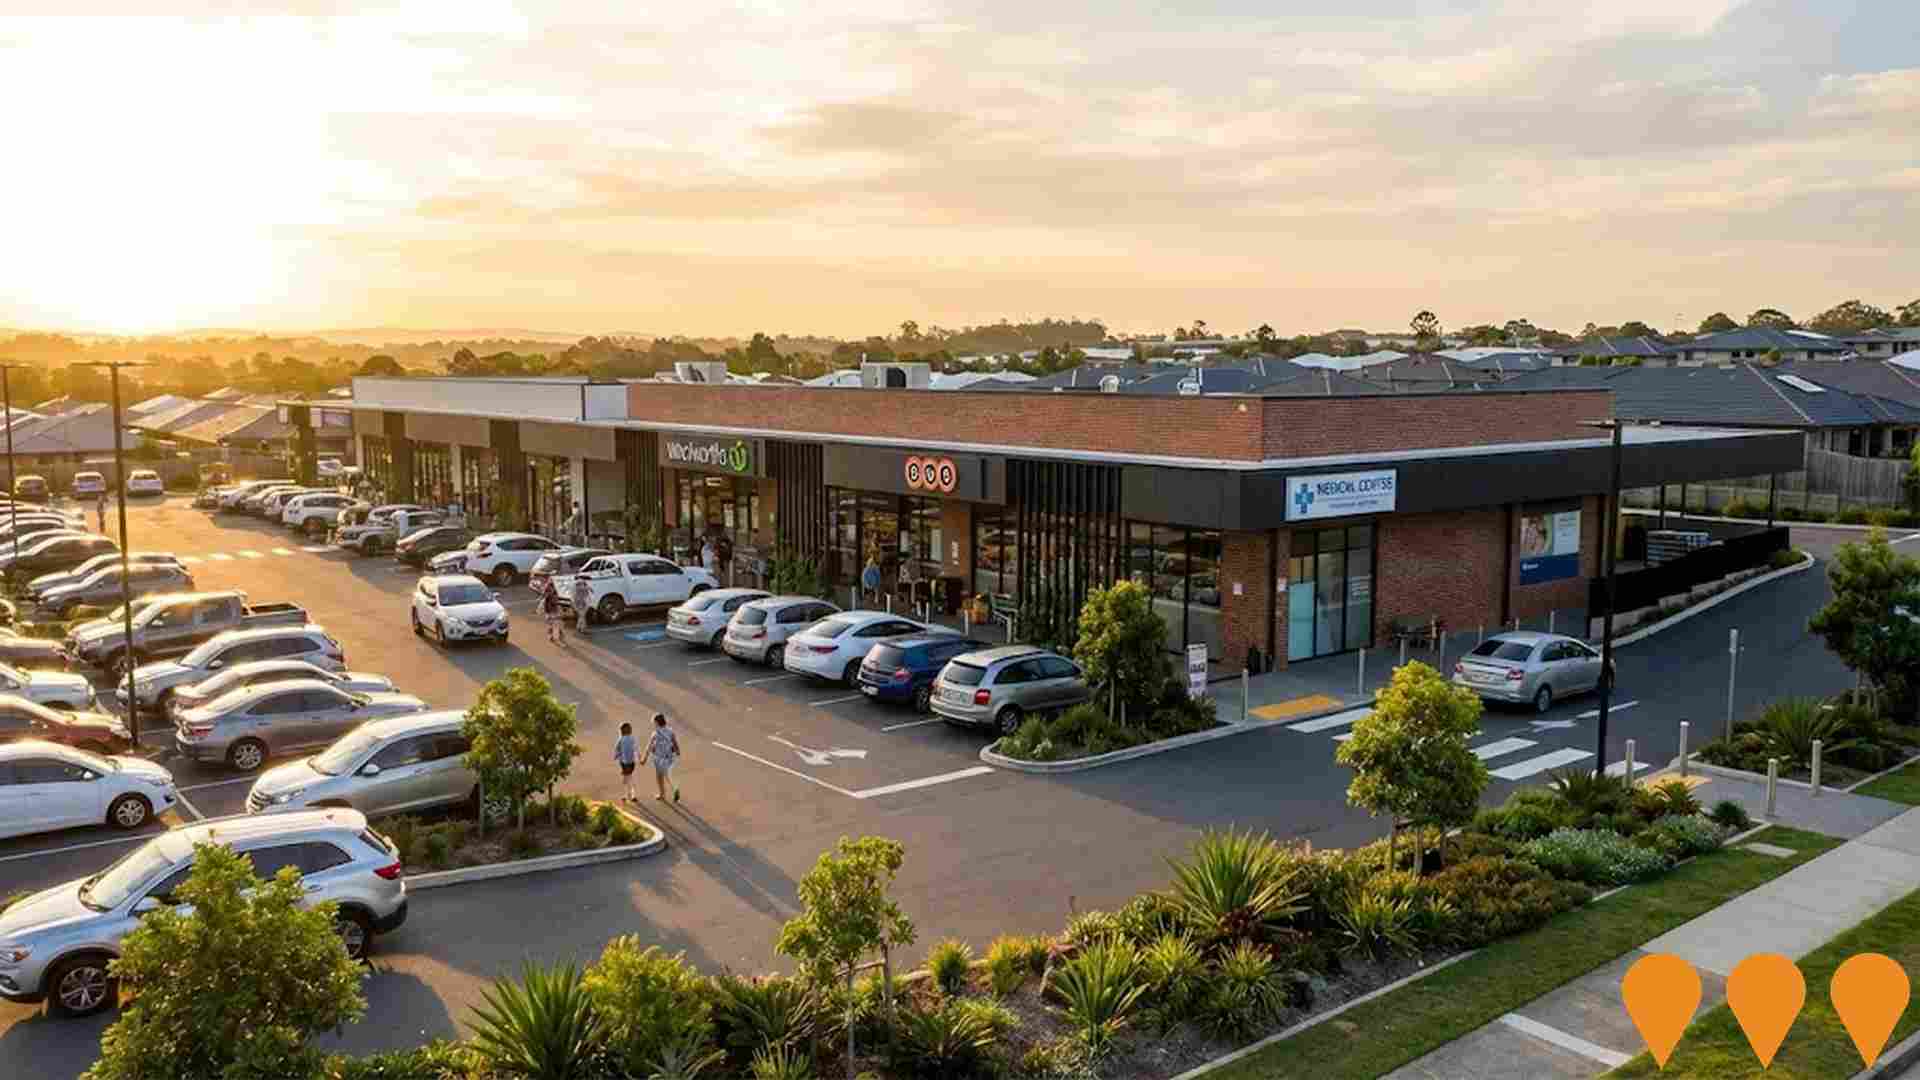
A completed neighbourhood retail centre anchored by a full-line Woolworths supermarket featuring specialty stores including BWS, Priceline Pharmacy, medical centre, cafes, dining options, nail salon and various convenience stores. The centre serves the growing residential developments in the Eden's Crossing area.
Ipswich Bus Service Improvements - Growth Areas
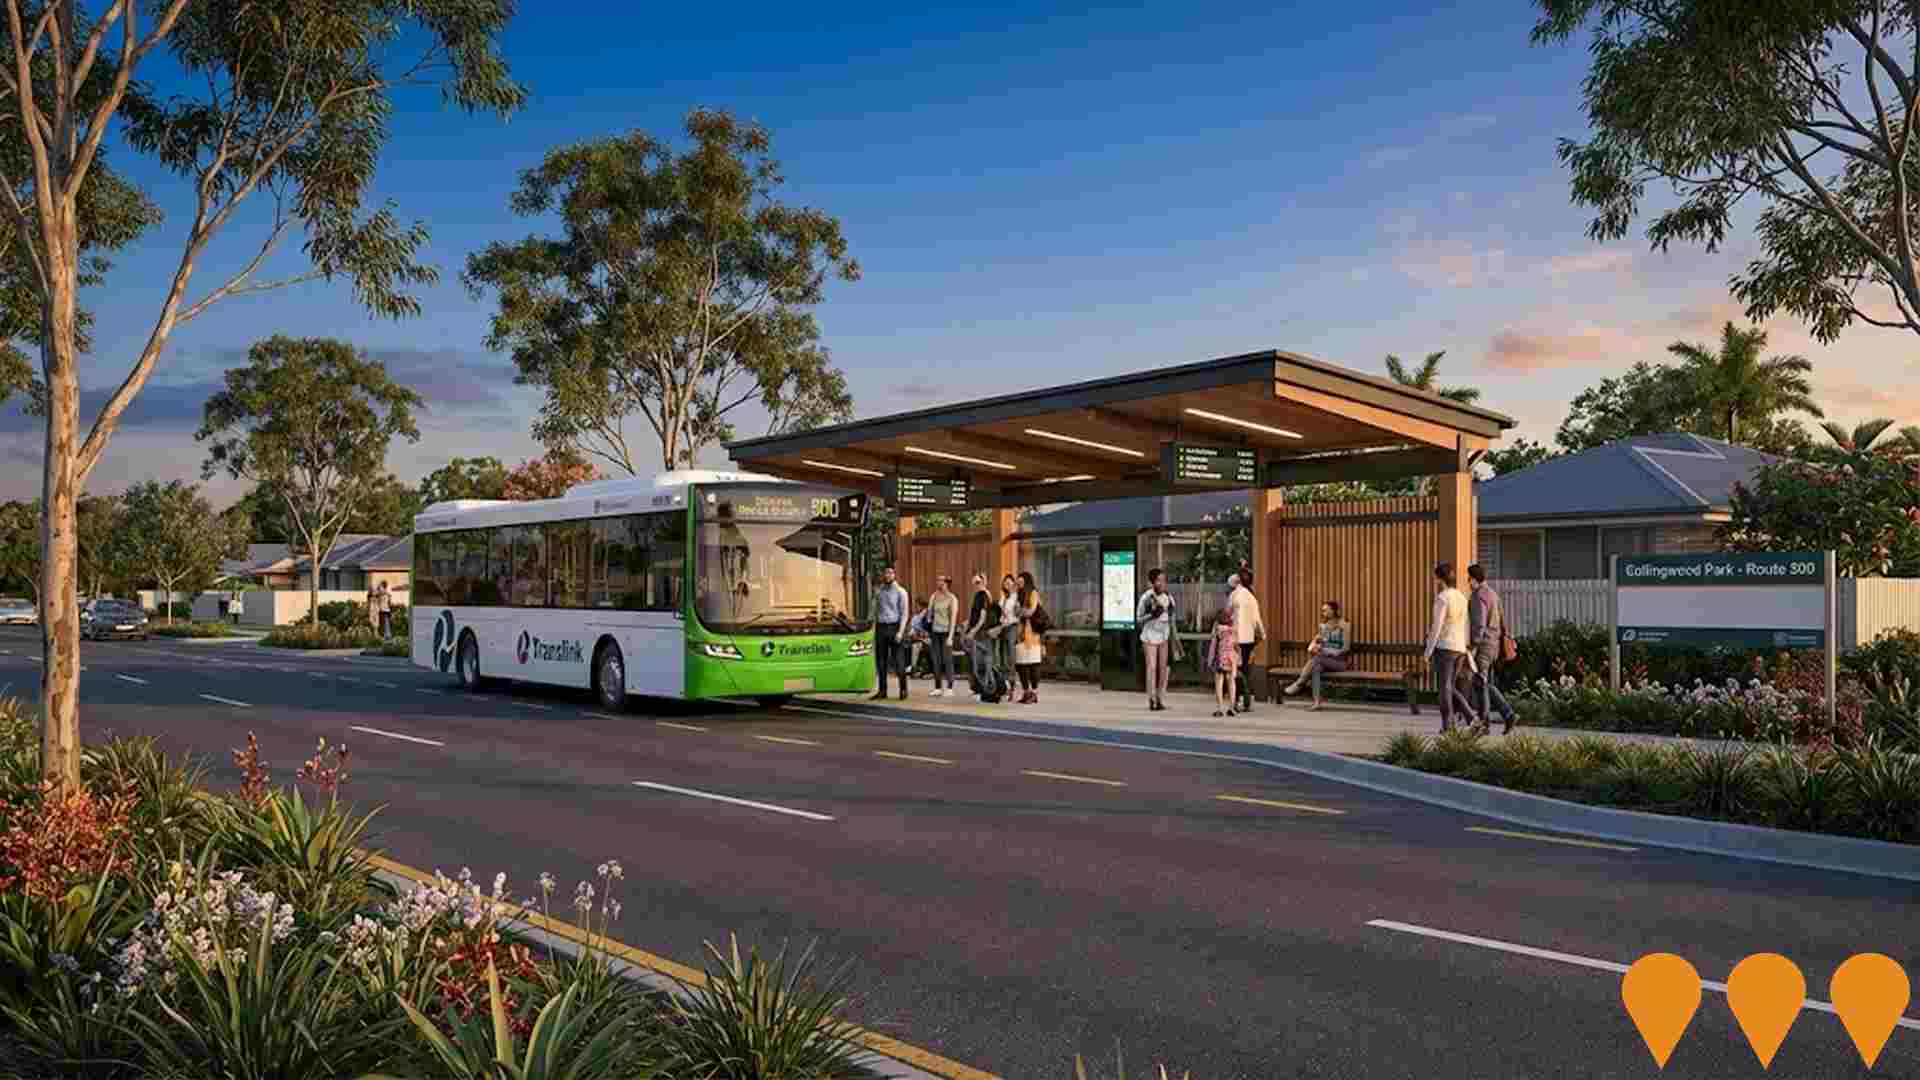
Enhanced bus services for Ipswich growth areas including Collingwood Park, featuring increased frequency, new routes, and improved connectivity to support population growth and reduce car dependency.
Employment
AreaSearch assessment positions Bellbird Park ahead of most Australian regions for employment performance
Bellbird Park has a skilled workforce with essential services sectors well represented. The unemployment rate was 3.9% in the past year, with an estimated employment growth of 4.5%.
As of September 2025, there were 5,664 residents employed, and the unemployment rate was 0.1% below Greater Brisbane's rate of 4.0%. Workforce participation was fairly standard at 68.1%, compared to Greater Brisbane's 64.5%. Leading employment industries among residents comprised health care & social assistance, manufacturing, and retail trade. Manufacturing had particularly notable concentration with employment levels at 1.6 times the regional average.
Professional & technical services were under-represented, with only 6.1% of Bellbird Park's workforce compared to Greater Brisbane's 8.9%. The area appears to offer limited local employment opportunities based on Census working population vs resident population data. Over the 12 months to September 2025, employment increased by 4.5%, while labour force increased by 3.6%, causing the unemployment rate to fall by 0.8 percentage points. In contrast, Greater Brisbane experienced employment growth of 3.8% and labour force growth of 3.3%, with a 0.5 percentage point drop in unemployment rate. State-level data from QLD as of 25-Nov shows employment contracted by 0.01% (losing 1,210 jobs), with the state unemployment rate at 4.2%, broadly in line with the national rate of 4.3%. Jobs and Skills Australia's national employment forecasts from May-25 suggest that national employment should expand by 6.6% over five years and 13.7% over ten years. Applying these projections to Bellbird Park's employment mix suggests local employment should increase by 6.2% over five years and 13.2% over ten years, based on a simple weighting extrapolation for illustrative purposes.
Frequently Asked Questions - Employment
Income
Income levels sit below national averages according to AreaSearch assessment
Bellbird Park SA2 had a median income of $49,762 and an average income of $56,661 in financial year 2022, according to the latest ATO data aggregated by AreaSearch. These figures are lower than Greater Brisbane's median income of $55,645 and average income of $70,520 for the same period. By September 2025, estimates suggest the median income will be approximately $56,724 and the average income around $64,588, based on a Wage Price Index growth rate of 13.99% since financial year 2022. The 2021 Census data shows that incomes in Bellbird Park cluster around the 53rd percentile nationally, with the majority of residents (40.9%, or 4,353 people) earning between $1,500 and $2,999. Housing affordability pressures are severe, with only 82.2% of income remaining after housing costs, ranking at the 48th percentile nationally. The area's SEIFA income ranking places it in the 4th decile.
Frequently Asked Questions - Income
Housing
Bellbird Park is characterized by a predominantly suburban housing profile, with above-average rates of outright home ownership
Bellbird Park's dwelling structures, as per the latest Census data, consisted of 84.1% houses and 16.0% other dwellings (semi-detached, apartments, 'other' dwellings), compared to Brisbane metro's 88.9% houses and 11.1% other dwellings. Home ownership in Bellbird Park was at 14.8%, similar to Brisbane metro, with the rest of dwellings either mortgaged (40.8%) or rented (44.4%). The median monthly mortgage repayment was $1,700, lower than Brisbane metro's $1,710 and the national average of $1,863. Median weekly rent in Bellbird Park was $340, below Brisbane metro's $360 and the national figure of $375.
Frequently Asked Questions - Housing
Household Composition
Bellbird Park has a typical household mix, with a lower-than-average median household size
Family households account for 75.5% of all households, including 36.8% couples with children, 21.7% couples without children, and 16.0% single parent families. Non-family households constitute the remaining 24.5%, with lone person households at 21.3% and group households comprising 3.2%. The median household size is 2.9 people, which is smaller than the Greater Brisbane average of 3.0.
Frequently Asked Questions - Households
Local Schools & Education
Bellbird Park shows below-average educational performance compared to national benchmarks, though pockets of achievement exist
The area's university qualification rate is 20.0%, significantly lower than Greater Brisbane's average of 30.5%. Bachelor degrees are the most common at 14.2%, followed by postgraduate qualifications (3.9%) and graduate diplomas (1.9%). Vocational credentials are prominent, with 42.5% of residents aged 15+ holding them. Advanced diplomas account for 12.7% and certificates for 29.8%.
Educational participation is high, with 34.0% currently enrolled in formal education. This includes 13.6% in primary, 9.0% in secondary, and 4.4% in tertiary education.
Frequently Asked Questions - Education
Schools Detail
Nearby Services & Amenities
Transport
Transport servicing is low compared to other areas nationally based on assessment of service frequency, route connectivity and accessibility
Bellbird Park has 12 operational public transport stops. These are served by buses operating along two routes, together facilitating 585 weekly passenger trips. The area's transport accessibility is limited, with residents usually residing 664 meters away from the nearest stop.
Across all routes, an average of 83 trips occur daily, translating to roughly 48 weekly trips per individual stop.
Frequently Asked Questions - Transport
Transport Stops Detail
Health
The level of general health in Bellbird Park is notably higher than the national average with prevalence of common health conditions low among the general population though higher than the nation's average across older, at risk cohorts
Bellbird Park shows better-than-average health outcomes, with lower prevalence of common conditions among its general population compared to national averages. However, older and at-risk cohorts have higher rates of these conditions. Private health cover is low in Bellbird Park, with approximately 48% coverage (~5,109 people), compared to Greater Brisbane's 50.3%.
Nationally, the average private health cover is 55.3%. Mental health issues and asthma are the most common medical conditions, affecting 9.6 and 8.7% of residents respectively. 71.1% of residents report no medical ailments, compared to Greater Brisbane's 72.4%. The area has 9.6% (1,022 people) aged 65 and over.
Frequently Asked Questions - Health
Cultural Diversity
The level of cultural diversity witnessed in Bellbird Park was found to be above average when compared nationally for a number of language and cultural background related metrics
Bellbird Park had a higher cultural diversity than most local markets, with 23.7% of its population speaking a language other than English at home and 32.5% born overseas. Christianity was the predominant religion in Bellbird Park, comprising 46.6% of the population. Notably, the 'Other' religious category had a higher representation in Bellbird Park at 2.7%, compared to 2.1% across Greater Brisbane.
In terms of ancestry, the top three groups were English (23.8%), Australian (21.3%), and Other (14.4%). There were significant differences in the representation of certain ethnic groups: Samoan was overrepresented at 4.2%, Maori at 2.4%, and New Zealand at 1.1%.
Frequently Asked Questions - Diversity
Age
Bellbird Park hosts a very young demographic, ranking in the bottom 10% of areas nationwide
Bellbird Park has a median age of 31 years, which is younger than the Greater Brisbane average of 36 and significantly below the Australian median of 38. Compared to Greater Brisbane, Bellbird Park has a higher proportion of residents aged 5-14 (16.5%) but fewer residents aged 65-74 (5.8%). Post-2021 Census data indicates that the 35-44 age group increased from 16.0% to 17.7%, while the 15-24 cohort rose from 12.6% to 13.9%. Conversely, the 25-34 cohort decreased from 18.0% to 14.9%. By 2041, demographic modeling projects significant changes in Bellbird Park's age profile, with the 45-54 age group expected to expand considerably, growing by 1,138 people (98%) from 1,163 to 2,302.
