Chart Color Schemes
est. as @ -- *
ABS ERP | -- people | --
2021 Census | -- people
Sales Activity
Curious about local property values? Filter the chart to assess the volume and appreciation (including resales) trends and regional comparisons, or scroll to the map below view this information at an individual property level.
Find a Recent Sale
Sales Detail
Population
Population growth drivers in Geeveston - Dover are strong compared to national averages based on AreaSearch's ranking of recent, and medium to long-term trends
Based on AreaSearch's analysis, Geeveston-Dover's population is around 4,462 as of Nov 2025. This reflects an increase of 411 people (10.1%) since the 2021 Census, which reported a population of 4,051 people. The change is inferred from the estimated resident population of 4,383 from the ABS as of June 2024 and an additional 136 validated new addresses since the Census date. This level of population equates to a density ratio of 5.4 persons per square kilometer. Geeveston-Dover's 10.1% growth since the 2021 census exceeded the state (4.8%) and the non-metro area, marking it as a growth leader in the region. Population growth for the area was primarily driven by interstate migration that contributed approximately 48.1% of overall population gains during recent periods.
AreaSearch is adopting ABS/Geoscience Australia projections for each SA2 area, released in 2024 with 2022 as the base year. For areas not covered by this data, Tasmania State Government's Regional/LGA projections are adopted with adjustments made employing a method of weighted aggregation of population growth from LGA to SA2 levels. Considering projected demographic shifts, an above median population growth is projected for national regional areas. The area is expected to increase by 615 persons to 2041 based on the latest population numbers, reflecting an increase of 12.0% in total over the 17 years.
Frequently Asked Questions - Population
Development
AreaSearch assessment of residential development activity positions Geeveston - Dover among the top 25% of areas assessed nationwide
Geeveston - Dover has recorded approximately 35 residential properties granted approval each year. Over the past five financial years, from FY21 to FY25179 homes were approved, with an additional 10 approved so far in FY26. On average, over these five years, each dwelling is expected to accommodate 2.5 new residents annually, indicating strong demand that supports property values.
The average construction cost of new homes is $255,000. This year, there have been $3.2 million in commercial approvals, suggesting limited focus on commercial development. Compared to the rest of Tasmania, Geeveston - Dover has recorded somewhat elevated construction activity, with an 18.0% increase per person over the five-year period, providing reasonable buyer options while sustaining existing property demand.
Recent construction comprises 88.0% detached dwellings and 12.0% townhouses or apartments, maintaining the area's traditional low-density character with a focus on family homes. The location has approximately 133 people per dwelling approval, indicating an expanding market. Looking ahead, Geeveston - Dover is expected to grow by 536 residents by 2041. Based on current development patterns, new housing supply should readily meet demand, offering good conditions for buyers and potentially facilitating further population growth beyond current projections.
Frequently Asked Questions - Development
Infrastructure
Geeveston - Dover has limited levels of nearby infrastructure activity, ranking in the 7thth percentile nationally
AreaSearch has identified two projects that could impact the area. Key projects are Huon Link Road, Huonville ReImagined: Crafting a Future Huonville, Greater Hobart Urban Growth Boundary Extension, and Tasmanian Irrigation Schemes: Tranche 3. The following list details those most relevant.
Professional plan users can use the search below to filter and access additional projects.
INFRASTRUCTURE SEARCH
 Denotes AI-based impression for illustrative purposes only, not to be taken as definitive under any circumstances. Please follow links and conduct other investigations from the project's source for actual imagery. Developers and project owners wishing us to use original imagery please Contact Us and we will do so.
Frequently Asked Questions - Infrastructure
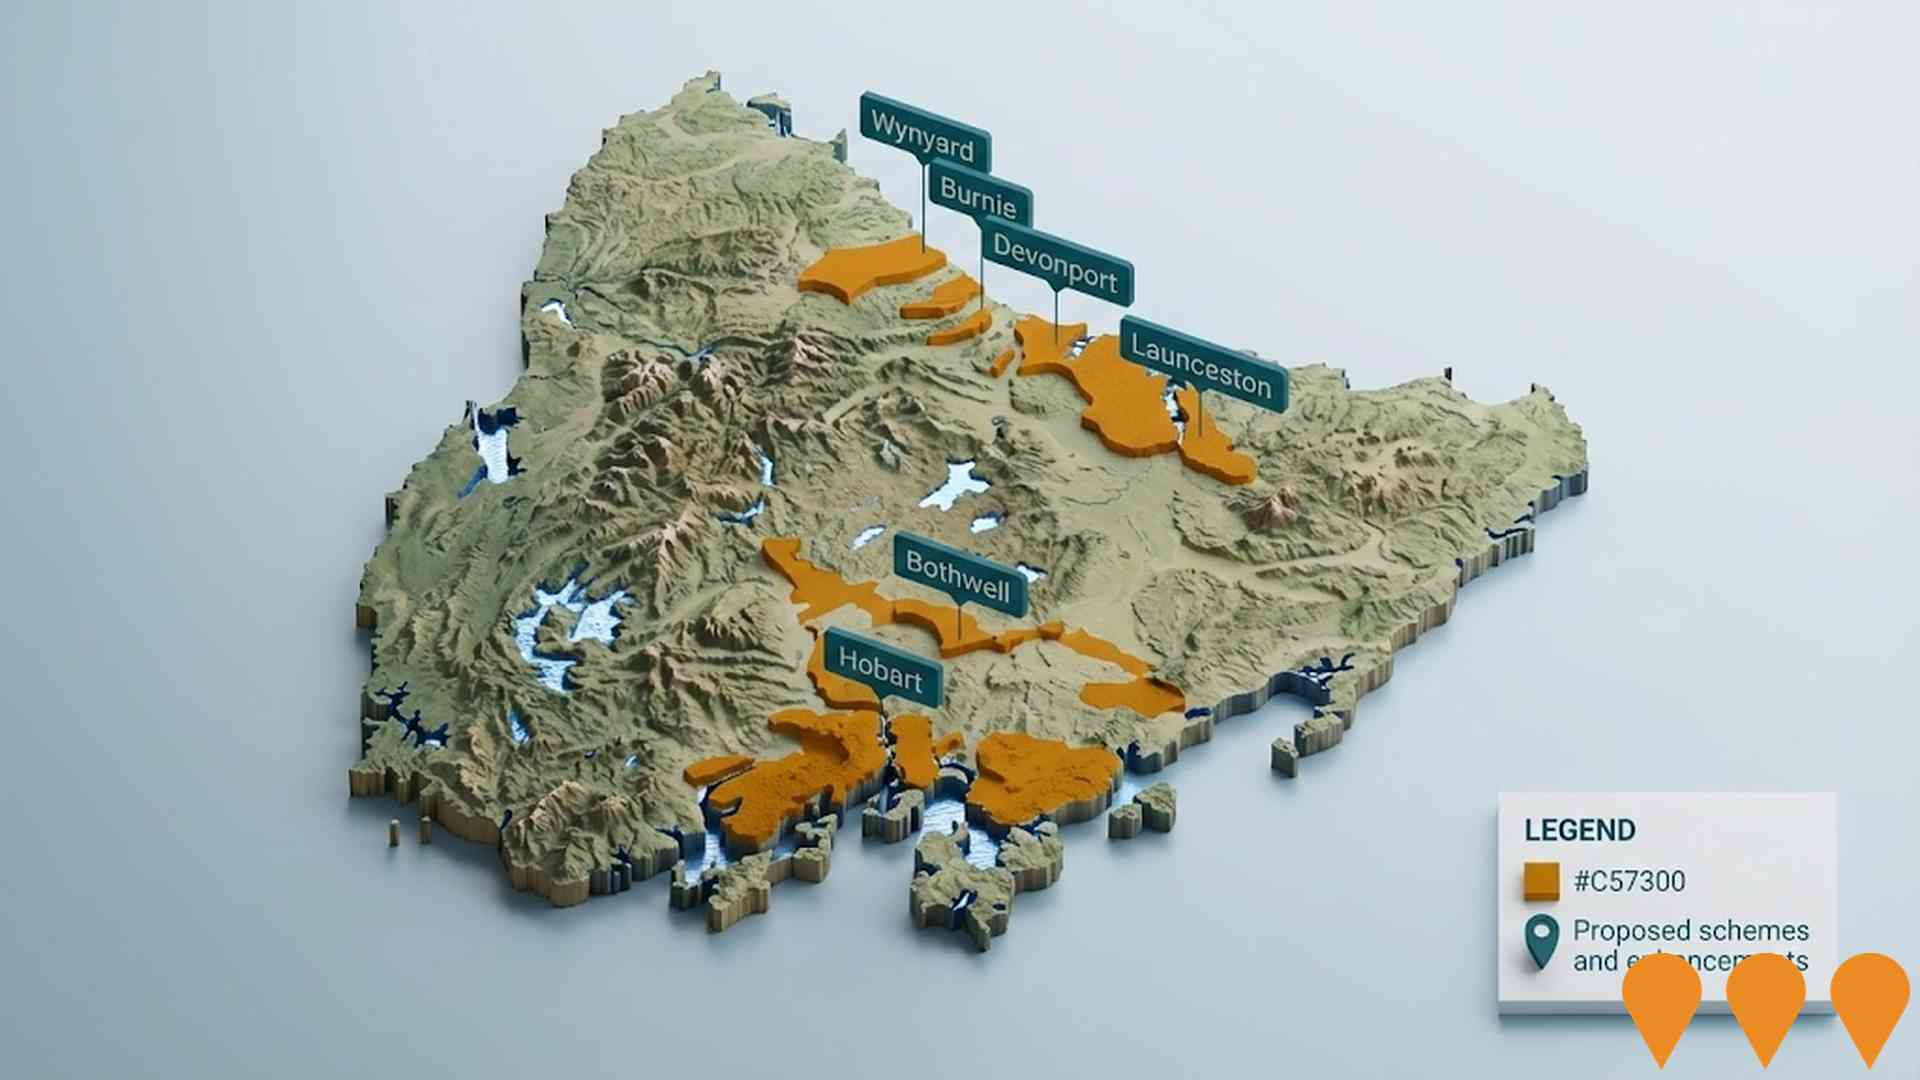
Greater Hobart Urban Growth Boundary Extension
Tasmanian Government initiative to extend the Greater Hobart urban growth boundary by 615 hectares across Brighton, Clarence, Glenorchy, Hobart, Kingborough and Sorell local government areas. Enables release of land for approximately 10,000 new homes over the next 15-20 years to address acute housing supply shortage. Approved by Parliament in November 2024 via the Land Use Planning and Approvals Amendment (Major Projects) Act 2024.
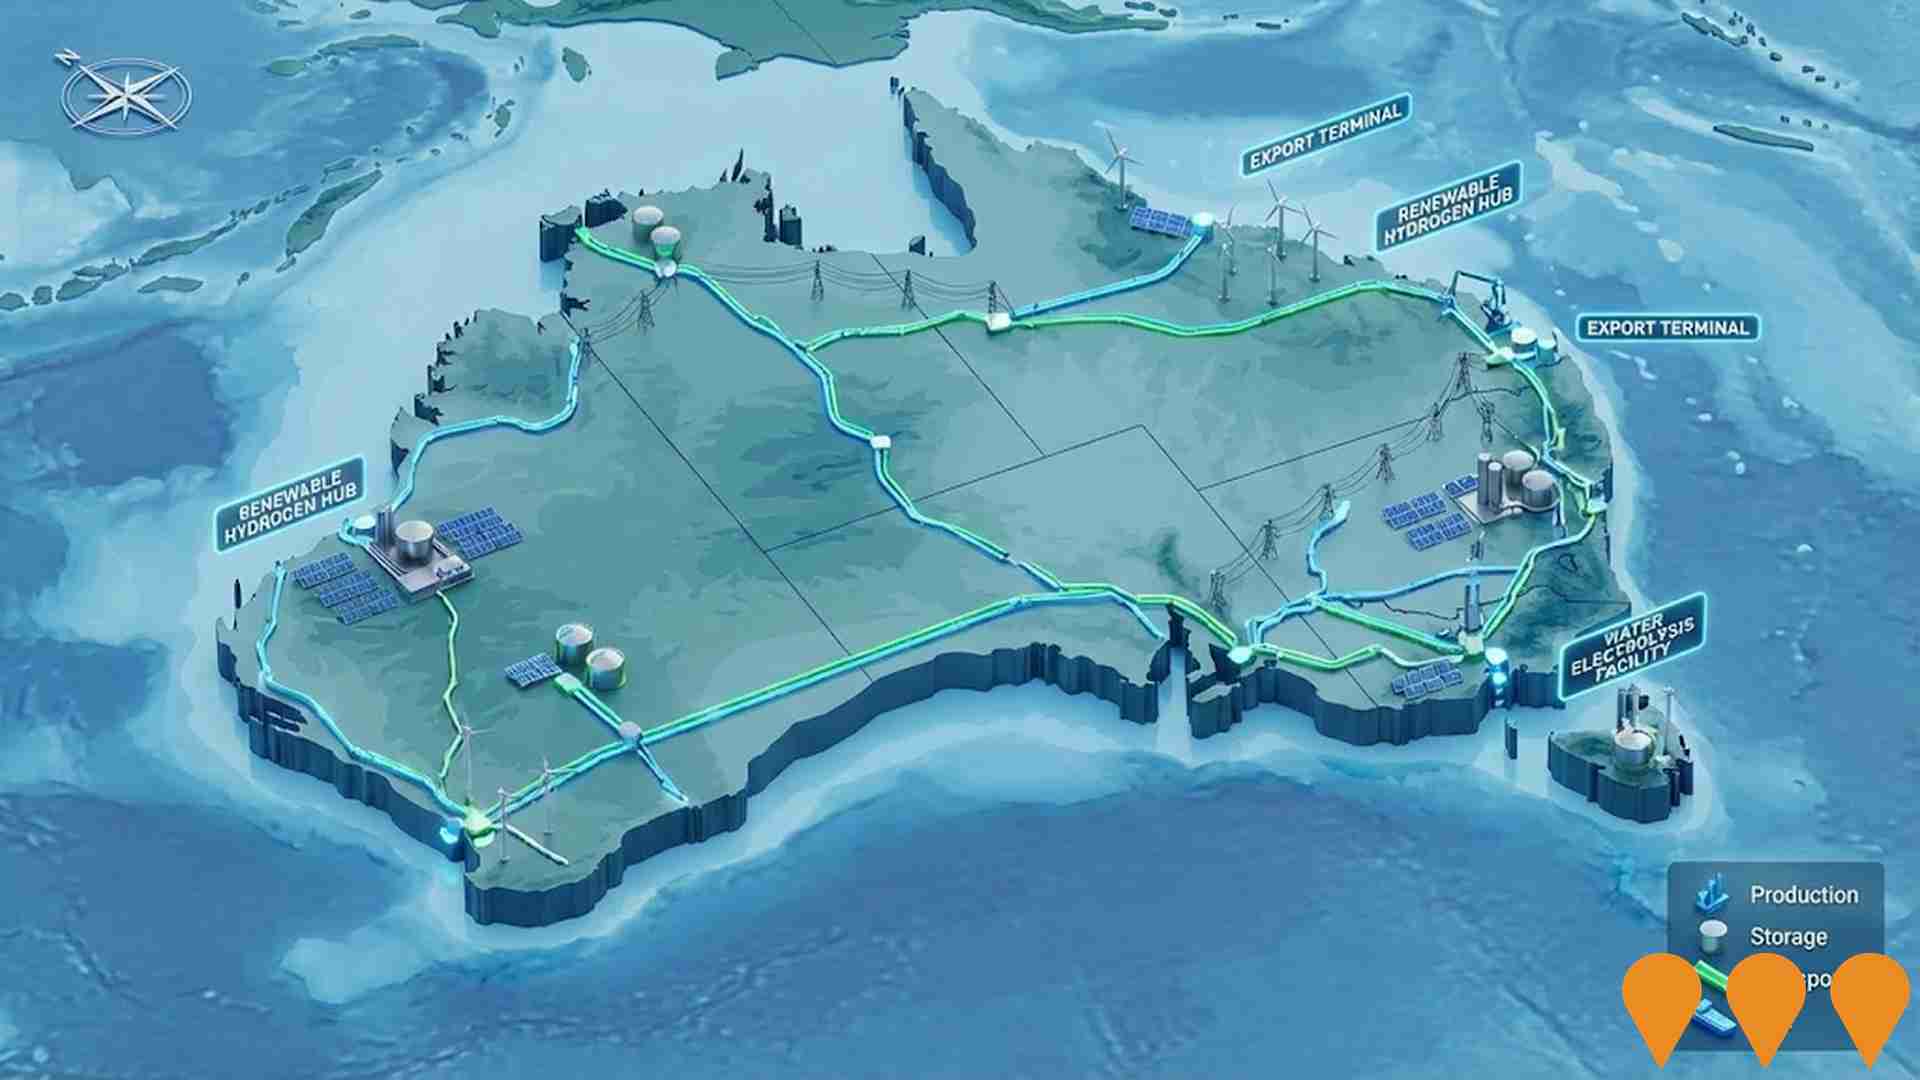
Enabling Infrastructure for Hydrogen Production
Australia has completed the National Hydrogen Infrastructure Assessment (NHIA) to 2050 and refreshed its National Hydrogen Strategy (2024). The programmatic focus has shifted to planning and enabling infrastructure through measures such as ARENA's Hydrogen Headstart and the Hydrogen Production Tax Incentive (from April 2025). Round 2 of Hydrogen Headstart consultation occurred in 2025. Collectively these actions aim to coordinate investment in transport, storage, water and electricity inputs linked to Renewable Energy Zones and priority hubs, supporting large-scale renewable hydrogen production and future export supply chains.
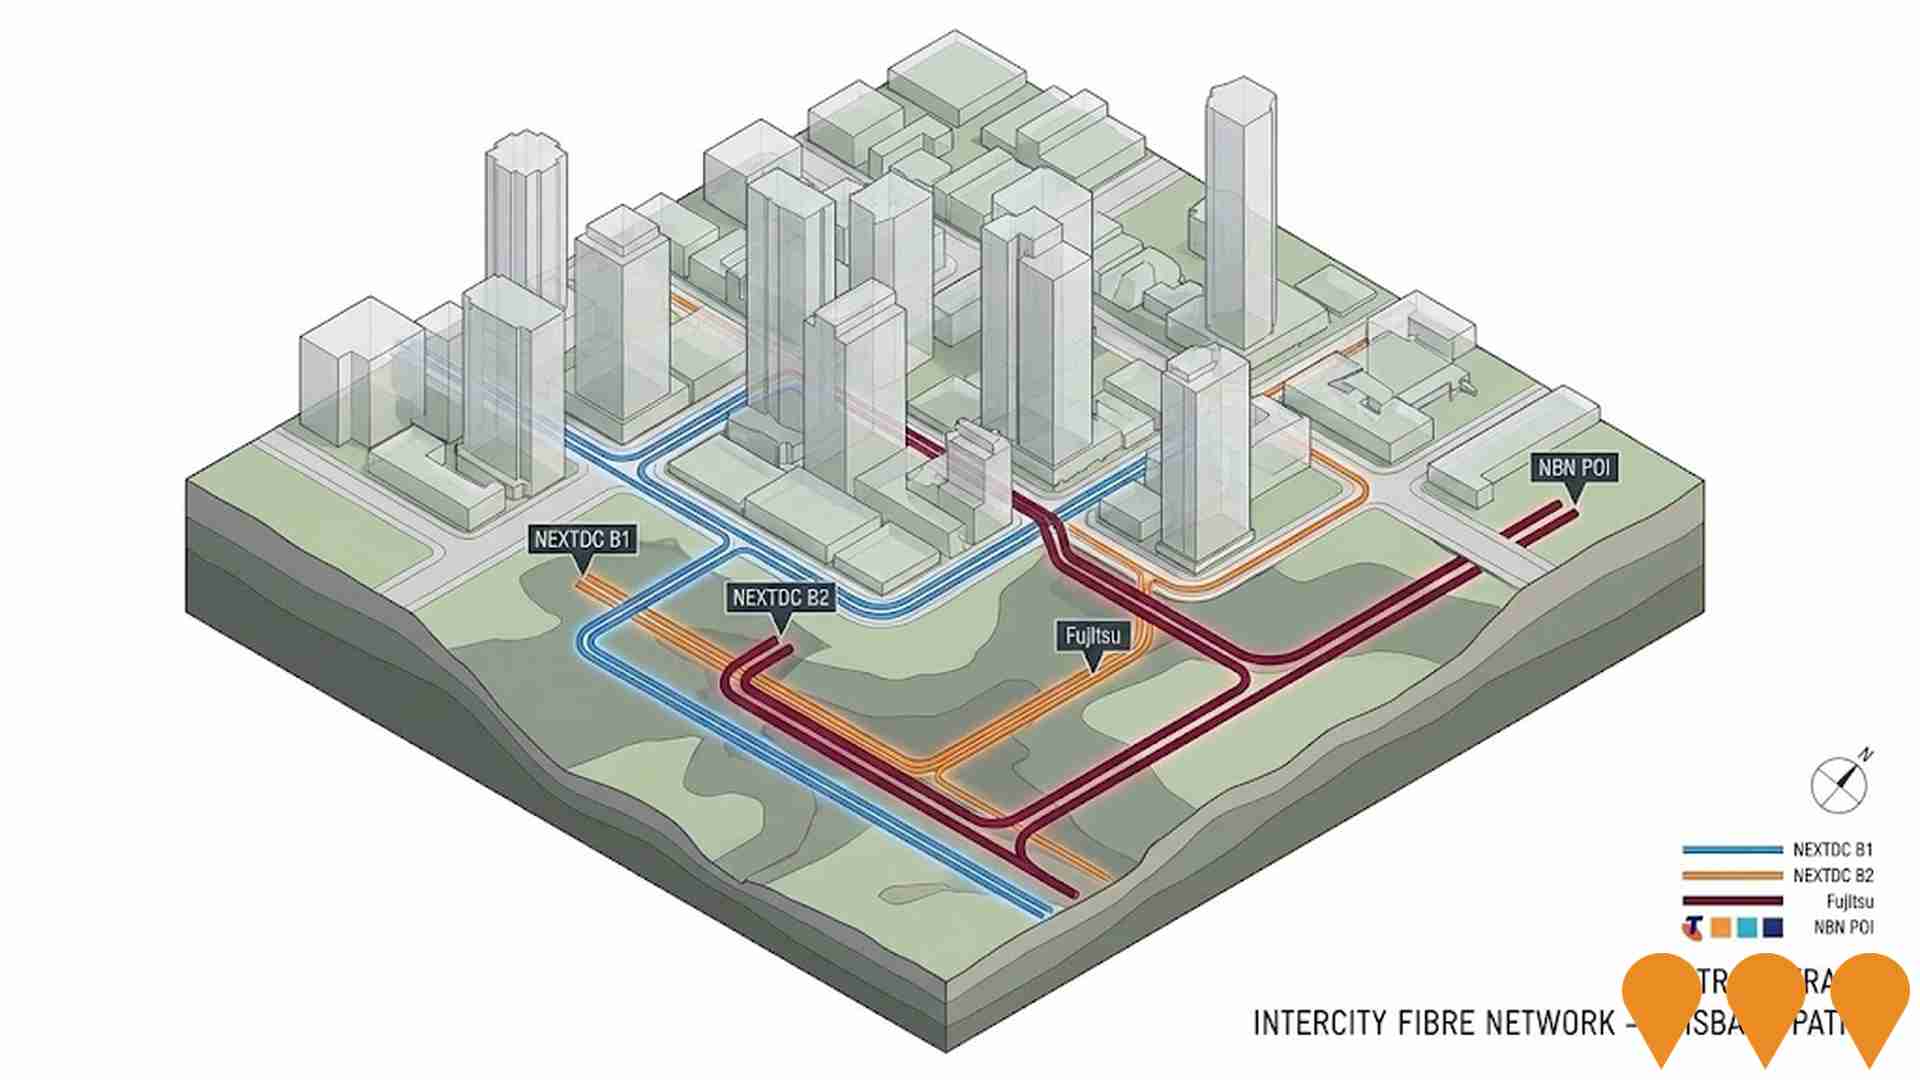
Enabling Digital Health Services for Regional and Remote Australia
National initiative to expand and improve digital health access for people in regional and remote Australia. Focus areas include enabling telehealth and virtual care, upgrading clinical systems and connectivity, supporting secure information exchange, and building workforce capability in digital health, aligned with the Australian Government's Digital Health Blueprint and Action Plan 2023-2033.

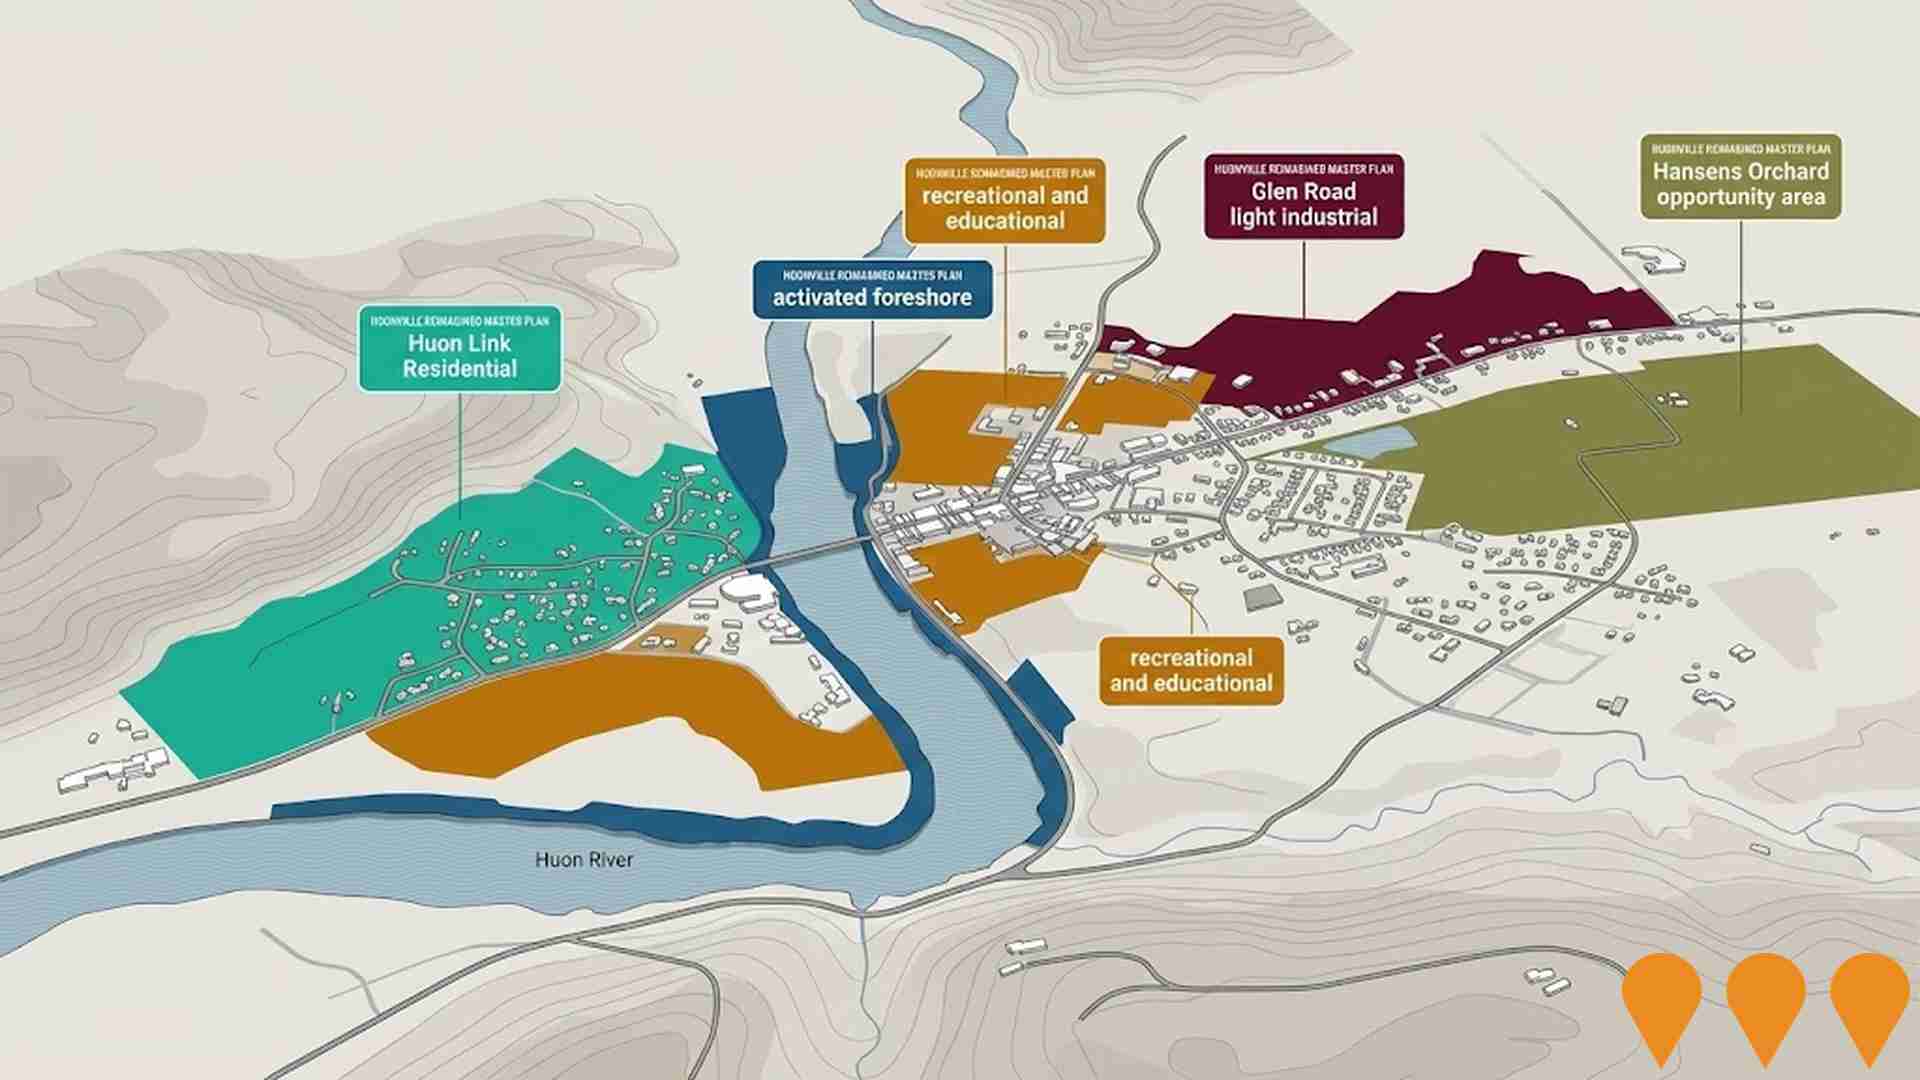
Huonville ReImagined: Crafting a Future Huonville
A master-planning and business-case project funded by the Australian Government to develop precinct plans for five key areas in Huonville, including Huon Link Residential, activated foreshore and mixed-use, recreational and educational, Glen Road light industrial, and Hansens Orchard opportunity area. The project aims to transform Huonville into a vibrant, resilient regional town addressing housing, jobs, education, economic growth, health, transport, and climate adaptation.
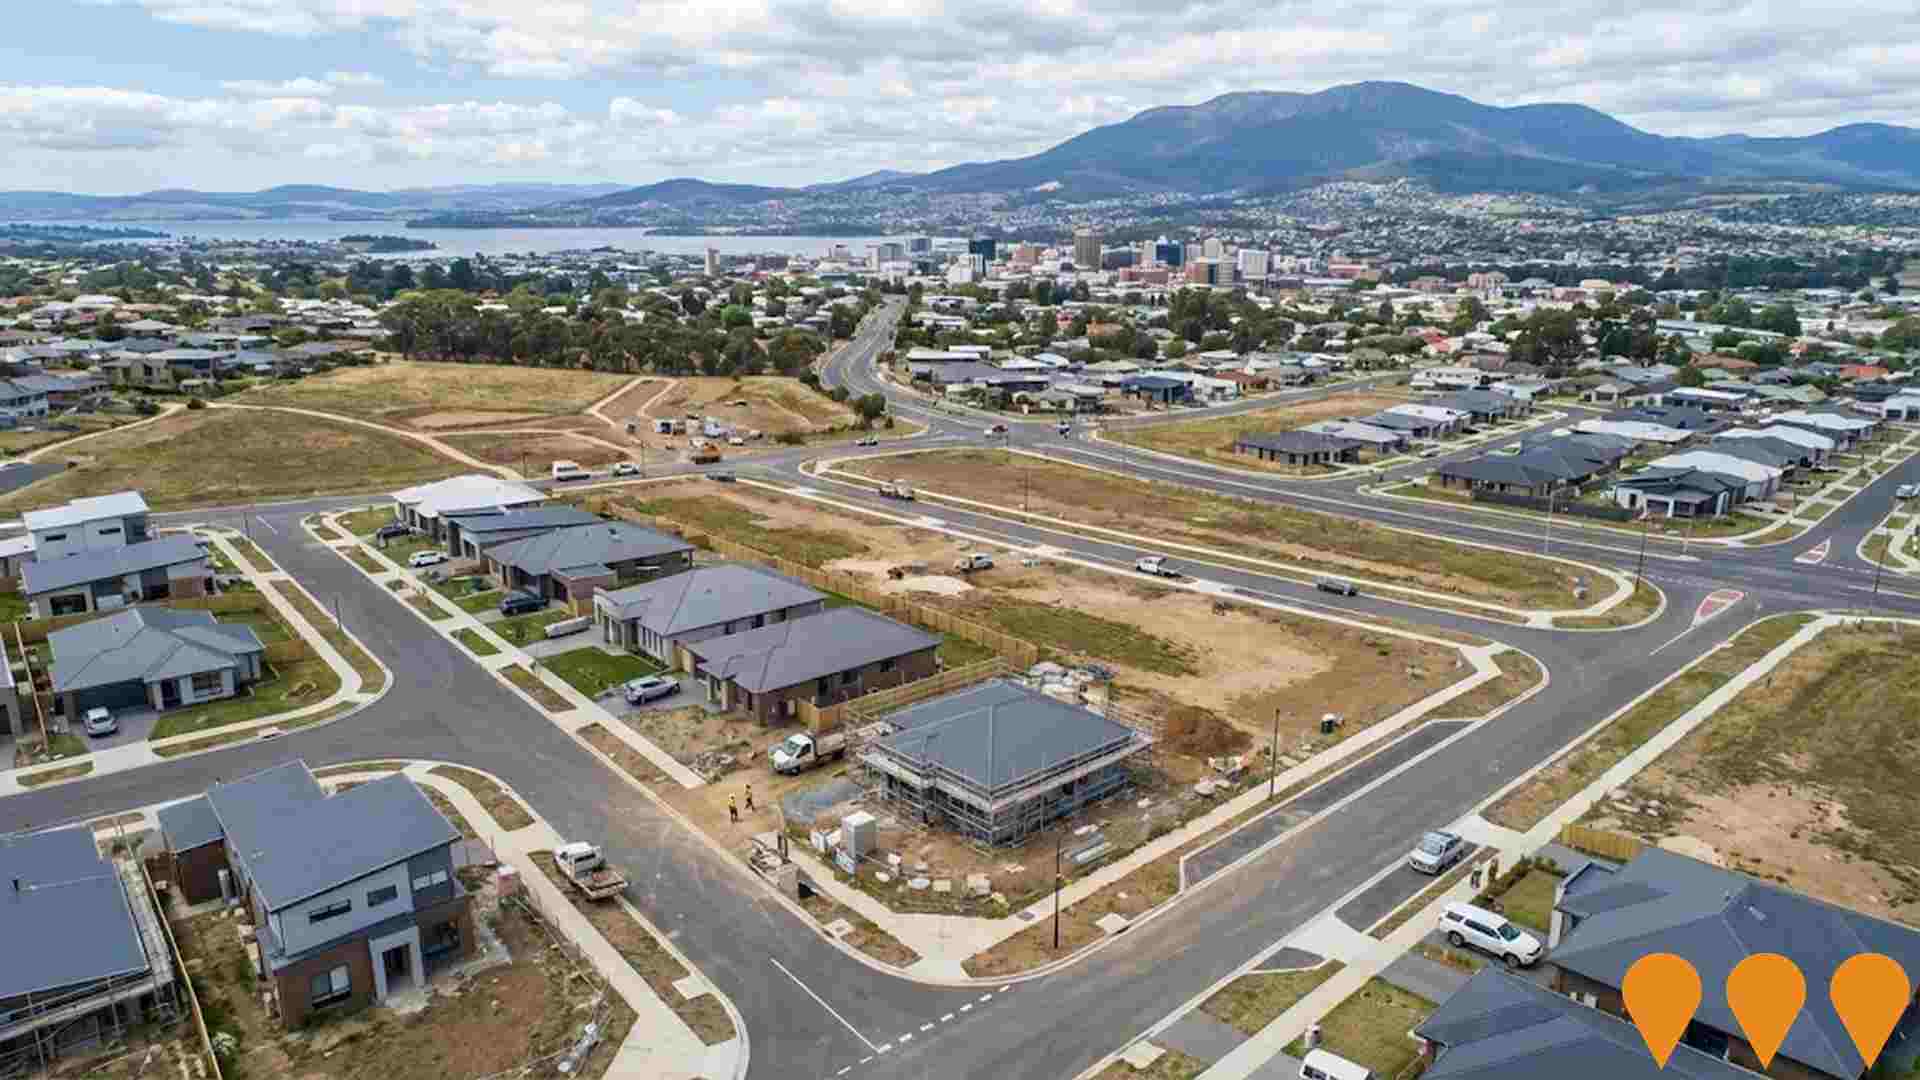
Huon Link Road
The Huon Link Road is a new bypass road around the eastern side of Huonville town centre, connecting the Huon Highway to the Channel Highway via Flood Road. It diverts Cygnet-bound traffic from Main Street, reducing congestion, improving safety and accessibility, and providing a reliable alternative route during floods. The project includes roundabouts at both ends and upgrades to Flood Road. It opened to traffic on March 24, 2025, and was fully completed in May 2025.

Tasmanian Irrigation Schemes: Tranche 3
Development of sustainable water capture and distribution systems in Tasmania to enhance agricultural productivity by enabling dryland farms to transition to higher-value enterprises like fruit or viticulture.
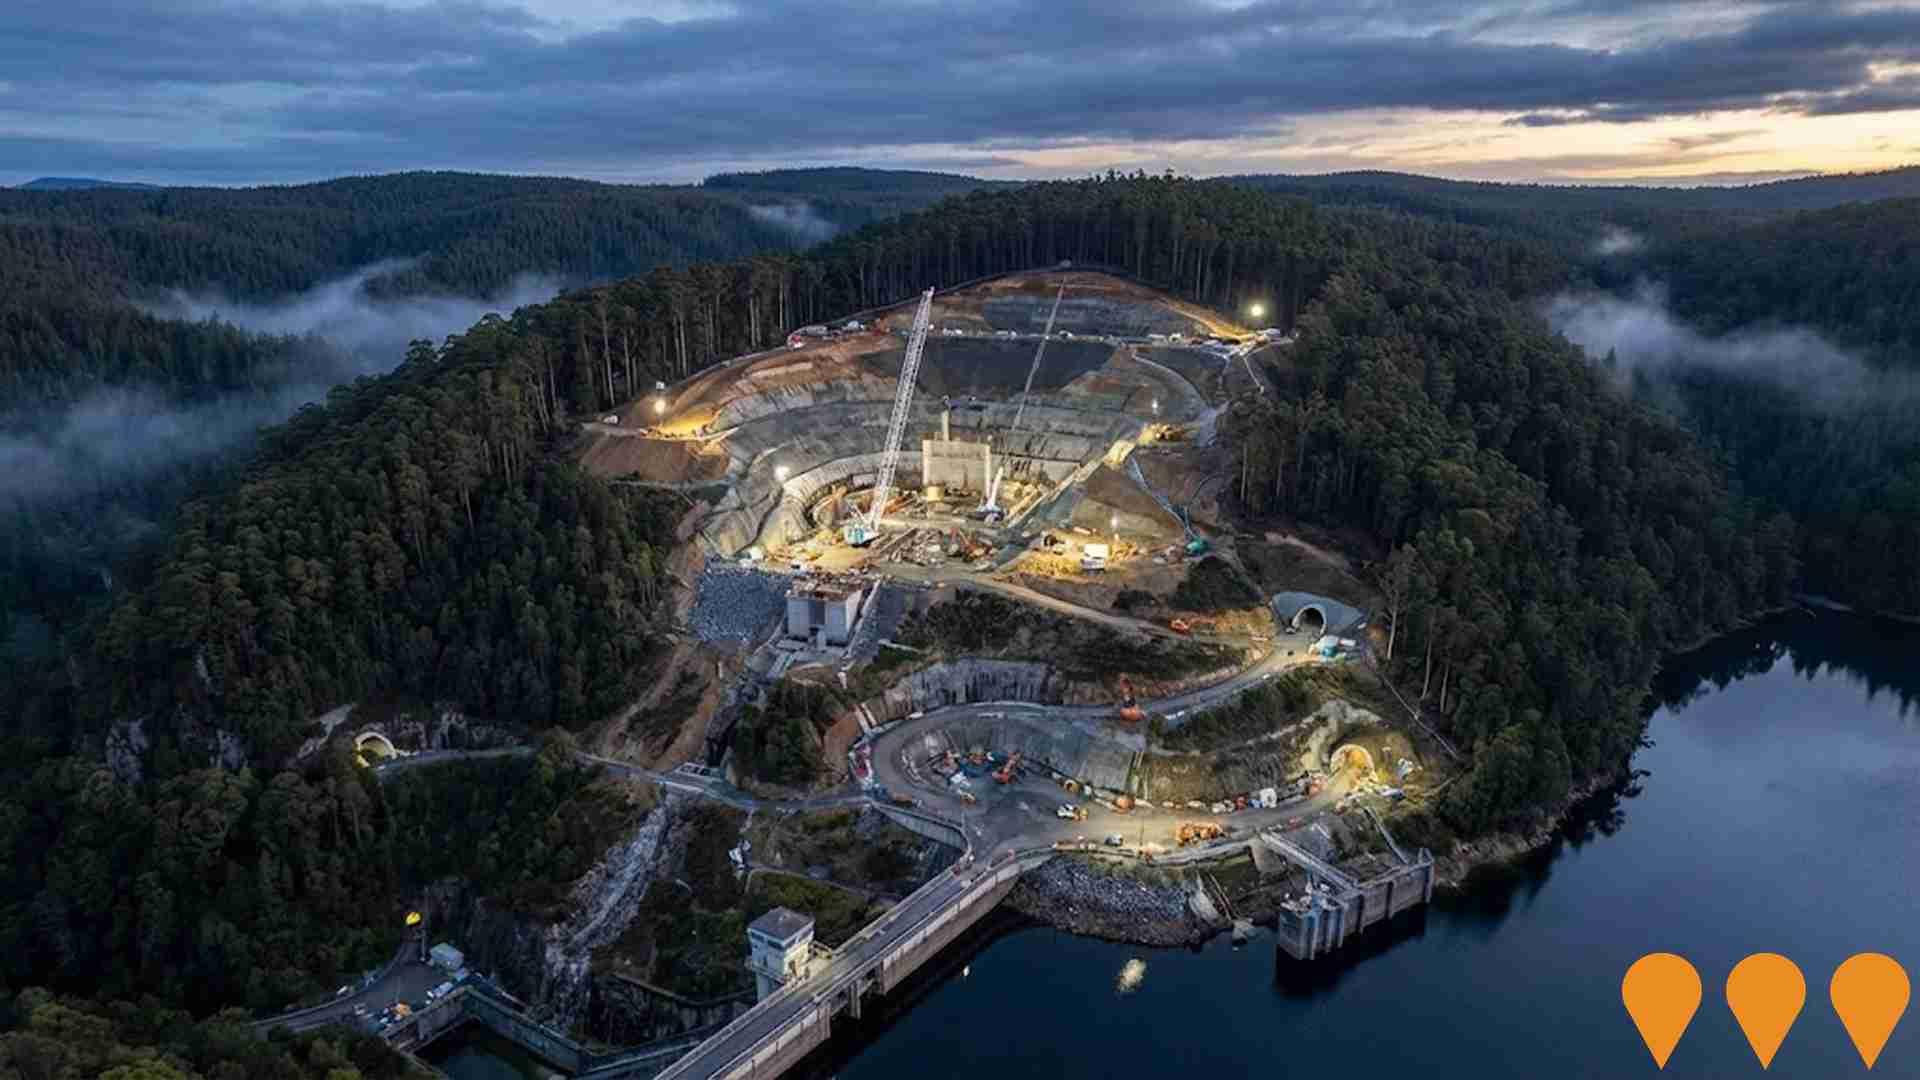
Cethana Pumped Hydro Energy Storage Project
The Cethana pumped hydro project, led by Hydro Tasmania, is part of the Battery of the Nation initiative to enhance Tasmania's renewable storage and generation. It utilizes Lake Cethana as the lower storage, with a new upper storage, underground power station, and tunnels. The project has a generating capacity of 750 MW and storage capacity of 20 hours, requiring transmission upgrades and Marinus Link interconnection.
Marinus Link
Marinus Link involves constructing a second undersea electricity link and supporting infrastructure between Tasmania and Victoria, enhancing the existing Basslink interconnector. The project, part of Project Marinus, includes transmission lines and network upgrades.
Employment
Despite maintaining a low unemployment rate of 3.9%, Geeveston - Dover has experienced recent job losses, resulting in a below average employment performance ranking when compared nationally
Geeveston-Dover has a skilled workforce with diverse sector representation and an unemployment rate of 3.9% as of June 2025. There are 1667 residents employed while the unemployment rate aligns with Rest of Tas.'s rate of 3.9%.
Workforce participation, however, lags at 48.8%, compared to Rest of Tas.'s 55.7%. Employment is concentrated in agriculture, forestry & fishing, health care & social assistance, and education & training. The area has a notable concentration in agriculture, forestry & fishing with employment levels at 3.1 times the regional average. Health care & social assistance is under-represented with only 11.2% of Geeveston-Dover's workforce compared to Rest of Tas.'s 16.5%.
The area appears to offer limited local employment opportunities, as indicated by a decrease in labour force levels by 5.0% and employment decline by 6.0% over the year to June 2025. Jobs and Skills Australia forecasts national employment growth of 6.6% over five years and 13.7% over ten years. Applying these projections to Geeveston-Dover's employment mix suggests local growth of approximately 5.3% over five years and 11.7% over ten years.
Frequently Asked Questions - Employment
Income
Income metrics place the area in the bottom 10% of locations nationally according to AreaSearch analysis
AreaSearch's latest postcode level ATO data for financial year 2022 shows Geeveston - Dover had a median income among taxpayers of $42,691 and an average of $50,114. This is below the national average. The Rest of Tas., in comparison, had a median income of $47,358 and an average of $57,384. Based on Wage Price Index growth of 13.83% since financial year 2022, current estimates for Geeveston - Dover would be approximately $48,595 (median) and $57,045 (average) as of September 2025. According to the 2021 Census, household, family and personal incomes in Geeveston - Dover all fall between the 5th and 6th percentiles nationally. The income distribution shows that 29.6% of the community earns between $400 and $799 (1,320 individuals). Housing costs are modest with 88.0% of income retained, but total disposable income ranks at just the 10th percentile nationally.
Frequently Asked Questions - Income
Housing
Geeveston - Dover is characterized by a predominantly suburban housing profile, with above-average rates of outright home ownership
In Geeveston - Dover, as per the latest Census, 97.6% of dwellings were houses while 2.4% comprised semi-detached homes, apartments, and other types. In comparison, Non-Metro Tas. had 96.8% houses and 3.2% other dwellings. Home ownership in Geeveston - Dover stood at 50.7%, with mortgaged properties at 34.9% and rented ones at 14.4%. The median monthly mortgage repayment was $1,083, lower than Non-Metro Tas.'s average of $1,300. The median weekly rent in the area was $280, compared to Non-Metro Tas.'s $290. Nationally, Geeveston - Dover's mortgage repayments were significantly lower at $1,083 versus Australia's average of $1,863, while rents were substantially below the national figure of $375.
Frequently Asked Questions - Housing
Household Composition
Geeveston - Dover features high concentrations of lone person households, with a lower-than-average median household size
Family households constitute 66.3% of all households, including 21.7% couples with children, 34.4% couples without children, and 9.3% single parent families. Non-family households make up the remaining 33.7%, comprising 31.0% lone person households and 3.0% group households. The median household size is 2.2 people, which is smaller than the Rest of Tas. average of 2.4.
Frequently Asked Questions - Households
Local Schools & Education
Geeveston - Dover faces educational challenges, with performance metrics placing it in the bottom quartile of areas assessed nationally
The area's university qualification rate is 19.5%, significantly lower than the Australian average of 30.4%. This presents both challenges and opportunities for targeted educational initiatives. Bachelor degrees are most prevalent at 12.4%, followed by postgraduate qualifications (5.2%) and graduate diplomas (1.9%). Trade and technical skills are prominent, with 38.9% of residents aged 15+ holding vocational credentials - advanced diplomas (10.4%) and certificates (28.5%).
A total of 24.2% of the population is actively pursuing formal education, including 10.6% in primary education, 6.5% in secondary education, and 2.5% in tertiary education. Geeveston-Dover's 3 schools have a combined enrollment of 325 students, with varied educational conditions across the area. The educational mix includes 2 primary schools and 1 K-12 school.
Frequently Asked Questions - Education
Schools Detail
Nearby Services & Amenities
Transport
No public transport data available for this catchment area.
Frequently Asked Questions - Transport
Transport Stops Detail
Health
Health performance in Geeveston - Dover is well below average with prevalence of common health conditions notable across both younger and older age cohorts
Health data indicates significant challenges in Geeveston - Dover, with high prevalence of common health conditions across both younger and older age groups. Private health cover is notably low at approximately 46% (around 2,061 people), compared to the national average of 55.3%.
The most prevalent medical conditions are arthritis (affecting 12.8%) and mental health issues (impacting 10.2%). Notably, 60.4% of residents claim to be free from medical ailments, slightly lower than the Rest of Tas. average of 62.7%. The area has a higher proportion of seniors aged 65 and over at 27.9% (1,244 people), compared to Rest of Tas.'s 25.4%. Despite this, health outcomes among seniors are above average, performing better than the general population in various health metrics.
Frequently Asked Questions - Health
Cultural Diversity
Geeveston - Dover is considerably less culturally diverse than average when assessed alongside AreaSearch's national rankings for language and cultural background related metrics
Geeveston-Dover, as per the census data from June 2016, showed low cultural diversity with 88.8% of its population being Australian citizens and 83.8% born in Australia. English was spoken exclusively at home by 95.9% of residents. Christianity was the predominant religion, accounting for 39.3%.
The 'Other' religious category comprised 0.8%, slightly higher than the regional average of 0.7%. In terms of ancestry, the top groups were English (32.8%), Australian (29.4%), and Irish (8.6%). Notably, Australian Aboriginal (7.4%) and New Zealand (0.8%) ethnicities were overrepresented compared to regional averages of 5.7% and 0.5%, respectively. Hungarian ethnicity was also slightly overrepresented at 0.3%.
Frequently Asked Questions - Diversity
Age
Geeveston - Dover ranks among the oldest 10% of areas nationwide
The median age in Geeveston-Dover is 50 years, which is significantly higher than the Rest of Tasmania's average of 45 and the national norm of 38. The 55-64 age cohort is notably over-represented in Geeveston-Dover at 17.1%, compared to the Rest of Tasmania's average, while the 15-24 age group is under-represented at 7.9%. This concentration of the 55-64 age group is well above the national average of 11.2%. Between 2021 and present, the 75 to 84 age group has grown from 7.5% to 10.4%, while the 25 to 34 cohort increased from 8.5% to 10.3%. Conversely, the 55 to 64 age group has declined from 18.8% to 17.1%. Population forecasts for 2041 indicate substantial demographic changes in Geeveston-Dover, with the 75 to 84 cohort projected to grow by 51%, adding 237 residents to reach 702. Residents aged 65 and above will drive 64% of population growth, highlighting demographic aging trends. Conversely, both the 5 to 14 and 55 to 64 age groups are projected to decrease in numbers.
