Chart Color Schemes
This analysis uses ABS Statistical Areas Level 2 (SA2) boundaries, which can materially differ from Suburbs and Localities (SAL) even when sharing similar names.
SA2 boundaries are defined by the Australian Bureau of Statistics and are designed to represent communities for statistical reporting (e.g., census and ERP).
Suburbs and Localities (SAL) represent commonly-used suburb/locality names (postal-style areas) and may use different geographic boundaries. For comprehensive analysis, consider reviewing both boundary types if available.
est. as @ -- *
ABS ERP | -- people | --
2021 Census | -- people
Sales Activity
Curious about local property values? Filter the chart to assess the volume and appreciation (including resales) trends and regional comparisons, or scroll to the map below view this information at an individual property level.
Find a Recent Sale
Sales Detail
Population
Happy Valley is positioned among the lower quartile of areas assessed nationally for population growth based on AreaSearch's assessment of recent, and medium term trends
Based on AreaSearch's analysis, Happy Valley's population is around 14,443 as of Nov 2025. This reflects an increase of 579 people (4.2%) since the 2021 Census, which reported a population of 13,864 people. The change is inferred from the estimated resident population of 14,421 from the ABS as of June 2024 and an additional 52 validated new addresses since the Census date. This level of population equates to a density ratio of 1,420 persons per square kilometer, which is above the average seen across national locations assessed by AreaSearch. Happy Valley's 4.2% growth since census positions it within 0.7 percentage points of the SA3 area (4.9%), demonstrating competitive growth fundamentals. Population growth for the area was primarily driven by natural growth that contributed approximately 52.4% of overall population gains during recent periods, although all drivers including overseas migration and interstate migration were positive factors.
AreaSearch is adopting ABS/Geoscience Australia projections for each SA2 area, as released in 2024 with 2022 as the base year. For any SA2 areas not covered by this data, and for years post-2032, the SA State Government's Regional/LGA projections by age category, released in 2023 and based on 2021 data, are adopted with adjustments made employing a method of weighted aggregation of population growth from LGA to SA2 levels. Considering the projected demographic shifts, a population increase just below the median of Australian statistical areas is expected, with the area expected to increase by 1,122 persons to 2041 based on the latest annual ERP population numbers, reflecting an increase of 7.6% in total over the 17 years.
Frequently Asked Questions - Population
Development
AreaSearch analysis of residential development drivers sees Happy Valley recording a relatively average level of approval activity when compared to local markets analysed countrywide
Between FY-21 and FY-25, Happy Valley recorded approximately 27 residential properties granted approval annually, totalling 135 homes. As of FY-26, 6 approvals have been recorded. On average, about 3.9 people moved to the area each year for each dwelling built during these years. This demand significantly outpaces supply, which typically puts upward pressure on prices and increases competition among buyers.
The average construction cost value of new homes was $253,000. In FY-26, $3.7 million in commercial approvals have been registered, reflecting the area's primarily residential nature. Compared to Greater Adelaide, Happy Valley records markedly lower building activity, 61.0% below the regional average per person. This constrained new construction usually reinforces demand and pricing for existing dwellings. The recent development has been entirely comprised of detached dwellings, sustaining the area's suburban identity with a concentration of family homes suited to buyers seeking space.
The location has approximately 633 people per dwelling approval, demonstrating an established market. Population forecasts indicate Happy Valley will gain 1,100 residents through to 2041 (from the latest AreaSearch quarterly estimate). Building activity is keeping pace with growth projections, though buyers may experience heightened competition as the population grows.
Frequently Asked Questions - Development
Infrastructure
Happy Valley has limited levels of nearby infrastructure activity, ranking in the 13thth percentile nationally
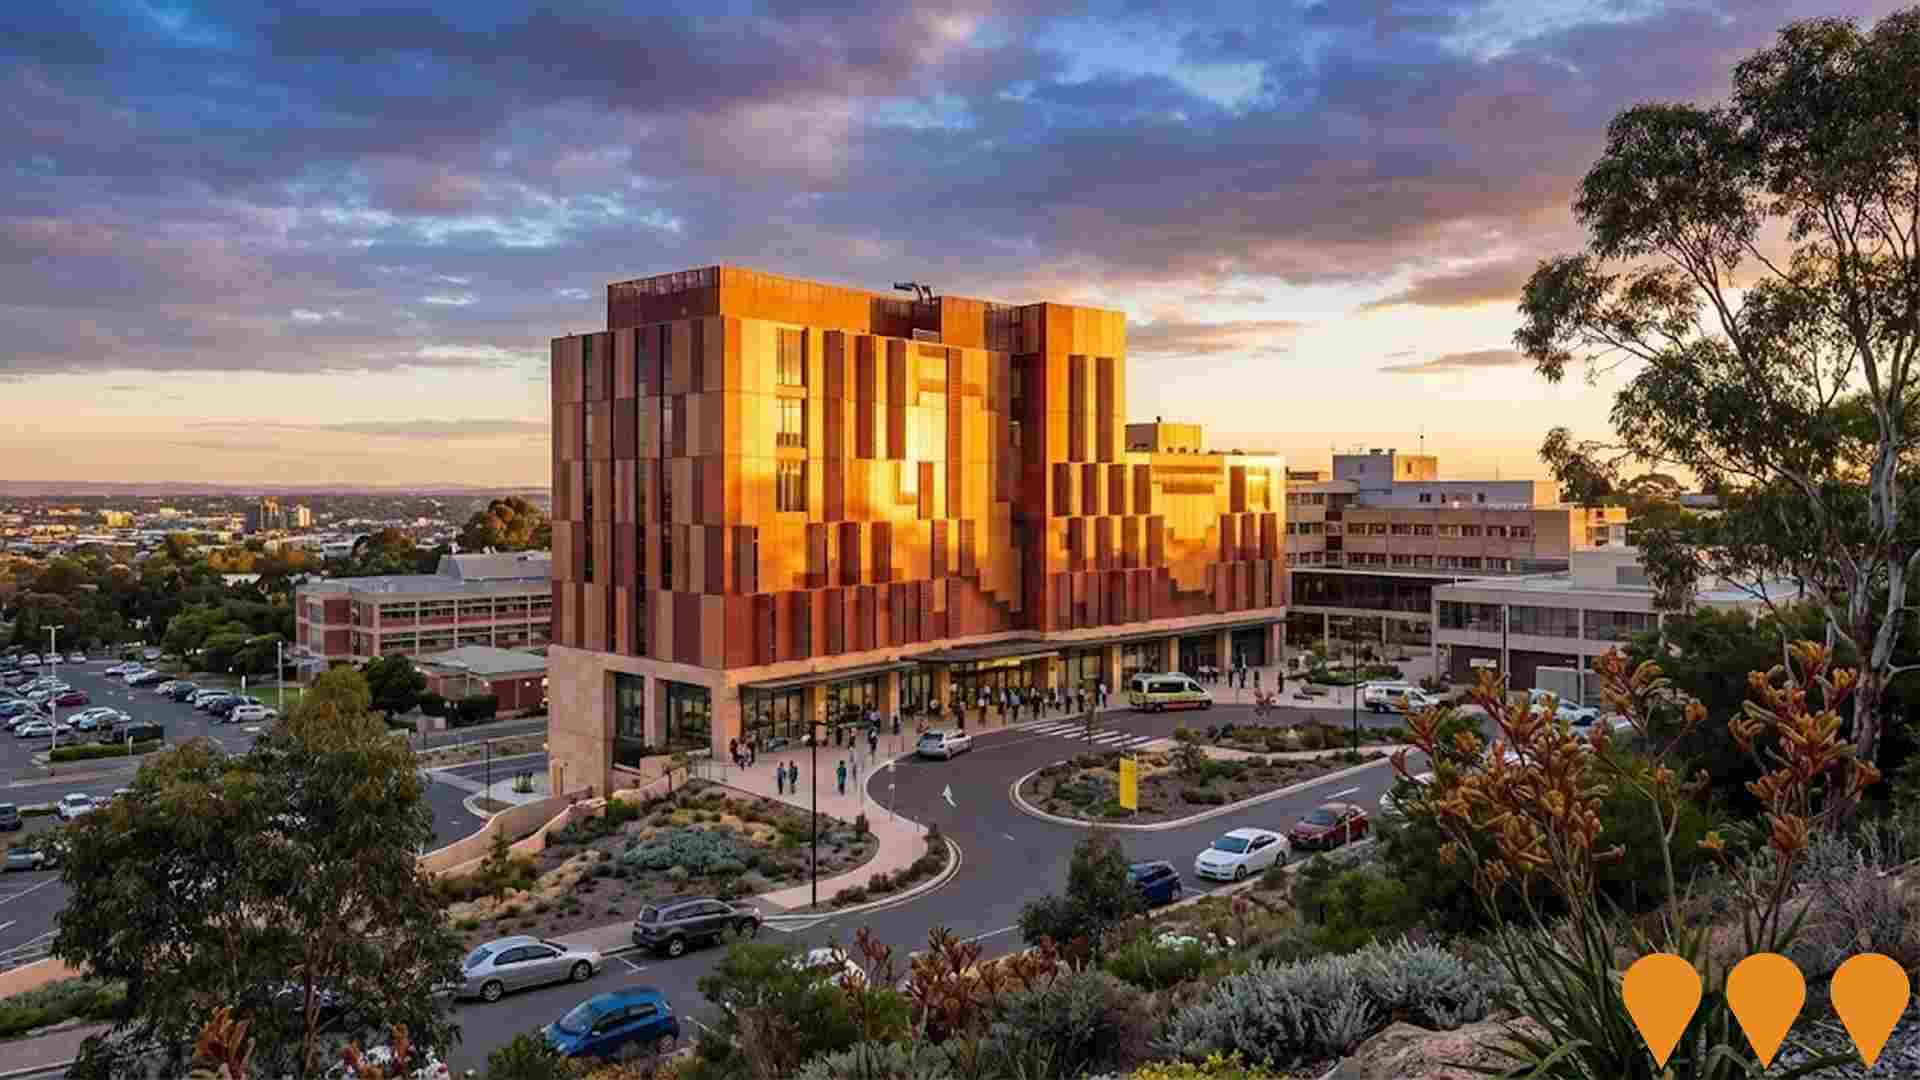
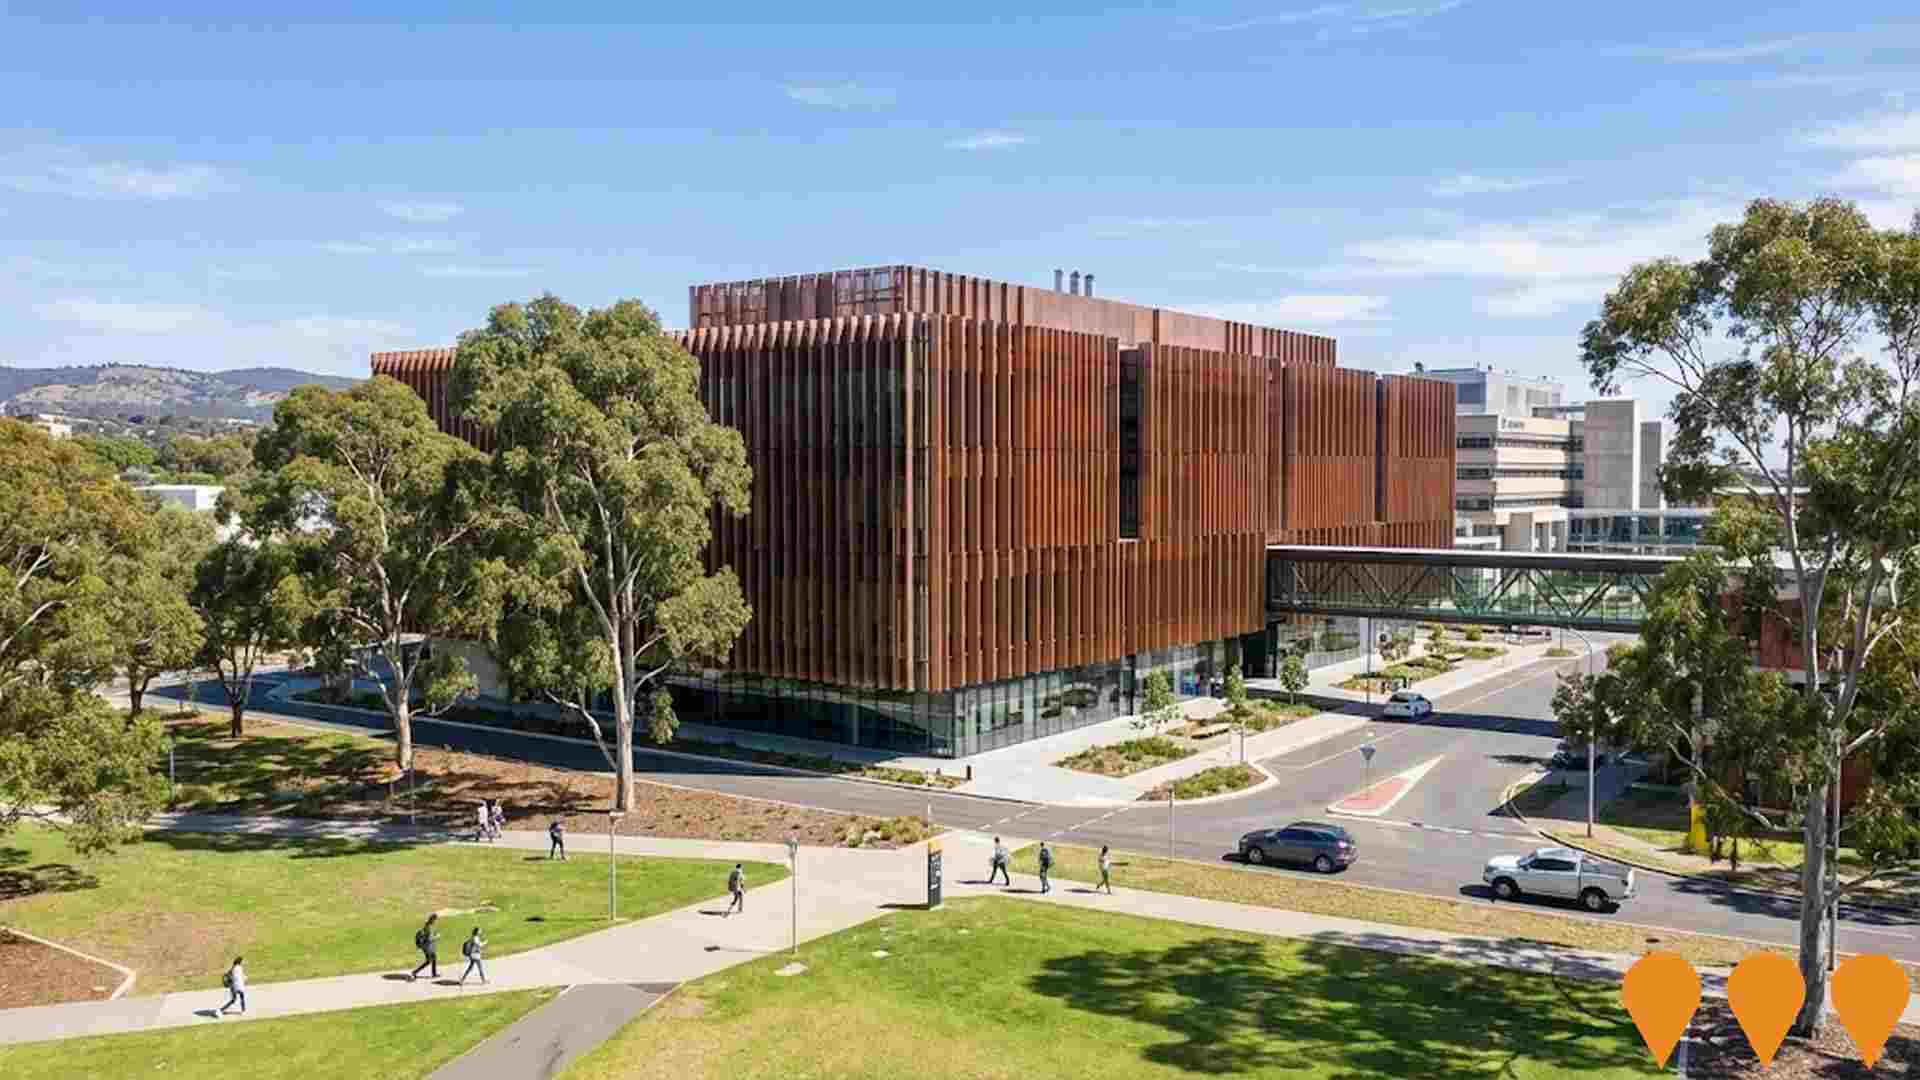
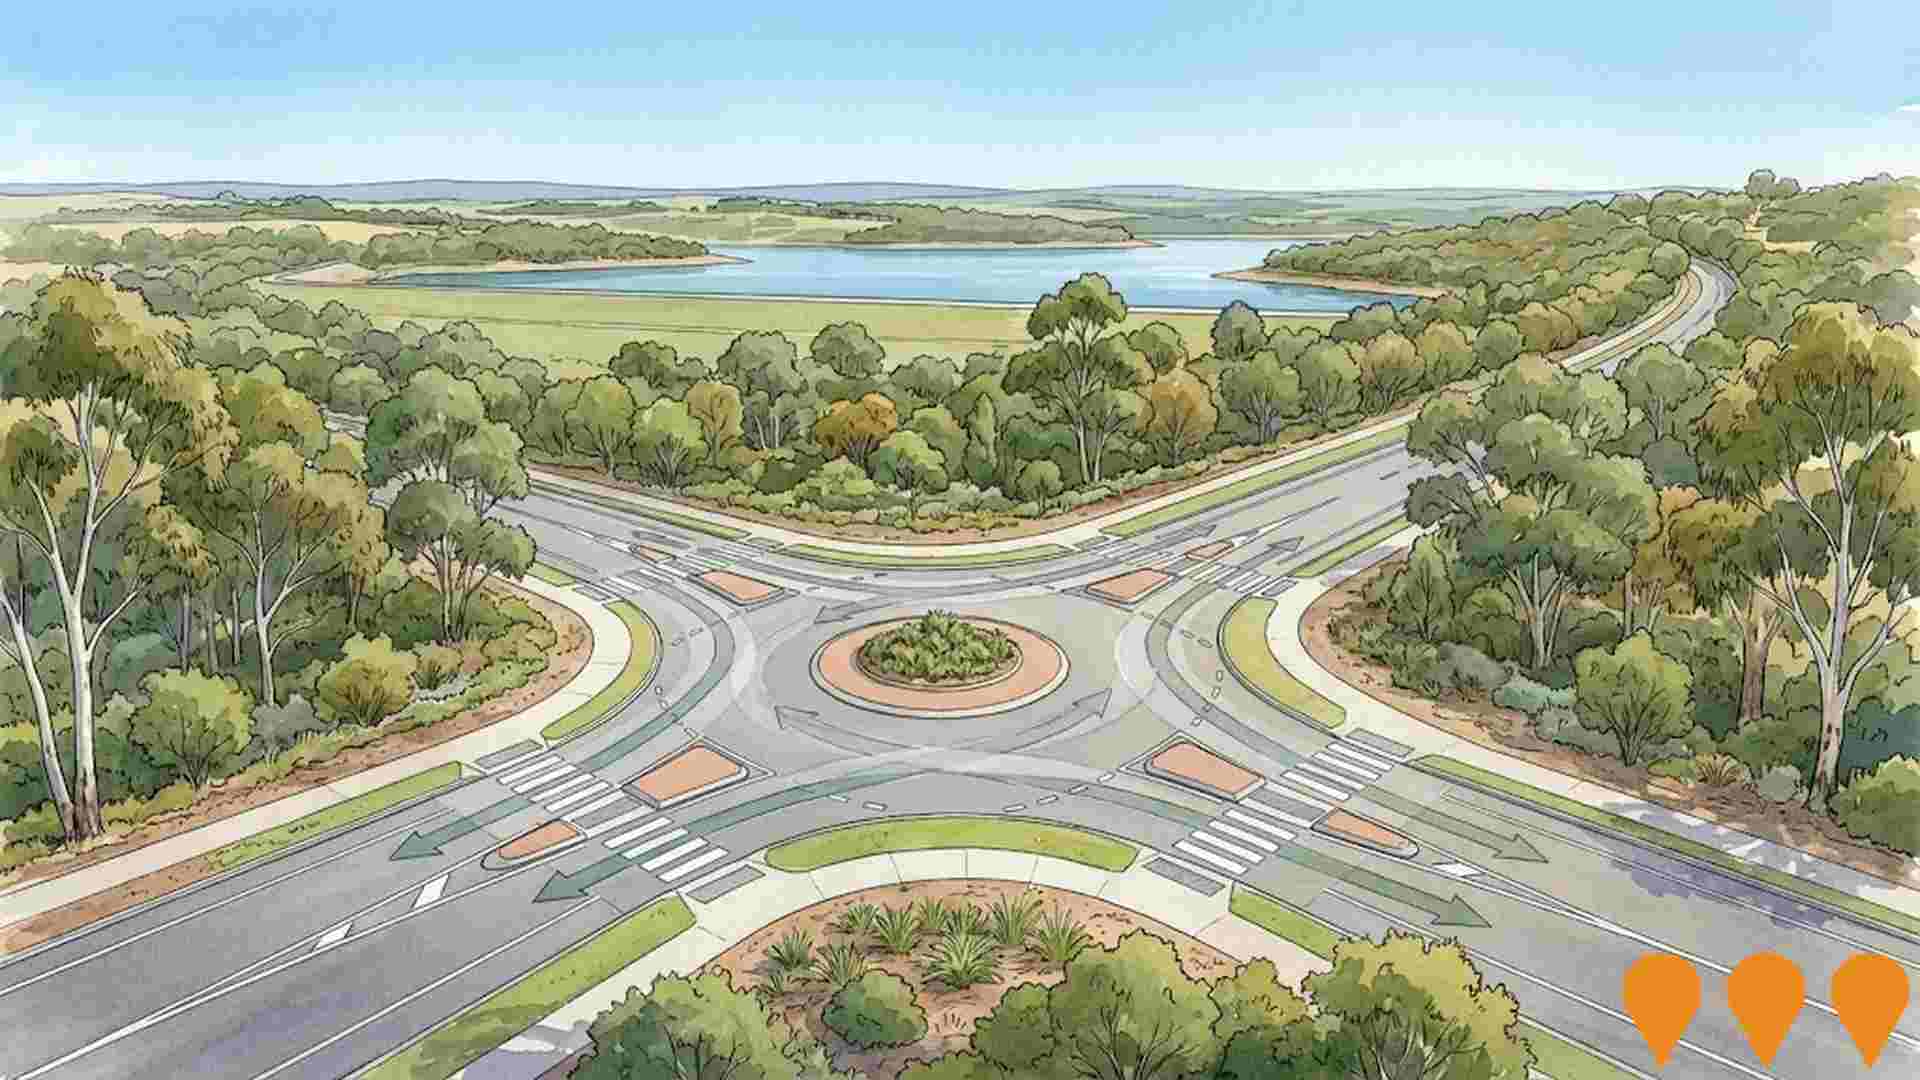
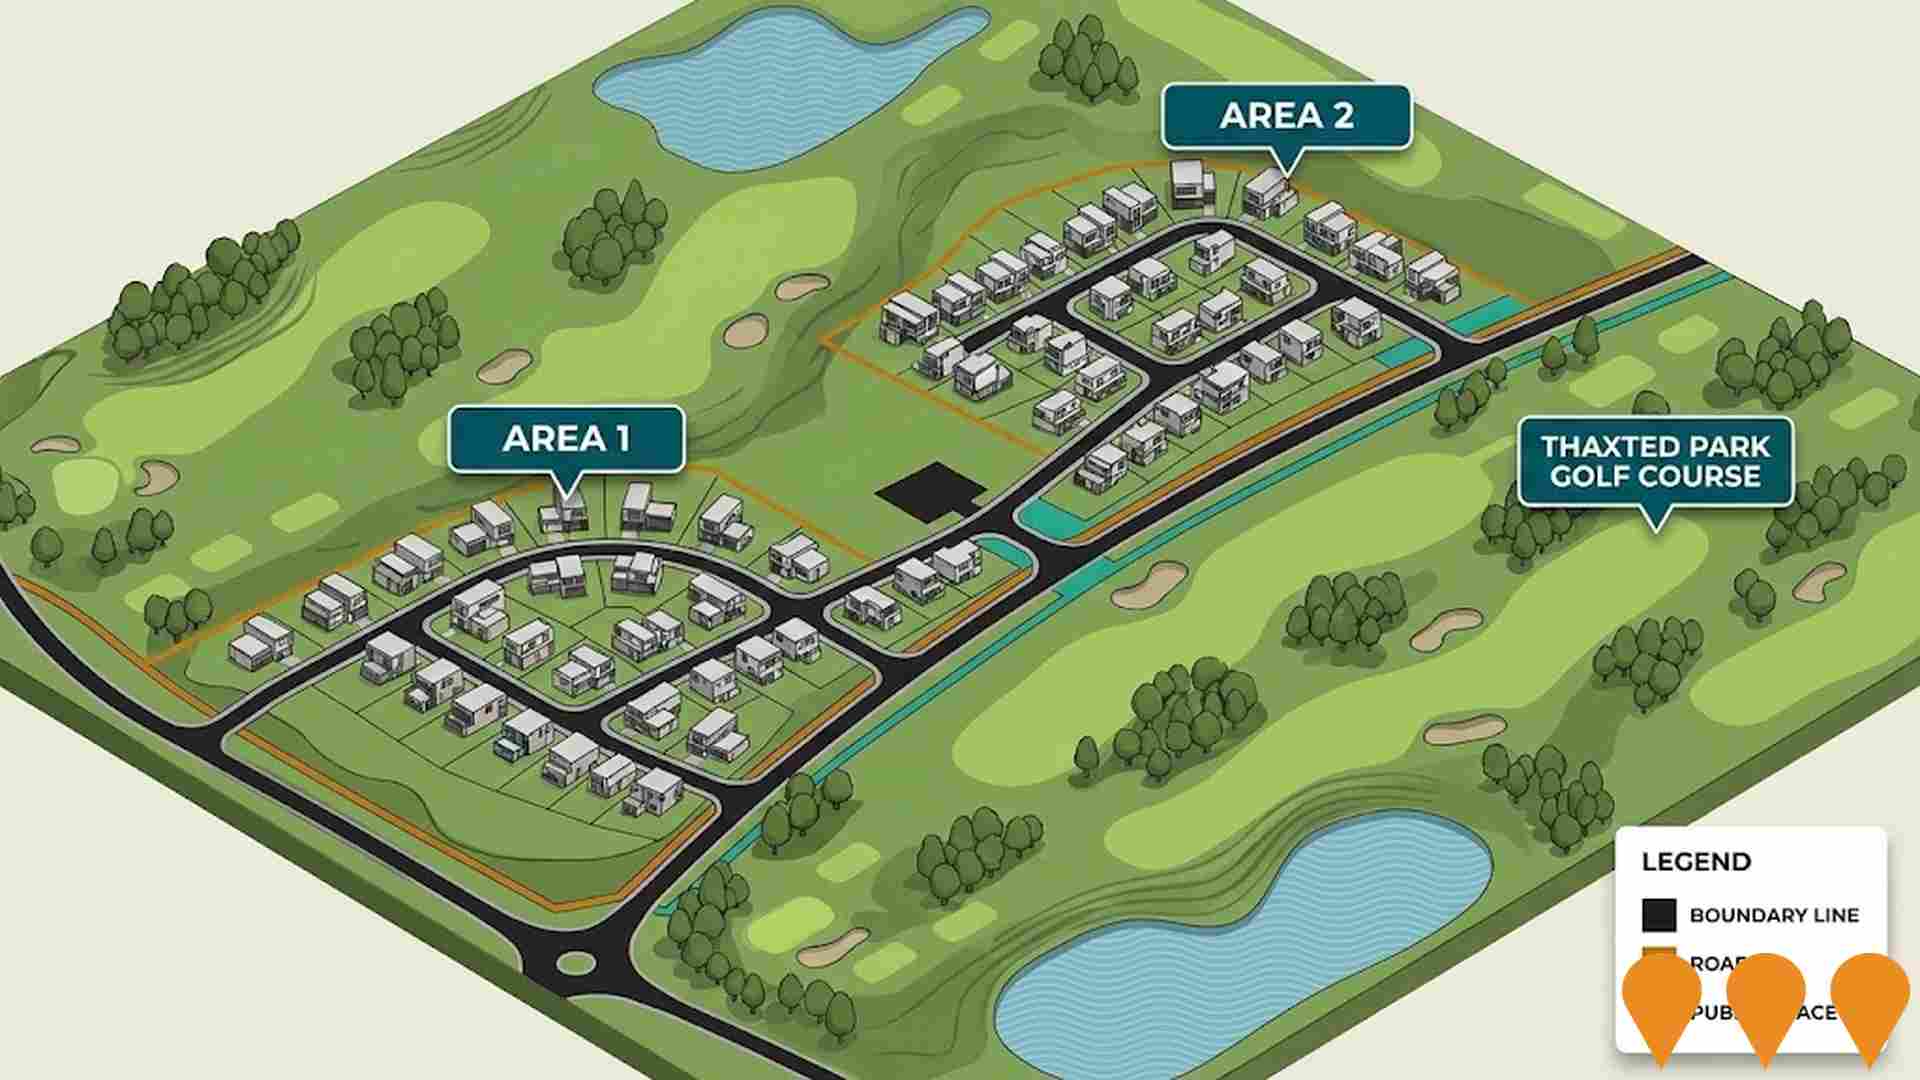
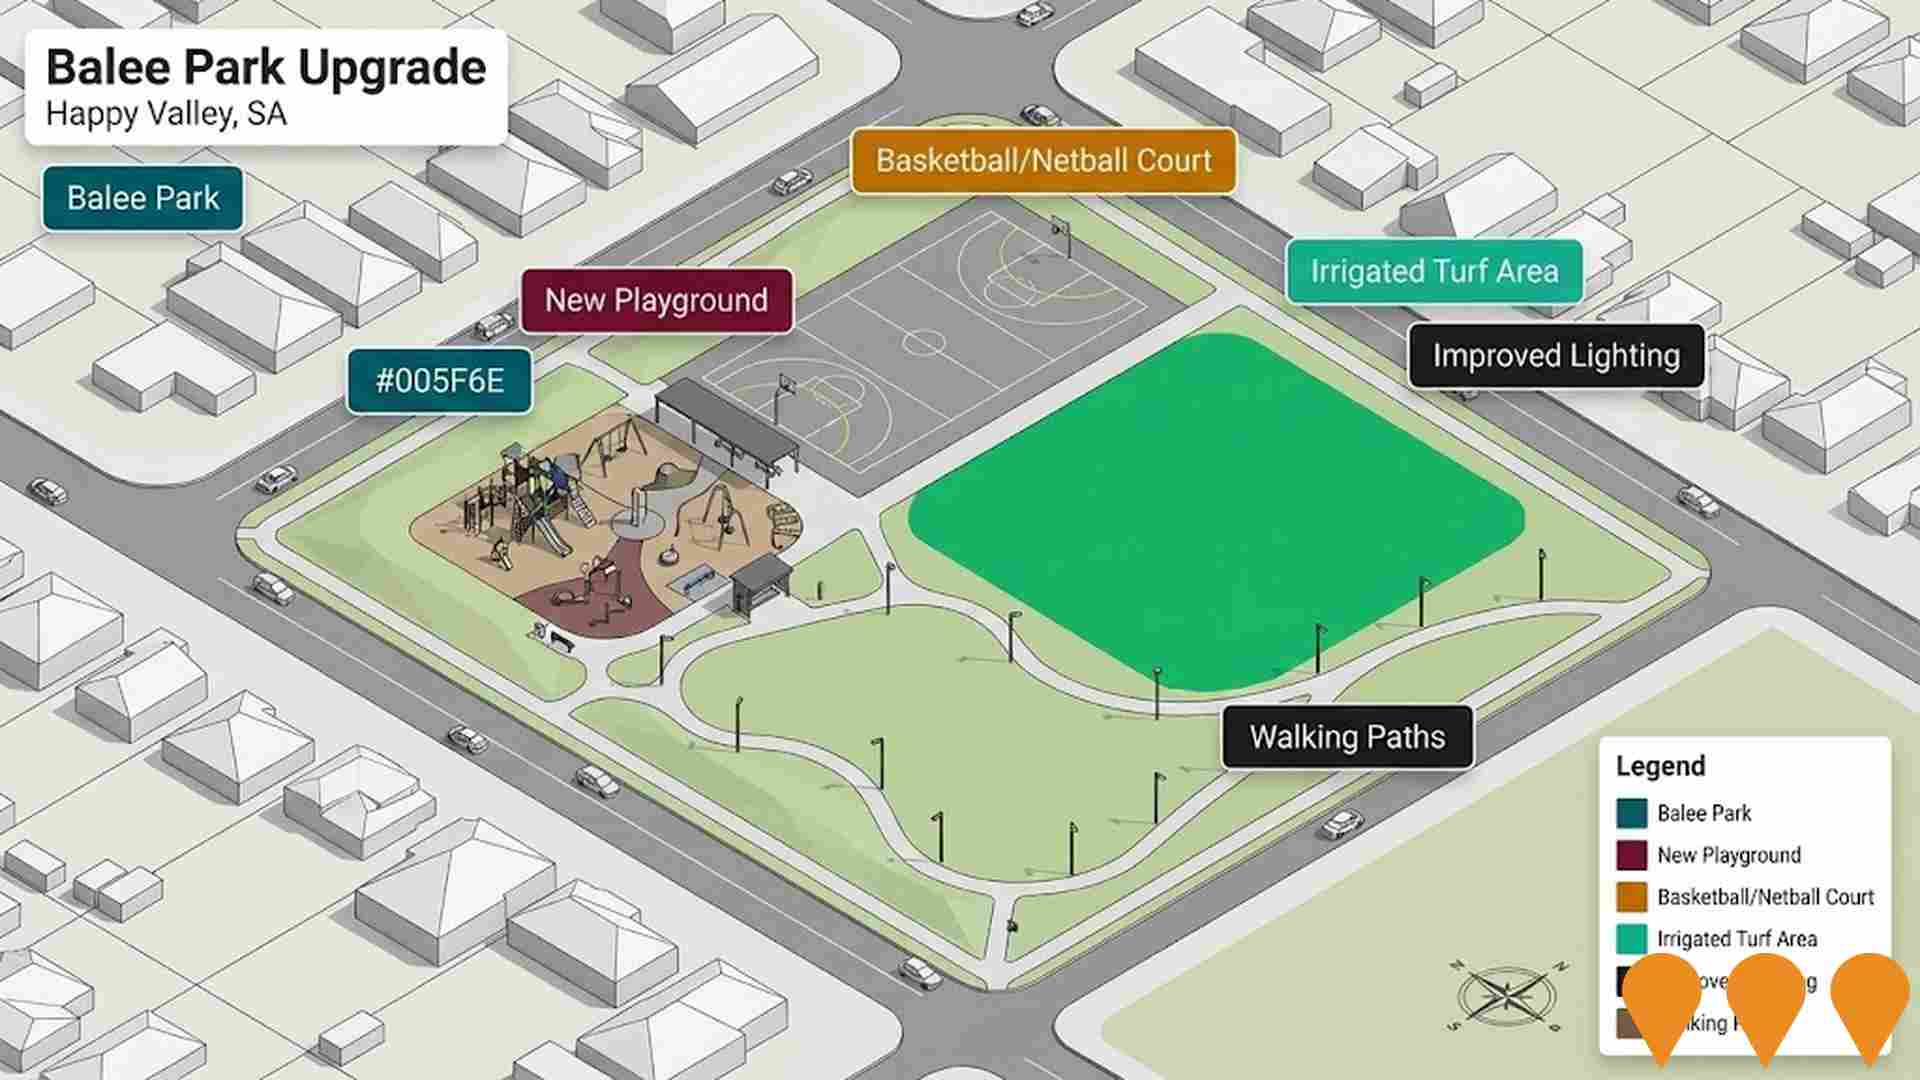
Changes to local infrastructure significantly impact an area's performance. AreaSearch identified 17 projects likely influencing the region. Notable initiatives include Balee Park Upgrade (Happy Valley), Flinders Medical Centre Acute Services Building, Urban Creek Resilience and Recovery Project - Sauerbier and Homestead Creeks, Zero Cost Energy Future - Happy Valley Reservoir Solar Project. Relevant projects are listed below.
Professional plan users can use the search below to filter and access additional projects.
INFRASTRUCTURE SEARCH
 Denotes AI-based impression for illustrative purposes only, not to be taken as definitive under any circumstances. Please follow links and conduct other investigations from the project's source for actual imagery. Developers and project owners wishing us to use original imagery please Contact Us and we will do so.
Frequently Asked Questions - Infrastructure
Happy Valley Solar Farm & Water Treatment Plant Complex
Integrated energy and water treatment complex featuring 12.8MW solar installation with 33,750 panels using 5B Maverick technology, powering Adelaide's largest water treatment plant. Solar array completed 2021, UV disinfection system upgrade completed 2021 ($26M). Complex serves 40% of metropolitan Adelaide's water supply with renewable energy integration reducing emissions by 7,600 tonnes annually.
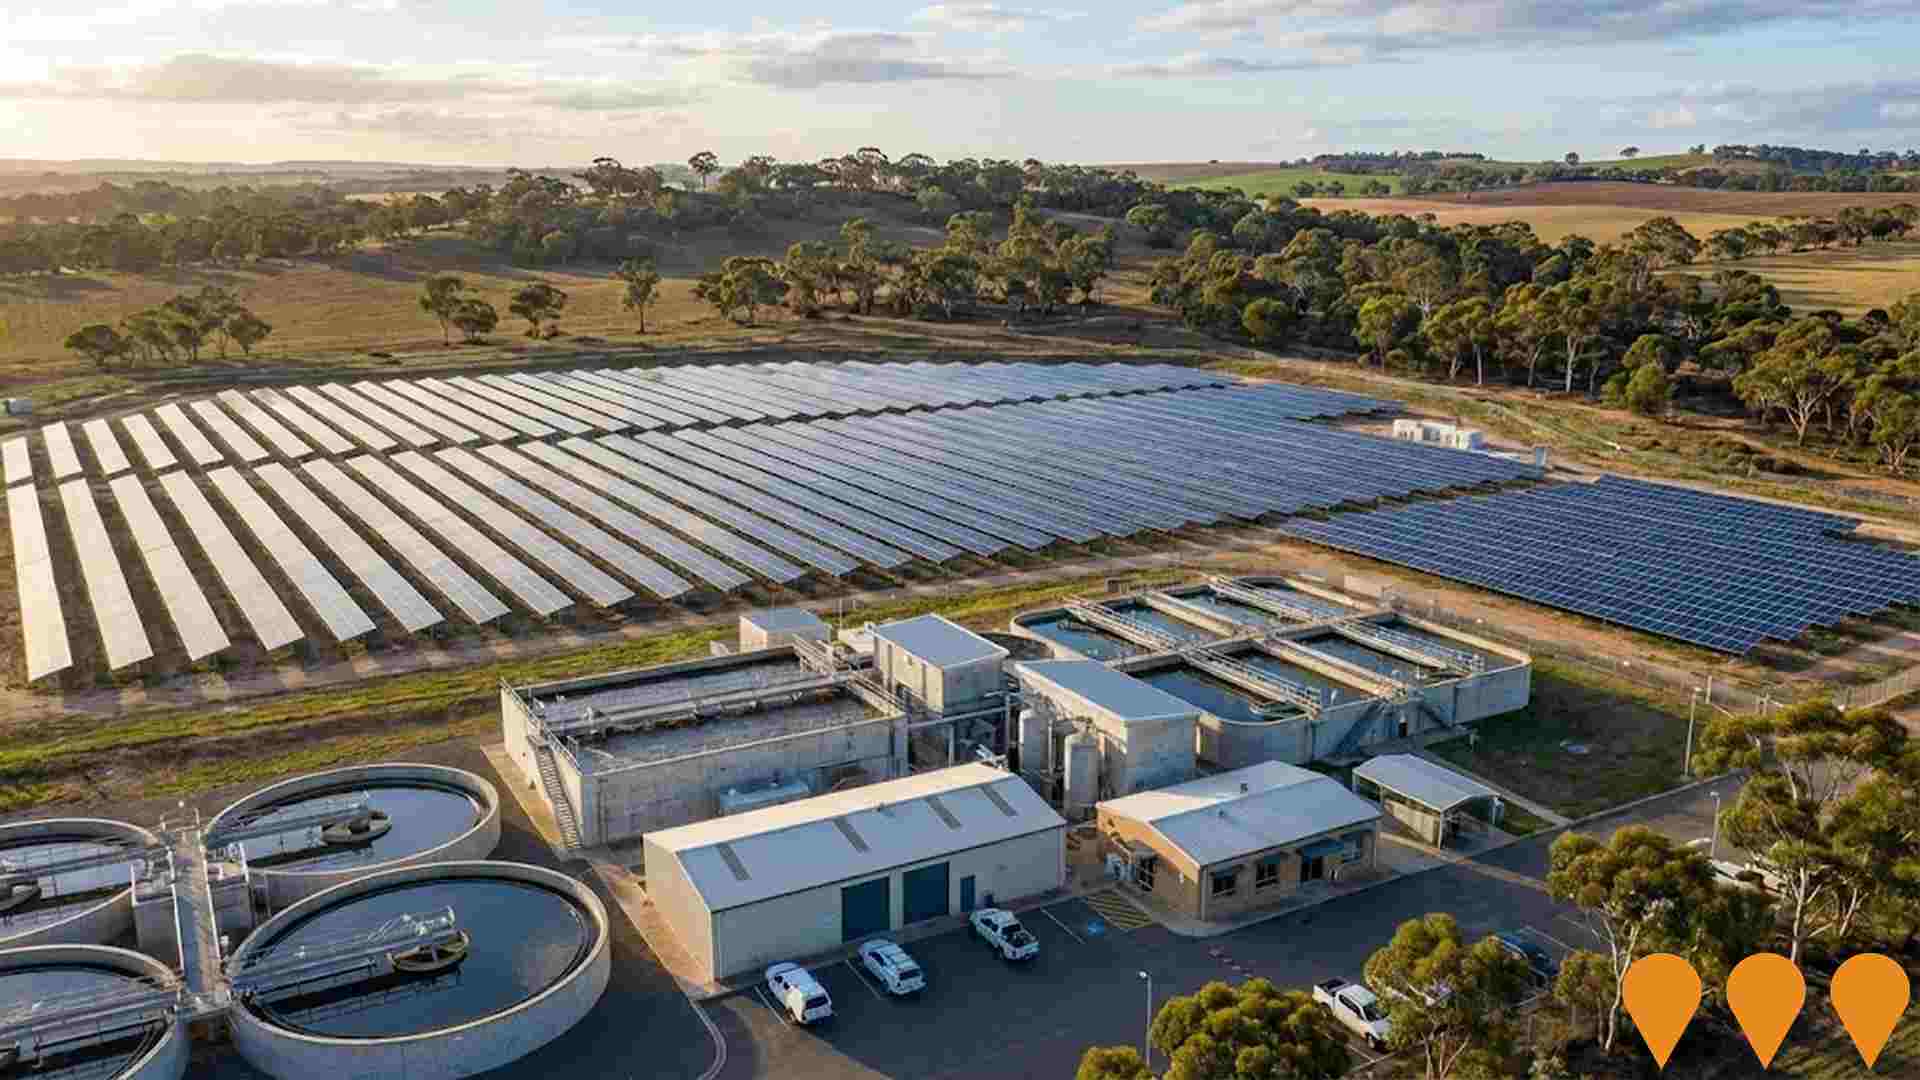
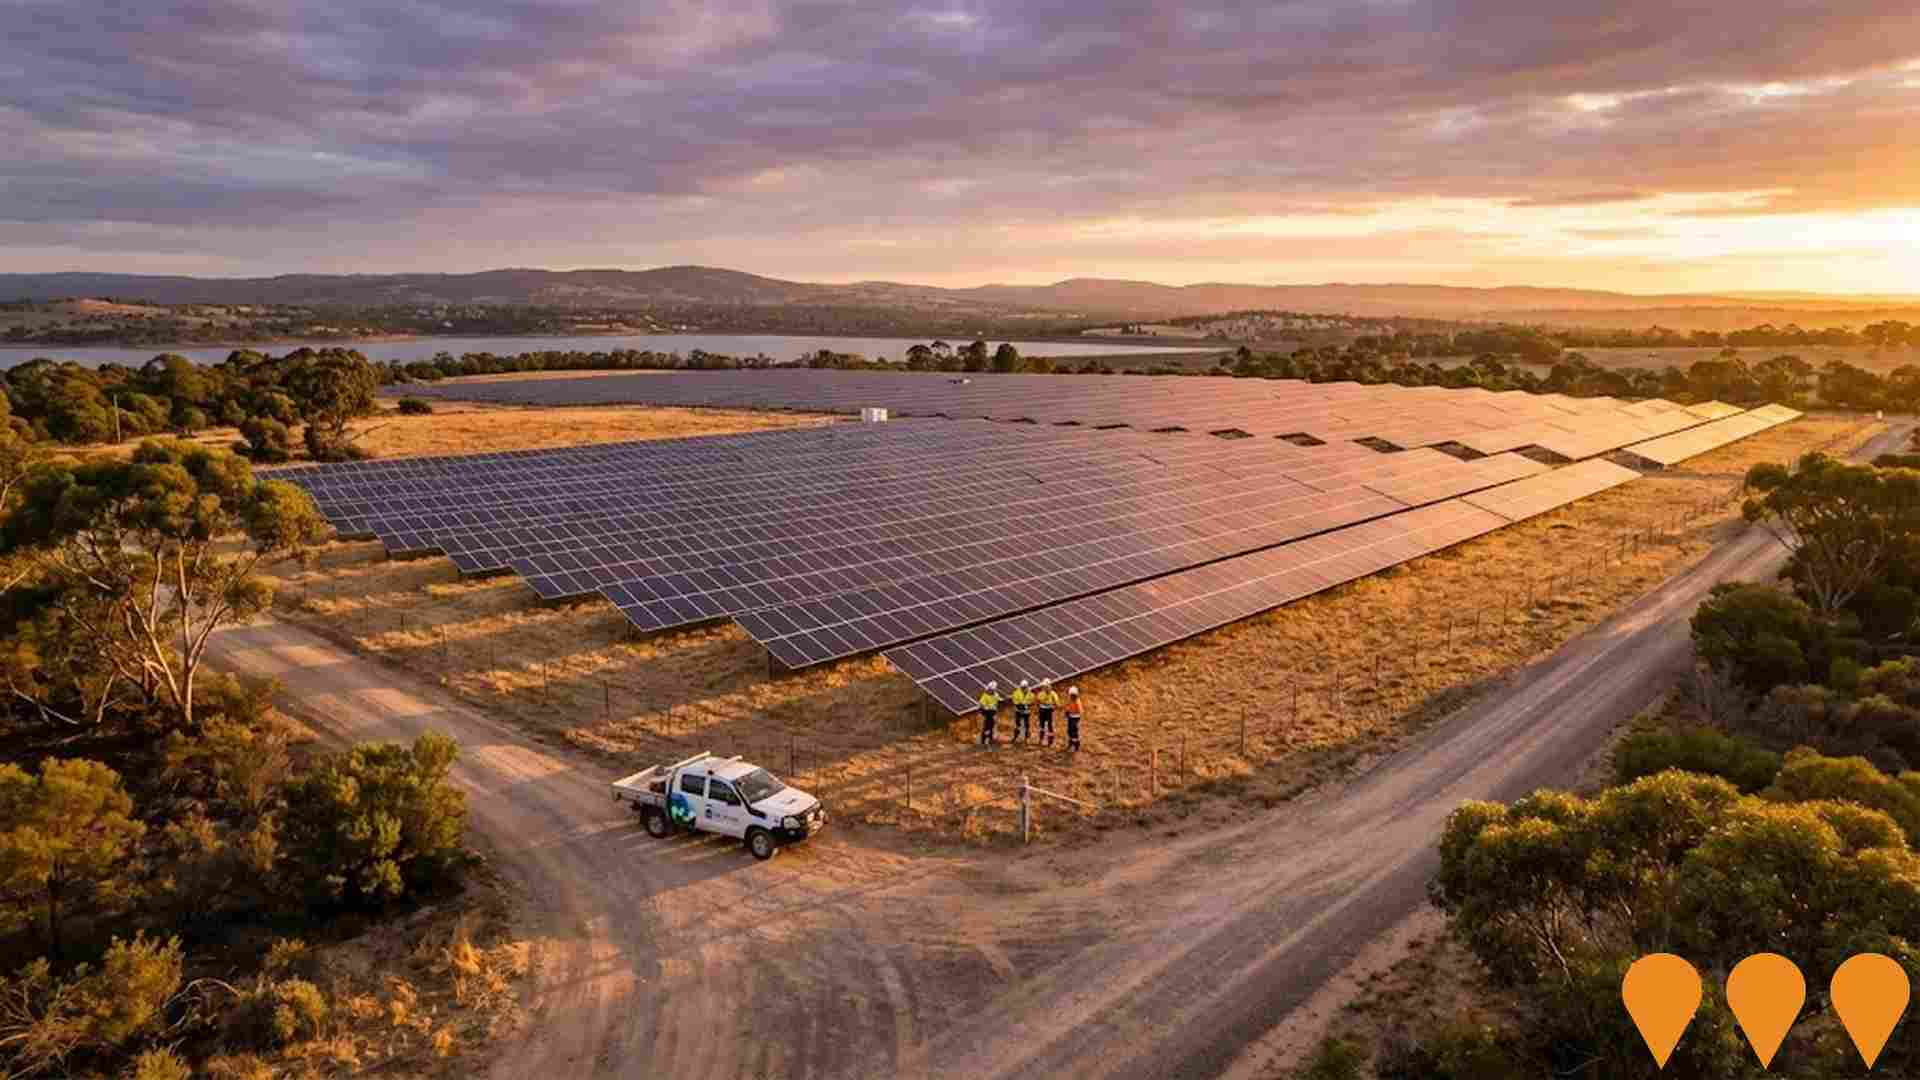
Zero Cost Energy Future - Happy Valley Reservoir Solar Project
World's largest fully moveable solar array featuring 33,750 5B Maverick pre-fabricated solar panels with 12.8MW capacity at Happy Valley Reservoir Reserve. Generates 17 gigawatt hours of renewable energy annually to power the water treatment plant serving over 40% of Adelaide's drinking water. Part of SA Water's $300 million Zero Cost Energy Future initiative. The innovative relocatable system uses ballasted design requiring minimal ground penetration, allowing the array to be moved if needed for maintenance or site works.
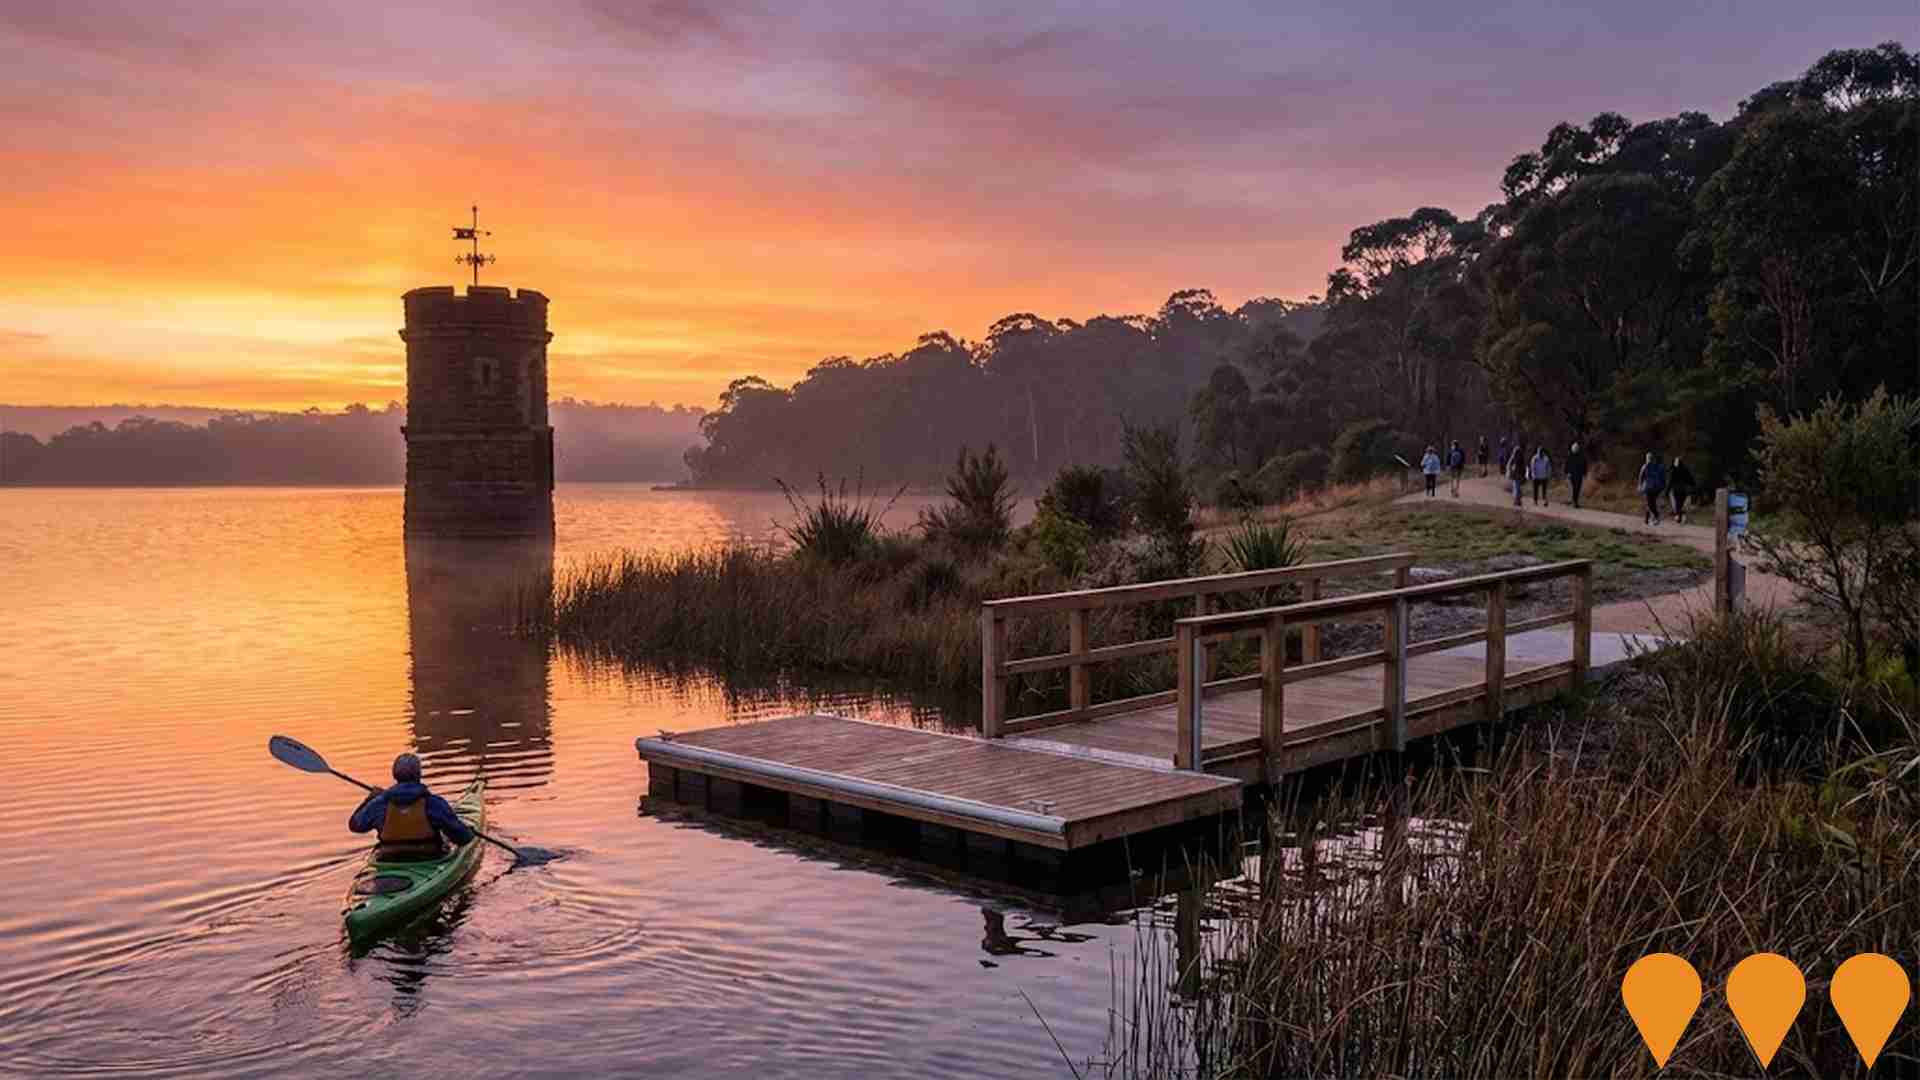
Happy Valley Reservoir Reserve Access Project
First-time public opening of the 120-year-old Happy Valley Reservoir Reserve featuring 20 kilometres of walking, cycling and mountain biking trails, 110 hectares of water for kayaking and fishing, two kayak launch areas (one with disability access), picnic facilities with BBQs and shelters, car parking, and visitor amenities. The reserve connects to Glenthorne National Park creating over 1,500 hectares of accessible outdoor recreation space. Opened December 11, 2021 after extensive water treatment upgrades to enable safe public access while maintaining drinking water quality for over 40% of metropolitan Adelaide.
Urban Creek Resilience and Recovery Project - Sauerbier and Homestead Creeks
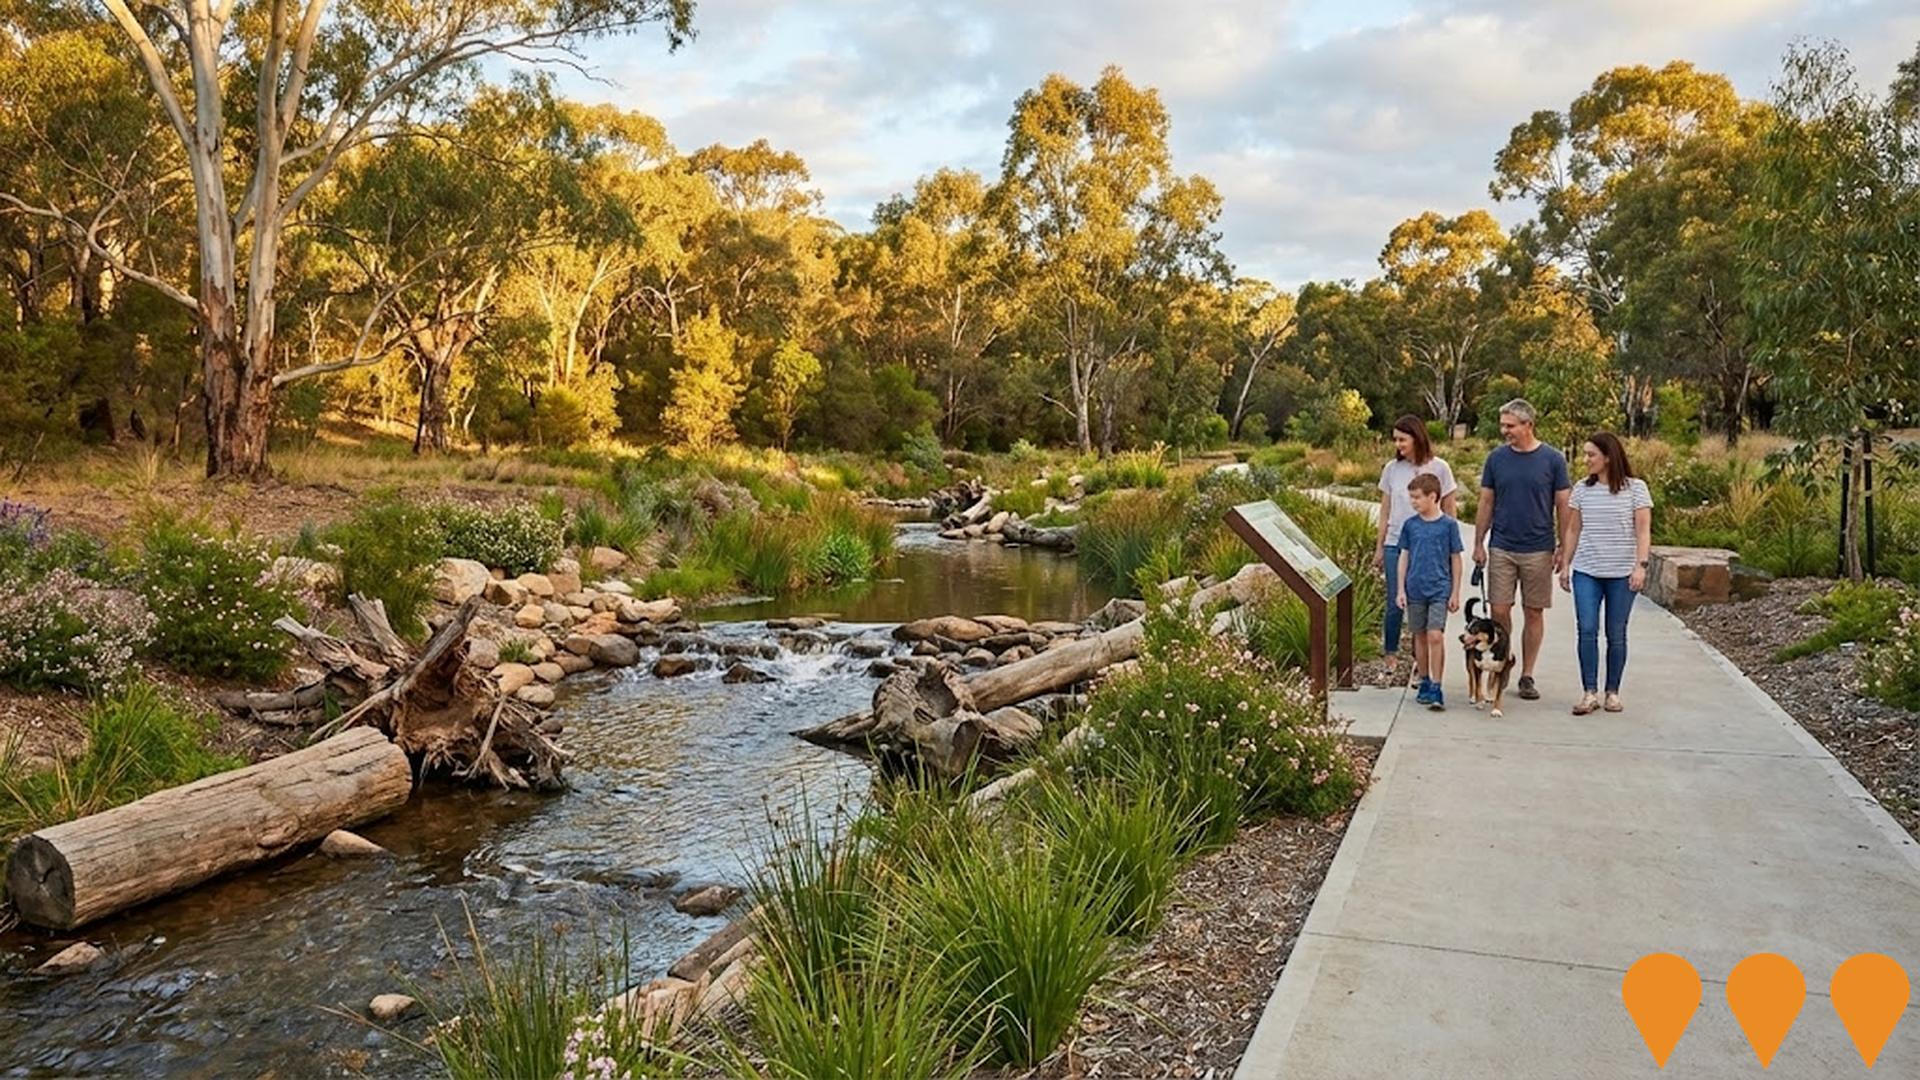
A $1.83 million watercourse rehabilitation project funded by the Australian Government's Natural Heritage Trust under the Urban Rivers and Catchments Program. The project aims to improve the health of Sauerbier Creek and Homestead Creek within the upper Field River catchment in Aberfoyle Park. Key activities include upgrading stormwater flows and creek banks with improved drainage structures, installing natural erosion control solutions using logs, rocks and permeable fabric, adding wildlife-friendly litter traps, creating safe spaces and habitat refuges for threatened species including Southern Brown Bandicoots and Cunningham's Skinks, controlling weeds and planting local native species, and enhancing community connections with nature through workshops, signage and conservation activities. The project will restore creek areas, banks and aquatic habitats while improving water quality, waterway connectivity and biodiversity.
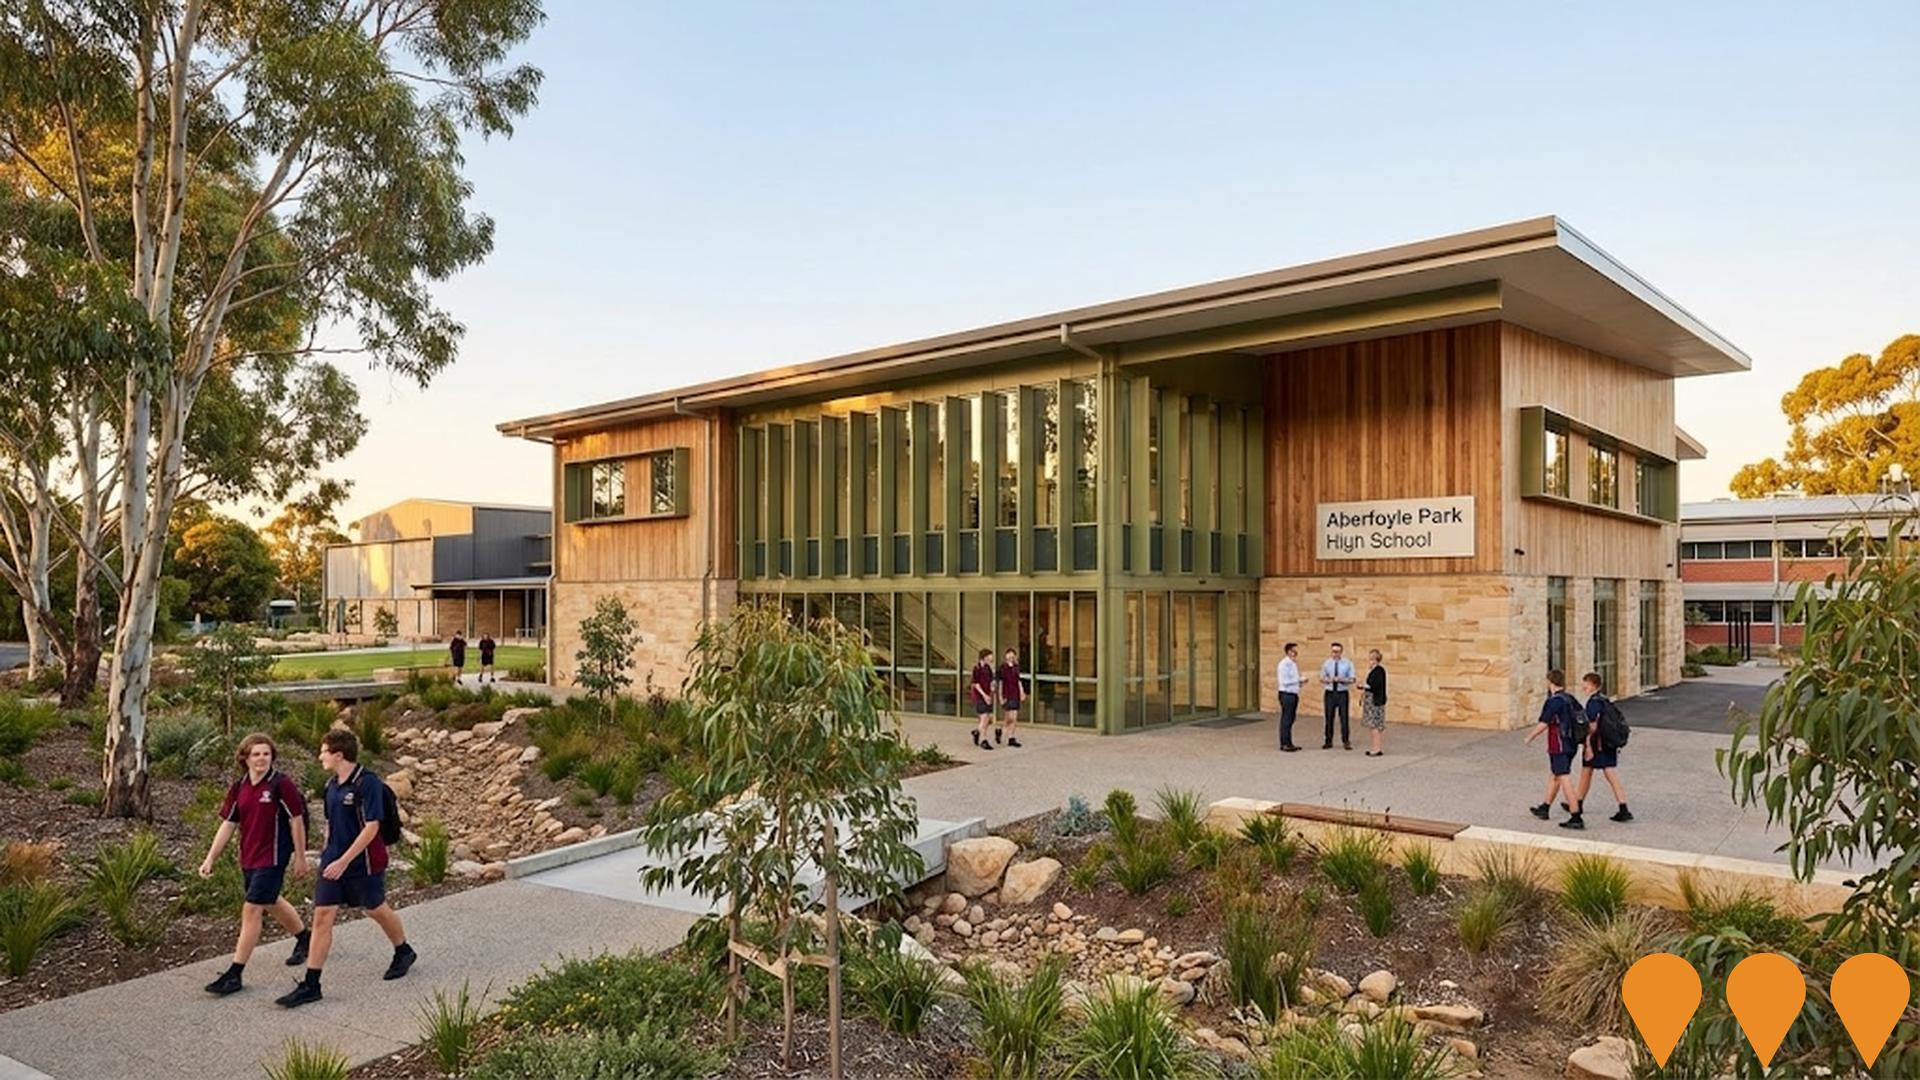
Aberfoyle Park High School Redevelopment
A $14 million facility upgrade completed in May 2022 including redevelopment of the performing arts centre with a 250-seat theatre, refurbishing existing buildings to create contemporary learning spaces and collaborative areas, creation of a new entrance and administration building, and enhanced indoor-outdoor learning environments. The project was delivered in three stages to minimize disruption to the school's 1,150 students and features contemporary architecture with natural materials and an earthen green palette inspired by the Australian bush.
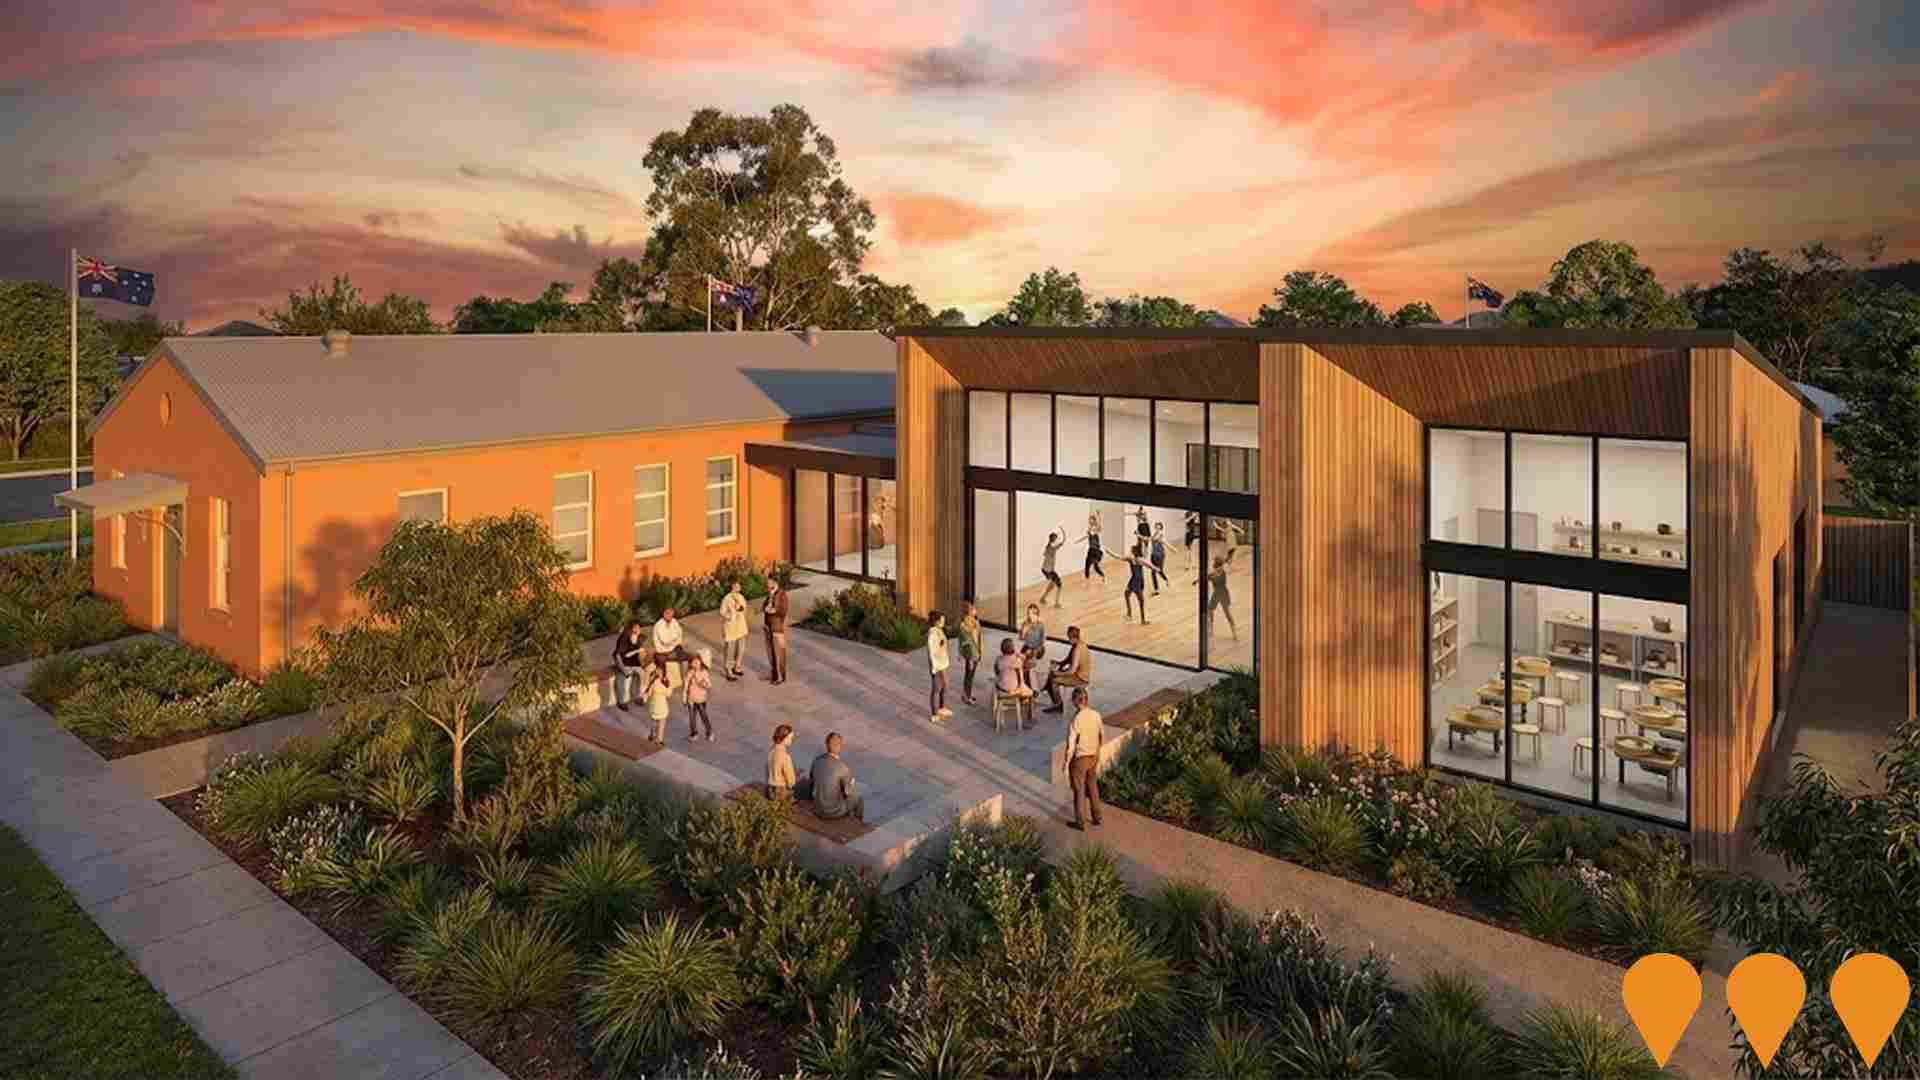
Aberfoyle Community Centre Expansion
A $1.61 million expansion of the Aberfoyle Community Centre completed in April 2025. The project added a new flexible open-plan building at the rear of the existing facility, featuring a versatile space for dance and messy activities, a youth pod with lowered ceiling and retractable curtains, and an art studio equipped with pottery kilns, wheels, moveable tables and lockers. The expansion includes acoustic features such as acoustic glass for music activities, vinyl flooring and wall mirrors for dance and fitness, high-level windows for natural light, verandas creating indoor-outdoor connections, and a central outdoor area for informal gatherings. The new spaces enable simultaneous programming with existing multifunctional rooms, supporting arts, crafts, dance, exhibitions, youth programs, family activities, and social gatherings. Funded through a Community Infrastructure Grant from the Department of Infrastructure and Transport with $1.5 million from the State Government of South Australia (secured by Erin Thompson MP, Member for Davenport) and $110,000 from the City of Onkaparinga. Construction began in early 2024 and was completed in February 2025 after 12 months, with the existing centre remaining operational throughout to minimize disruption to users.
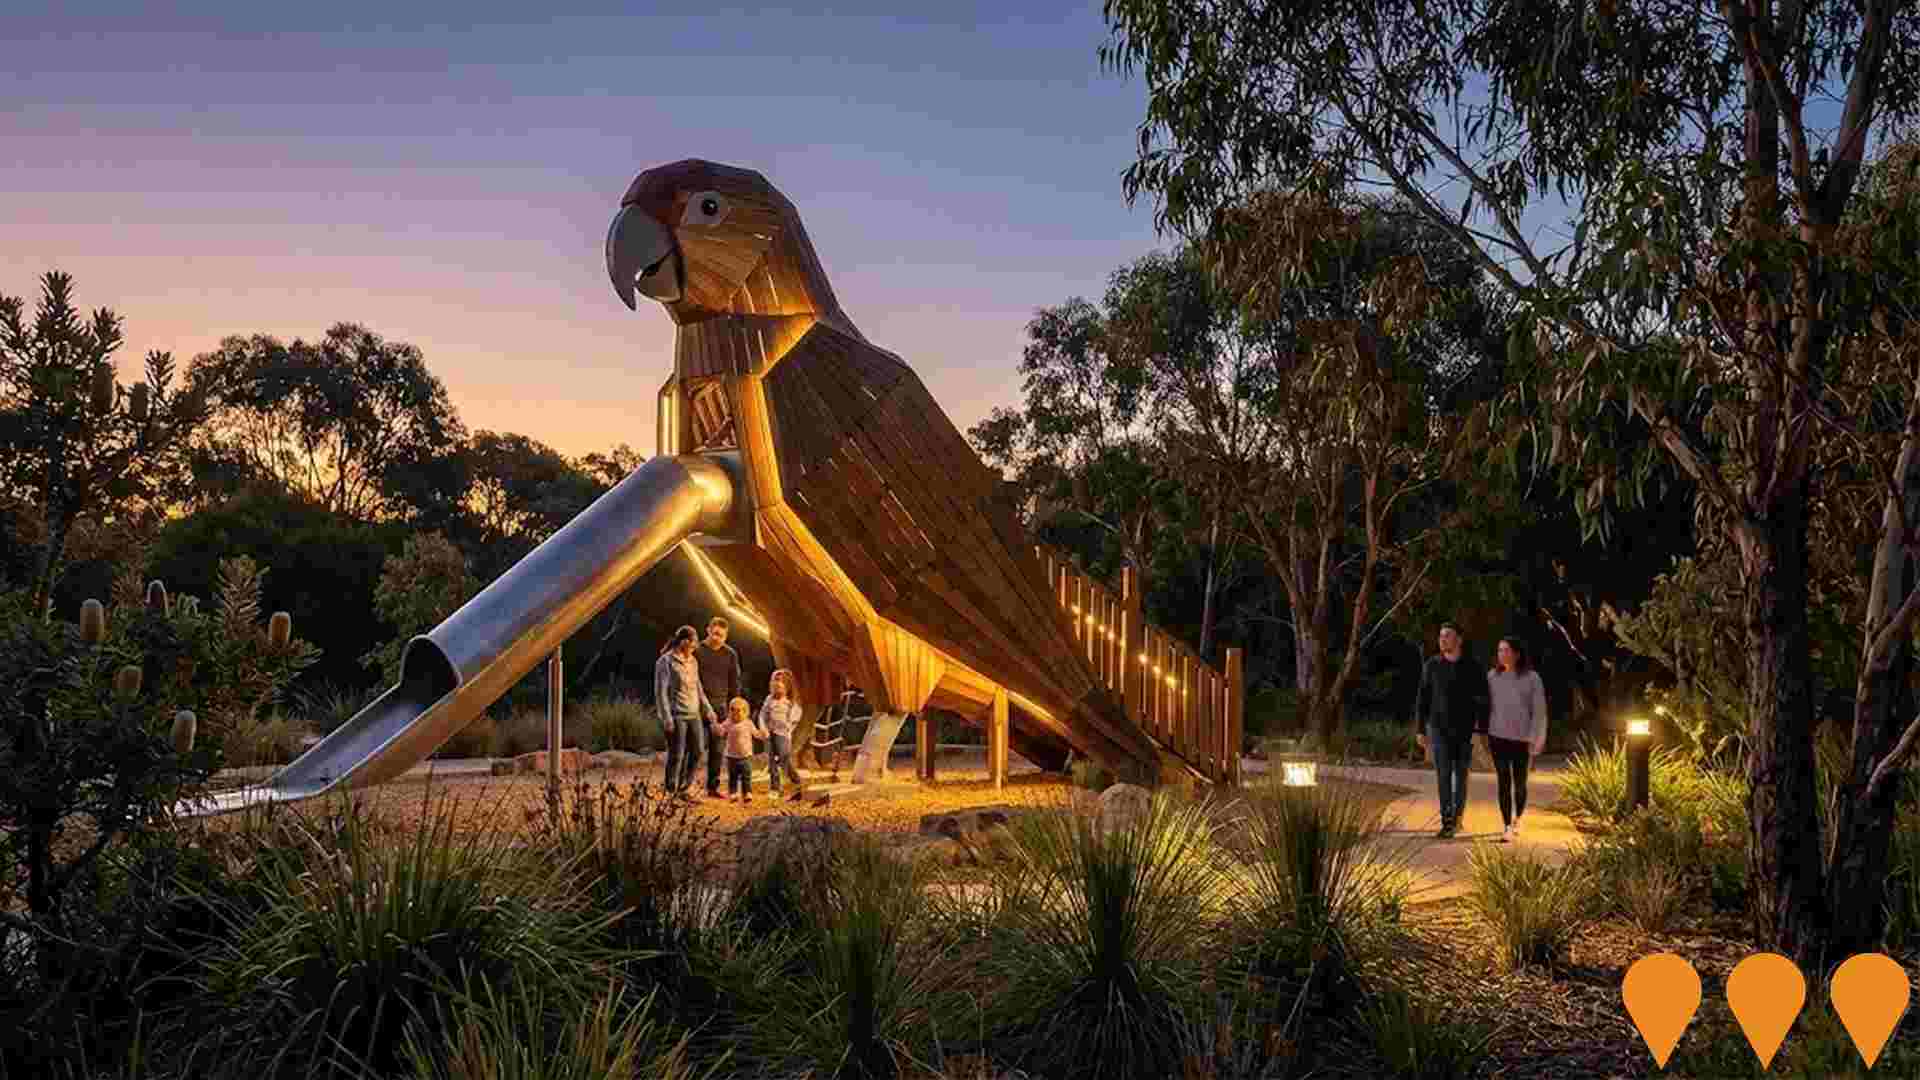
Thalassa Park Master Plan
Development of a comprehensive master plan to guide future improvements and development of Thalassa Park. The plan will address playgrounds, walking and cycling trails, event spaces, gardens, accessibility features, and the Storybook Walk sculpture park. The Council design team is working with the Thalassa Park and Gardens Trust to ensure the revised master plan aligns with timeframe and budget planning. Community and stakeholder feedback will be sought once the draft master plan is available.
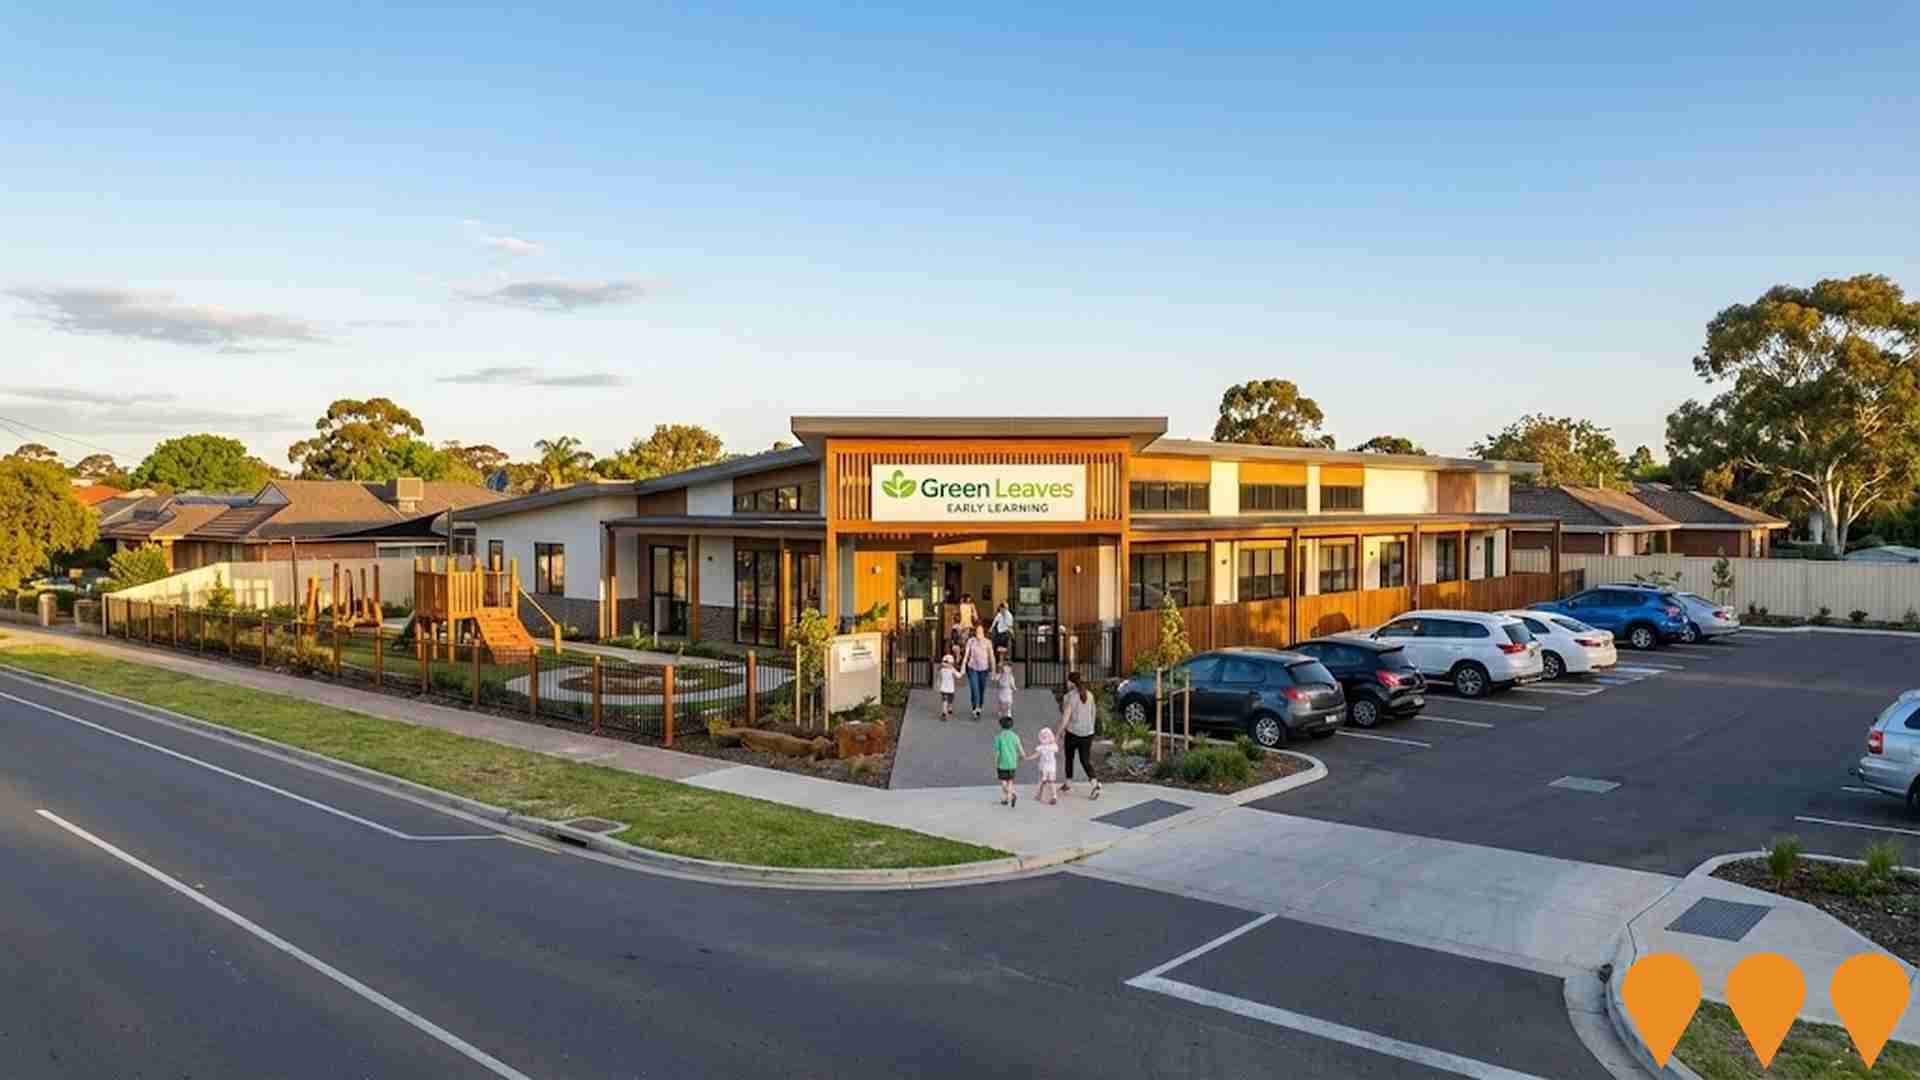
Green Leaves Early Learning Woodcroft
Completed 98-place early learning centre located at the corner of Pimpala Road and Panalatinga Road. This purpose-built, state-of-the-art facility features custom-designed learning hubs for children aged six weeks to six years, outdoor play areas including bike track and edible gardens, Chef's kitchen for culinary lessons, and family lounge with barista coffee service. The centre received service approval on April 4, 2024 and is now operational. Operated by Green Leaves Early Learning, a privately owned company specializing in boutique early learning centre development throughout Australia.
Employment
AreaSearch analysis reveals Happy Valley significantly outperforming the majority of regions assessed nationwide
Happy Valley has a skilled workforce with essential services sectors well represented. Its unemployment rate is 2.5%, lower than Greater Adelaide's 3.9%.
Employment growth over the past year was estimated at 3.4%. As of September 2025, 7,913 residents are employed. The key industries of employment among residents are health care & social assistance, construction, and retail trade. Construction shows notable concentration with employment levels at 1.2 times the regional average.
Conversely, professional & technical services show lower representation at 5.9% versus the regional average of 7.3%. Employment opportunities appear limited locally as indicated by Census data comparing working population to resident population. Between September 2024 and September 2025, employment levels increased by 3.4%, labour force increased by 3.4%, with unemployment remaining essentially unchanged. In comparison, Greater Adelaide recorded employment growth of 3.0% over the same period. State-level data to 25-Nov-25 shows SA employment grew by 1.19% year-on-year, with a state unemployment rate of 4.0%. National forecasts from May-25 project national employment growth at 6.6% over five years and 13.8% over ten years. Applying these projections to Happy Valley's employment mix suggests local employment should increase by similar rates.
Frequently Asked Questions - Employment
Income
Income levels align closely with national averages, indicating typical economic conditions for Australian communities according to AreaSearch analysis
AreaSearch's aggregation of ATO data for financial year 2022 shows Happy Valley SA2 had a median taxpayer income of $53,569 and an average income of $62,049. This is lower than the national average of $64,886. In Greater Adelaide, these figures stood at $52,592 (median) and $64,886 (average). Considering a 12.83% Wage Price Index growth since financial year 2022, estimated incomes for September 2025 would be approximately $60,442 (median) and $70,010 (average). According to the 2021 Census, Happy Valley's household, family, and personal incomes rank modestly, between the 39th and 44th percentiles. Income distribution data reveals that 35.6% of the population (5,141 individuals) fall within the $1,500 - $2,999 income range, similar to regional levels where 31.8% occupy this range. After housing expenses, 85.8% of income remains for other expenses. Happy Valley's SEIFA income ranking places it in the 5th decile.
Frequently Asked Questions - Income
Housing
Happy Valley is characterized by a predominantly suburban housing profile, with above-average rates of outright home ownership
Happy Valley's dwelling structures, as per the latest Census, consisted of 90.3% houses and 9.7% other dwellings (semi-detached, apartments, 'other' dwellings). This compares to Adelaide metro's 89.2% houses and 10.7% other dwellings. Home ownership in Happy Valley was at 36.5%, with mortgaged dwellings at 50.9% and rented ones at 12.7%. The median monthly mortgage repayment was $1,517, higher than Adelaide metro's $1,452. Median weekly rent in Happy Valley was $355, compared to Adelaide metro's $314. Nationally, Happy Valley's mortgage repayments were lower at $1,517 versus Australia's average of $1,863, and rents were less at $355 compared to the national figure of $375.
Frequently Asked Questions - Housing
Household Composition
Happy Valley has a typical household mix, with a fairly typical median household size
Family households constitute 74.8% of all households, including 31.3% couples with children, 31.2% couples without children, and 11.4% single parent families. Non-family households comprise the remaining 25.2%, with lone person households at 23.7% and group households making up 1.4% of the total. The median household size is 2.5 people, aligning with the Greater Adelaide average.
Frequently Asked Questions - Households
Local Schools & Education
Educational attainment in Happy Valley aligns closely with national averages, showing typical qualification patterns and performance metrics
Educational qualifications in Happy Valley trail regional benchmarks, with 21.2% of residents aged 15+ holding university degrees compared to the national average of 30.4%. Bachelor degrees are the most common at 15.0%, followed by postgraduate qualifications (3.4%) and graduate diplomas (2.8%). Trade and technical skills are prominent, with 40.4% of residents aged 15+ holding vocational credentials – advanced diplomas account for 11.8% and certificates for 28.6%. Educational participation is high, with 25.0% of residents currently enrolled in formal education.
This includes 9.6% in primary education, 6.3% in secondary education, and 4.2% pursuing tertiary education.
Frequently Asked Questions - Education
Schools Detail
Nearby Services & Amenities
Transport
Transport servicing is moderate compared to other areas nationally based on assessment of service frequency, route connectivity and accessibility
Transport analysis in Happy Valley shows 107 active public transport stops operating, consisting of bus services. These stops are served by 23 unique routes, offering a total of 1,155 weekly passenger trips. The accessibility of transport is rated excellent, with residents on average located 182 meters from the nearest stop.
Services run frequently, averaging 165 trips per day across all routes, which translates to approximately 10 weekly trips per individual stop.
Frequently Asked Questions - Transport
Transport Stops Detail
Health
Health performance in Happy Valley is lower than average with common health conditions somewhat prevalent across both younger and older age cohorts
Happy Valley faces significant health challenges, with common health conditions being somewhat prevalent across both younger and older age cohorts. The rate of private health cover is relatively low at approximately 51% of the total population (~7,308 people), compared to 48.6% across Greater Adelaide.
The most common medical conditions in the area are arthritis and mental health issues, impacting 9.3 and 8.9% of residents respectively, while 64.0% declare themselves as completely clear of medical ailments, compared to 62.9% across Greater Adelaide. As of 2016 data, 24.0% of residents are aged 65 and over (3,463 people), which is higher than the 21.0% in Greater Adelaide. Health outcomes among seniors present some challenges, broadly in line with the general population's health profile.
Frequently Asked Questions - Health
Cultural Diversity
Happy Valley ranks below the Australian average when compared to other local markets across a number of language and cultural background related metrics
Happy Valley, surveyed in June 2016, showed limited cultural diversity: 80.8% of residents were born in Australia, 93.1% held citizenship, and 93.1% spoke English exclusively at home. Christianity was the predominant religion (39.9%), while Judaism was slightly overrepresented at 0.1% compared to Greater Adelaide's 0.1%. Ancestry-wise, English (35.1%) and Australian (27.4%) were the most prevalent, followed by Scottish (7.7%).
Notably, German ancestry was higher than regional averages (6.2% vs 5.4%), as were Welsh (0.8% vs 0.8%) and Dutch (1.9% vs 1.7%) ancestries.
Frequently Asked Questions - Diversity
Age
Happy Valley's median age exceeds the national pattern
Happy Valley has a median age of 42, which is slightly higher than Greater Adelaide's figure of 39 and significantly higher than the national norm of 38. The age group of 65-74 is strongly represented in Happy Valley at 12.4%, compared to Greater Adelaide, while the 25-34 cohort is less prevalent at 12.1%. According to the 2021 Census, the 75-84 age group has increased from 6.5% to 8.7% of the population. Conversely, the 55-64 cohort has decreased from 12.3% to 10.9%. Demographic modeling indicates that Happy Valley's age profile will change significantly by 2041. The 85+ group is projected to grow by 136%, reaching 995 people from the current figure of 421, leading the demographic shift. Those aged 65 and above are expected to comprise 79% of this growth. Meanwhile, the 35-44 and 5-14 age cohorts are projected to experience population declines.
