Chart Color Schemes
This analysis uses ABS Statistical Areas Level 2 (SA2) boundaries, which can materially differ from Suburbs and Localities (SAL) even when sharing similar names.
SA2 boundaries are defined by the Australian Bureau of Statistics and are designed to represent communities for statistical reporting (e.g., census and ERP).
Suburbs and Localities (SAL) represent commonly-used suburb/locality names (postal-style areas) and may use different geographic boundaries. For comprehensive analysis, consider reviewing both boundary types if available.
est. as @ -- *
ABS ERP | -- people | --
2021 Census | -- people
Sales Activity
Curious about local property values? Filter the chart to assess the volume and appreciation (including resales) trends and regional comparisons, or scroll to the map below view this information at an individual property level.
Find a Recent Sale
Sales Detail
Population
Tara has shown very soft population growth performance across periods assessed by AreaSearch
Tara's population was approximately 4,223 as of November 2025, reflecting a growth of 372 people since the 2021 Census. The population in 2021 was recorded as 3,851. This increase is inferred from an estimated resident population of 4,000 in June 2024 and an additional 279 validated new addresses since the Census date. The population density ratio is 0.30 persons per square kilometer. Tara's growth rate of 9.7% since the 2021 census exceeded that of the SA3 area (5.2%) and the SA4 region, indicating it as a growth leader in the region. Natural growth contributed approximately 47.5% of overall population gains during recent periods, with other factors such as overseas migration and interstate migration also being positive contributors.
AreaSearch adopts ABS/Geoscience Australia projections for each SA2 area, released in 2024 with a base year of 2022. For areas not covered by this data and years post-2032, Queensland State Government's SA2 area projections are used, released in 2023 based on 2021 data. However, these state projections do not provide age category splits, so AreaSearch applies proportional growth weightings aligned with ABS Greater Capital Region projections for each age cohort, released in 2023 and based on 2022 data. Projections indicate a decline in overall population over this period, with the area's population expected to decrease by 250 persons by 2041. However, growth is anticipated in specific age cohorts, notably the 75 to 84 age group, projected to increase by 60 people.
Frequently Asked Questions - Population
Development
AreaSearch assessment of residential development drivers sees a low level of activity in Tara, placing the area among the bottom 25% of areas assessed nationally
Tara has received approximately 4 dwelling approvals annually. Over the past 5 financial years, from FY21 to FY25, 22 homes were approved, with a further 7 approved in FY26 up to now. The average number of new residents per year arriving for each new home over these years is around 0.4.
This suggests that new supply is meeting or exceeding demand, providing ample buyer choice and capacity for population growth beyond current forecasts. The average construction cost value of new homes is $198,000, which is below the regional average, indicating more affordable housing options. In FY26, $4.3 million in commercial approvals have been registered, suggesting limited focus on commercial development. Compared to the rest of Queensland, Tara records about three-quarters the building activity per person.
Nationally, it ranks at the 34th percentile of areas assessed, indicating more limited choices for buyers and supporting demand for existing dwellings. However, building activity has accelerated in recent years. Recent activity consists entirely of detached houses, preserving the area's low density nature and attracting space-seeking buyers. The estimated population per dwelling approval is 470, reflecting a quiet, low activity development environment. Given stable or declining population forecasts, Tara may experience less housing pressure, creating favourable conditions for buyers.
Frequently Asked Questions - Development
Infrastructure
Tara has moderate levels of nearby infrastructure activity, ranking in the top 50% nationally
Changes to local infrastructure significantly influence an area's performance. AreaSearch has identified 18 projects that may impact the area. Key projects include New Tara Hospital, Origin Energy Darling Downs Battery Energy Storage System (BESS), Western Downs Green Power Hub, and Sixteen Mile Solar Farm. The following list details those most relevant:.
Professional plan users can use the search below to filter and access additional projects.
INFRASTRUCTURE SEARCH
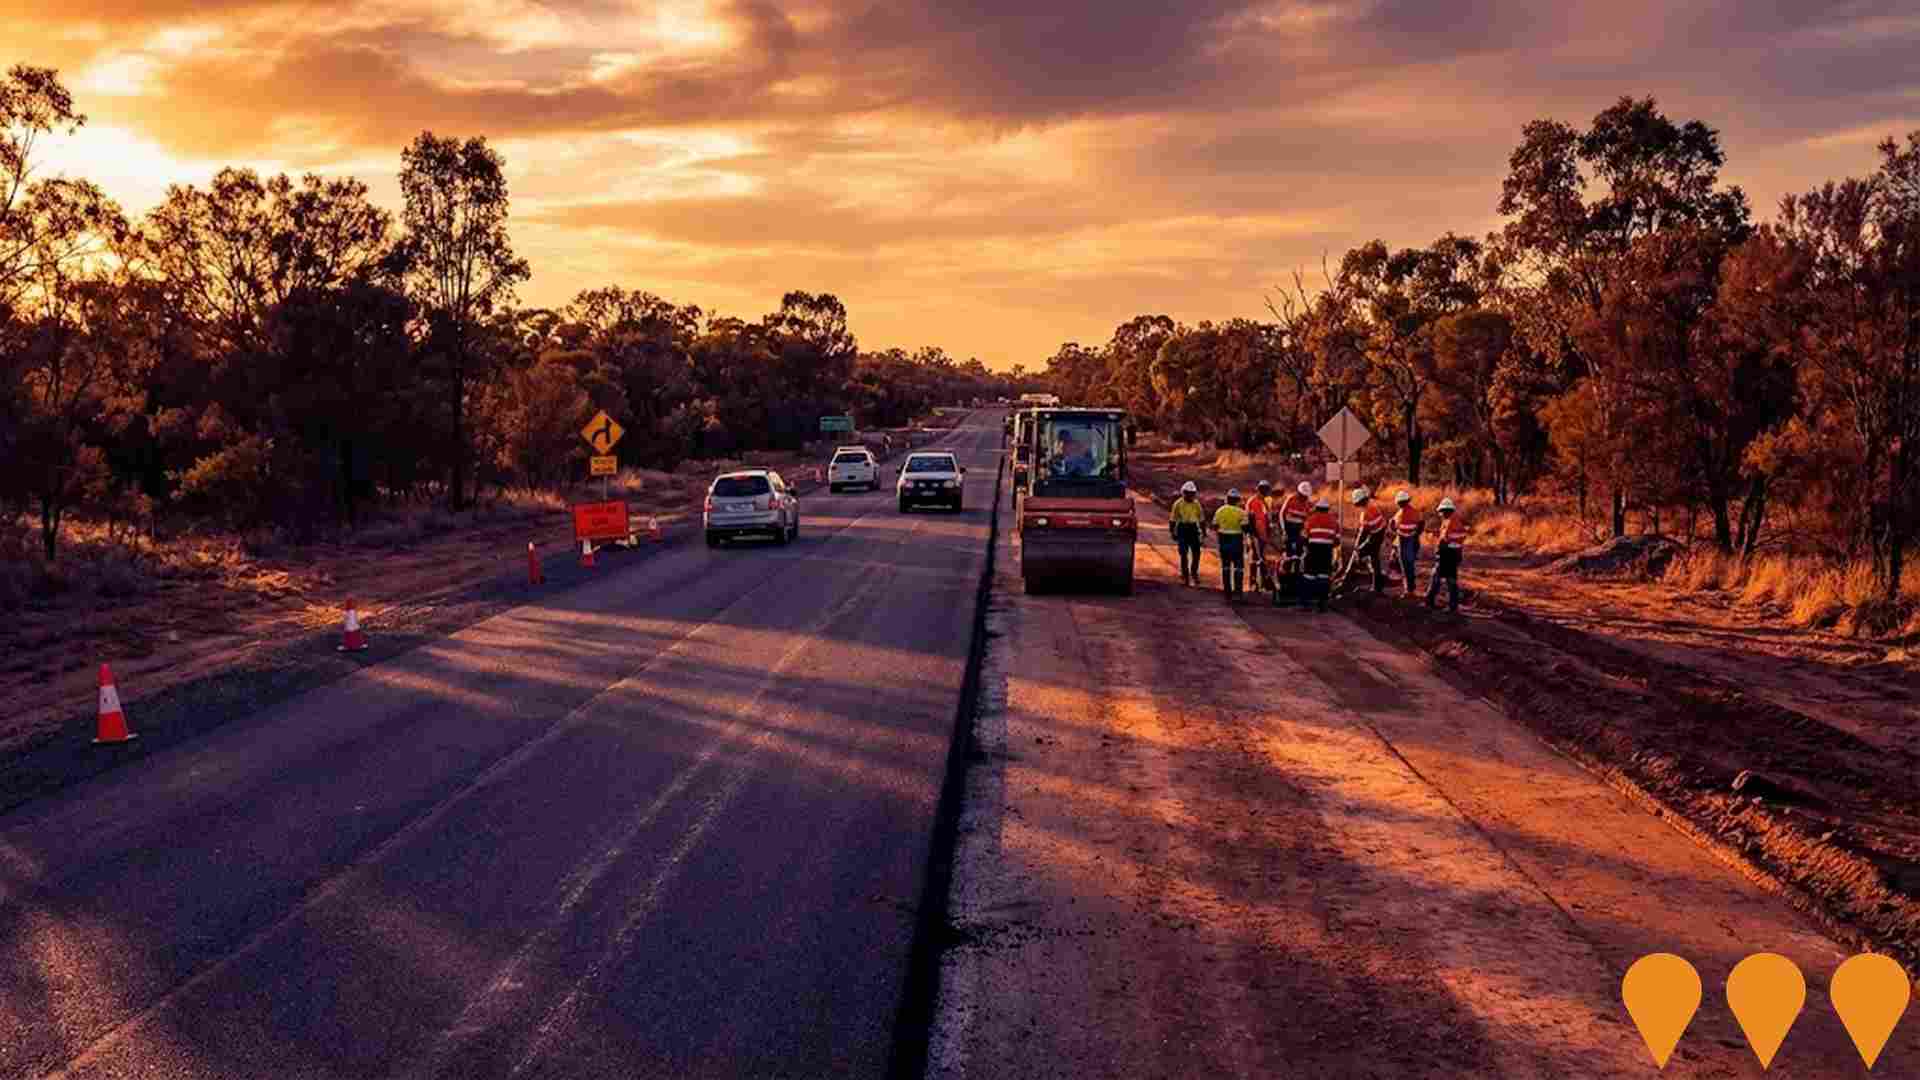
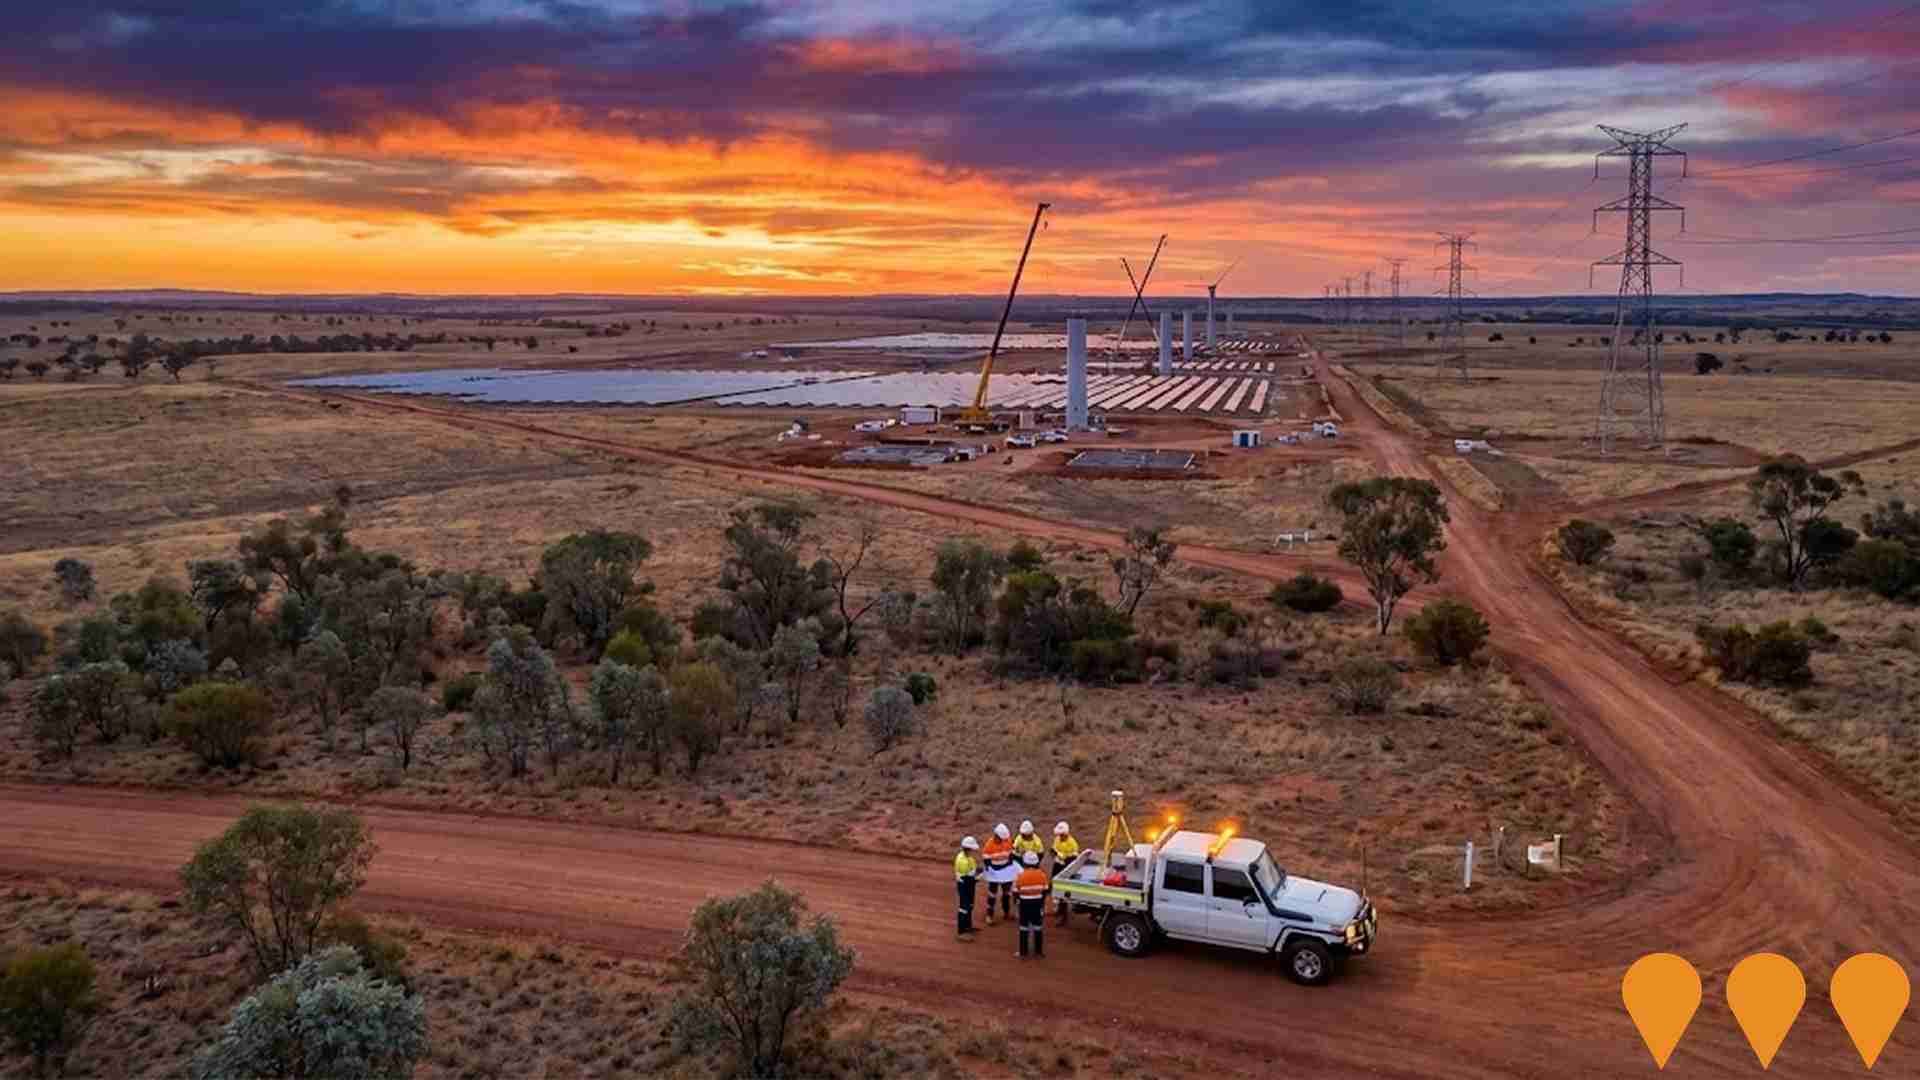
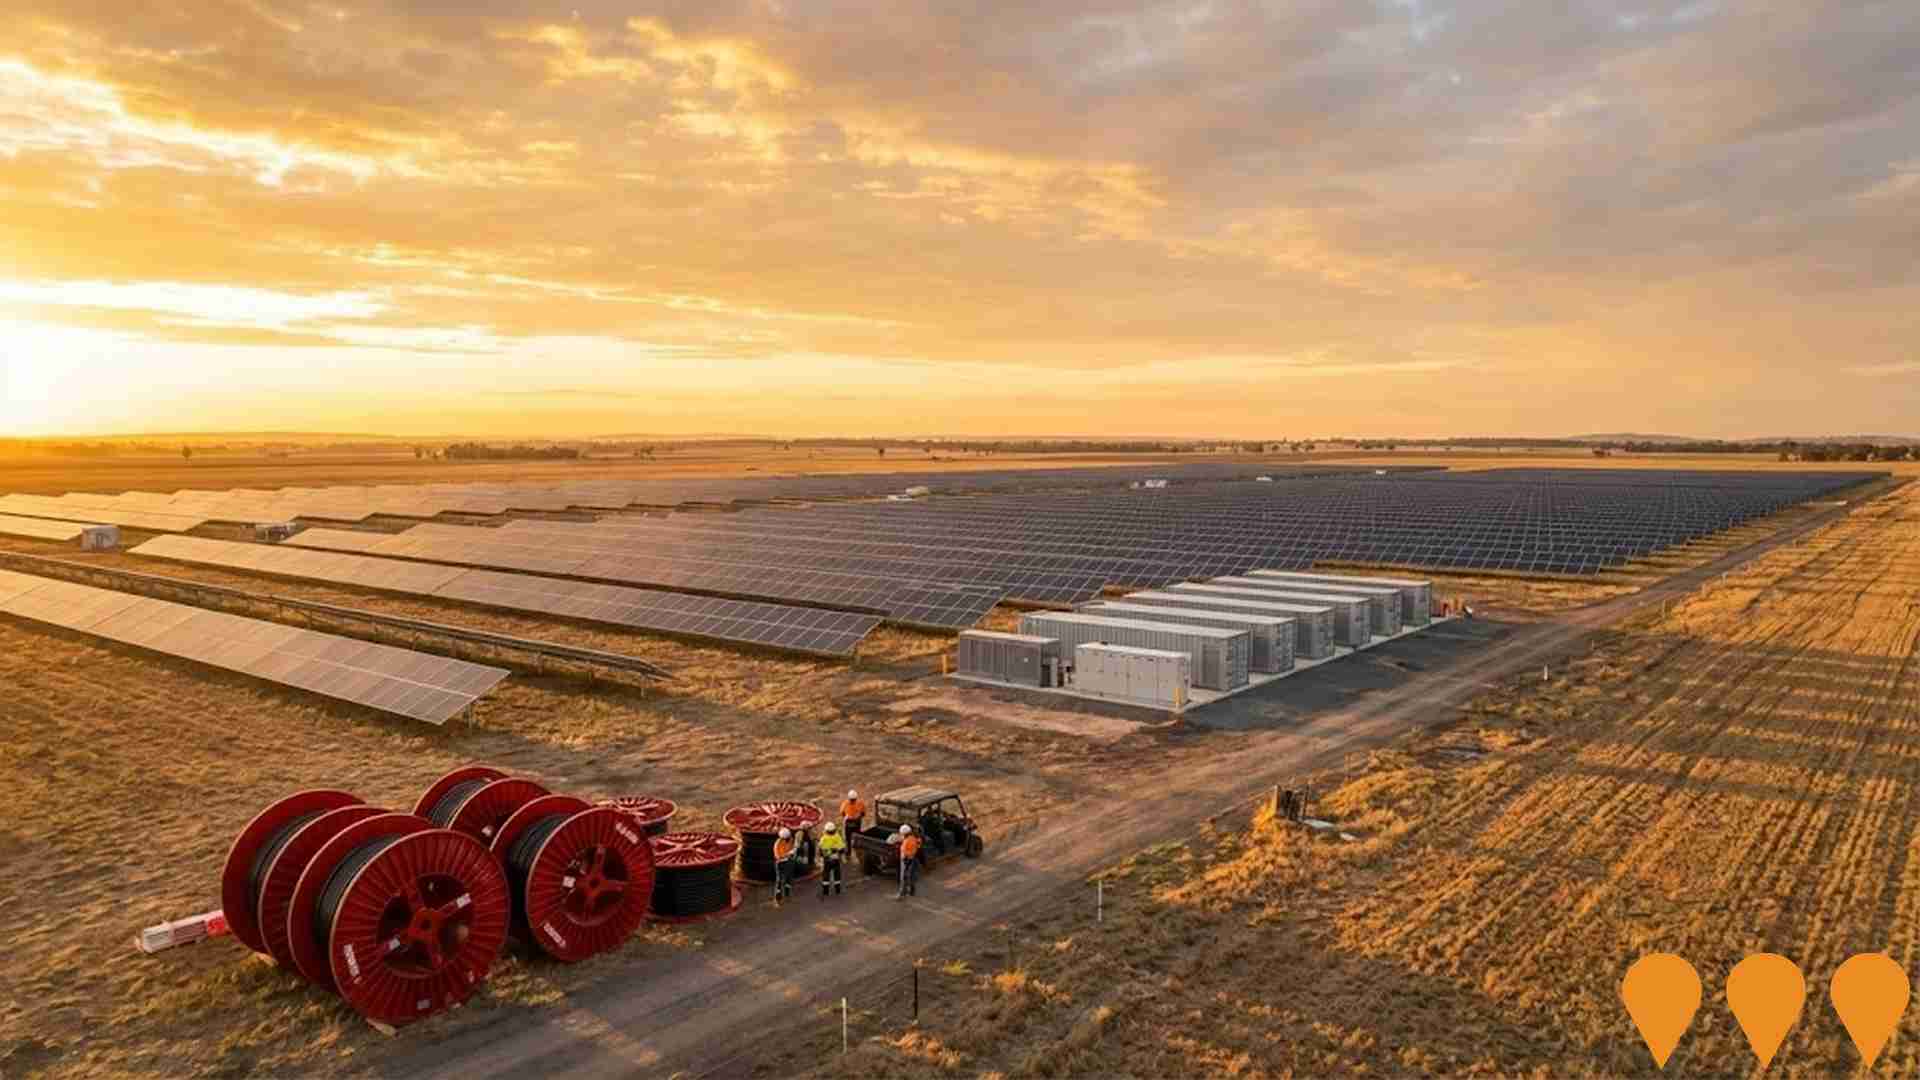
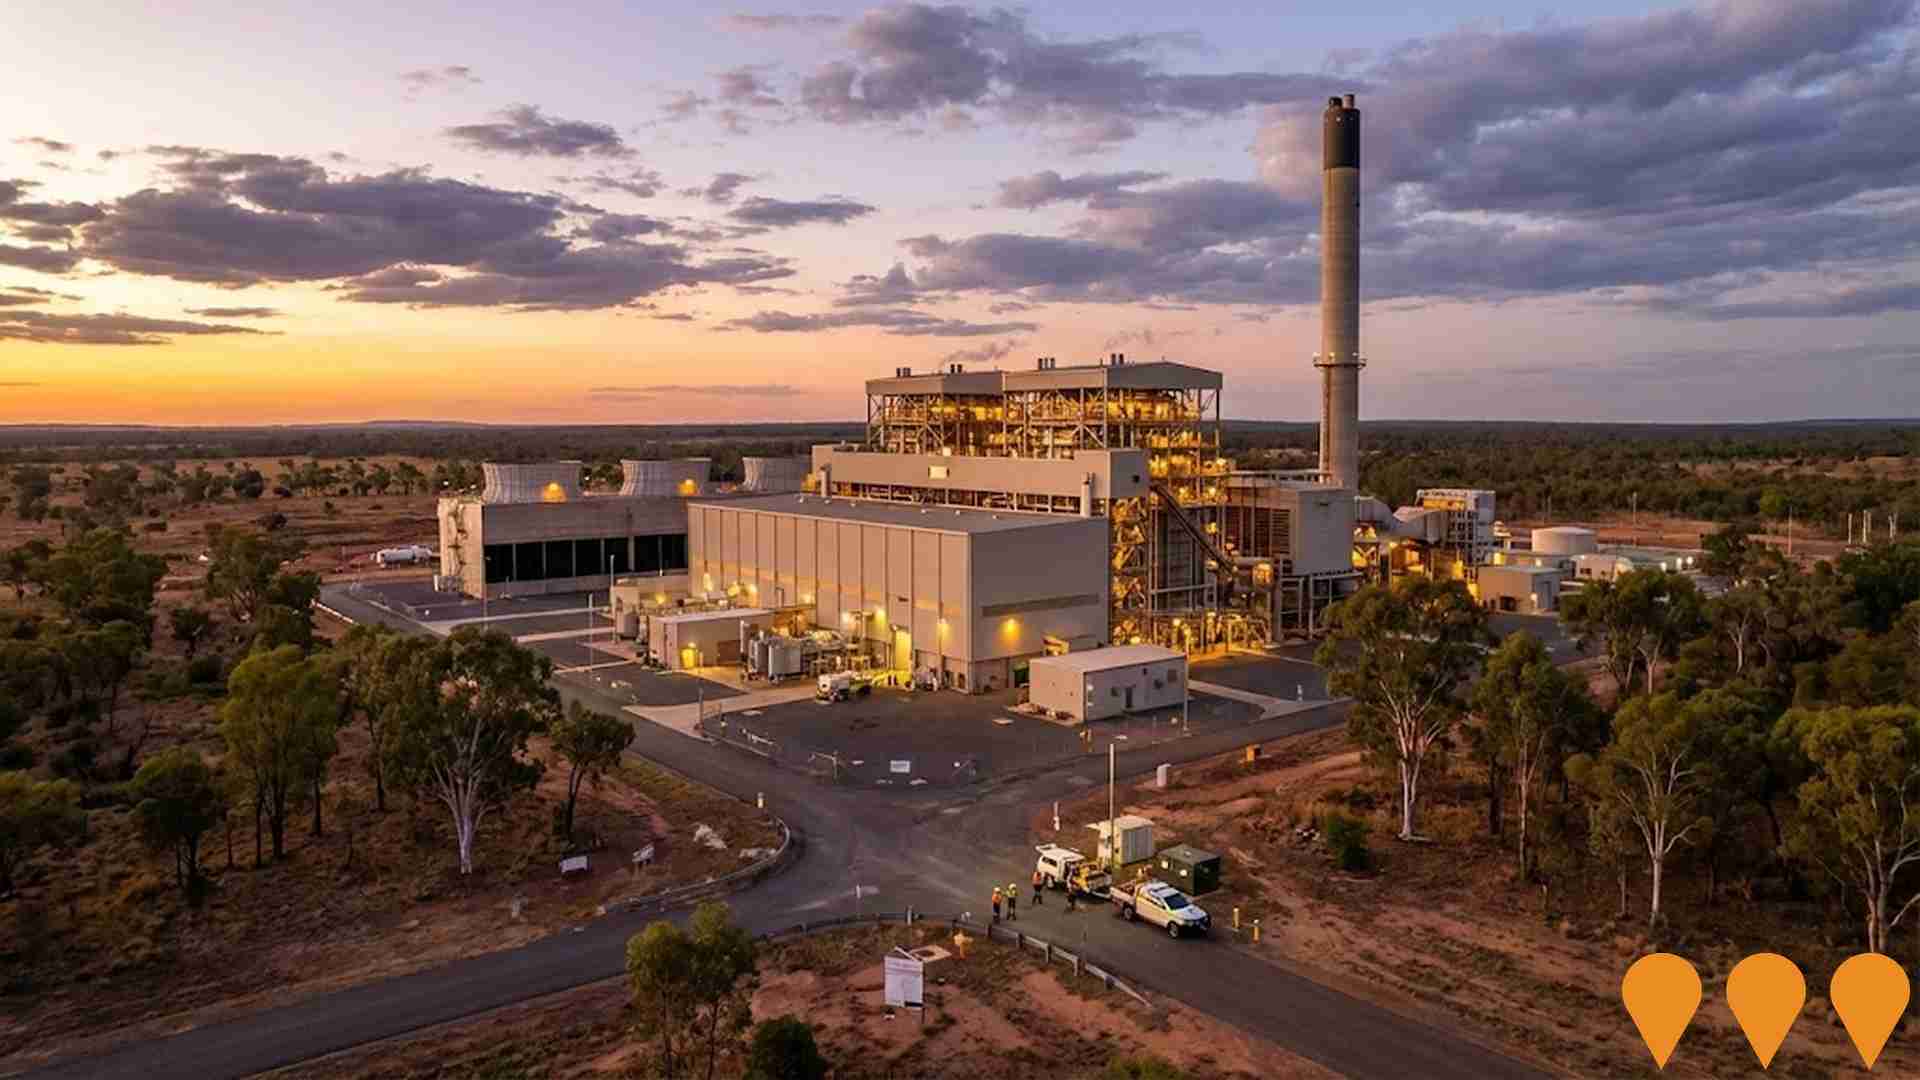
 Denotes AI-based impression for illustrative purposes only, not to be taken as definitive under any circumstances. Please follow links and conduct other investigations from the project's source for actual imagery. Developers and project owners wishing us to use original imagery please Contact Us and we will do so.
Frequently Asked Questions - Infrastructure
Arrow Energy Surat Gas Project North
The Surat Gas Project North expansion involves drilling up to 450 new coal seam gas wells, construction of a new field compression station, gas and water gathering pipelines, and associated infrastructure across approximately 5,000 square kilometres in the northern Surat Basin. The project will deliver an additional 130 TJ/day of gas to domestic and export markets. Construction commenced in late 2024, with first gas expected in 2026 and full ramp-up by 2029.

New Tara Hospital
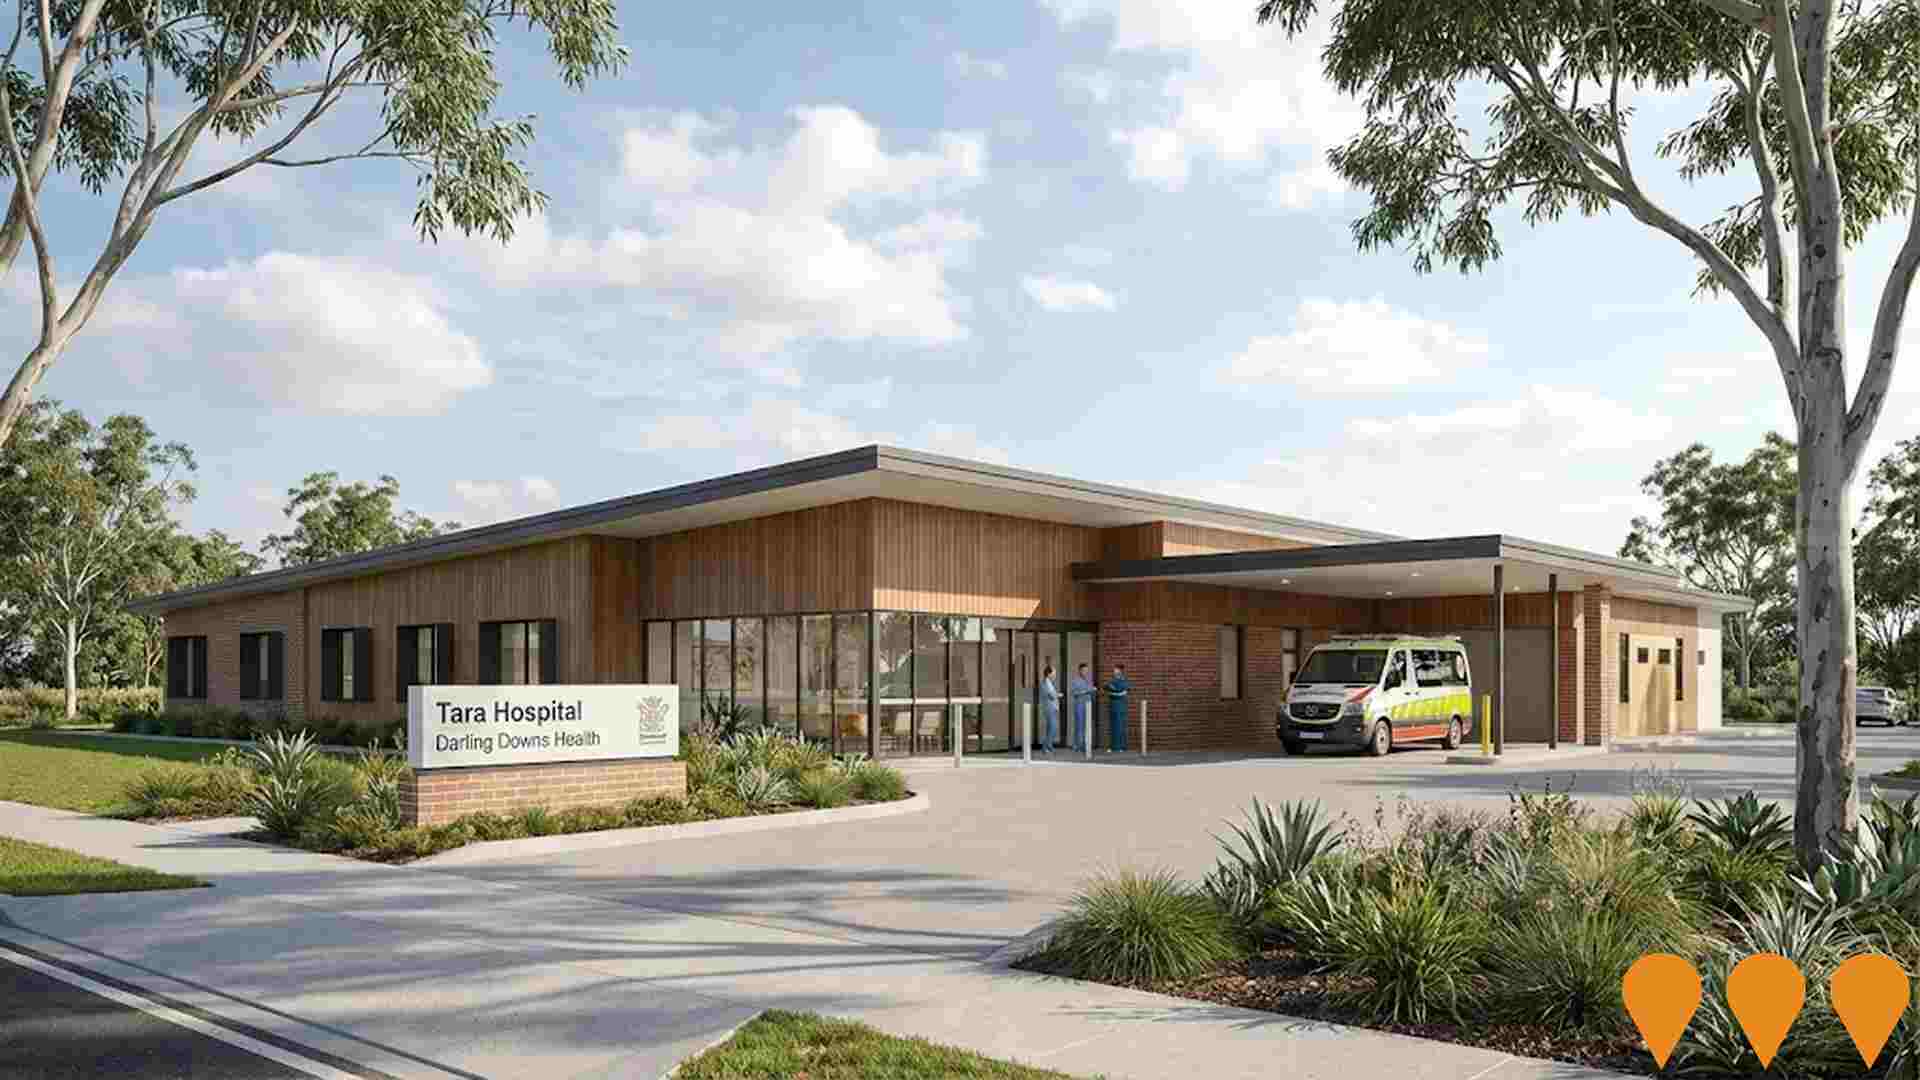
The new Tara Hospital replaces the existing 60-year-old facility as part of the Queensland Government's Building Rural and Remote Health Program. It features a modern design with 12 inpatient beds, an expanded emergency department, specialist outpatient services, digital connectivity, single inpatient rooms, and enhanced palliative care facilities, improving healthcare access for residents in Tara and surrounding areas.
Origin Energy Darling Downs Battery Energy Storage System (BESS)
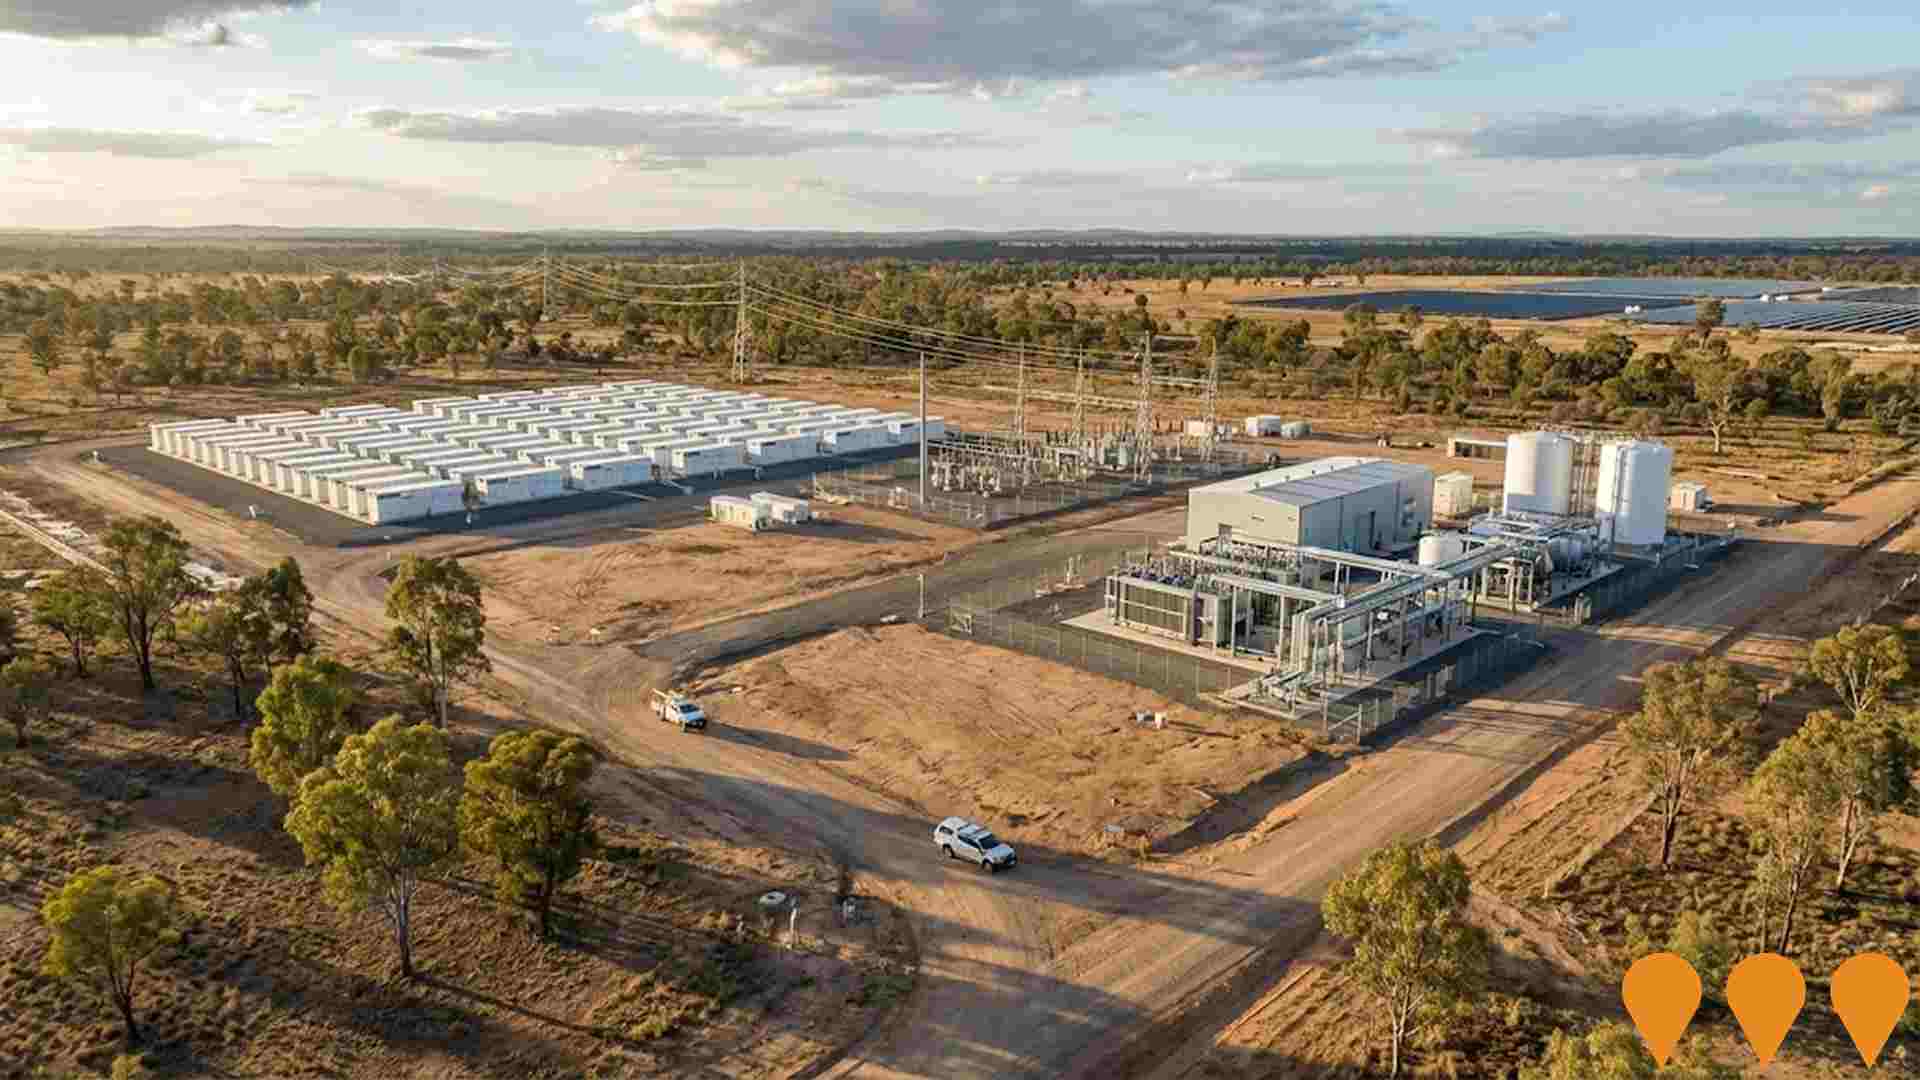
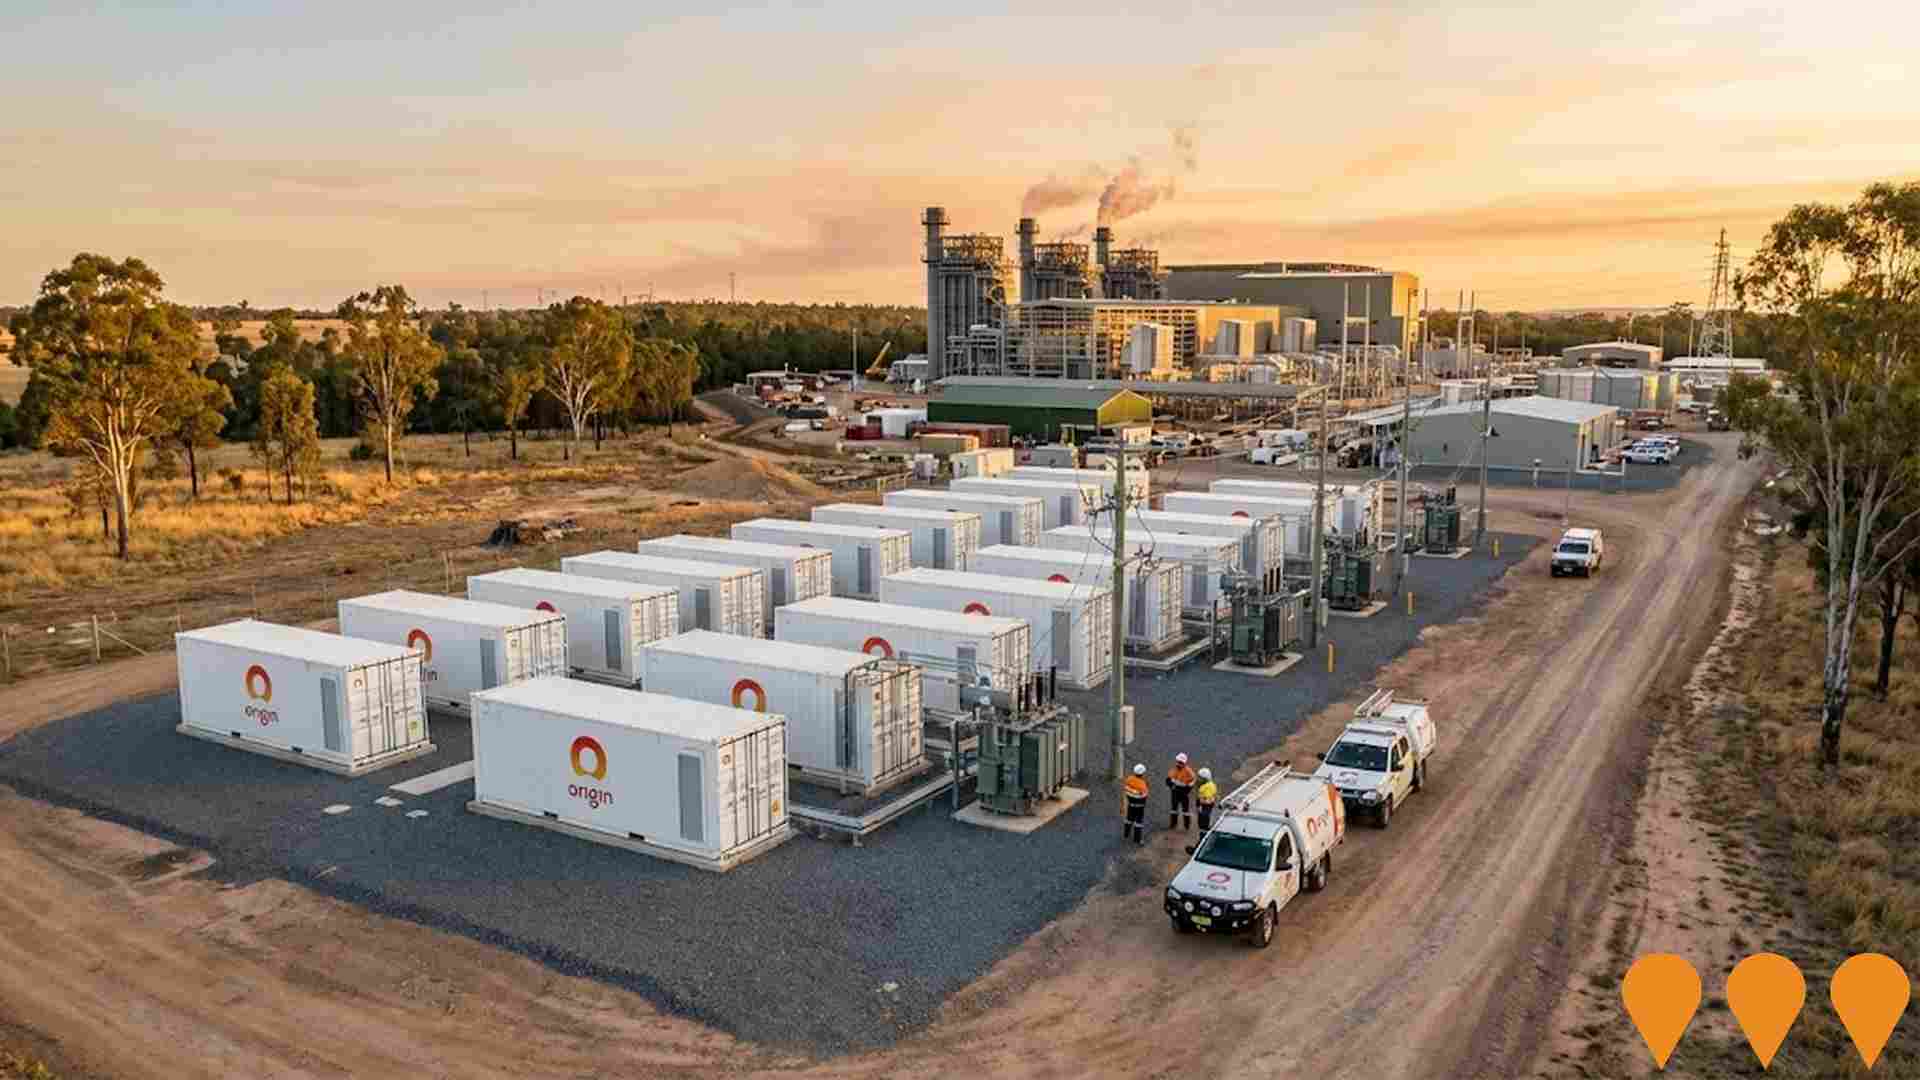
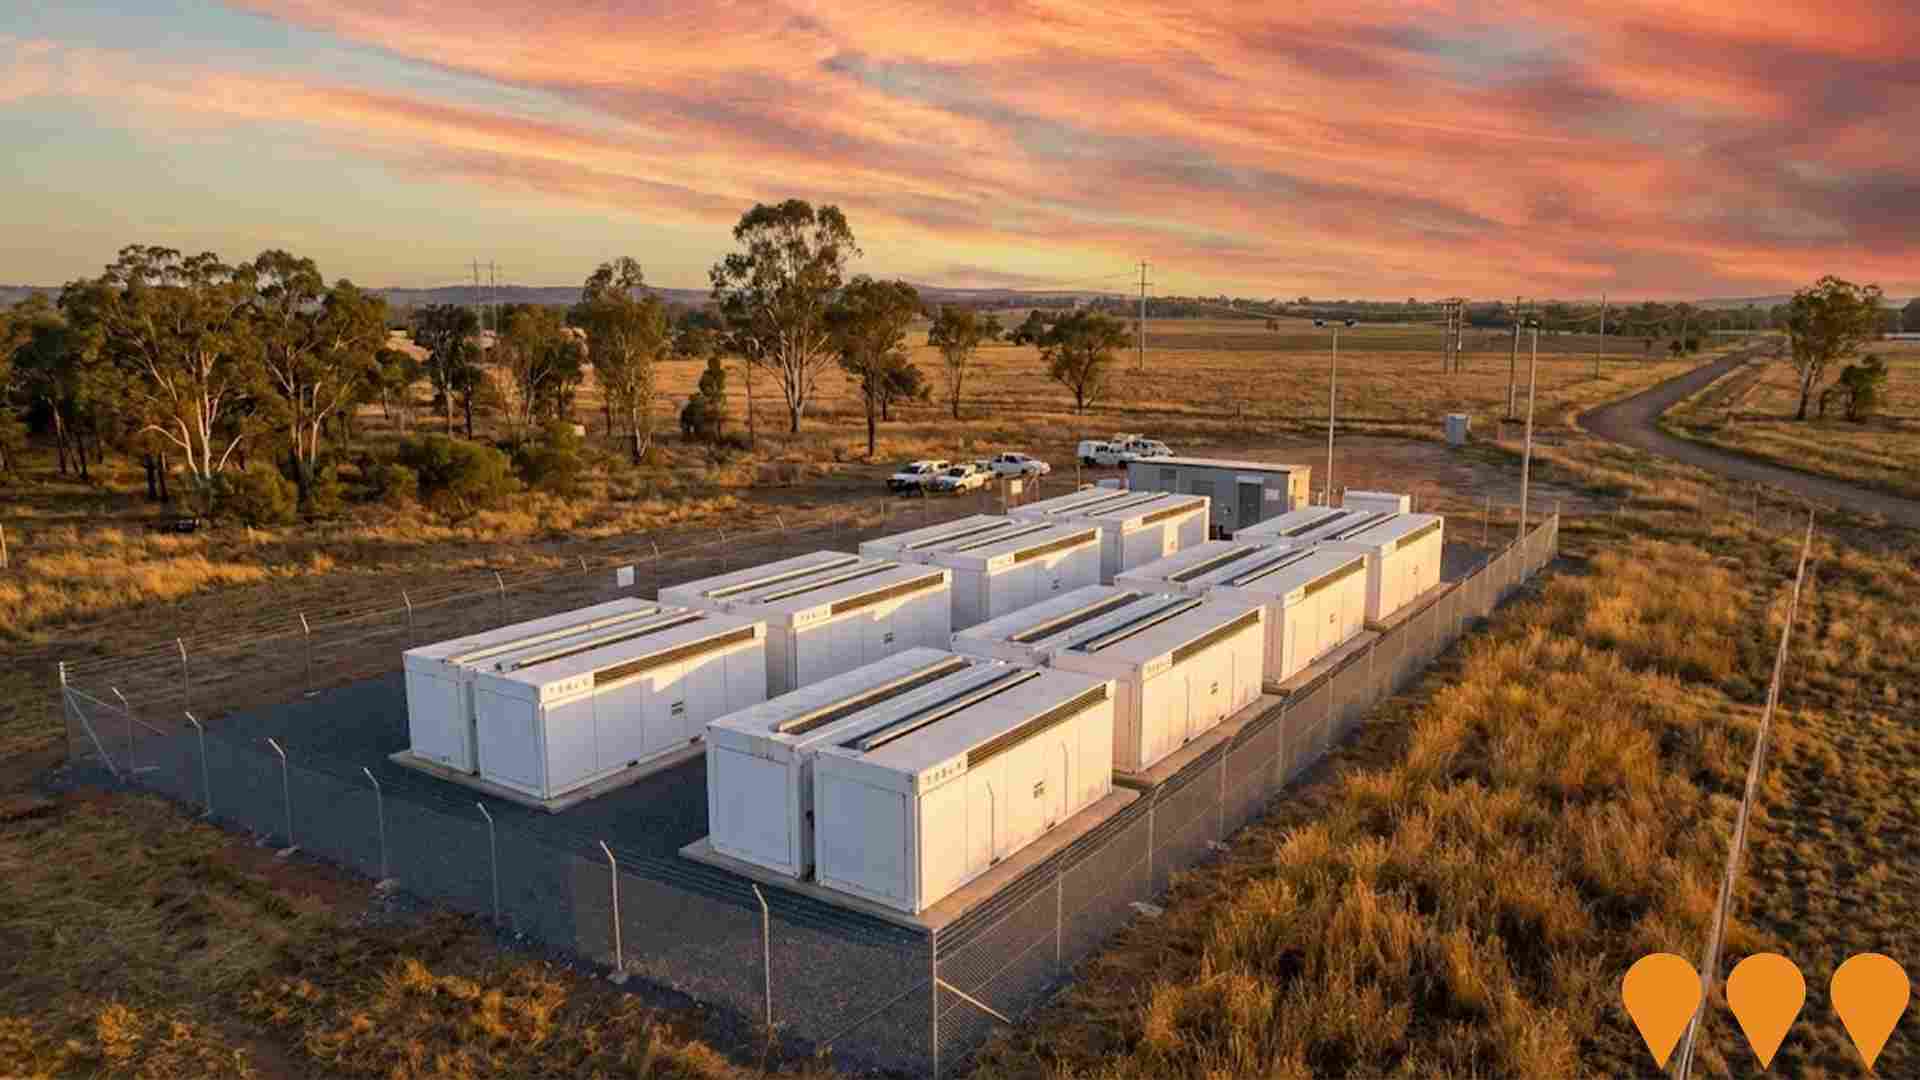
A 500 MW / 2,000 MWh battery energy storage system to be built beside Origin Energy's existing 630 MW Darling Downs Power Station near Kogan, about 40 km west of Dalby. This will be Queensland's largest battery, providing up to four hours of storage to support grid stability and renewable energy integration.
Chinchilla Battery
A 100MW/200MWh grid-scale battery energy storage system of 80 Tesla Megapack 2 units at CS Energy's Kogan Creek site. It stores surplus renewable energy and discharges during peak demand, enough to power about 33,000 homes for two hours. The battery began operating in the National Electricity Market in July 2024.
Western Downs Green Power Hub
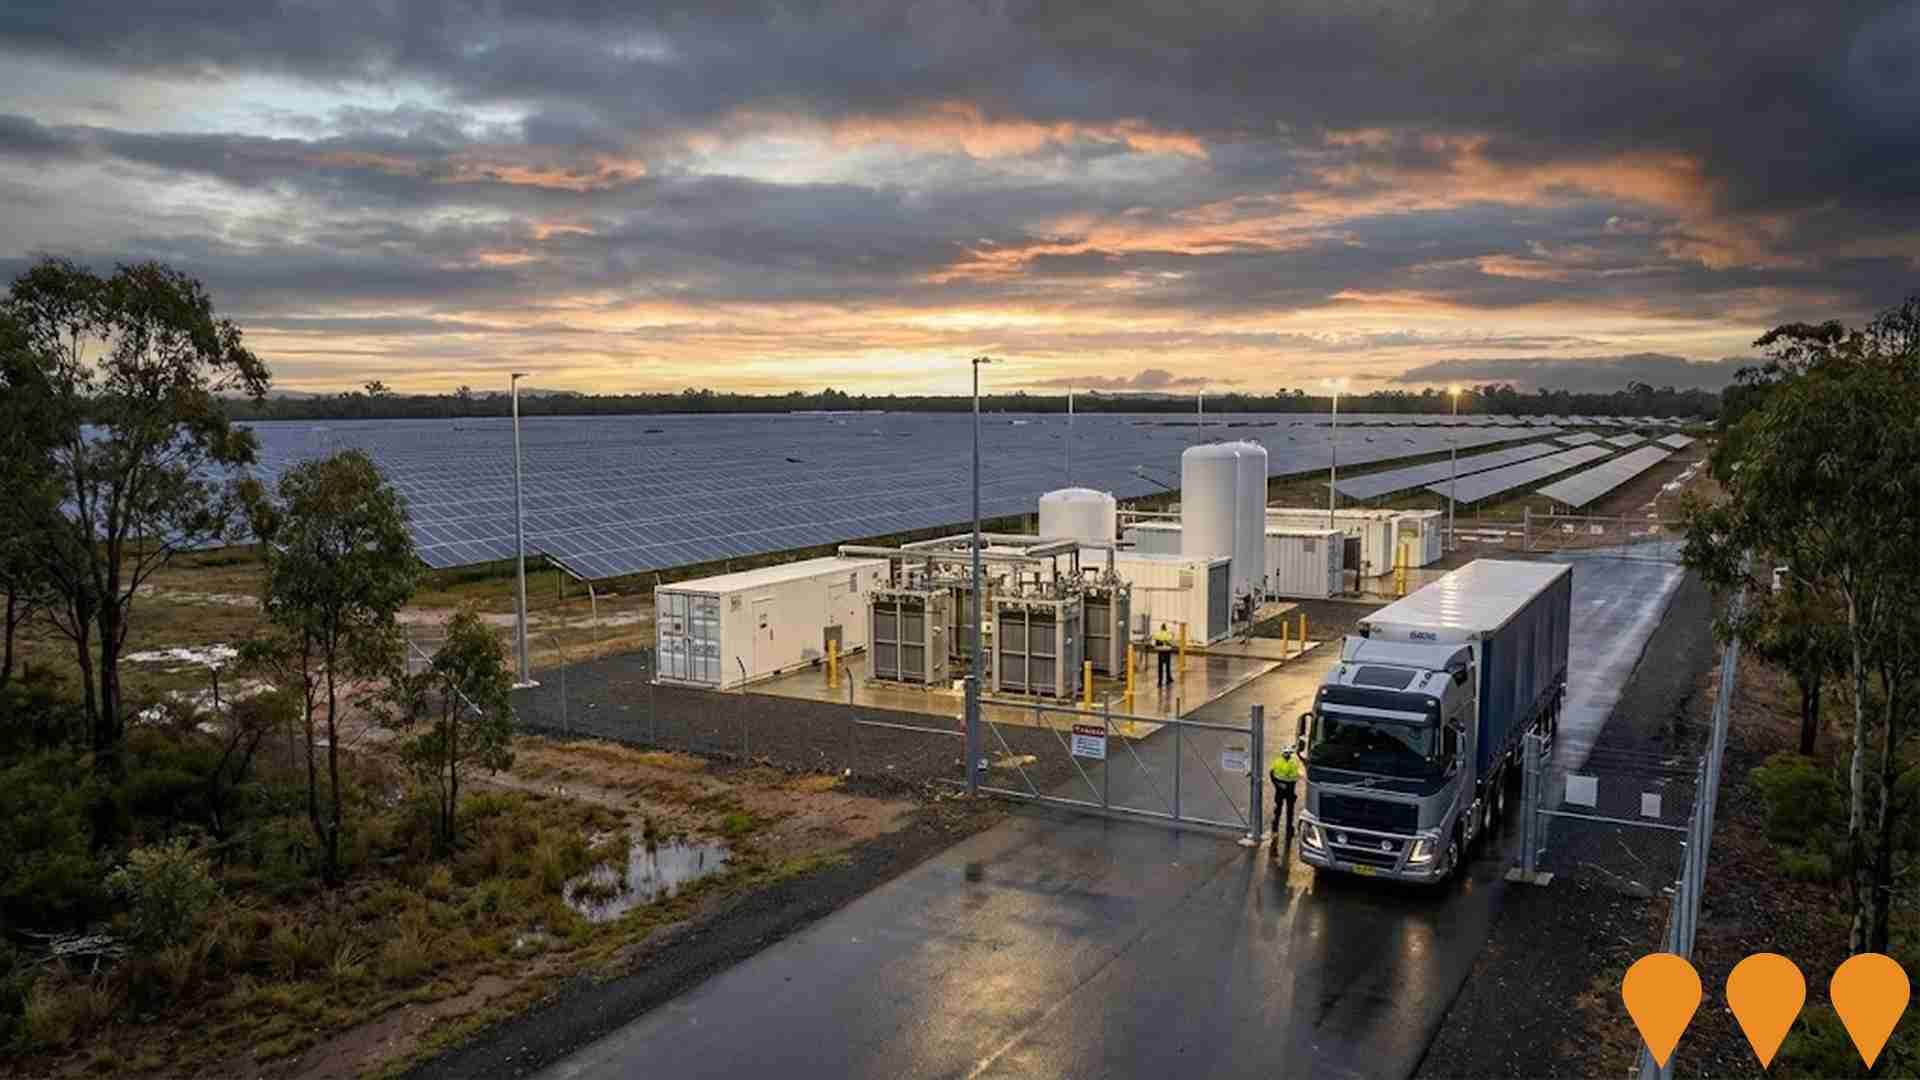
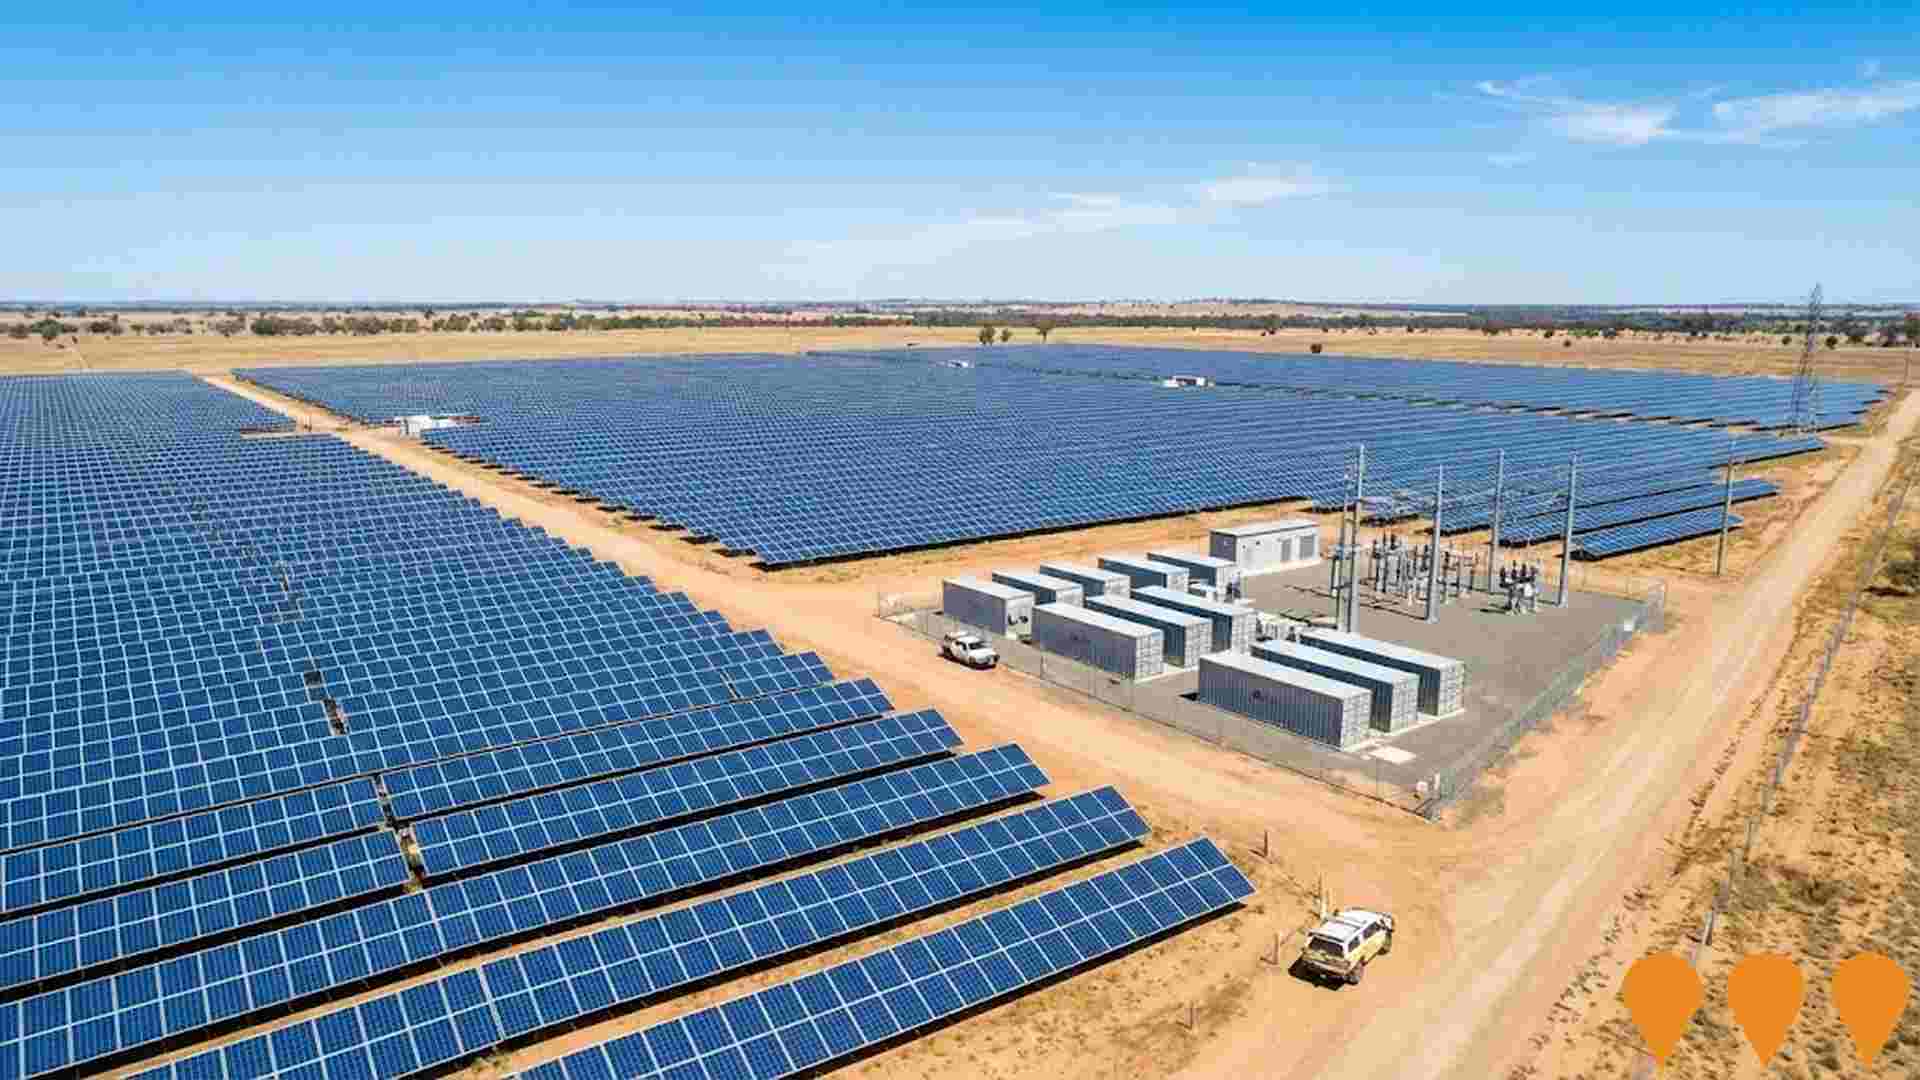
The Western Downs Green Power Hub is a major renewable energy project developed by Neoen Australia, comprising Australia's largest operating solar farm at 460 MWp (over 1 million panels, generating >1,080 GWh annually) and a co-located 540 MW / 1,080 MWh battery energy storage system in two equal stages. The solar farm has been fully operational since 2022. Battery Stage 1 (270 MW / 540 MWh) was completed and became operational in June 2025. Battery Stage 2 (270 MW / 540 MWh) is under construction following NTP in 2024, with operations expected in 2026. Located near Chinchilla with direct connection to Powerlink's Western Downs substation, the hub provides grid stability, clean energy under PPA with CleanCo Queensland, and community benefits including up to $100,000 annually for local initiatives.

Sixteen Mile Solar Farm
A 350 MW solar farm with a 120 MW / 240 MWh battery energy storage system located about 22 km south of Chinchilla. The project, developed by X-ELIO, comprises around 580,000 panels and will connect to the existing Western Downs Substation via a new powerline. The project received Australian Government approval in October 2024 and is targeting operations by late 2026, subject to final approvals and construction commencement.
Moonie Oil Field CO2 EOR Project
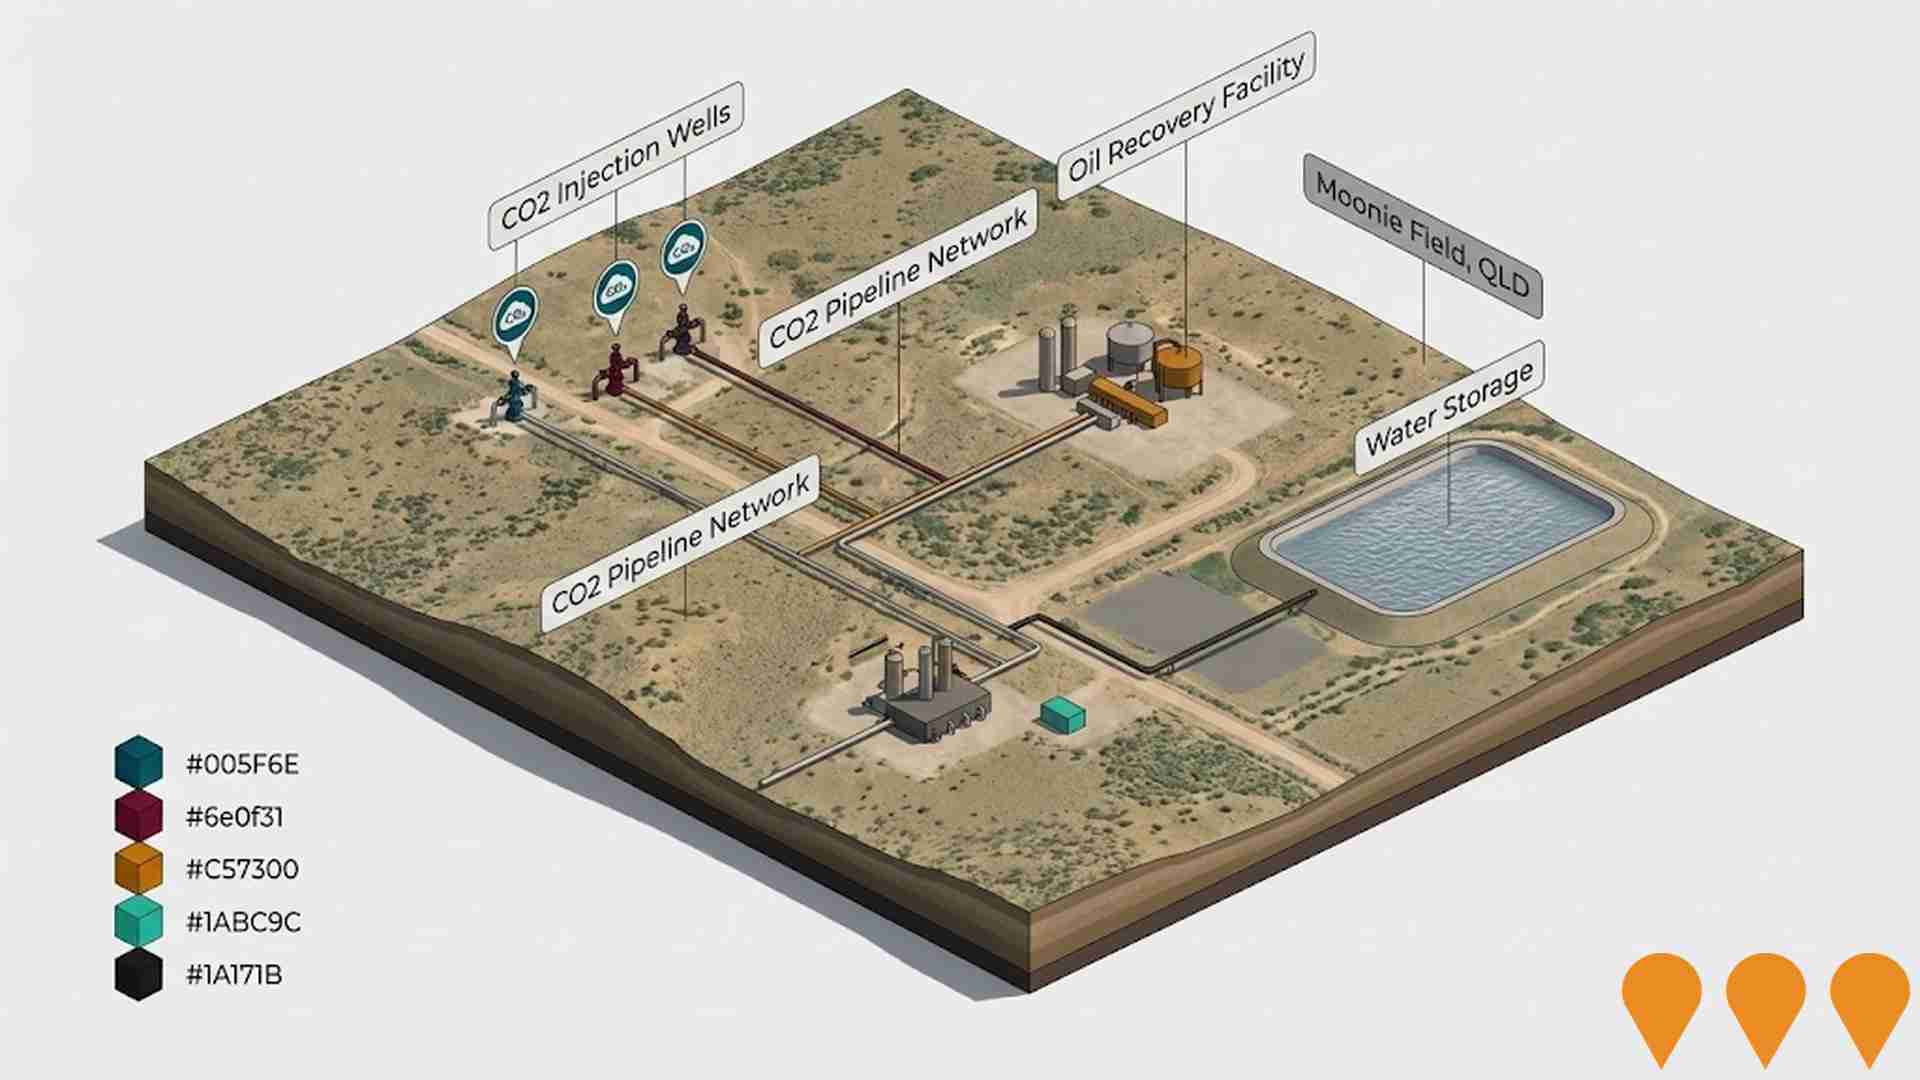
An Enhanced Oil Recovery (EOR) project at the Moonie Oil Field involving the injection of CO2 to extend oil recovery and sequester CO2. The project plans to inject 120,000 tonnes of CO2 per annum for eight years.
Arrow Energy Surat Pipeline Project
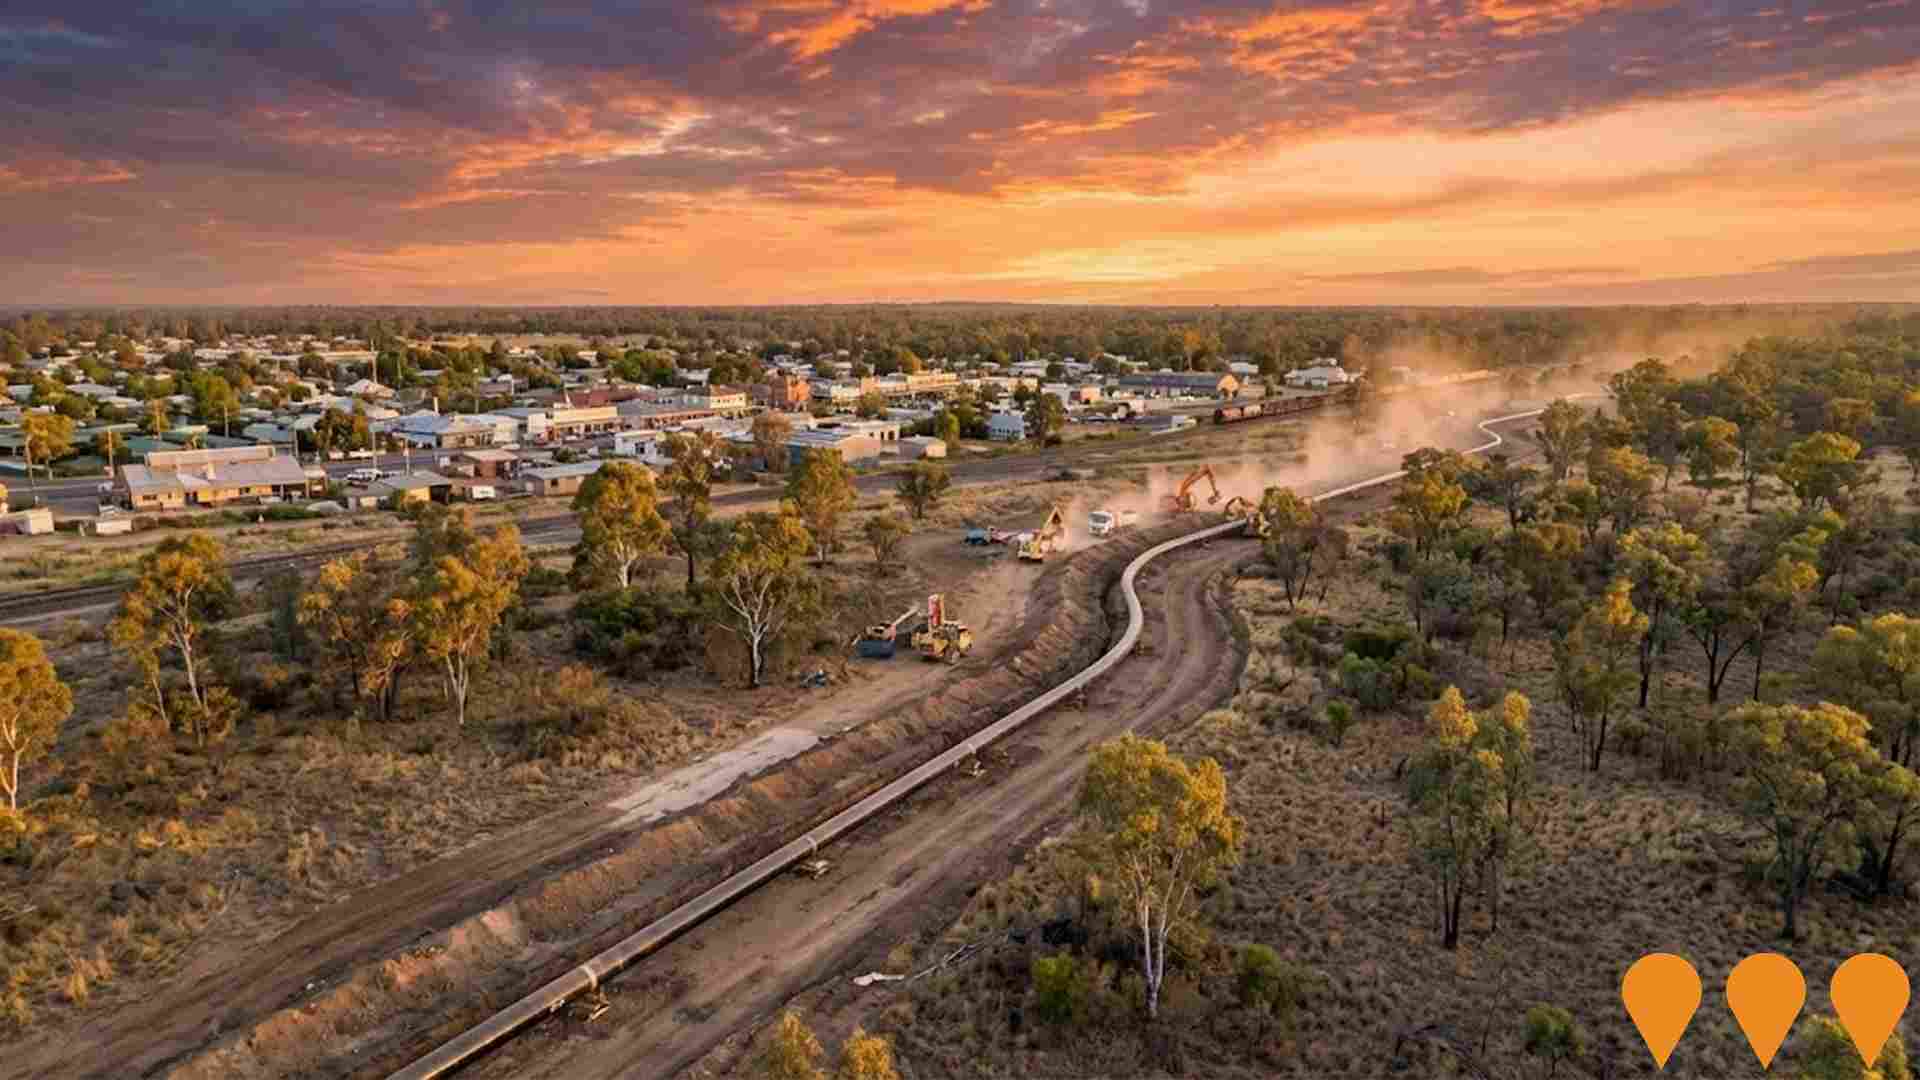
The Surat Pipeline Project is part of Arrow Energy's larger Surat Gas Project, involving the construction and operation of pipelines and related infrastructure to transport coal seam gas from production fields in the Surat Basin to processing facilities and markets, supporting Queensland's energy needs.
Employment
Employment conditions in Tara face significant challenges, ranking among the bottom 10% of areas assessed nationally
Tara's workforce comprises diverse sectors with equal white and blue-collar jobs, having an unemployment rate of 12.3% as of September 2025. There are 1,593 employed residents, with an unemployment rate 8.3% higher than Rest of Qld's 4.1%.
Workforce participation is lower at 46.6%, compared to Rest of Qld's 59.1%. Key industries include agriculture, forestry & fishing, education & training, and health care & social assistance. Tara specializes in agriculture, forestry & fishing with a share 9.2 times the regional level, but has fewer jobs in health care & social assistance at 7.6% compared to Rest of Qld's 16.1%. Local employment opportunities appear limited based on Census data analysis.
Between September 2024 and September 2025, Tara's labour force increased by 6.6%, while employment declined by 0.9%, raising unemployment by 6.6 percentage points. In contrast, Rest of Qld saw employment growth of 1.7% and labour force growth of 2.1%, with a 0.3 percentage point rise in unemployment. Statewide, Queensland's employment contracted by 0.01% (losing 1,210 jobs) as of 25-Nov, with an unemployment rate of 4.2%. National forecasts project total employment growth of 6.6% over five years and 13.7% over ten years. Applying these projections to Tara's industry mix suggests local employment should increase by 4.6% over five years and 10.5% over ten years, though this is a simple extrapolation for illustrative purposes only.
Frequently Asked Questions - Employment
Income
Income metrics place the area in the bottom 10% of locations nationally according to AreaSearch analysis
The median taxpayer income in Tara SA2 according to the latest postcode level ATO data aggregated by AreaSearch for financial year ending June 30, 2022 is $39,433. The average income was $44,751 during this period. This figure is below the national average of $68,883. In contrast, Rest of Qld had a median income of $50,780 and an average income of $64,844 in the same year. Based on Wage Price Index growth of 13.99% since financial year ending June 30, 2022, current estimates would be approximately $44,950 for median income and $51,012 for average income as of September 2025. Census data reveals that household, family and personal incomes in Tara all fall between the 2nd and 3rd percentiles nationally. The earnings profile shows that 30.9% of residents earn between $400 - $799 weekly (1,304 residents), unlike trends in the surrounding region where 31.7% fall within the $1,500 - $2,999 range. This concentration highlights economic challenges faced by a significant portion of the community. Housing costs are modest with 91.9% of income retained, but total disposable income ranks at just the 6th percentile nationally.
Frequently Asked Questions - Income
Housing
Tara is characterized by a predominantly suburban housing profile, with above-average rates of outright home ownership
In Tara, as per the latest Census evaluation, 94.1% of dwellings were houses with the remaining 5.9% being other types such as semi-detached properties, apartments, and 'other' dwellings. This is compared to Non-Metro Qld's figures of 90.3% houses and 9.7% other dwellings. Home ownership in Tara stood at 57.7%, with mortgaged dwellings at 20.0% and rented ones at 22.3%. The median monthly mortgage repayment was $790, significantly lower than Non-Metro Qld's average of $1,300. Weekly rent in Tara was recorded at $180, substantially below Non-Metro Qld's figure of $230 and the national average of $375. Nationally, Tara's median monthly mortgage repayment is significantly lower than the Australian average of $1,863.
Frequently Asked Questions - Housing
Household Composition
Tara features high concentrations of lone person households and group households, with a lower-than-average median household size
Family households constitute 62.3% of all households, including 21.8% couples with children, 28.8% couples without children, and 10.3% single parent families. Non-family households comprise the remaining 37.7%, with lone person households at 32.7% and group households accounting for 4.9%. The median household size is 2.3 people, smaller than the Rest of Qld average of 2.5.
Frequently Asked Questions - Households
Local Schools & Education
Tara faces educational challenges, with performance metrics placing it in the bottom quartile of areas assessed nationally
The area has university qualification rates of 10.6%, significantly lower than the Australian average of 30.4%. This discrepancy offers both a challenge and an opportunity for targeted educational initiatives. Bachelor degrees are the most common at 8.3%, followed by graduate diplomas (1.3%) and postgraduate qualifications (1.0%). Trade and technical skills are prominent, with 40.5% of residents aged 15+ holding vocational credentials – advanced diplomas (9.2%) and certificates (31.3%).
Educational participation is high, with 28.3% of residents currently enrolled in formal education. This includes 13.8% in primary education, 8.8% in secondary education, and 1.8% pursuing tertiary education.
Frequently Asked Questions - Education
Schools Detail
Nearby Services & Amenities
Transport
No public transport data available for this catchment area.
Frequently Asked Questions - Transport
Transport Stops Detail
Health
Health performance in Tara is a key challenge with a range of health conditions having marked impacts on both younger and older age cohorts
Tara faces significant health challenges, with various conditions affecting both younger and older residents. Private health cover stands at approximately 49% (~2,073 people), lower than the national average of 55.3%.
The most prevalent medical conditions are arthritis (11.8%) and mental health issues (9.9%). Conversely, 58.2% report no medical ailments, compared to 67.6% in Rest of Qld. Tara has a higher proportion of seniors aged 65 and over at 21.8% (~919 people), exceeding the Rest of Qld's 18.2%. Health outcomes among seniors largely align with those of the general population.
Frequently Asked Questions - Health
Cultural Diversity
The latest Census data sees Tara placing among the least culturally diverse areas in the country when compared across a range of language and cultural background related metrics
Tara's cultural diversity was found to be below average, with 85.5% of its population being citizens, 90.7% born in Australia, and 96.6% speaking English only at home. The dominant religion in Tara is Christianity, which accounts for 59.5% of the population. This compares to 64.6% across the Rest of Qld.
Regarding ancestry (country of birth of parents), the top three groups represented in Tara are Australian (32.5%), English (30.8%), and Scottish (8.4%). Notably, certain ethnic groups have different representations: German is overrepresented at 5.9% in Tara compared to 5.3% regionally, Australian Aboriginal is underrepresented at 5.6% versus 6.7%, and Hungarian is slightly higher than the regional average at 0.3%.
Frequently Asked Questions - Diversity
Age
Tara hosts an older demographic, ranking in the top quartile nationwide
Tara's median age is 47 years, which is notably higher than Rest of Qld's median age of 41 years, and significantly older than the national norm of 38 years. Compared to the Rest of Qld average, Tara has an over-representation of the 55-64 cohort at 17.2%, while the 35-44 year-olds are under-represented at 10.4%. This concentration in the 55-64 age group is well above the national average of 11.2%. Between 2021 and present, the 25 to 34 age group has grown from 9.2% to 10.4%, while the 75 to 84 cohort increased from 5.9% to 7.0%. Conversely, the 45 to 54 cohort has declined from 15.2% to 13.2%, and the 5 to 14 group dropped from 12.2% to 10.8%. Demographic modeling suggests that Tara's age profile will evolve significantly by 2041. The 75 to 84 age cohort is projected to expand by 35 people (12%), growing from 293 to 329. Notably, the combined 65+ age groups are expected to account for 88% of total population growth, reflecting the area's aging demographic profile. In contrast, population declines are projected for the 0 to 4 and 65 to 74 cohorts.
