Chart Color Schemes
This analysis uses ABS Statistical Areas Level 2 (SA2) boundaries, which can materially differ from Suburbs and Localities (SAL) even when sharing similar names.
SA2 boundaries are defined by the Australian Bureau of Statistics and are designed to represent communities for statistical reporting (e.g., census and ERP).
Suburbs and Localities (SAL) represent commonly-used suburb/locality names (postal-style areas) and may use different geographic boundaries. For comprehensive analysis, consider reviewing both boundary types if available.
est. as @ -- *
ABS ERP | -- people | --
2021 Census | -- people
Sales Activity
Curious about local property values? Filter the chart to assess the volume and appreciation (including resales) trends and regional comparisons, or scroll to the map below view this information at an individual property level.
Find a Recent Sale
Sales Detail
Population
An assessment of population growth drivers in Clermont reveals an overall ranking slightly below national averages considering recent, and medium term trends
Clermont's population is around 4,067 as of Nov 2025. This reflects an increase of 174 people since the 2021 Census, which reported a population of 3,893 people. The change is inferred from the estimated resident population of 4,050 in June 2024 and an additional 19 validated new addresses since the Census date. This level of population equates to a density ratio of 0.10 persons per square kilometer. Population growth was primarily driven by natural growth contributing approximately 74.0% of overall population gains during recent periods.
AreaSearch is adopting ABS/Geoscience Australia projections for each SA2 area, released in 2024 with 2022 as the base year. For areas not covered and years post-2032, Queensland State Government's SA2 area projections are adopted, released in 2023 based on 2021 data. These state projections do not provide age category splits; hence proportional growth weightings in line with ABS Greater Capital Region projections are applied for each age cohort. Considering projected demographic shifts, lower quartile growth is anticipated, with the area expected to increase by 166 persons to 2041 based on latest annual ERP population numbers, reflecting a total increase of 3.6% over the 17 years.
Frequently Asked Questions - Population
Development
Residential development activity is lower than average in Clermont according to AreaSearch's national comparison of local real estate markets
Clermont has seen minimal construction activity with two new dwellings approved annually on average over the past five years, totalling 13. This low level of development reflects the rural nature of the area, where housing needs often drive development rather than broader market demand. It is important to note that the small number of approvals can significantly impact annual growth and relativity statistics.
Compared to Rest of Qld and national averages, Clermont has much lower development activity. Recent building activity consists entirely of standalone homes, reflecting the rural character of the area where larger properties are typical. The estimated population per dwelling approval is 1673 people, indicating a quiet, low activity development environment. According to AreaSearch's latest quarterly estimate, Clermont is expected to grow by 146 residents by 2041.
If current development rates continue, housing supply may not keep pace with population growth, potentially increasing competition among buyers and supporting stronger price growth.
Frequently Asked Questions - Development
Infrastructure
Clermont has strong levels of nearby infrastructure activity, ranking in the top 30% nationally
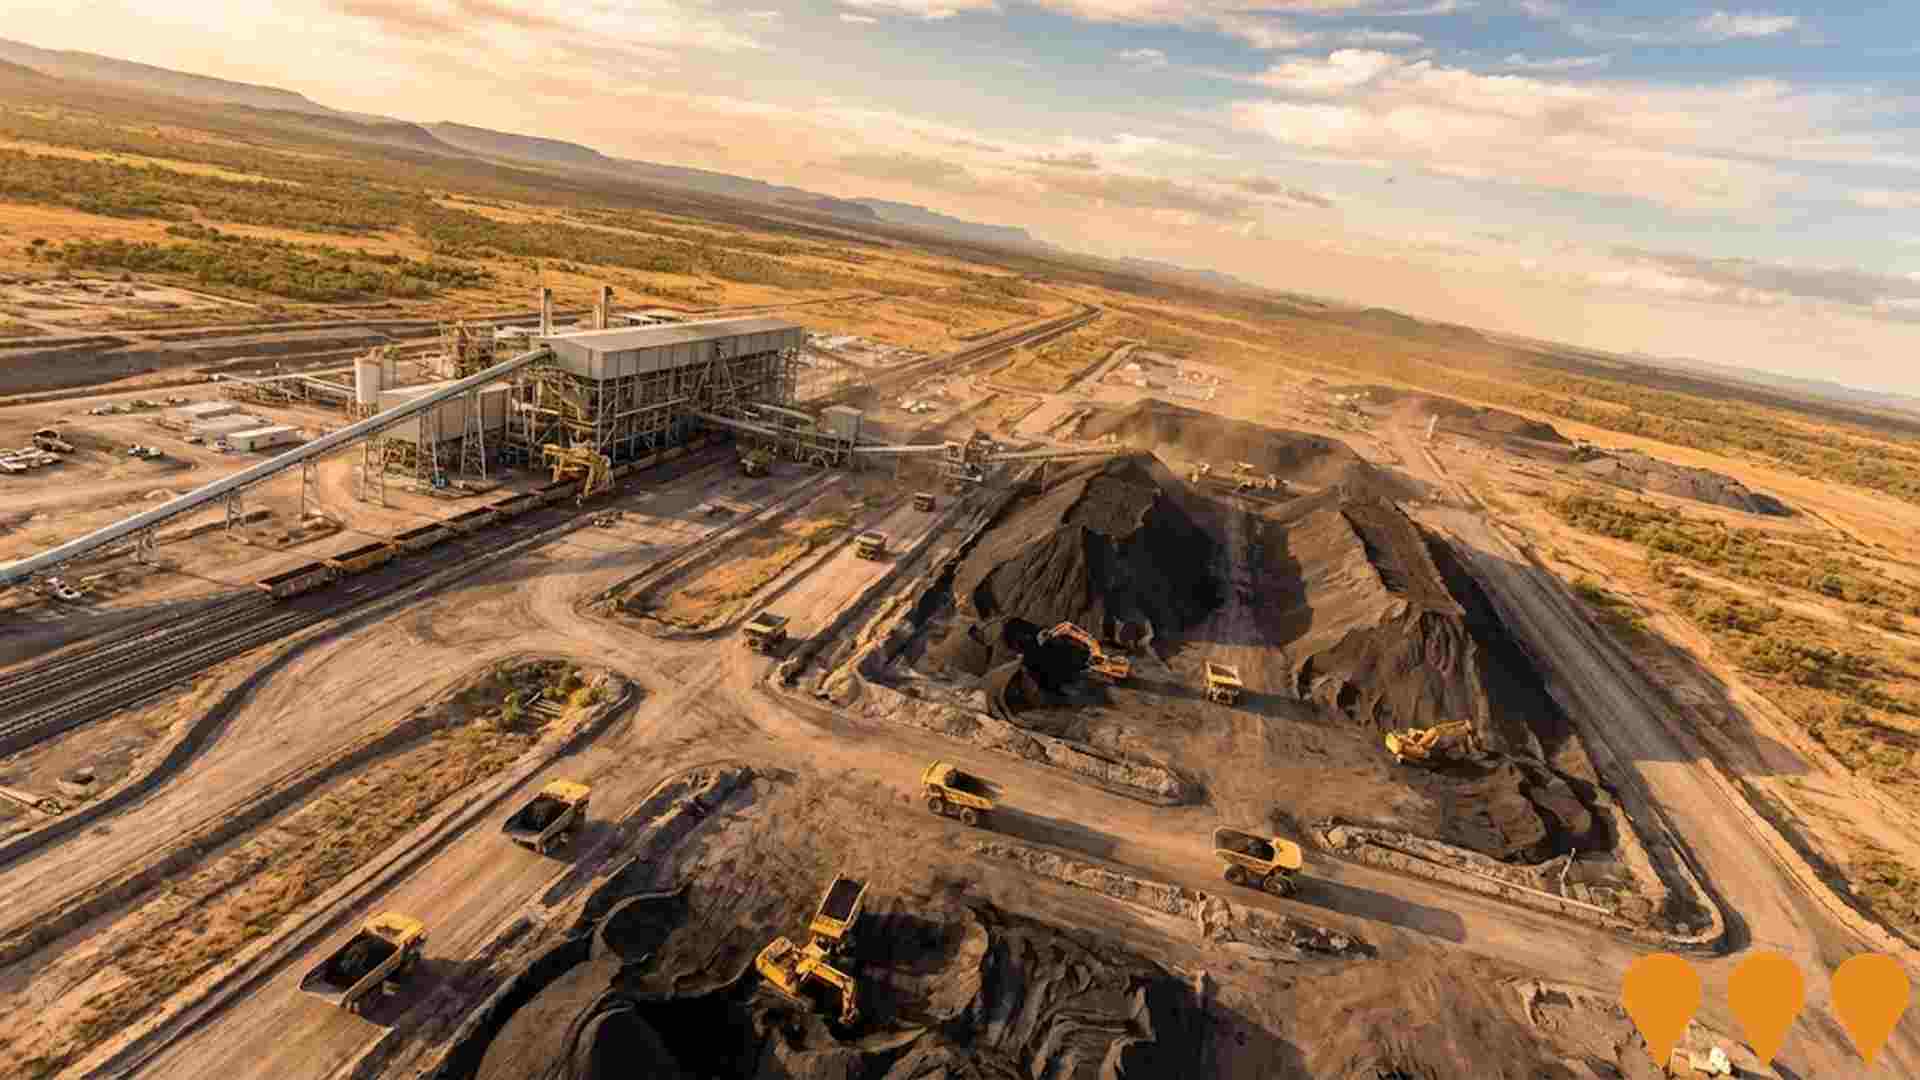
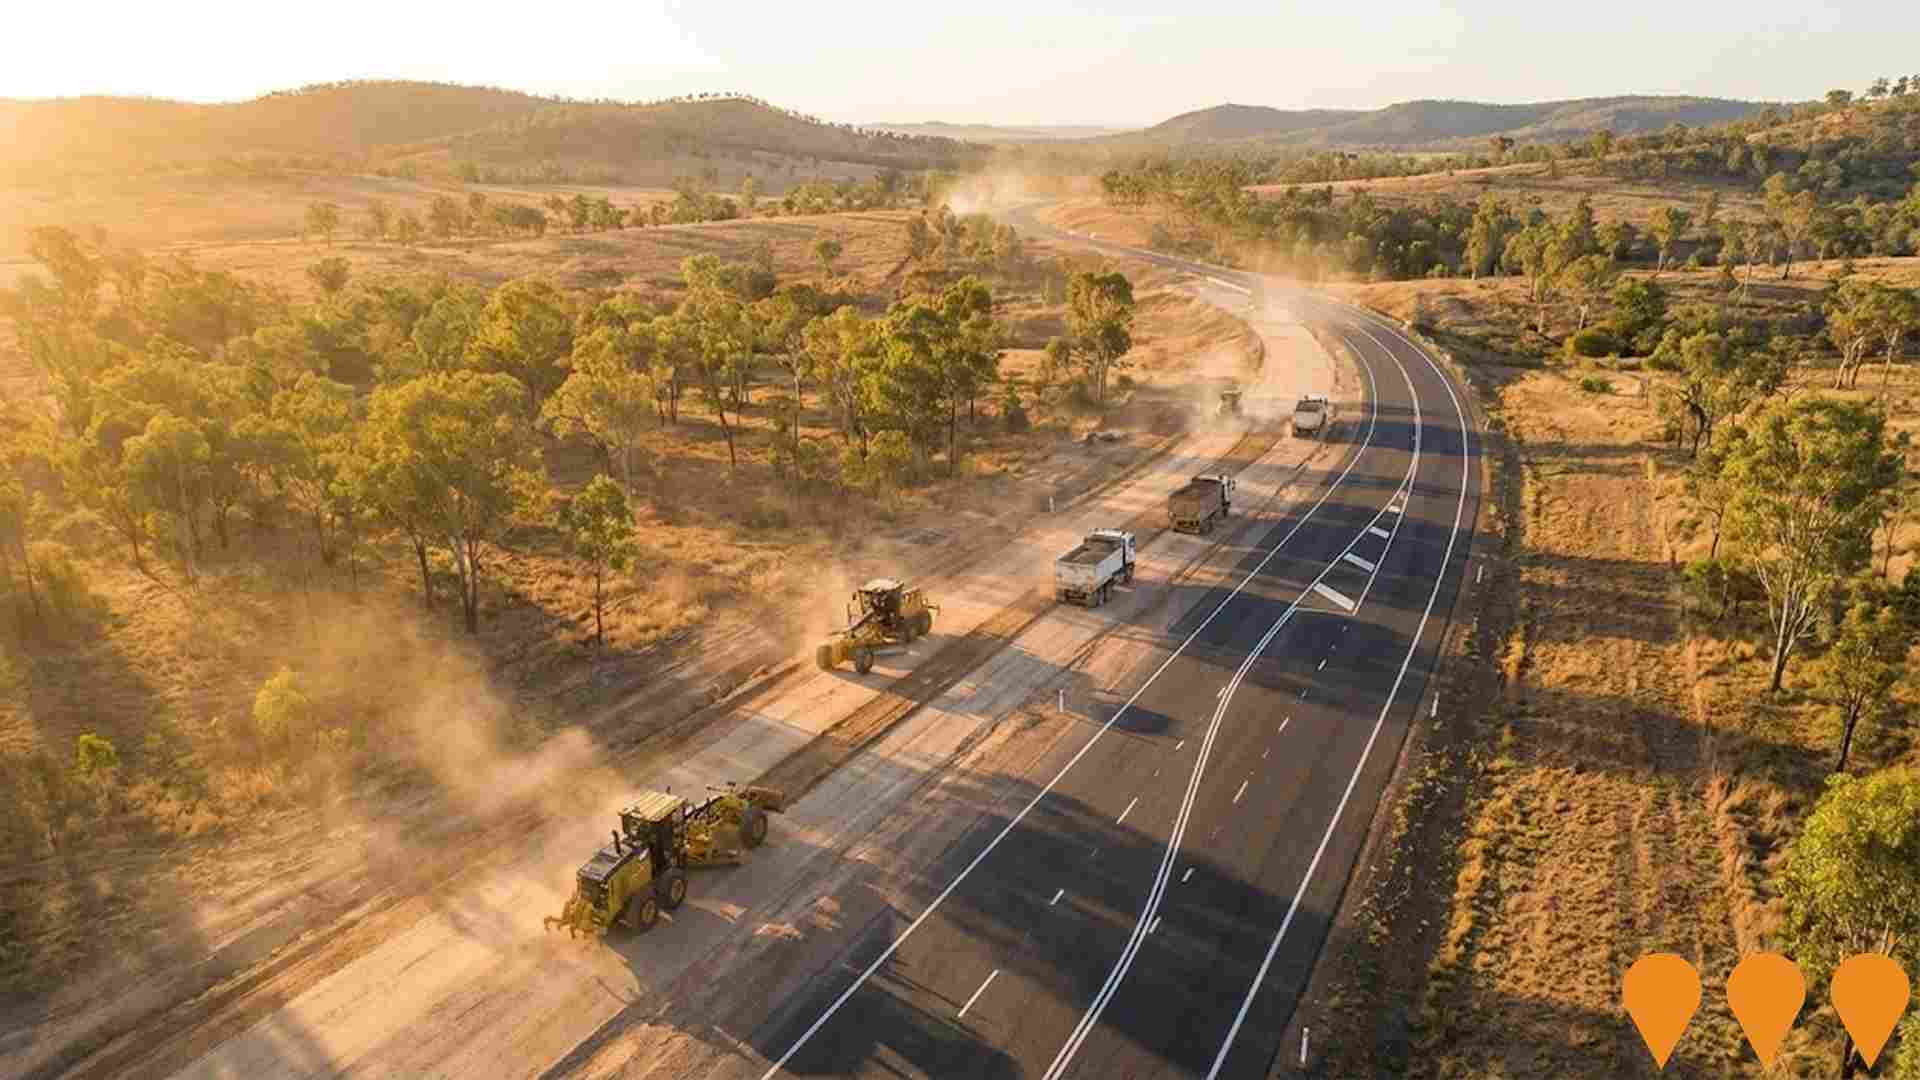
Changes to local infrastructure significantly impact an area's performance. AreaSearch has identified 18 projects likely to affect the region. Notable projects include Clermont Seniors Living Centre - Monash Lodge Precinct, Peak Downs Mine Continuation Project, Isaac Regional Local Government Infrastructure Plan, and Capricorn Highway Emerald-Alpha Package Upgrades. The following list details those most relevant.
Professional plan users can use the search below to filter and access additional projects.
INFRASTRUCTURE SEARCH
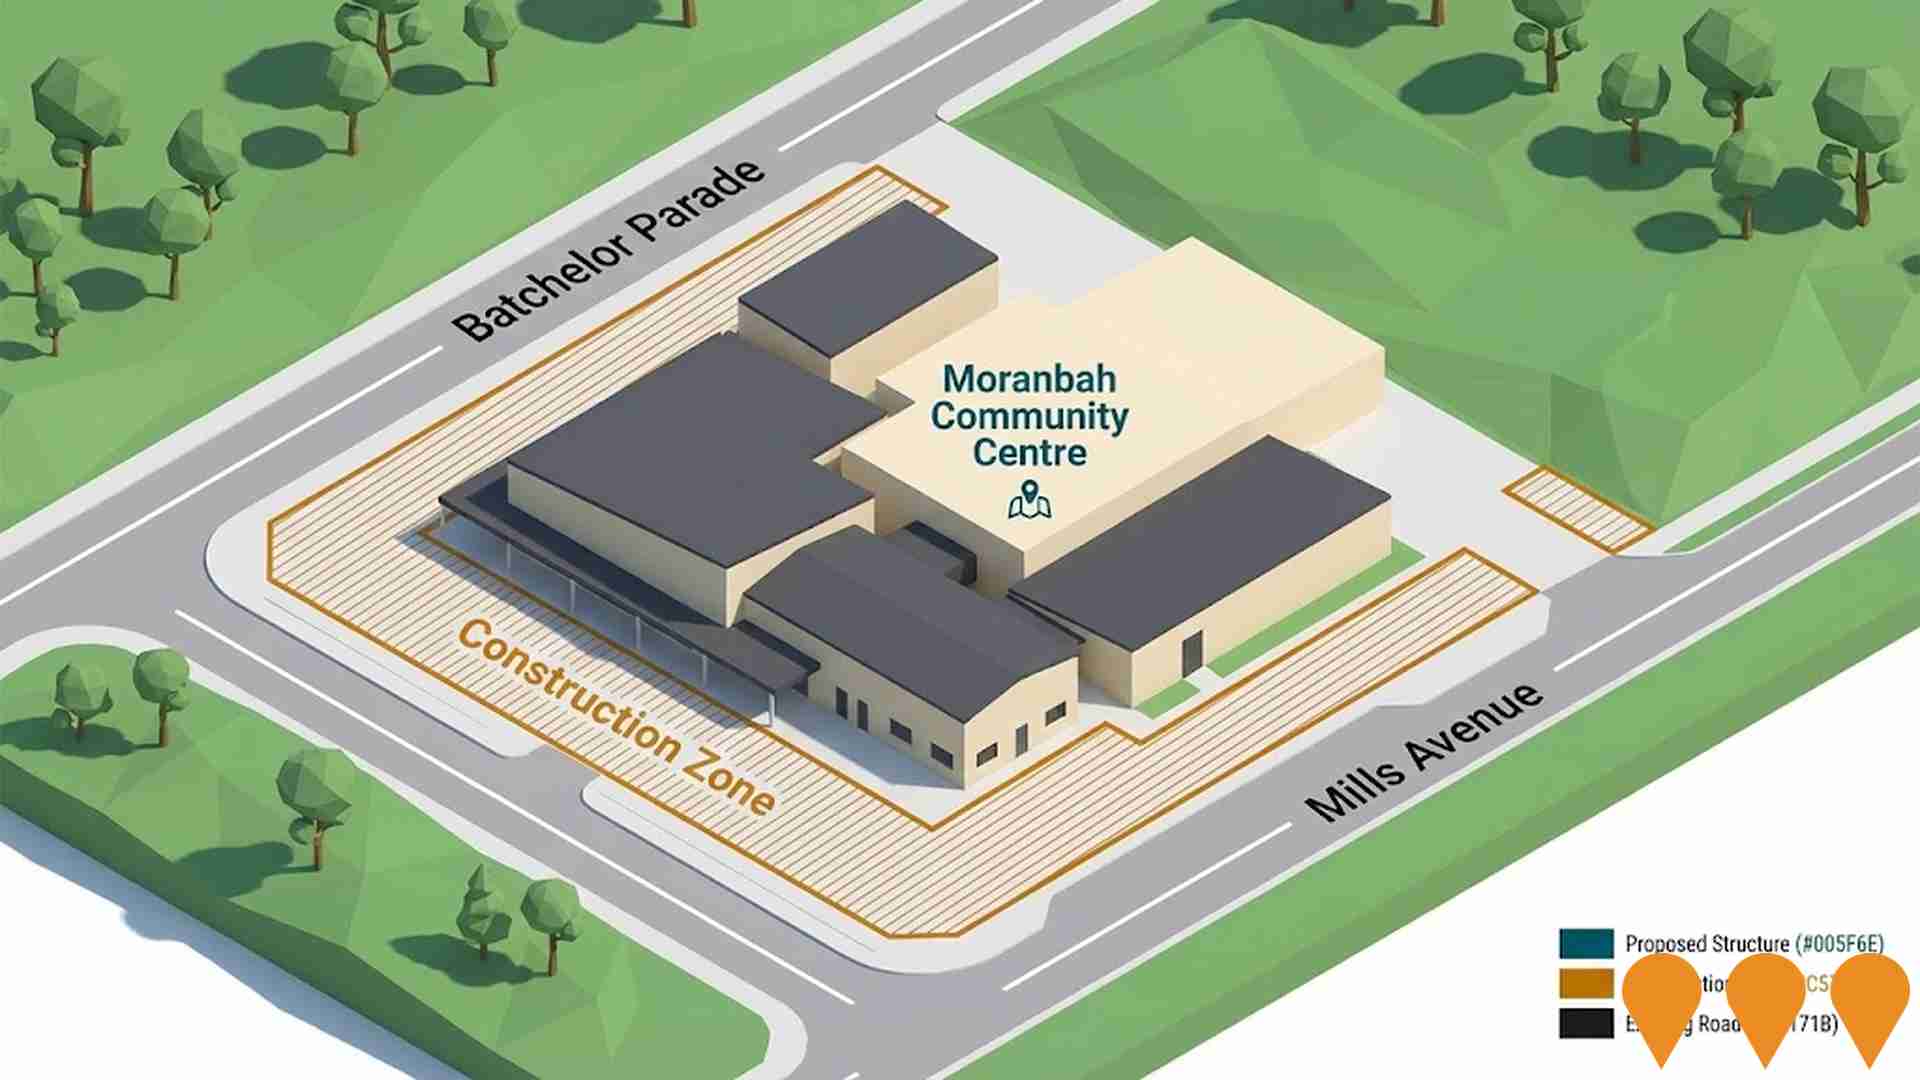
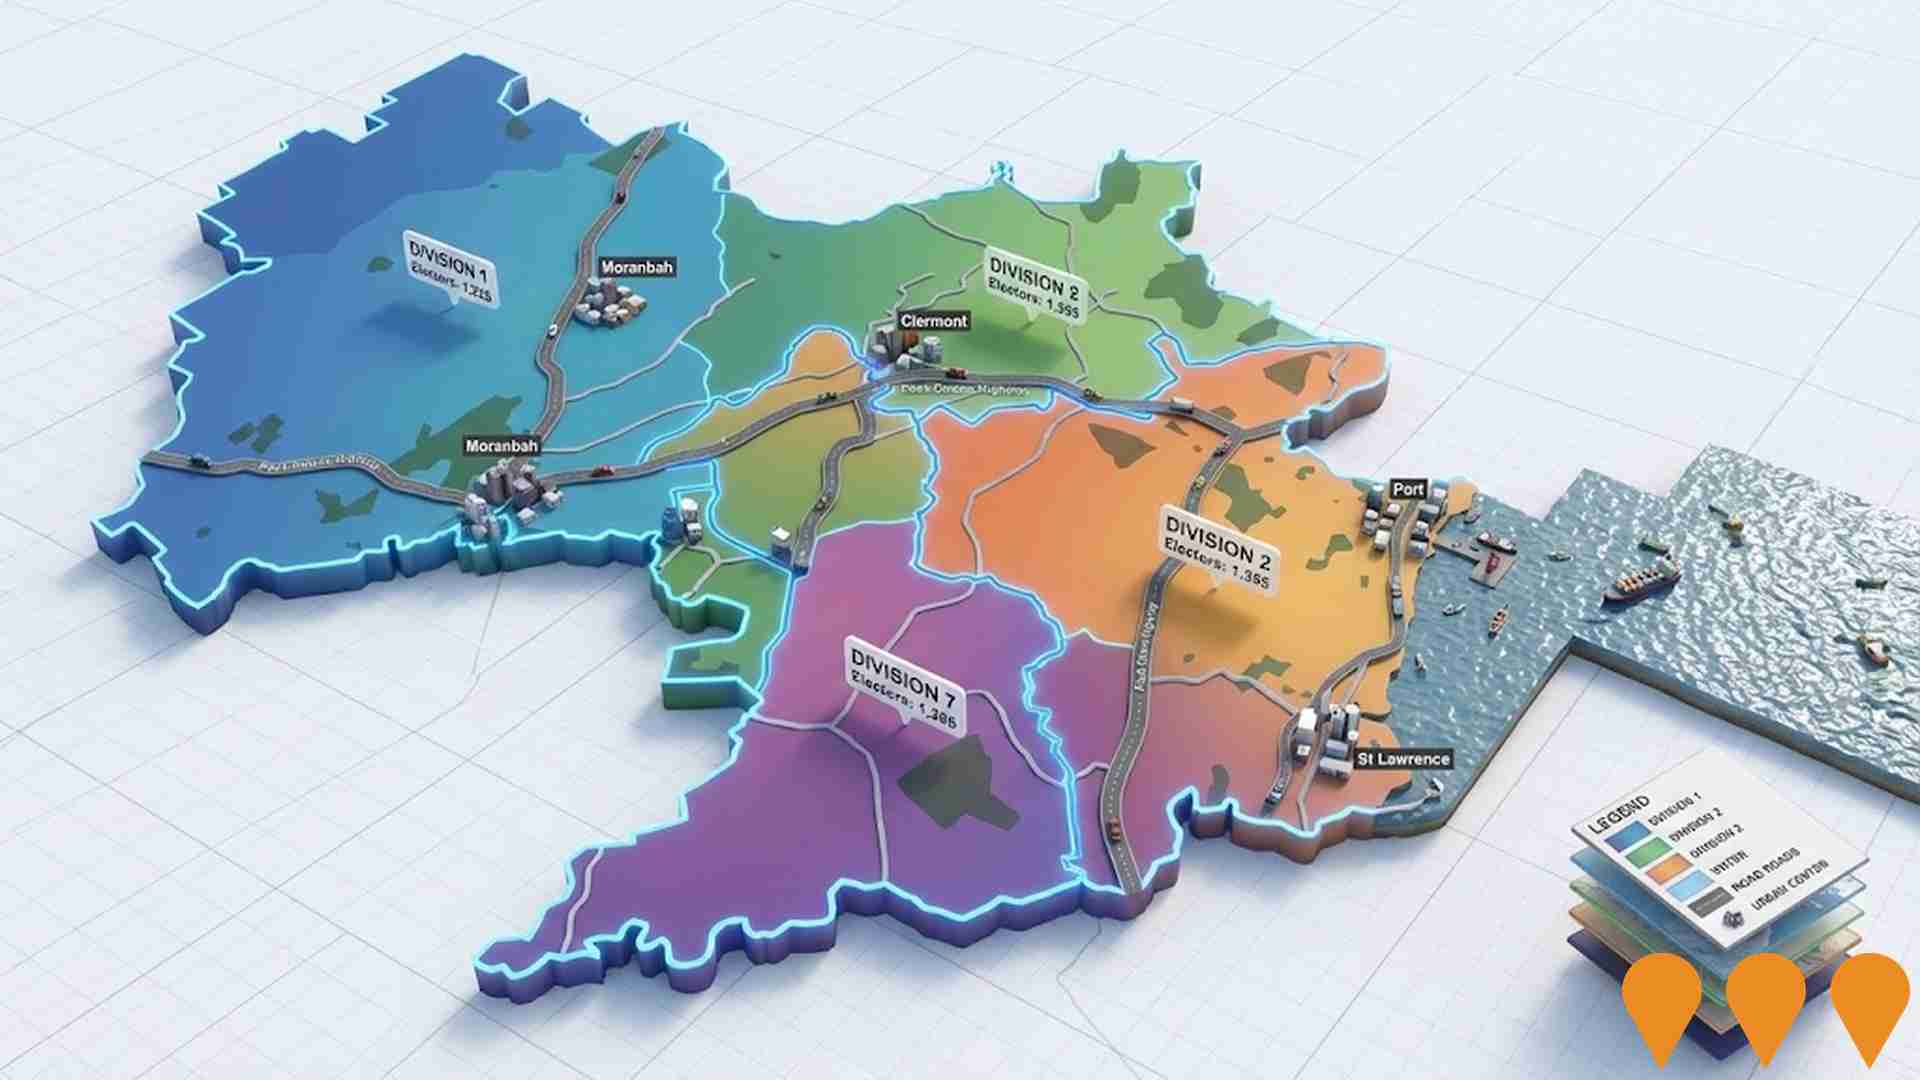
 Denotes AI-based impression for illustrative purposes only, not to be taken as definitive under any circumstances. Please follow links and conduct other investigations from the project's source for actual imagery. Developers and project owners wishing us to use original imagery please Contact Us and we will do so.
Frequently Asked Questions - Infrastructure
Isaac Regional Local Government Infrastructure Plan
Draft infrastructure plan covering transport, water supply, parks and sewerage networks across Isaac region including St Lawrence. Focuses on high-level infrastructure essential for future development over next 10-15 years in urban and rural sectors.
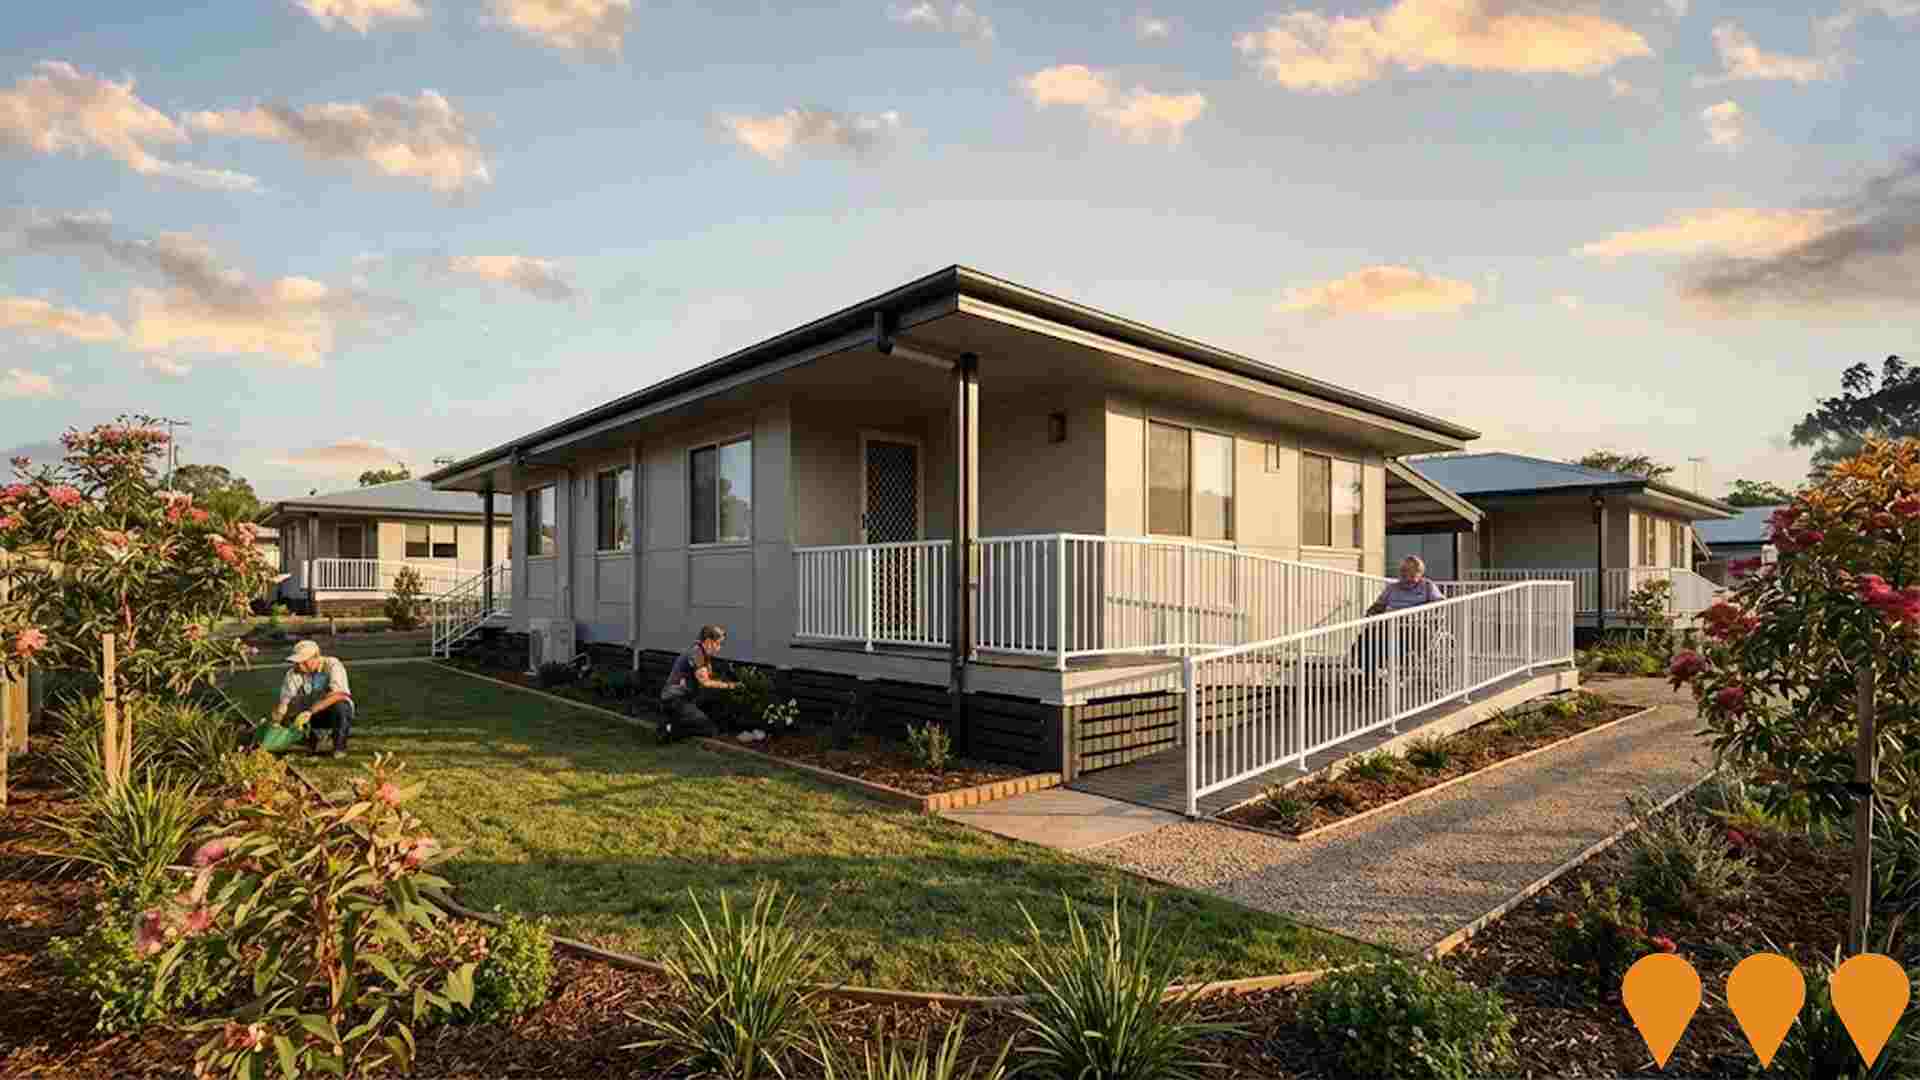
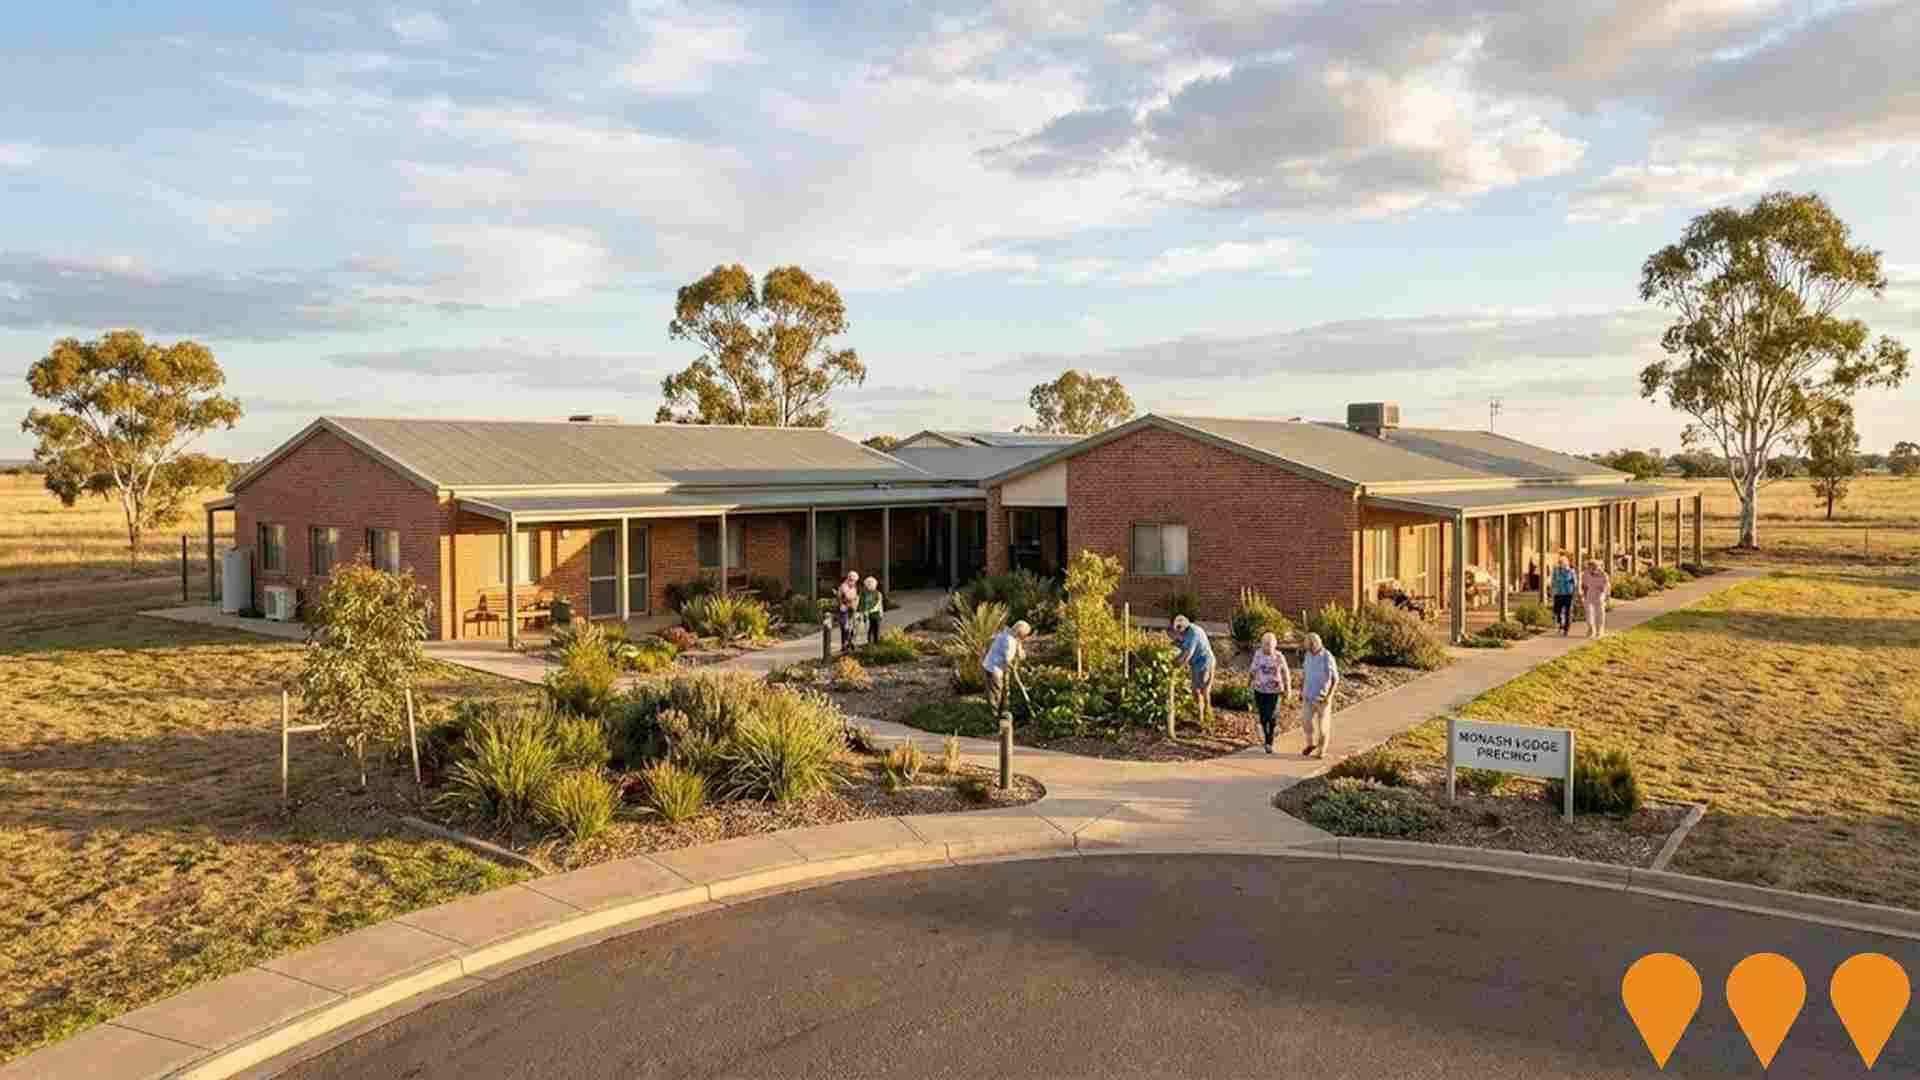
Clermont Seniors Living Centre - Monash Lodge Precinct
An Isaac Regional Council and Belyando Enterprise Network Inc proposal to refurbish the former Monash Lodge aged care building and deliver around 12 independent seniors living units with 24 7 onsite management. Stage 1 aims to reopen the disused 20 bed facility as flexible supported and independent living for older residents so they can remain in Clermont rather than relocating to Emerald or Mackay. The project remains in the advocacy and funding phase, with council and community partners seeking about 3 million dollars in government support and an election commitment of 1.5 million dollars for early works.
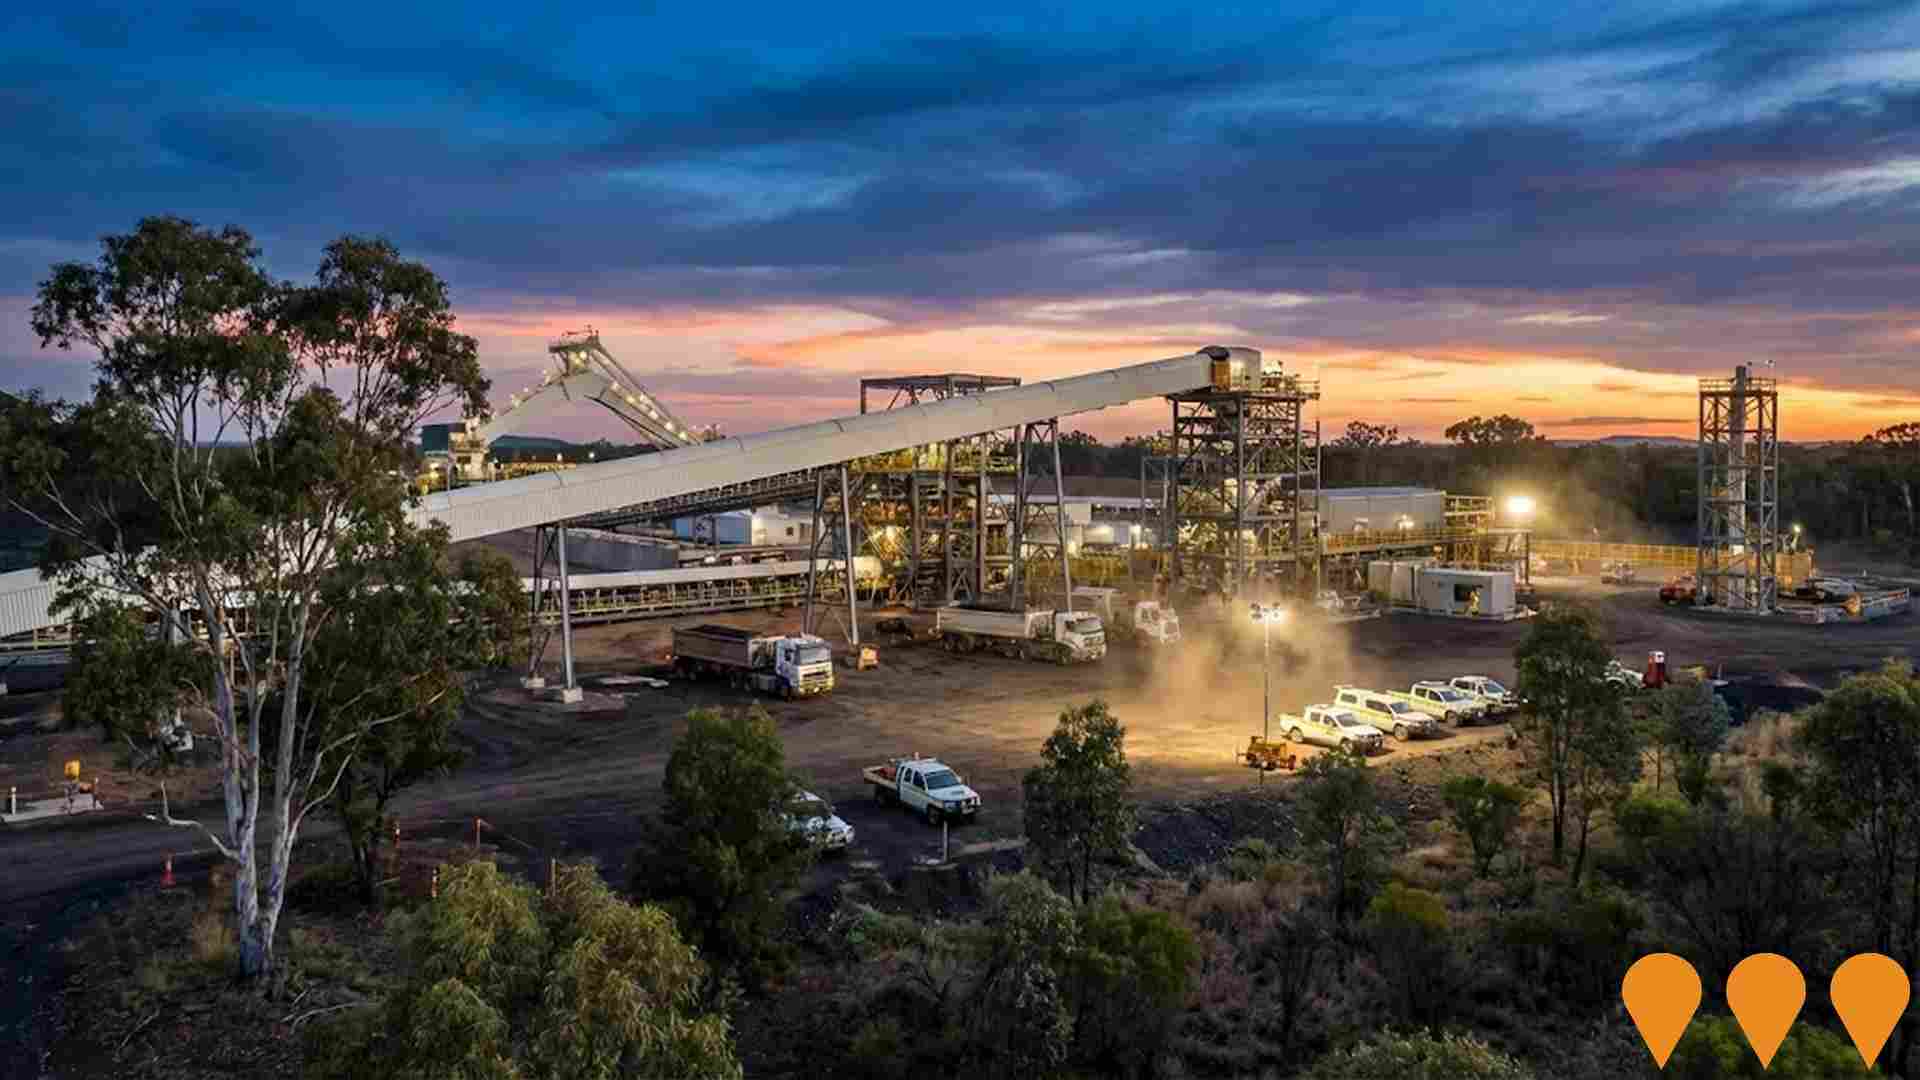
Moranbah North Waste Coal Mine Gas Power Project Expansion
The project involved an 18 MW expansion of the existing Moranbah North Waste Coal Mine Gas Power Station, increasing its total capacity to 63 MW. It captures and combusts waste coal mine gas to generate electricity for the national grid, providing approximately 400 GWh annually and avoiding around 313,000 tonnes of CO2-equivalent emissions per year.
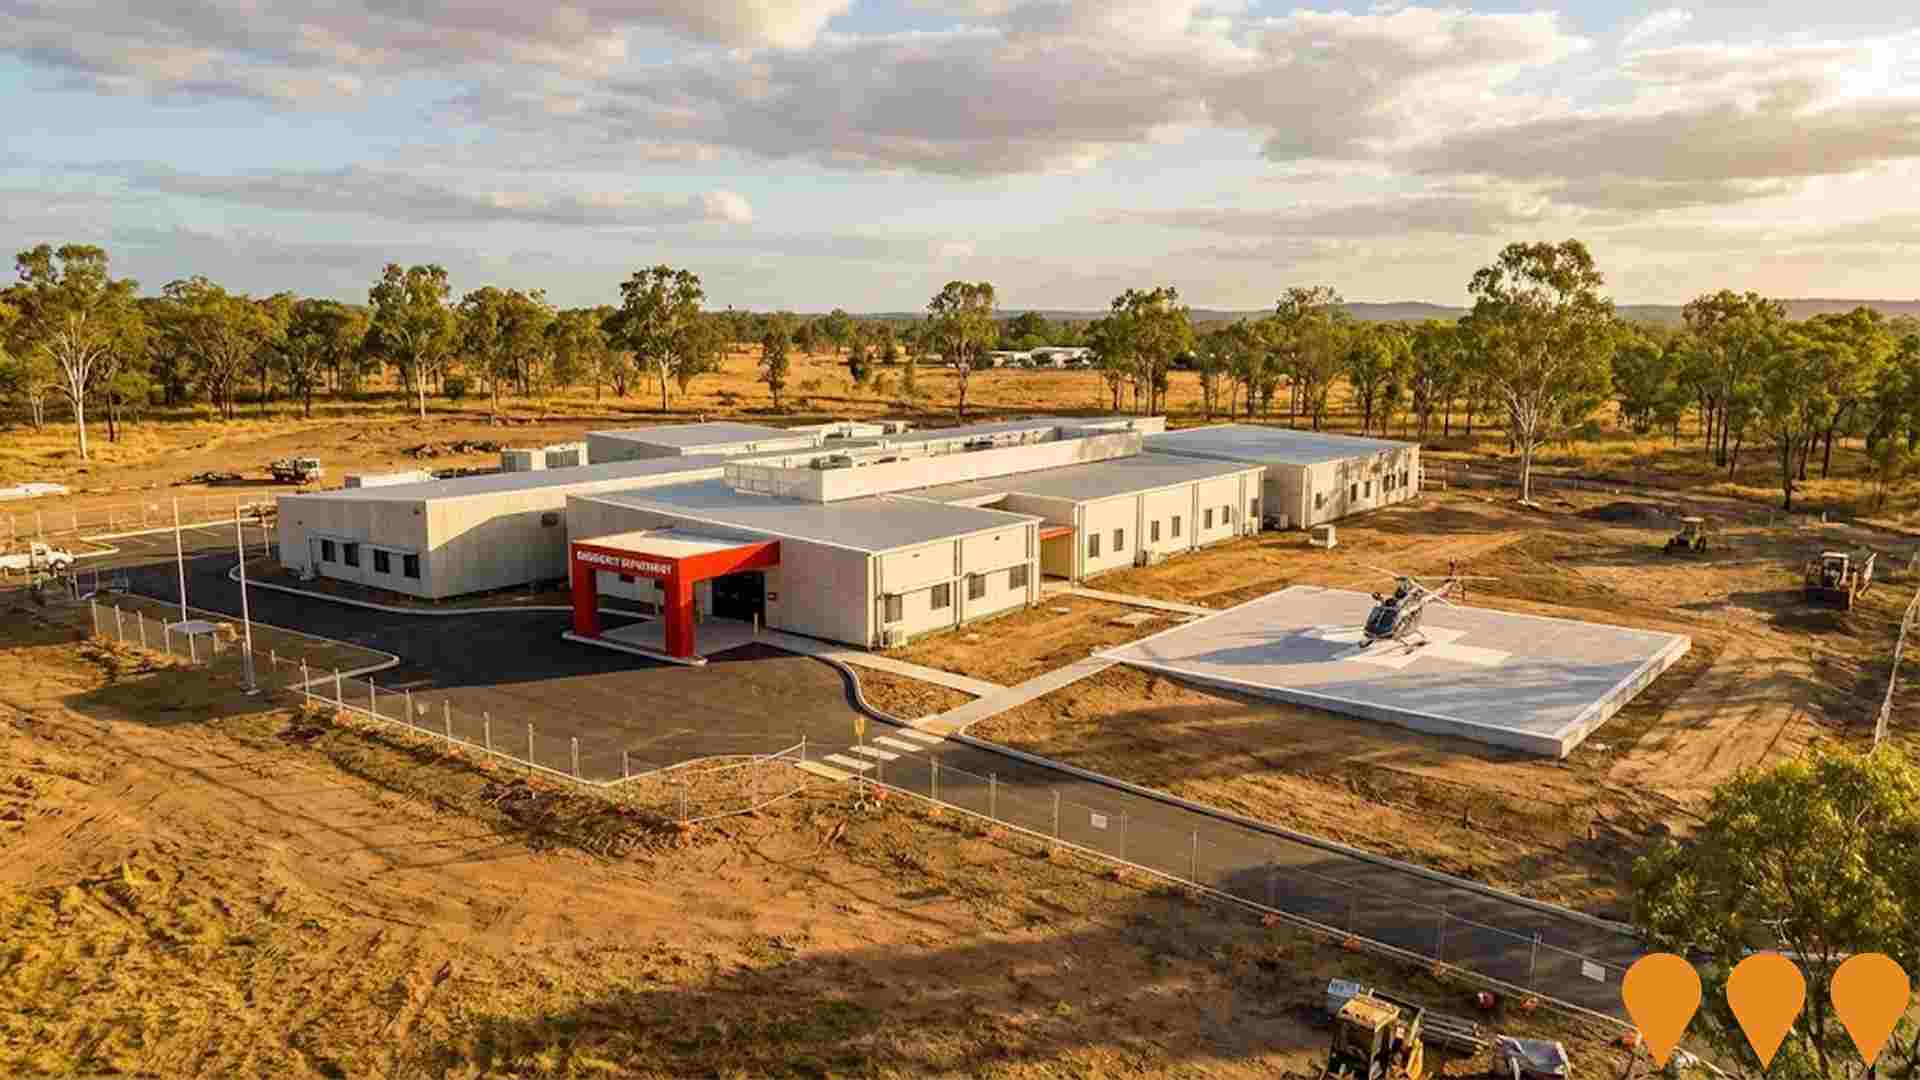
Moranbah Hospital Redevelopment
$48.5 million new modular hospital replacing existing facility. Features larger ED, new helipad, CT scanner, dedicated mental health care. Expected completion late 2024.
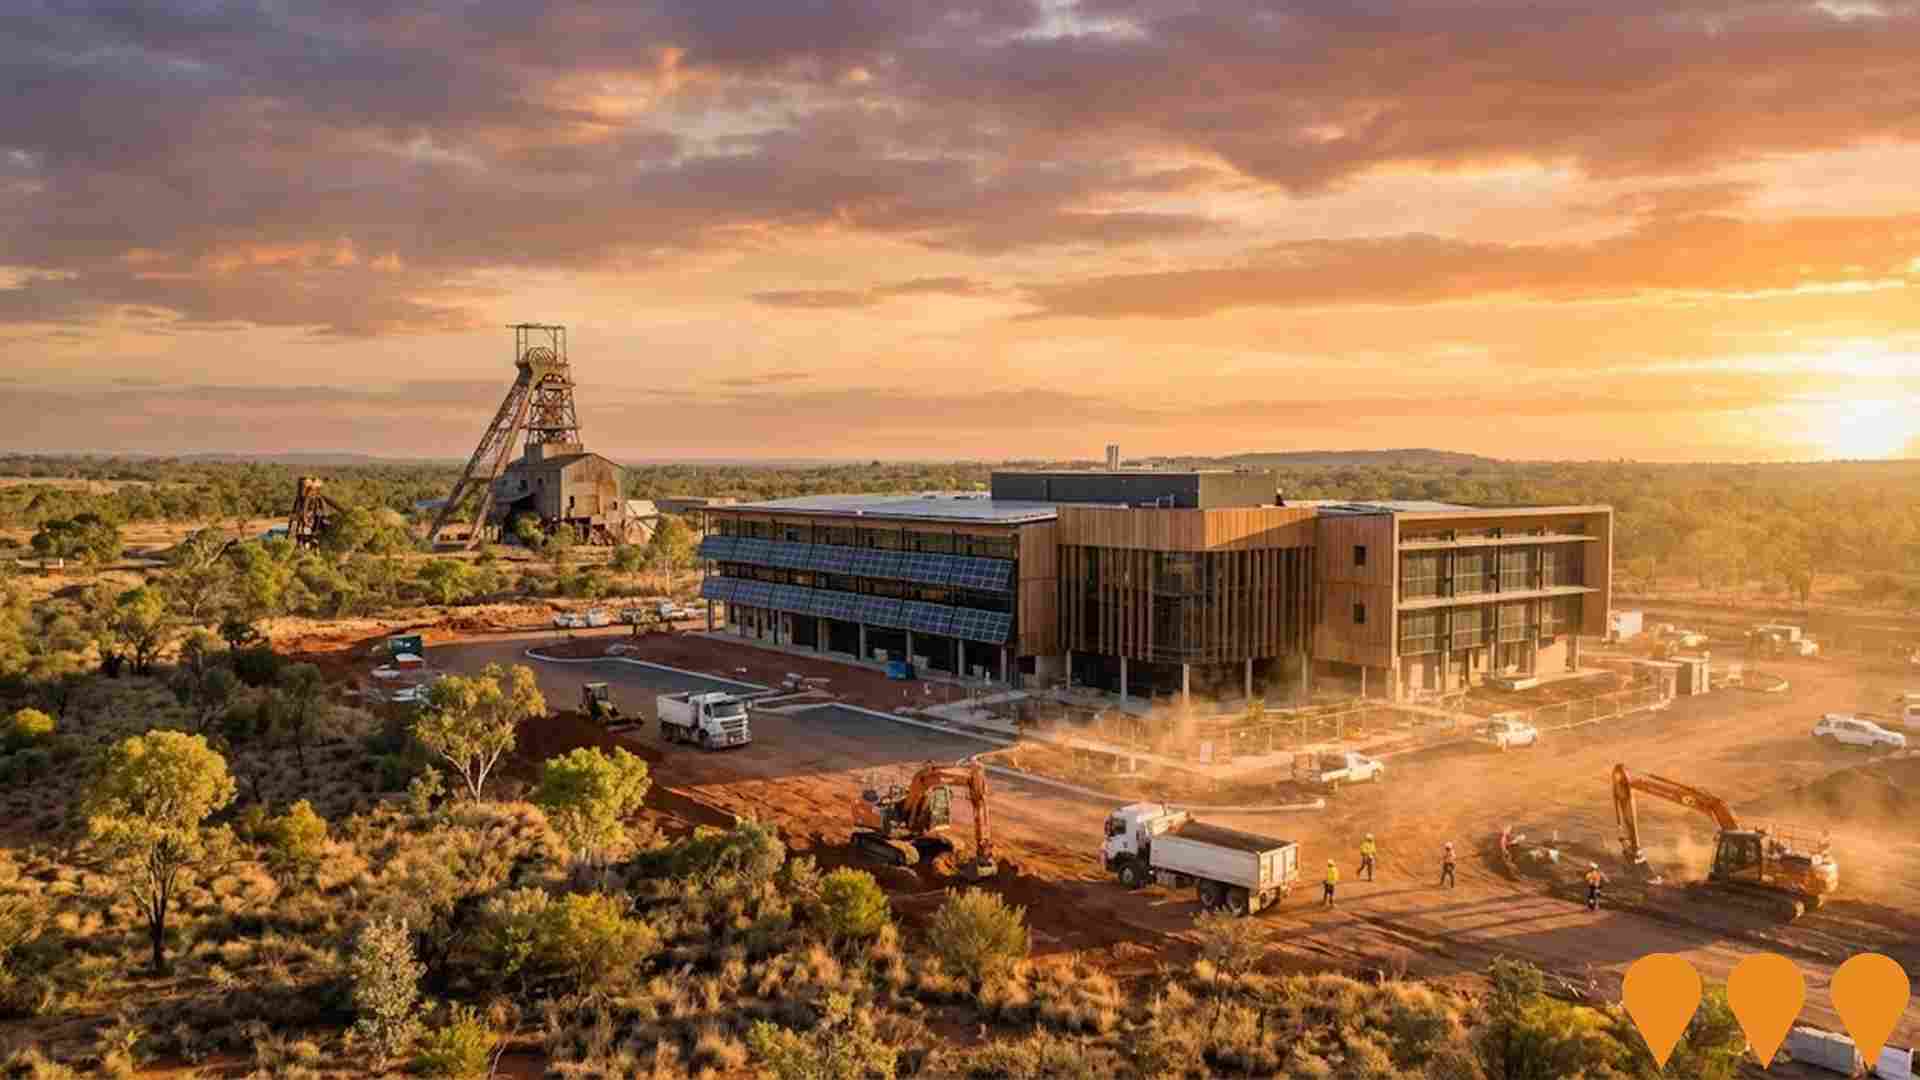
Isaac Resources Excellence Precinct
A $41.7 million state-of-the-art hub in Moranbah driving innovation, technological advancements, and education in the resources sector, focusing on mine site rehabilitation, renewable energy, critical minerals, with multi-faceted learning, research, teaching, collaboration spaces, and a mining heritage centre.
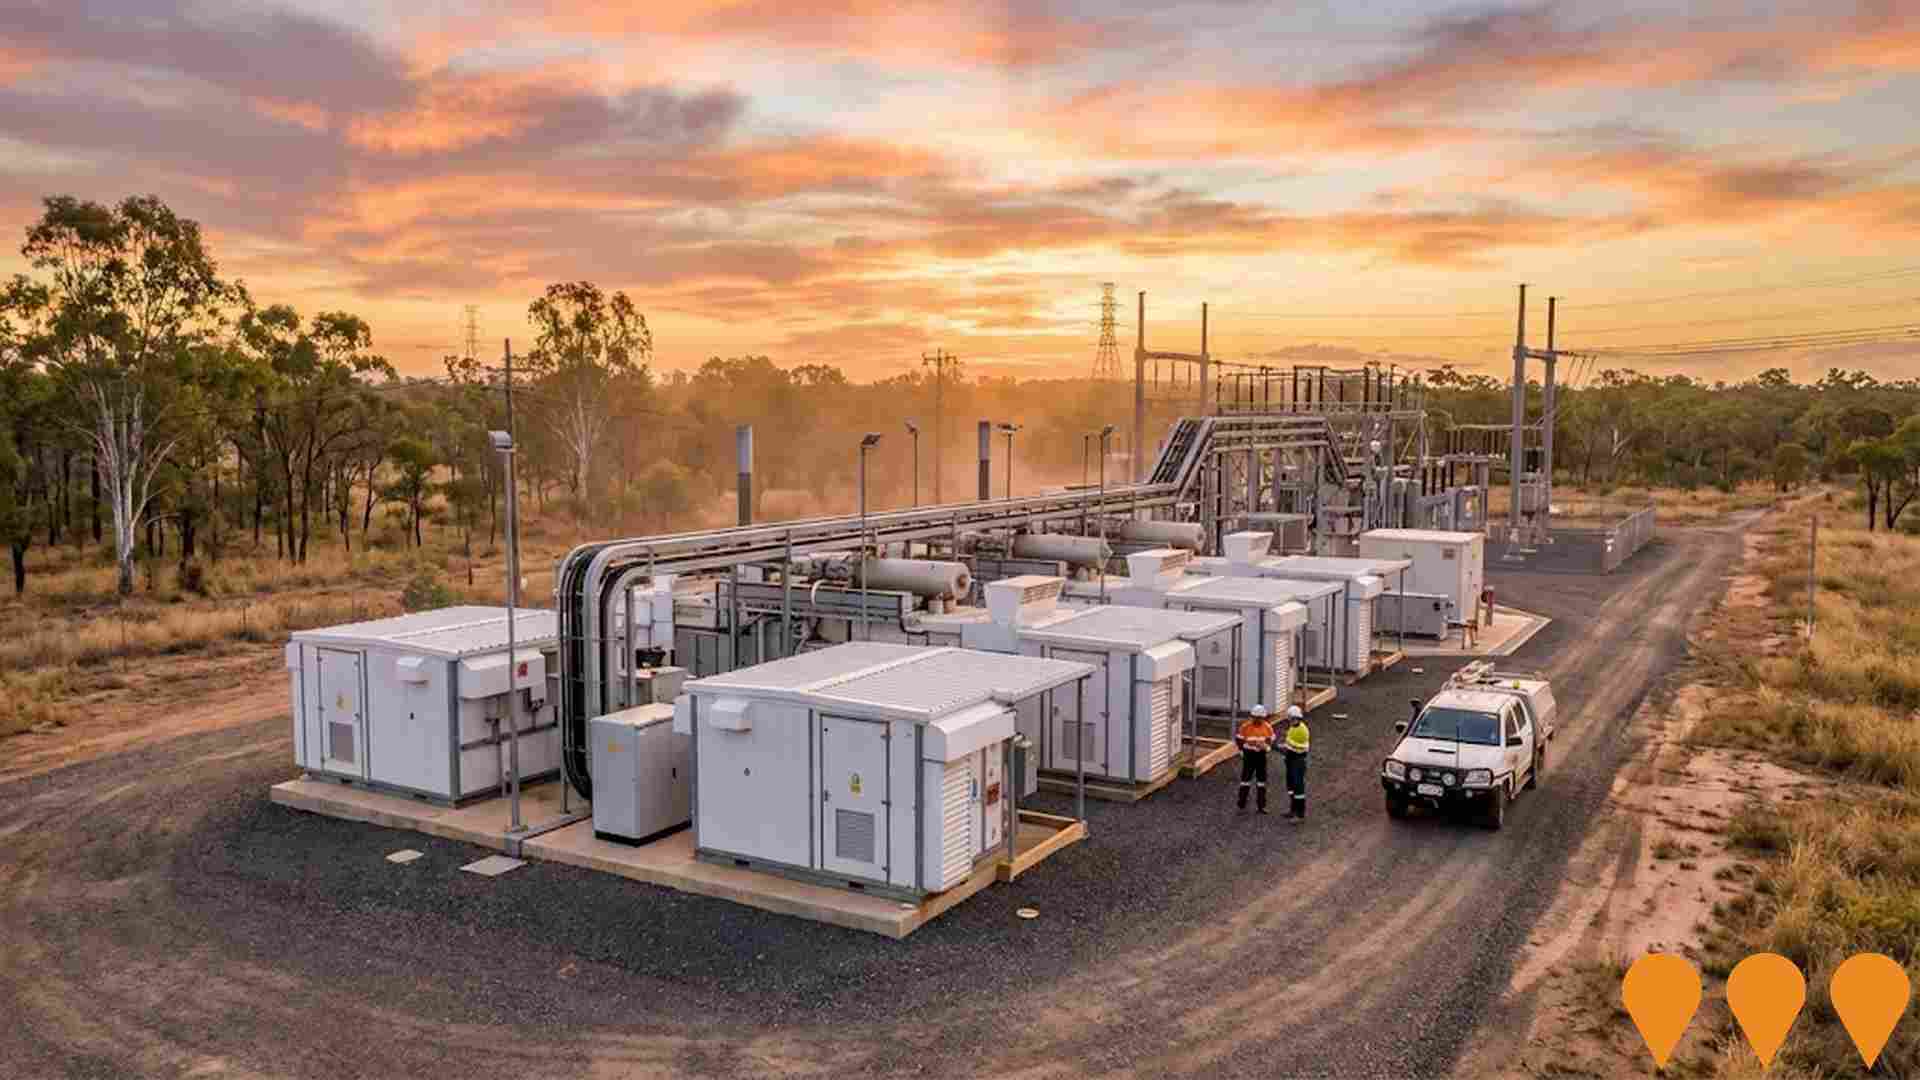
Moranbah Power Station Project
Gas engine power generator installation with 5MW Stage 1 and 20MW Stage 2 capacity. Material Change of Use for Special Industry and Environmentally Relevant Activity for electricity generation.
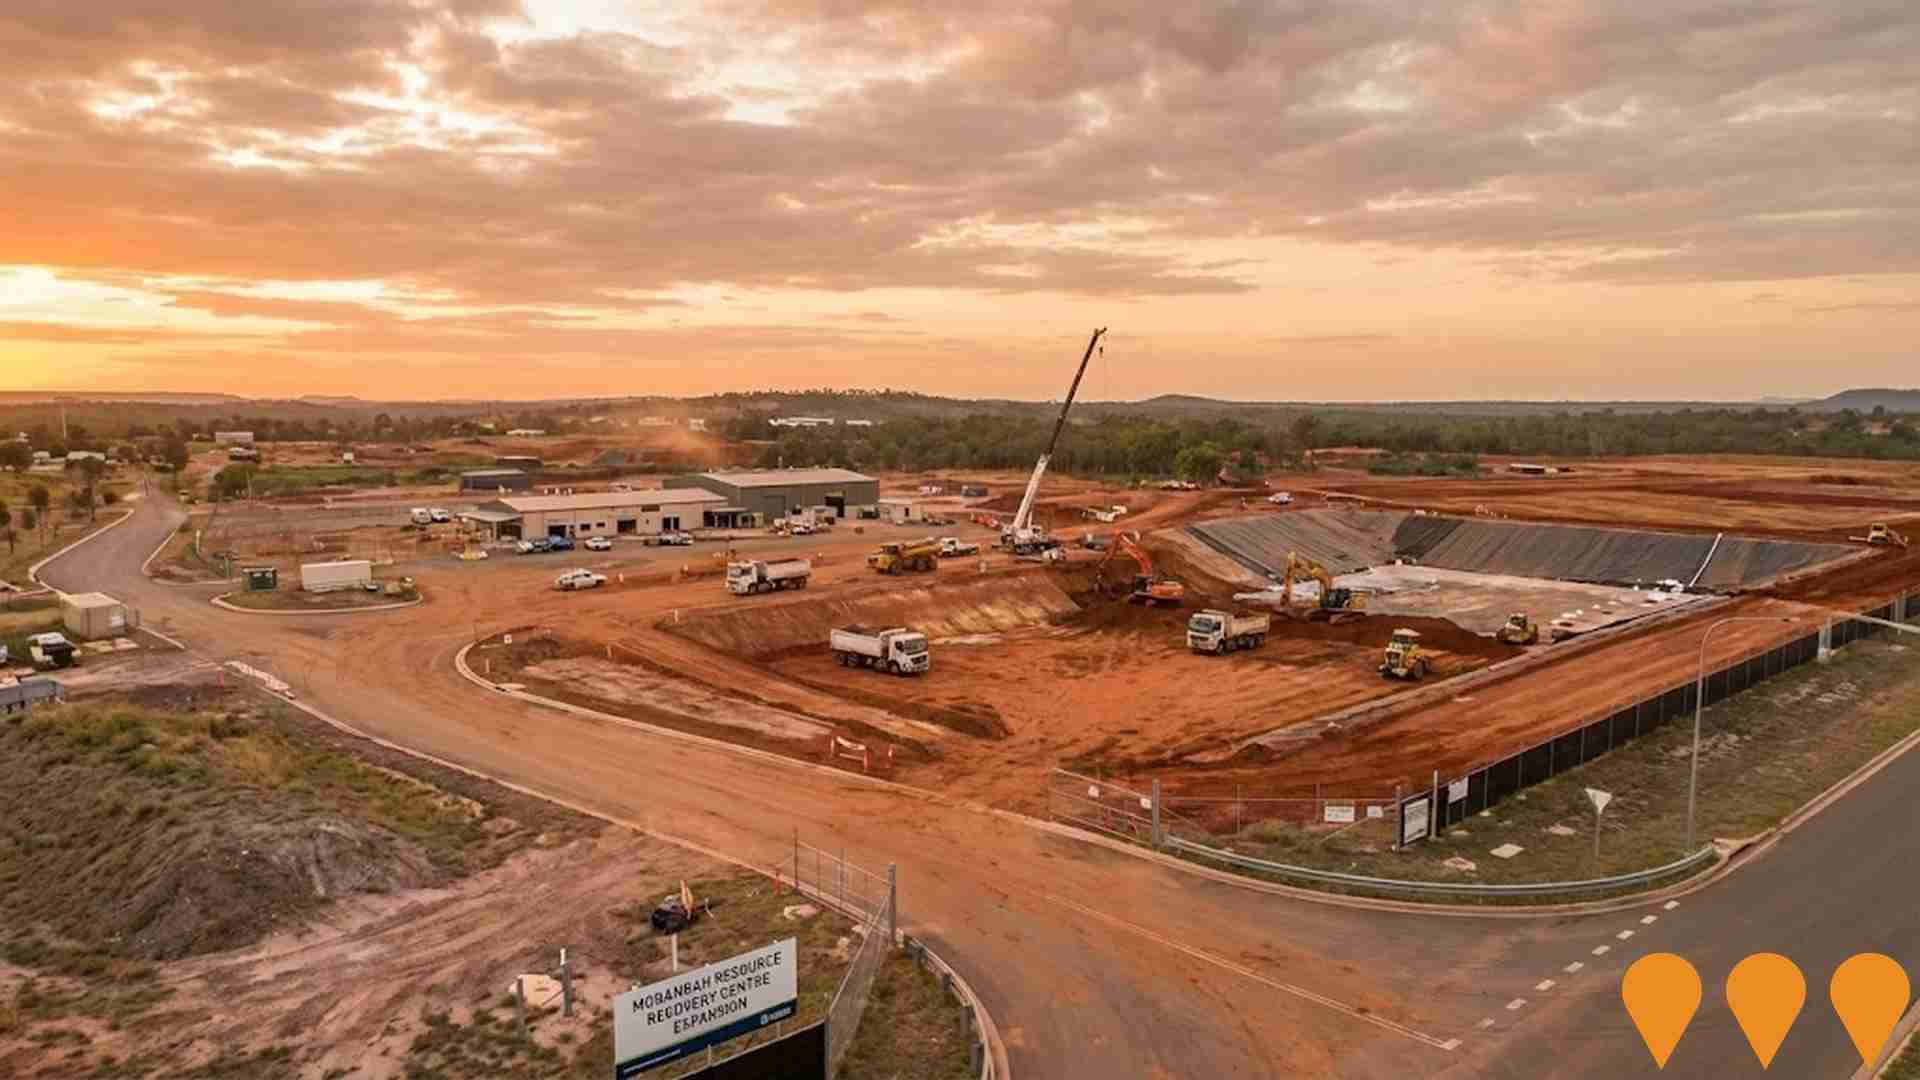
Moranbah Resource Recovery Centre Expansion
Expansion and improvement of Moranbah's waste facility including a new refuse transfer station, a 30,000 m2 engineered and lined landfill cell, and stormwater and leachate ponds to improve environmental performance and regional capacity.
Peak Downs Mine Continuation Project
Expansion of the open cut metallurgical coal mining footprint at the existing Peak Downs Mine to produce up to 18 million tonnes of product coal per annum for steel production over approximately 93 years. Includes continuation of open-cut mining operations, use of existing infrastructure, relocation of infrastructure, realignment of roads, and development of water management features.

Employment
The exceptional employment performance in Clermont places it among Australia's strongest labour markets
Clermont's workforce is balanced across white and blue-collar jobs, with manufacturing and industrial sectors prominent. Its unemployment rate was 1.4% in the past year, showing a 4.4% employment growth.
As of September 2025, 2,441 residents are employed, with an unemployment rate of 2.7%, below Rest of Qld's 4.1%. Workforce participation is high at 67.1%, compared to Rest of Qld's 59.1%. Leading industries include agriculture, forestry & fishing, mining, and education & training, with agriculture particularly strong at 5.5 times the regional level. Health care & social assistance, however, is under-represented at 6.0% compared to Rest of Qld's 16.1%.
The area functions as an employment hub, hosting more jobs than residents. Over a 12-month period ending in September 2025, employment increased by 4.4%, labour force by 4.5%, and unemployment rose by 0.1 percentage points. In comparison, Rest of Qld saw employment growth of 1.7% and unemployment rise by 0.3 percentage points. State-level data to 25-Nov-25 shows Queensland's employment contracted by 0.01%, with an unemployment rate of 4.2%. National employment forecasts from May-25 suggest national employment will expand by 6.6% over five years and 13.7% over ten years, but growth rates vary between industries. Applying these projections to Clermont's employment mix indicates local employment should increase by 4.4% over five years and 10.4% over ten years.
Frequently Asked Questions - Employment
Income
Income analysis reveals strong economic positioning, with the area outperforming 60% of locations assessed nationally by AreaSearch
AreaSearch's data for financial year 2022 shows median income in Clermont SA2 was $59,739 and average income was $73,207. This is higher than Rest of Qld's median income of $50,780 and average income of $64,844. By September 2025, estimated median income would be approximately $68,096 and average income $83,449 based on Wage Price Index growth since financial year 2022. According to the 2021 Census, individual earnings in Clermont were at the 81st percentile nationally ($1,031 weekly). The largest income segment comprised 34.5% earning $1,500 - $2,999 weekly (1,403 residents), similar to the surrounding region where 31.7% fell into this bracket. After housing costs, residents retained 91.0% of their income, reflecting strong purchasing power and the area's SEIFA income ranking in the 4th decile.
Frequently Asked Questions - Income
Housing
Clermont is characterized by a predominantly suburban housing profile, with above-average rates of outright home ownership
Clermont's dwelling structure, as per the latest Census, consisted of 87.6% houses and 12.4% other dwellings (semi-detached, apartments, 'other' dwellings). In comparison, Non-Metro Qld had 86.1% houses and 13.8% other dwellings. Home ownership in Clermont was at 33.3%, with mortgaged dwellings at 26.3% and rented dwellings at 40.4%. The median monthly mortgage repayment in the area was $1,300, aligning with Non-Metro Qld's average. The median weekly rent figure was recorded at $220, compared to Non-Metro Qld's $200. Nationally, Clermont's mortgage repayments were significantly lower than the Australian average of $1,863, while rents were substantially below the national figure of $375.
Frequently Asked Questions - Housing
Household Composition
Clermont has a typical household mix, with a fairly typical median household size
Family households constitute 68.7% of all households, including 31.9% couples with children, 28.5% couples without children, and 7.5% single parent families. Non-family households account for the remaining 31.3%, with lone person households at 28.5% and group households comprising 2.7% of the total. The median household size is 2.5 people, which aligns with the average in the Rest of Qld.
Frequently Asked Questions - Households
Local Schools & Education
Clermont faces educational challenges, with performance metrics placing it in the bottom quartile of areas assessed nationally
The area's university qualification rate is 14.0%, significantly lower than Australia's average of 30.4%. Bachelor degrees are the most common at 11.4%, followed by graduate diplomas (1.5%) and postgraduate qualifications (1.1%). Vocational credentials are prevalent, with 42.5% of residents aged 15+ holding them, including advanced diplomas (7.7%) and certificates (34.8%). Educational participation is high, with 31.5% currently enrolled in formal education, comprising primary (16.1%), secondary (8.1%), and tertiary (2.0%) levels.
Educational participation is notably high, with 31.5% of residents currently enrolled in formal education. This includes 16.1% in primary education, 8.1% in secondary education, and 2.0% pursuing tertiary education.
Frequently Asked Questions - Education
Schools Detail
Nearby Services & Amenities
Transport
No public transport data available for this catchment area.
Frequently Asked Questions - Transport
Transport Stops Detail
Health
Clermont's residents are extremely healthy with very low prevalence of common health conditions across all age groups
Analysis of health metrics shows strong performance throughout Clermont. The prevalence of common health conditions across all age groups was very low.
Approximately 56% of the total population (~2,277 people) had private health cover, compared to 60.4% across Rest of Qld. The most common medical conditions were asthma and arthritis, impacting 7.7 and 5.9% of residents respectively. 74.5% of residents declared themselves completely clear of medical ailments, compared to 72.7% across Rest of Qld. The area has 14.1% of residents aged 65 and over (573 people), which is higher than the 12.6% in Rest of Qld. Health outcomes among seniors are particularly strong, broadly in line with the general population's health profile.
Frequently Asked Questions - Health
Cultural Diversity
The latest Census data sees Clermont placing among the least culturally diverse areas in the country when compared across a range of language and cultural background related metrics
Clermont's cultural diversity was found to be below average, with 83.9% of its population being Australian citizens, born in Australia (92.9%), and speaking English only at home (96.2%). Christianity is the predominant religion in Clermont, comprising 66.0% of people, compared to 53.6% across Rest of Qld. The top three ancestry groups are Australian (36.5%, regional average: 31.2%), English (30.9%), and Irish (8.7%).
Notably, German ancestry is overrepresented in Clermont at 4.9% compared to the regional average of 4.2%. Filipino ancestry is also slightly underrepresented at 1.4% (regional average: 1.6%) and Maltese ancestry is similarly lower at 0.5% (regional average: 0.4%).
Frequently Asked Questions - Diversity
Age
Clermont's population is slightly younger than the national pattern
Clermont's median age in 2021 was 36 years, which is lower than the Rest of Queensland figure of 41 years and Australia's median age of 38 years. The percentage of people aged 25-34 in Clermont was notably higher at 16.7%, compared to the Rest of Queensland average, while those aged 65-74 were under-represented at 8.3%. Between 2021 and the present, the proportion of people aged 25-34 has increased from 15.2% to 16.7%, while the percentage of people aged 45-54 has decreased from 12.3% to 11.1%. The proportion of those aged 5-14 has also dropped, from 14.1% to 13.0%. By 2041, demographic modeling suggests significant changes in Clermont's age profile. The number of people aged 25-34 is projected to increase by 129 (19%), from 679 to 809. Conversely, both the 35-44 and 55-64 age groups are expected to decrease in size.
