Chart Color Schemes
This analysis uses ABS Statistical Areas Level 2 (SA2) boundaries, which can materially differ from Suburbs and Localities (SAL) even when sharing similar names.
SA2 boundaries are defined by the Australian Bureau of Statistics and are designed to represent communities for statistical reporting (e.g., census and ERP).
Suburbs and Localities (SAL) represent commonly-used suburb/locality names (postal-style areas) and may use different geographic boundaries. For comprehensive analysis, consider reviewing both boundary types if available.
est. as @ -- *
ABS ERP | -- people | --
2021 Census | -- people
Sales Activity
Curious about local property values? Filter the chart to assess the volume and appreciation (including resales) trends and regional comparisons, or scroll to the map below view this information at an individual property level.
Find a Recent Sale
Sales Detail
Population
An assessment of population growth drivers in Tomerong - Wandandian - Woollamia reveals an overall ranking slightly below national averages considering recent, and medium term trends
Based on AreaSearch's analysis, Tomerong-Wandandian-Woollamia's population is around 3824 as of November 2025. This reflects an increase of 116 people, a 3.1% rise since the 2021 Census which reported a population of 3708. The change is inferred from the estimated resident population of 3789 in June 2024 and an additional 55 validated new addresses since the Census date. This results in a density ratio of 10.2 persons per square kilometer, providing ample space per person. Tomerong-Wandandian-Woollamia's growth of 3.1% since census is within 0.6 percentage points of the SA4 region's 3.7%, indicating competitive growth fundamentals. Natural growth contributed approximately 53.5% of overall population gains during recent periods.
AreaSearch adopts ABS/Geoscience Australia projections for each SA2 area, released in 2024 with a base year of 2022. For areas not covered by this data, NSW State Government's SA2 level projections released in 2022 with a base year of 2021 are used. Growth rates by age group from these aggregations are applied to all areas for years 2032 to 2041. Over this period, projections indicate an overall population decline of 68 persons by 2041. However, specific age cohorts like the 85 and over group are expected to grow, with a projected increase of 107 people.
Frequently Asked Questions - Population
Development
AreaSearch analysis of residential development drivers sees Tomerong - Wandandian - Woollamia recording a relatively average level of approval activity when compared to local markets analysed countrywide
Tomerong-Wandandian-Woollamia has seen around 16 new homes approved each year over the past five financial years, totalling 80 homes. So far in FY2025-26, 3 approvals have been recorded. On average, 2.2 people per year moved to the area per new home constructed between FY2020-21 and FY2024-25, indicating solid demand for property. New homes are being built at an average expected construction cost of $479,000, reflecting a focus on premium properties.
In this financial year, $4.8 million in commercial development approvals have been recorded, suggesting limited commercial development focus compared to residential growth. Relative to the rest of NSW and nationally, Tomerong-Wandandian-Woollamia records around 62% of building activity per person and places among the 67th percentile of areas assessed. Of new building activity, 93.0% are detached houses and 7.0% townhouses or apartments, maintaining the area's traditional low density character with a focus on family homes.
With approximately 205 people per approval, Tomerong-Wandandian-Woollamia reflects a low-density area. Given stable or declining population forecasts, housing pressure may remain relatively low in the area, creating favourable conditions for buyers.
Frequently Asked Questions - Development
Infrastructure
Tomerong - Wandandian - Woollamia has emerging levels of nearby infrastructure activity, ranking in the 29thth percentile nationally
AreaSearch has identified 43 projects that could impact the area. Key projects include Princes Highway Upgrade from Jervis Bay Road to Hawken Road, Jervis Bay Road and Princes Highway Intersection Upgrade, Jervis Bay Road Intersection Upgrade, and Mixed Use Development with In-Fill Affordable Housing at St Georges Basin. The following list details those likely to be most relevant.
Professional plan users can use the search below to filter and access additional projects.
INFRASTRUCTURE SEARCH
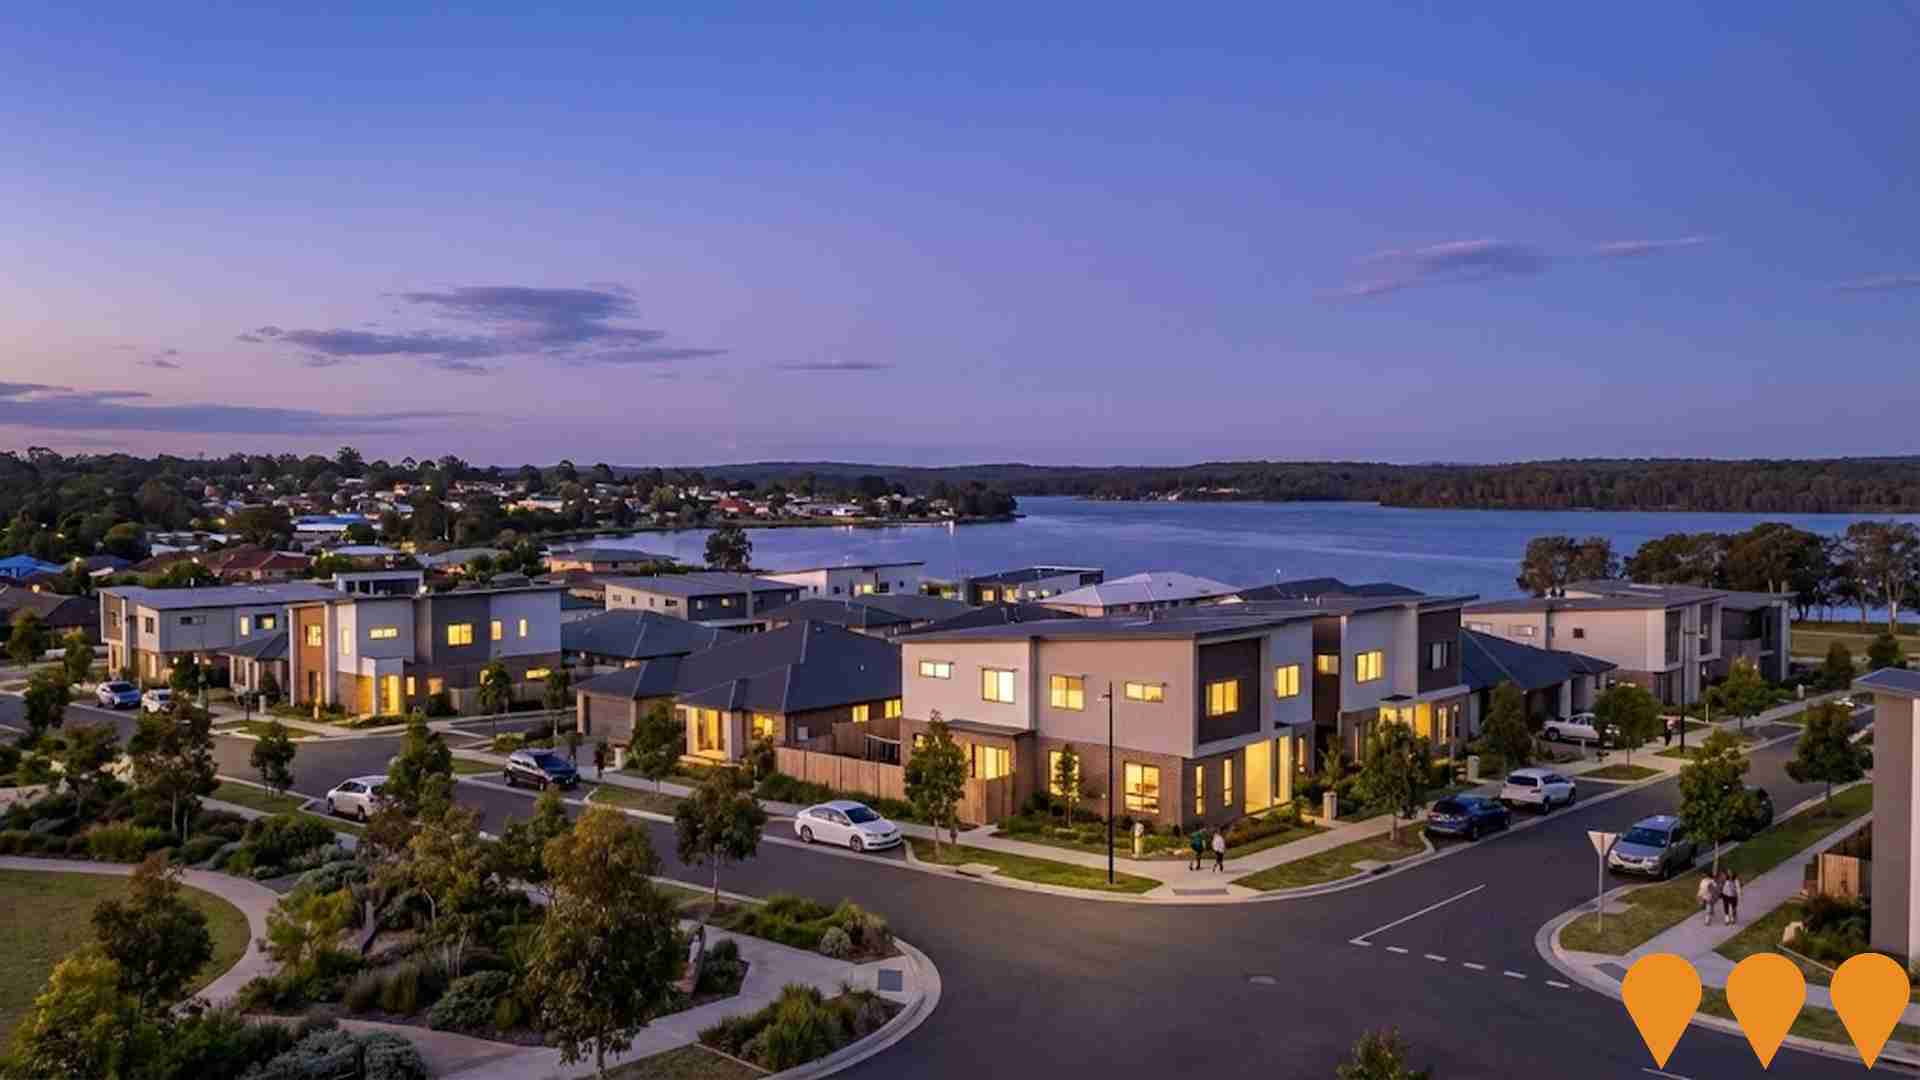
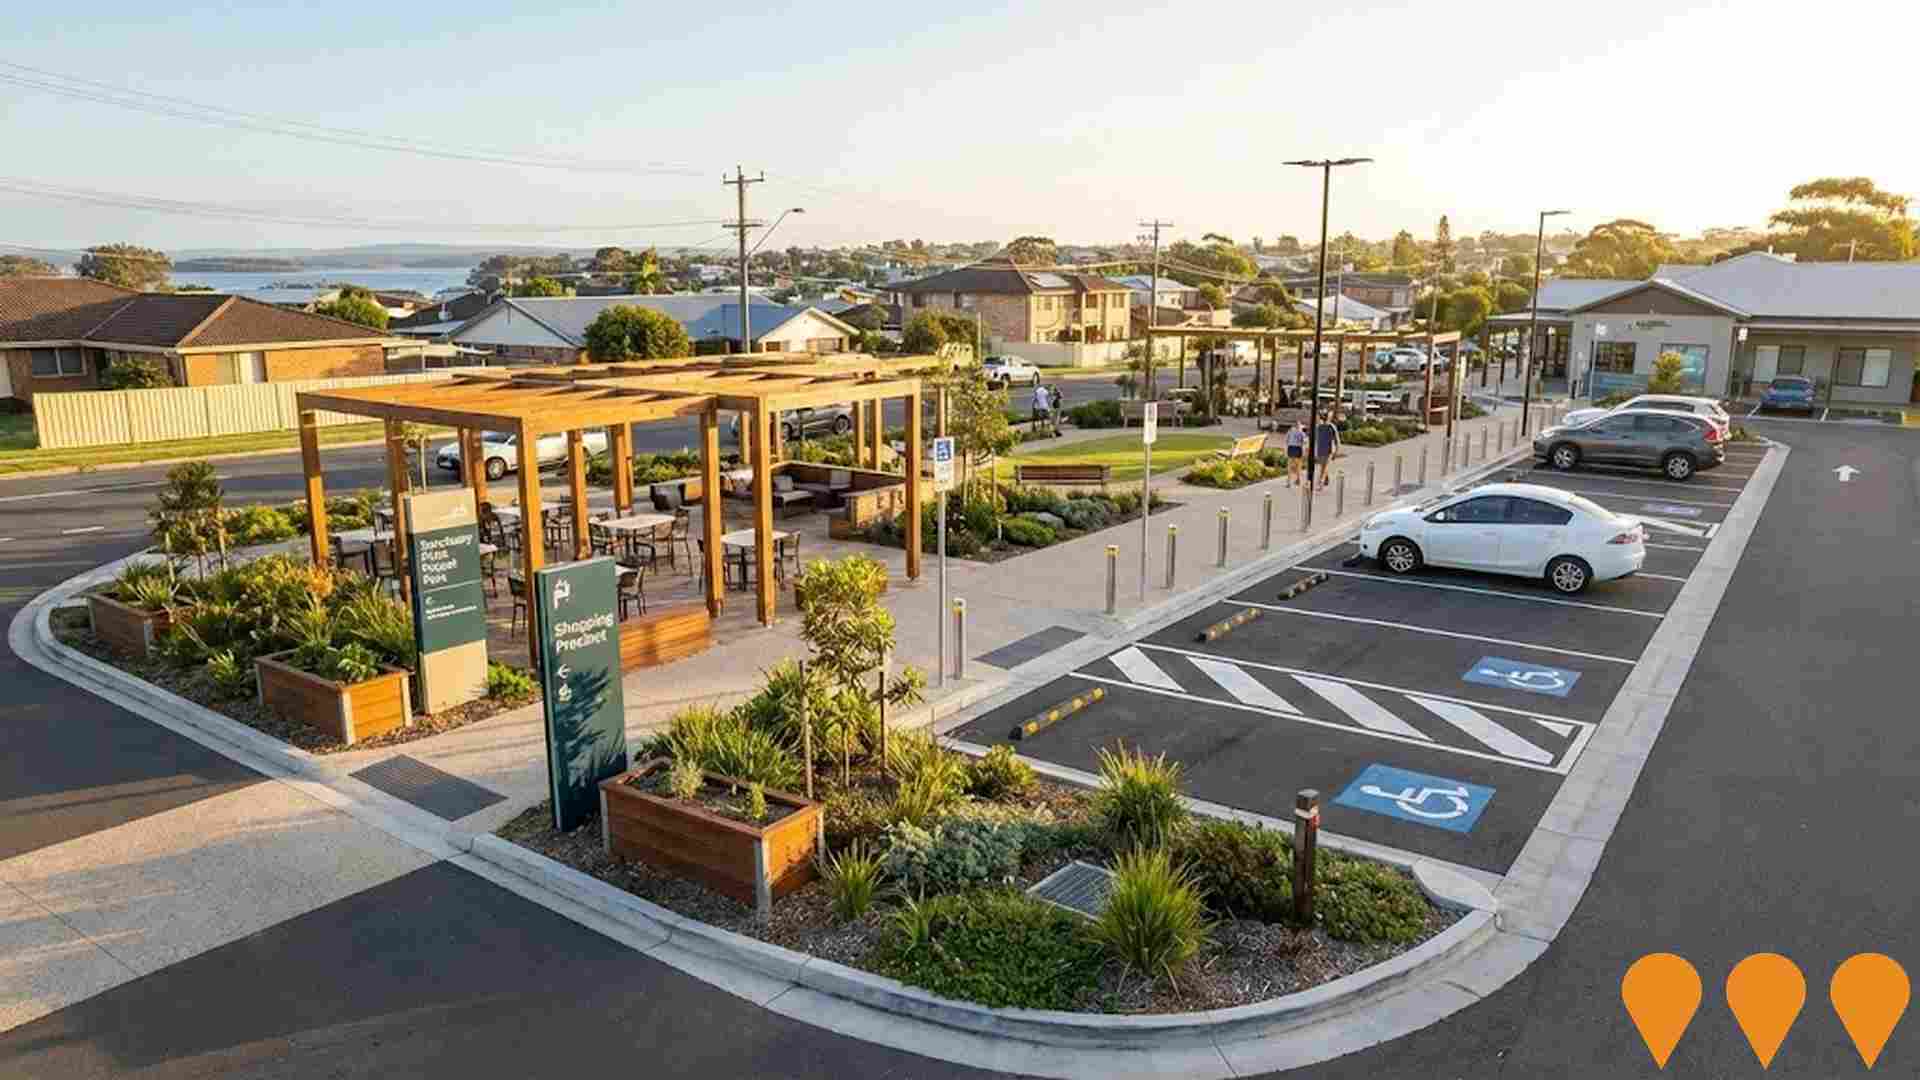
 Denotes AI-based impression for illustrative purposes only, not to be taken as definitive under any circumstances. Please follow links and conduct other investigations from the project's source for actual imagery. Developers and project owners wishing us to use original imagery please Contact Us and we will do so.
Frequently Asked Questions - Infrastructure
Bay and Basin NSW Ambulance Station
The upgrade and reconfiguration of the Bay and Basin NSW Ambulance Station was delivered as part of Stage 1 of the NSW Government's Rural Ambulance Infrastructure Reconfiguration (RAIR) Program, which provided 24 new or upgraded stations to enhance emergency services in regional and rural NSW. The overall RAIR Stage 1 and 2 program value was $232 million.

Princes Highway Upgrade - Jervis Bay Road to Sussex Inlet Road
A planned 20-kilometre upgrade to the Princes Highway between Jervis Bay Road and Sussex Inlet Road. Stage one, the highest priority, is a 6-kilometre section between Jervis Bay Road and Hawken Road, which will be upgraded to two lanes in each direction with a median barrier to improve safety. Planning is ongoing for future stages. The upgrade aims to improve safety, traffic, and freight efficiency. The project is part of a larger, long-term program to upgrade the Princes Highway between Nowra and the Victorian border.

Princes Highway Upgrade - Jervis Bay Road to Hawken Road
Upgrade of a six-kilometre section of the Princes Highway to a four-lane divided highway with a median barrier, connecting to the Jervis Bay Road intersection upgrade. The project includes an upgraded intersection at Hawken Road, service roads, and measures for safety, wildlife connectivity, and reduced environmental impact. It is the first stage of the broader Princes Highway upgrade between Jervis Bay Road and Sussex Inlet Road.

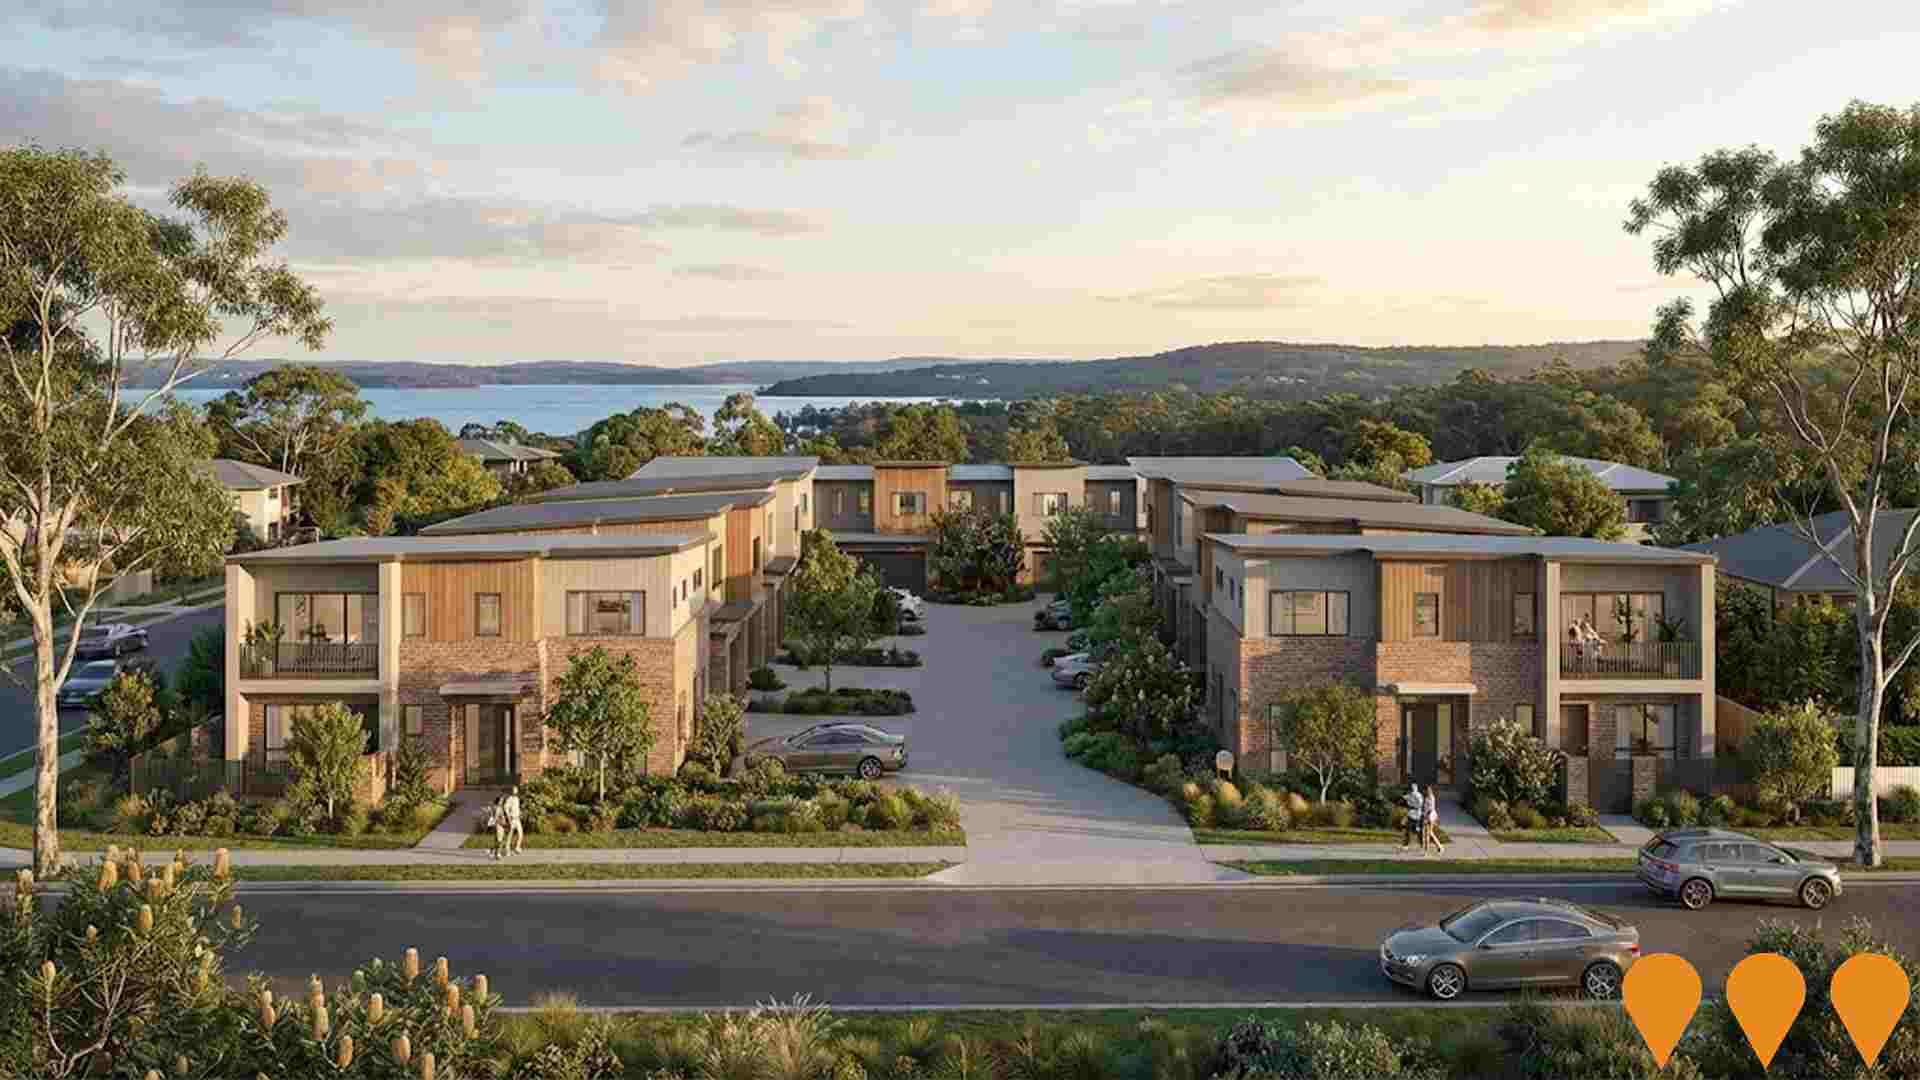
Mixed Use Development with In-Fill Affordable Housing, St Georges Basin
Proposed mixed-use master-planned community precinct featuring 90 dwellings (42 market, 31 affordable rental, and 17 boarding house rooms), 327m2 of non-residential floor space for commercial/retail, co-working space, internal laneways, and a dedicated public pocket park. The development provides 29.5% affordable housing and is a State Significant Development Application (SSD-69683218).
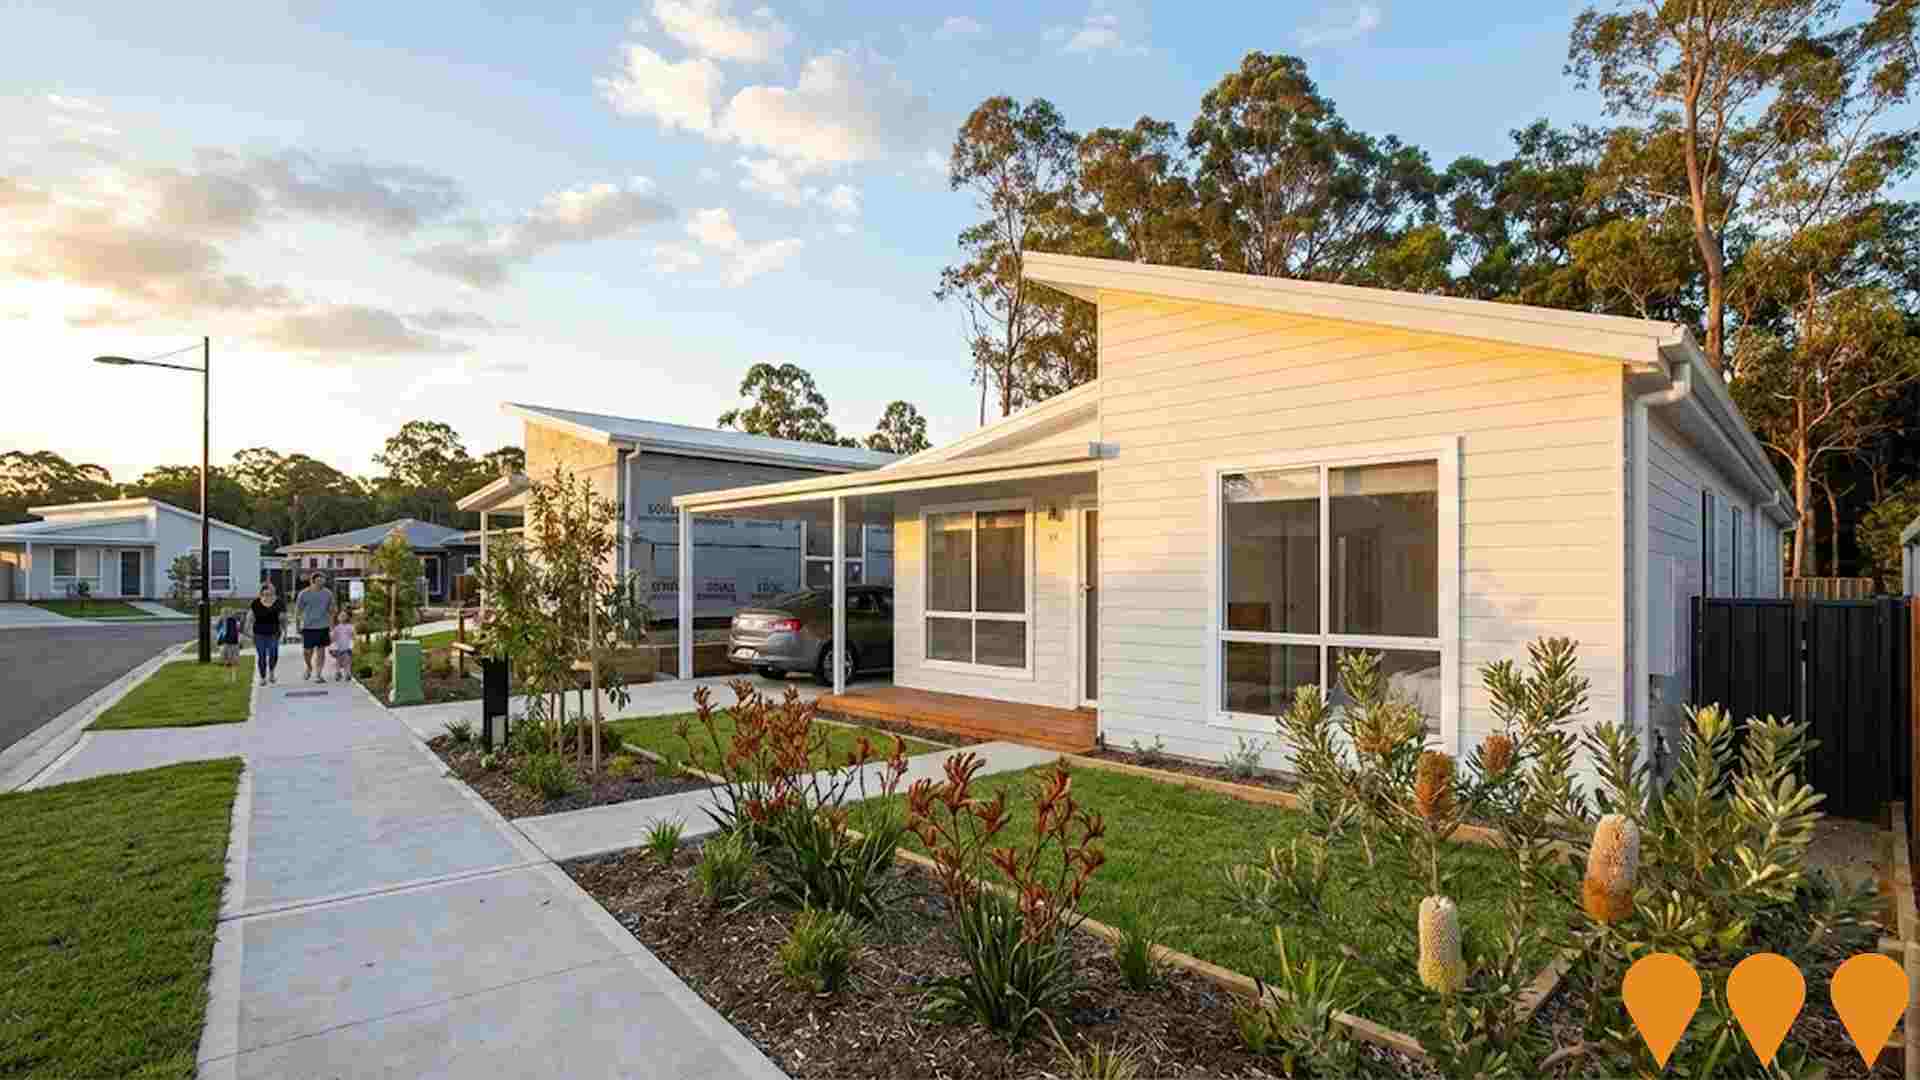
HomeCo Vincentia
Retail centre serving the local community, formerly known as Vincentia Marketplace, now owned and operated by HomeCo. Major tenants include Woolworths and ALDI, along with 31 specialty stores. It features free parking and is a key convenient shopping destination in the Shoalhaven region. The centre's developer was Fabcot.

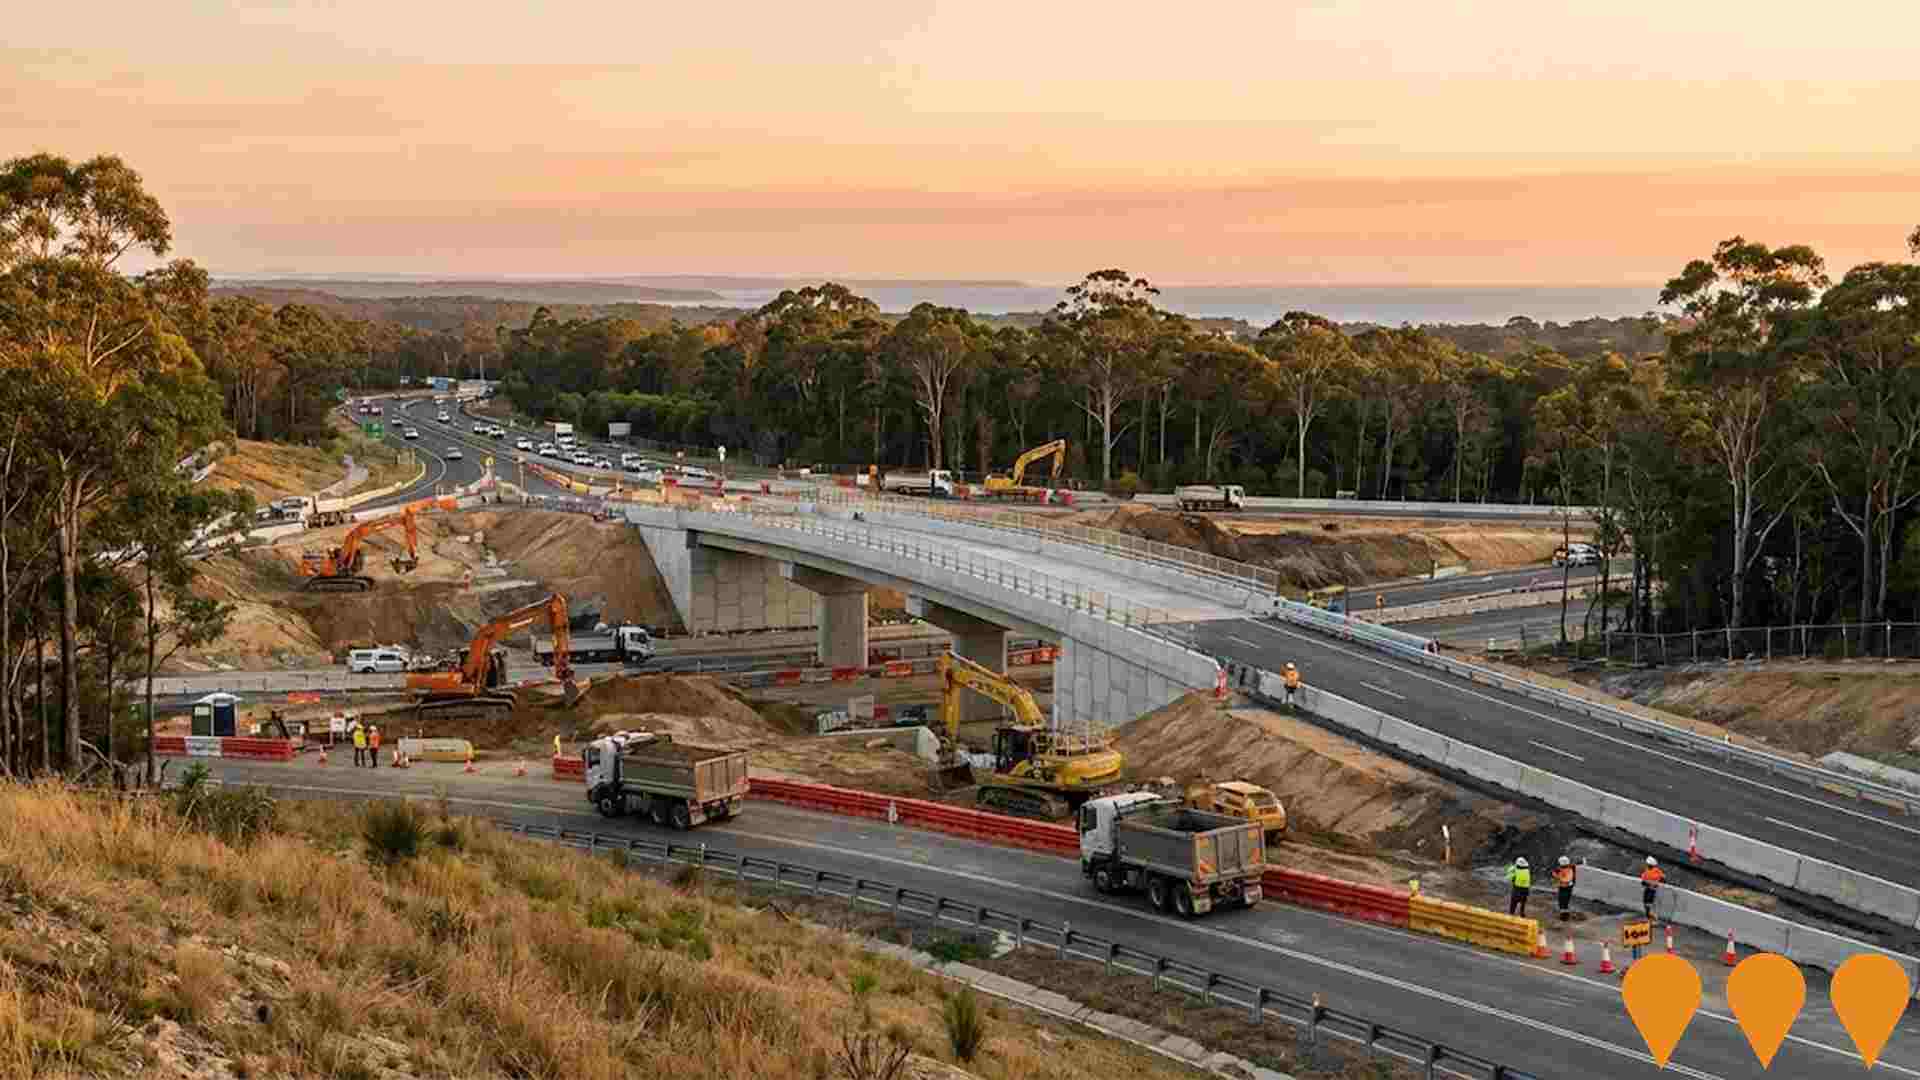
Jervis Bay Road and Princes Highway Intersection Upgrade
Upgrade to the intersection with a grade-separated flyover-style design, including an overpass bridge for highway traffic to safely cross Jervis Bay Road, roundabouts on either side of the highway, two lanes in each direction on Princes Highway approaches, longer entry and exit ramps, and multi-modal facilities to improve safety, reduce congestion, and support tourism and residential growth. Major construction is underway and is expected to take around four years to complete, weather permitting.
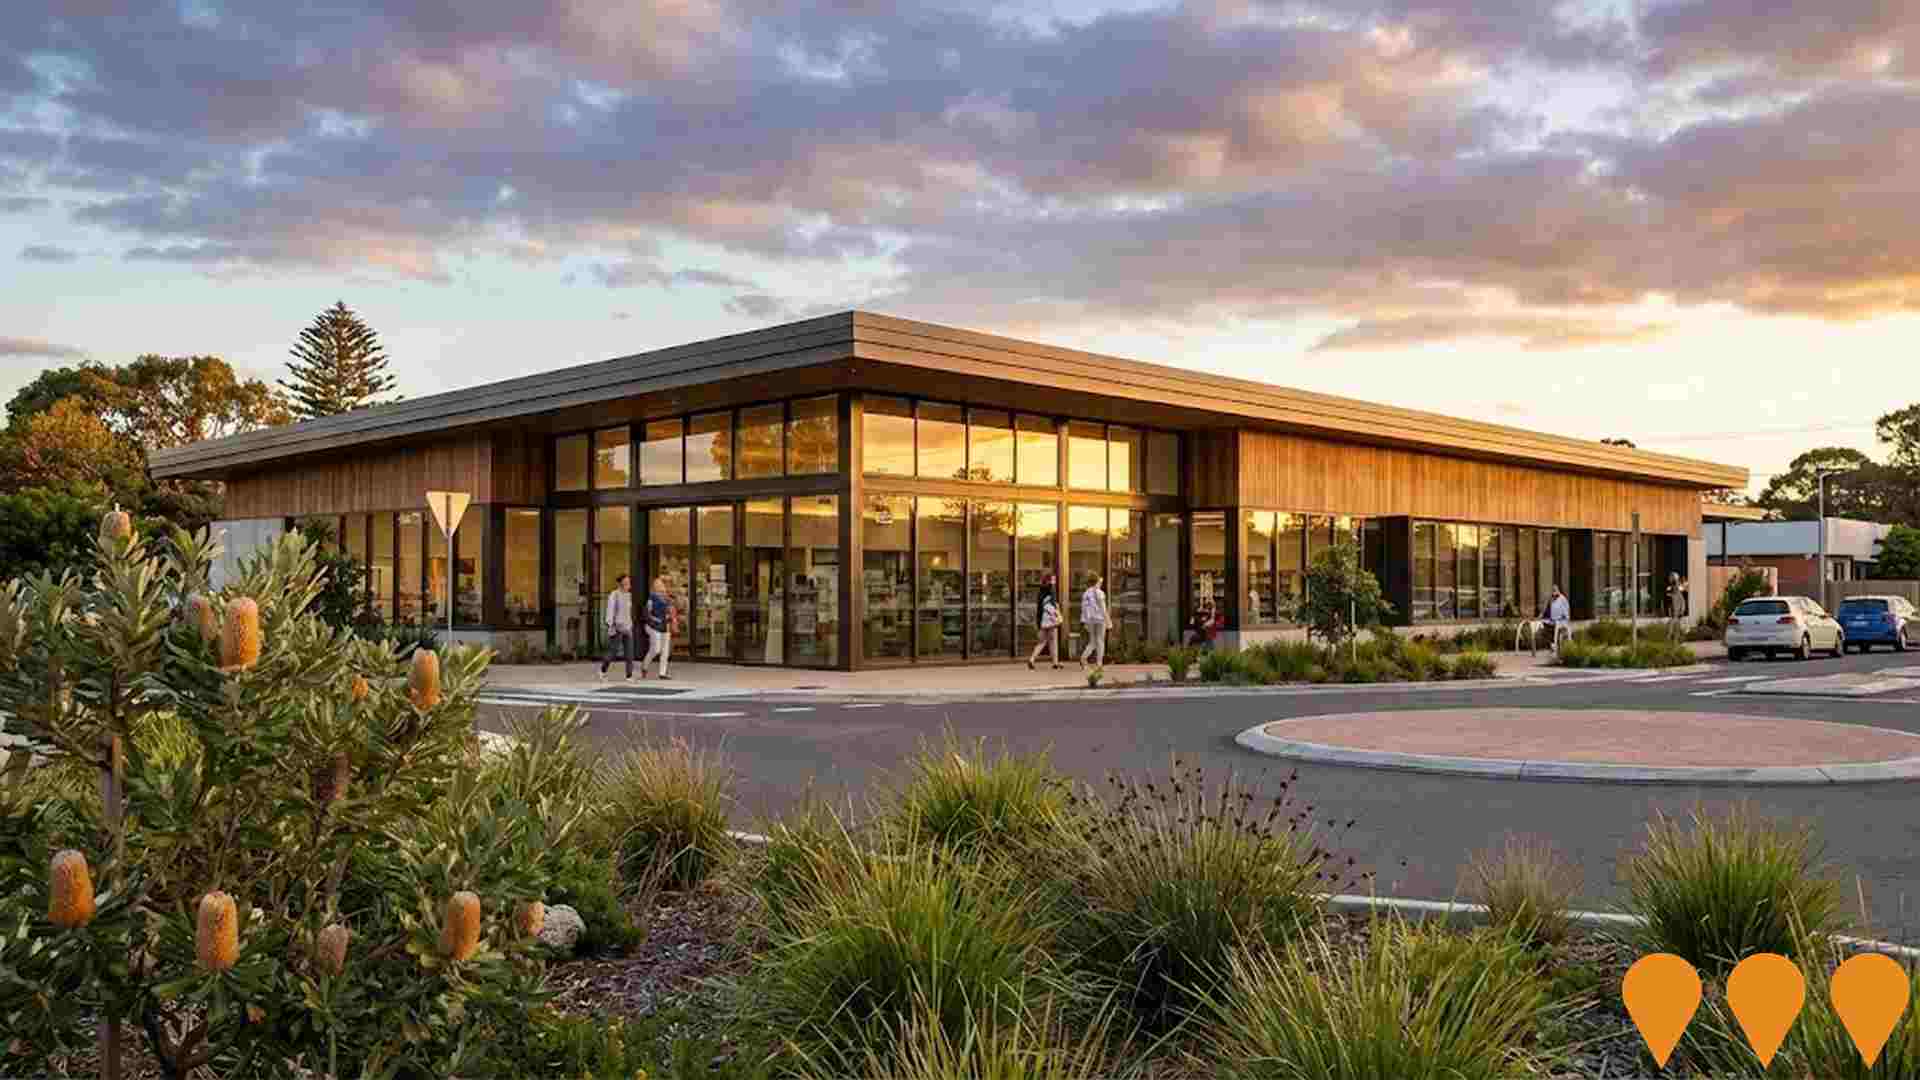
Sanctuary Point Library
Shoalhaven City Council is progressing a new district library to replace the outdated existing facility serving the Sanctuary Point and wider Bay and Basin community (30,000+ residents). In April 2025 Council resolved not to proceed with the Kerry Street / Paradise Beach Road site due to parking concerns and directed staff to investigate alternative locations. The project remains in planning with site investigations underway and a rescoped single-storey design concept prepared by Brewster Hjorth Architects.
Vincentia Coastal Village - Project Modification 9 and Concept Plan Mod 17
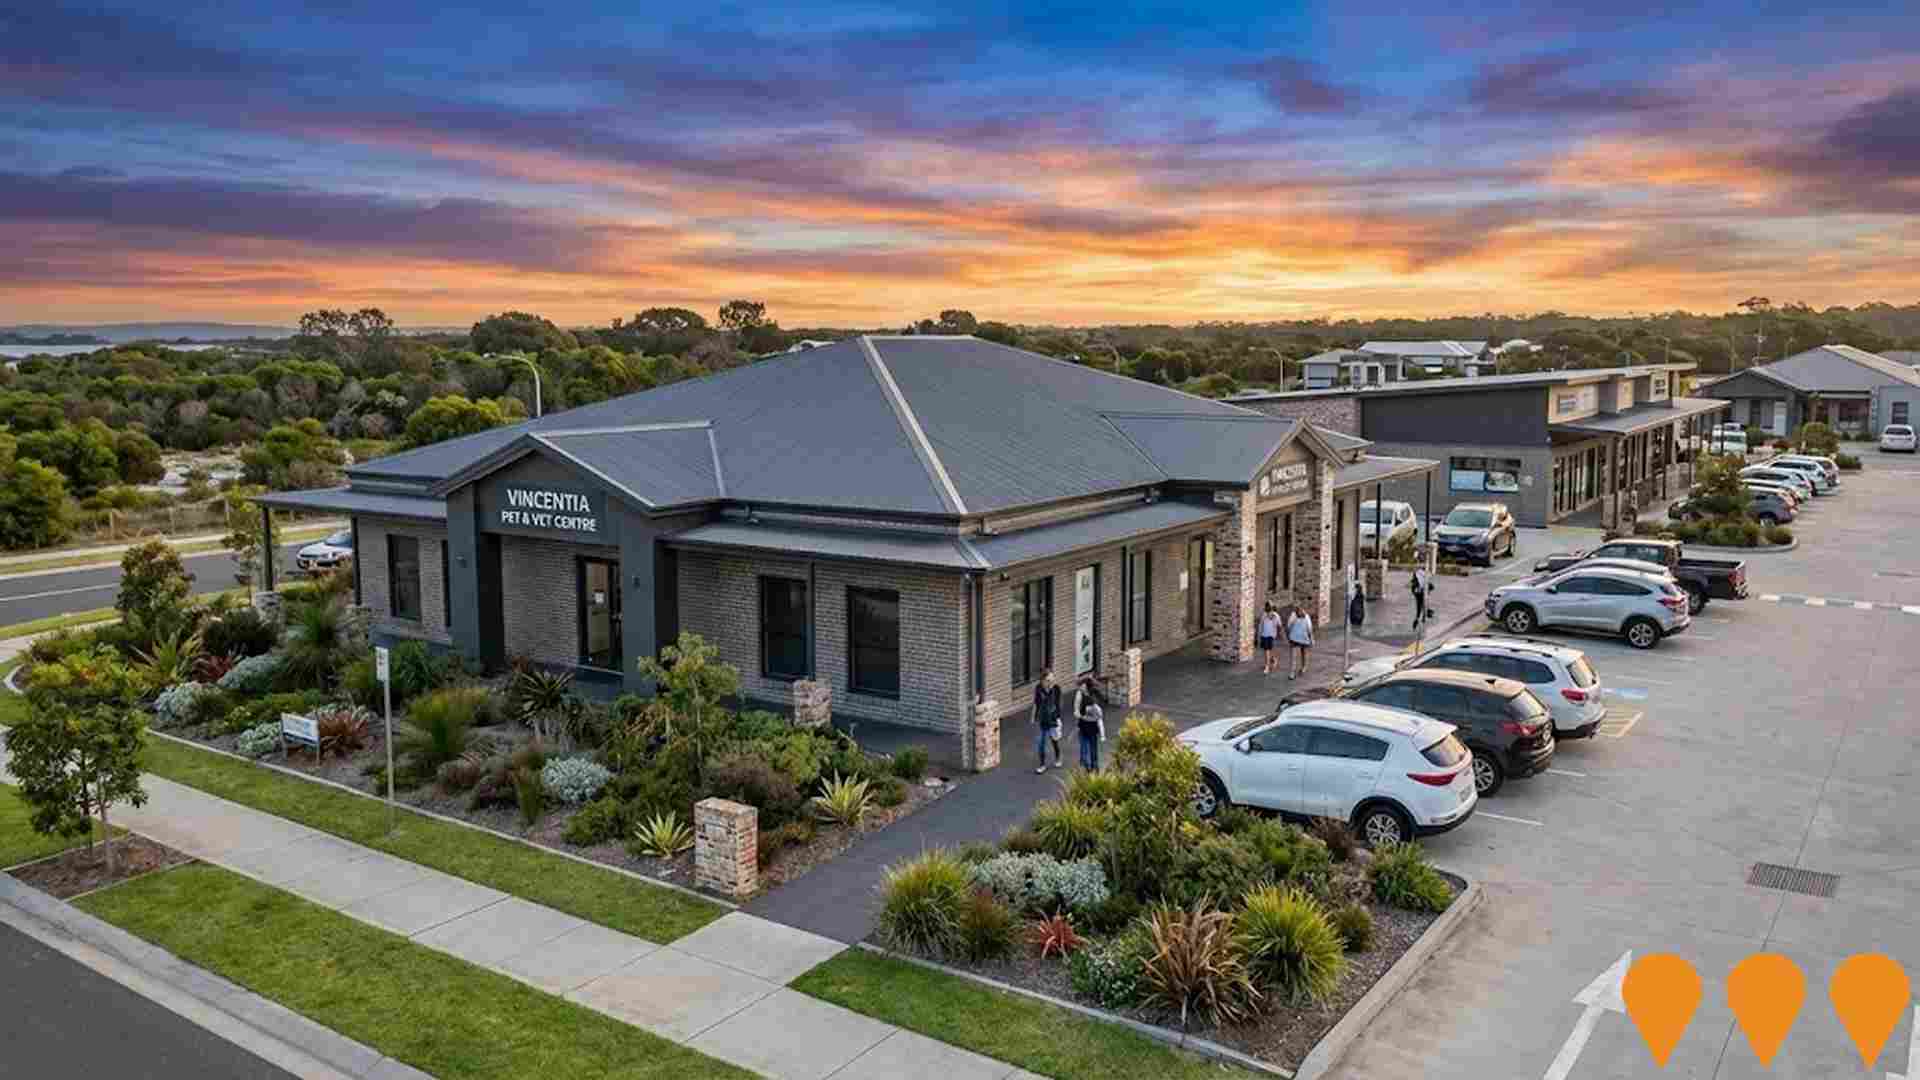
Modification application for the Vincentia Coastal Village Concept Plan (MP06_0060-Mod-17) and the Vincentia District Town Centre Stage 1 project approval (MP06_0025-Mod-9). The modification seeks amendments to staging, land uses, car parking, and a reduction in gross floor area, to include specialty retail, bulky goods, a pet store, a vet, a medical centre, a gym, and a 120-place child care centre. The modification is currently undergoing assessment by the NSW Department of Planning and Environment, with a request for a Response to Submissions issued in November 2022.
Employment
AreaSearch analysis of employment trends sees Tomerong - Wandandian - Woollamia performing better than 85% of local markets assessed across Australia
Tomerong - Wandandian - Woollamia has a skilled workforce with strong representation in essential services sectors. Its unemployment rate was 1.7% as of the past year, with an estimated employment growth of 3.2%.
As of September 2025, 1,899 residents are employed, with an unemployment rate of 2.1%, below Rest of NSW's rate of 3.8%. Workforce participation is similar to Rest of NSW at 56.4%. Dominant employment sectors include construction, health care & social assistance, and public administration & safety. The area specializes in construction, with an employment share 1.5 times the regional level, but agriculture, forestry & fishing has lower representation at 2.4% compared to the regional average of 5.3%.
Employment opportunities locally may be limited, as indicated by Census data. In the past year, employment increased by 3.2%, labour force by 3.7%, and unemployment rose by 0.5 percentage points. This contrasts with Rest of NSW where employment fell by 0.5% and unemployment rose by 0.4 percentage points. State-level data from 25-Nov shows NSW employment contracted by 0.03% with an unemployment rate of 3.9%, compared to the national rate of 4.3%. Jobs and Skills Australia's forecasts suggest national employment will expand by 6.6% over five years and 13.7% over ten years, but growth rates vary between sectors. Applying these projections to Tomerong - Wandandian - Woollamia's employment mix indicates local employment should increase by 6.2% over five years and 12.9% over ten years, based on a simple weighting extrapolation for illustrative purposes.
Frequently Asked Questions - Employment
Income
Income levels align closely with national averages, indicating typical economic conditions for Australian communities according to AreaSearch analysis
AreaSearch's latest postcode level ATO data for financial year 2022 shows Tomerong - Wandandian - Woollamia SA2 had a median income among taxpayers of $54,087 and an average of $68,179. This was higher than the national averages. Rest of NSW's median income was $49,459 with an average of $62,998 during the same period. Based on Wage Price Index growth, current estimates suggest a median income of approximately $60,907 and an average of $76,776 as of September 2025. According to Census 2021 income data, household income ranked at the 48th percentile ($1,716 weekly), while personal income was at the 32nd percentile. Income analysis revealed that 33.8% of locals (1,292 people) fell into the $1,500 - $2,999 category, which is consistent with broader trends across regional levels showing 29.9% in the same category. After housing costs, residents retained 86.9% of their income, indicating strong purchasing power. The area's SEIFA income ranking placed it in the 5th decile.
Frequently Asked Questions - Income
Housing
Tomerong - Wandandian - Woollamia is characterized by a predominantly suburban housing profile, with above-average rates of outright home ownership
In Tomerong-Wandandian-Woollamia, as per the latest Census, 99.0% of dwellings were houses, with 0.9% being semi-detached, apartments, or other types. This compares to Non-Metro NSW's 87.8% houses and 12.2% other dwellings. Home ownership in Tomerong-Wandandian-Woollamia stood at 48.8%, with mortgaged dwellings at 41.7% and rented ones at 9.5%. The median monthly mortgage repayment was $2,000, higher than Non-Metro NSW's average of $1,733. Weekly rent in the area averaged $335, lower than Non-Metro NSW's $350. Nationally, Tomerong-Wandandian-Woollamia's mortgage repayments exceeded the Australian average of $1,863, while rents were below the national figure of $375.
Frequently Asked Questions - Housing
Household Composition
Tomerong - Wandandian - Woollamia features high concentrations of family households, with a higher-than-average median household size
Family households account for 81.1% of all households, consisting of 35.0% couples with children, 38.3% couples without children, and 7.1% single parent families. Non-family households make up the remaining 18.9%, with lone person households at 17.2% and group households comprising 1.6% of the total. The median household size is 2.7 people, which is larger than the Rest of NSW average of 2.3.
Frequently Asked Questions - Households
Local Schools & Education
Tomerong - Wandandian - Woollamia shows below-average educational performance compared to national benchmarks, though pockets of achievement exist
The area's university qualification rate is 19.3%, significantly lower than the NSW average of 32.2%. Bachelor degrees are most common among qualified residents at 12.5%, followed by postgraduate qualifications (3.9%) and graduate diplomas (2.9%). Vocational credentials are held by 47.3% of residents aged 15+, with advanced diplomas at 11.3% and certificates at 36.0%. Educational participation is high, with 28.0% of residents currently enrolled in formal education.
This includes 10.6% in primary education, 8.1% in secondary education, and 3.0% pursuing tertiary education.
Frequently Asked Questions - Education
Schools Detail
Nearby Services & Amenities
Transport
Transport servicing is low compared to other areas nationally based on assessment of service frequency, route connectivity and accessibility
Tomerong-Wandandian-Woollamia region has 134 active public transport stops. These are served by a mix of buses via 33 routes, offering 441 weekly passenger trips in total. The average distance to the nearest stop for residents is 326 meters.
On average, there are 63 trips per day across all routes, translating to about three weekly trips per stop.
Frequently Asked Questions - Transport
Transport Stops Detail
Health
Health performance in Tomerong - Wandandian - Woollamia is lower than average with common health conditions somewhat prevalent across both younger and older age cohorts
Tomerong-Wandandian-Woollamia faces significant health challenges with common health conditions prevalent across both younger and older age cohorts. The rate of private health cover is approximately 54% (2,053 people), compared to 49.3% across the Rest of NSW.
The most common medical conditions are arthritis and mental health issues, impacting 11.1% and 8.4% of residents respectively. 64.8% of residents declare themselves completely clear of medical ailments, compared to 59.4% in the Rest of NSW. There are 23.5% (896 people) of residents aged 65 and over, lower than the 27.8% in the Rest of NSW. Health outcomes among seniors are above average, performing better than the general population in health metrics.
Frequently Asked Questions - Health
Cultural Diversity
Tomerong - Wandandian - Woollamia is considerably less culturally diverse than average when assessed alongside AreaSearch's national rankings for language and cultural background related metrics
Tomerong-Wandandian-Woollamia, surveyed in June 2016, showed low cultural diversity with 90.1% citizens, 87.2% born in Australia, and 95.3% speaking English only at home. Christianity was the predominant religion, at 51.0%, compared to 52.6% regionally (Rest of NSW). Ancestry wise, Australian (32.4%), English (32.4%), and Scottish (7.6%) were the top groups.
Notably, Maltese (1.0% vs 0.6%), French (0.6% vs 0.4%), and Dutch (1.5% vs 1.1%) were overrepresented compared to regional averages.
Frequently Asked Questions - Diversity
Age
Tomerong - Wandandian - Woollamia hosts an older demographic, ranking in the top quartile nationwide
Tomerong - Wandandian - Woollamia has a median age of 46, which is higher than Rest of NSW's figure of 43 and significantly higher than Australia's national norm of 38. The age group of 55-64 is strongly represented at 15.3%, compared to Rest of NSW, while the 25-34 cohort is less prevalent at 9.5%. According to post-2021 Census data, the 15-24 age group has grown from 10.5% to 13.3%, and the 75-84 cohort increased from 6.0% to 7.5%. Conversely, the 55-64 cohort has declined from 17.5% to 15.3%, and the 5-14 group dropped from 12.4% to 10.8%. By 2041, Tomerong - Wandandian - Woollamia is expected to see notable shifts in its age composition, with the 85+ group growing by 121%, reaching 179 people from 81. The aging population dynamic is clear, with those aged 65 and above comprising 52% of projected growth. Conversely, population declines are projected for the 45-54 and 65-74 age cohorts.
