1 Proposed12applications in assessmentLeading · to August 2026See applications ↓
2 Approved1,915dwellings approved in 2025-26, or 2.55 per 100 existing dwellings a yearOfficial · ABS to August 2026See approvals ↓
3 Building54major projects committed or under construction, 33 of them already on siteForward · completions to 2030+See projects ↓
4 Delivered9,571new addresses verified since the 2021 Census, up 41.8% on the existing baseActual · to August 2026Where it landed ↓
In the 2025-26 financial year the ABS recorded 1,915 dwelling approvals across Jimboomba. Right now, 12 development applications are lodged in the Logan local government area. AreaSearch tracks 54 major projects here that are committed or under construction, the largest being Greater Flagstone Priority Development Area at an estimated $12.0bn. On the ground, 9,571 new addresses have been verified since the 2021 Census — growth of 41.8% on the existing address base.
These four figures are deliberately not added together. An application, an
approval and a project under construction are often the same building at three points in its life,
measured by three different bodies with three different lags. Read them as a sequence, not a total.
ApprovedBuilding Approvals in Jimboomba
What councils and certifiers have formally
permitted — the ABS series, published about four months in arrears.
Approvals are running at 2.55 per 100 existing dwellings a year, well above the Queensland rate of 0.77. Development here remains overwhelmingly detached: houses account for 92% of recent approvals. The mix being approved closely matches what is already standing — 95% houses against 97% of existing homes. The average approved dwelling is valued at $368,000 in construction cost.
For its size, Jimboomba is adding 2.55 dwellings a year per 100 existing homes — well above the Queensland rate of 0.77 and the national rate of 0.71. That is about 19.9 approvals a year for every 1,000 residents. Building intensity has risen by about 33% across the published series.
Measured against people rather than housing stock, Jimboomba is approving 23.77 dwellings a year per 1,000 residents — well above the Queensland rate of 8.54. The two rate views differ by household size, which here averages 3.4 people per home. Housing the projection to 2041 would need about 12.20 per 1,000 residents a year.
Dwelling approvals a year per 100 existing
homes, with Queensland and Australia for comparison. This is the
same activity as the totals view, divided by the size of the area — which is the only
fair way to compare a large SA3 with a small one.
Dwelling approvals a year per 1,000
residents, each year divided by that year’s estimated resident
population (ABS ERP at 30 June), not by today’s — which matters most in fast-growing
areas, where a fixed denominator can understate the early years by half. The most recent periods use the latest published ERP, as the population series runs a year behind approvals. Read it alongside the per-100-homes view: the two differ wherever household size does.
Dwelling units approved each financial year. The dashed line is the five-year average of 1,701.
How intensively is it building?
Dwelling approvals a year per 100 existing dwellings.
Jimboomba2.55
Queensland0.77
Australia0.71
What is here, and what is coming
Detached houses as a share of existing homes,
against the share of recent approvals.
Existing homes (2021 Census)97%
Approved, last 5 years95%
Approved, latest year92%
Detached housesApartments, townhouses & other
Approvals mix by year
Share of each year’s approvals.
2023
2024
2025
2026
2025-26
$802m
Residential work approved
2025-26
$38.7m
Commercial work approved
construction cost
$368,000
Average value per approved dwelling
last two years
39
Residents per approval
Supply & DemandIs Jimboomba Building Enough Homes?
The same approvals, measured against the population
they have to house.
Jimboomba approves about 19.9 new dwellings a year for every 1,000 residents. Since the 2021 Census it has added 23,772 residents and 9,571 new addresses — about 2.5 extra people per home built, below the 3.4-person average household, so building has run ahead of population growth. Housing the population projected for 2041 implies roughly 1,042 new dwellings a year from here, which puts the recent approval rate of 1,701 a year comfortably ahead of what the projection needs.
Growth against supply since the Census
People added for every new address verified,
against the size of an average local household.
People added per new home2.5
Average household size3.4
A bar longer than the household average means
the area gained more residents than its new housing could hold, and the extra had to be
absorbed by existing homes.
Approval rate against projected need
Dwellings a year: what is currently being
approved, against what the 2041 population projection implies.
Approved (5-yr average)1,701
Implied need to 20411,042
Implied need assumes the average household stays
at today’s 3.4 people. Approvals are not
completions, and not every approval is built.
What is being asked for right now — applications
collected from council planning portals, before any of it reaches the ABS series above.
AreaSearch tracks applications of material scale; routine minor works such as signage and
fencing changes are not carried, so these are not counts of every application lodged. 15
of them carry an AreaSearch analyst assessment — look for the
Analysed marker in the search below.
AreaSearch tracks 124 development applications of material scale lodged with council across Jimboomba, the most recent in August 2026. 12 of them are still in assessment. The most common types in the queue are retail, industrial and commercial.
Number of applications by development type. This is the clearest
single picture of what kind of place Jimboomba is being asked to become. Councils in
Queensland do not publish an estimated cost of works in
their planning feeds, so applications here are counted rather than valued. A further 1 application sit across
1 smaller category,
too few to plot.
Where the applications stand
As reported by the council. Highlighted rows are
applications still in assessment.
Decision Notice Issued79
Application Withdrawn8
Pending Decision Notice6
Permit in Force6
Negotiated Decision Notice Issued5
Pending Information Response5
4 applications are still marked under
assessment but were lodged more than
18 months ago. Councils often leave determined or
abandoned applications open in their feeds, so
they are counted here but excluded
from the live queue above.
By local government area
Applications on record within each council area that
overlaps Jimboomba. This counts applications inside this
statistical area only — it is not a total for the council.
Logan124
Recent applications in Jimboomba
By the number of dwellings proposed, as lodged. Figures are the applicant’s own and are not verified by AreaSearch.
Multiple Dwelling (Townhouse x40)Logan Village · Pending Confirmation Notice · lodged Aug 2026
Multiple Dwelling (Townhouses x 4)Jimboomba - Glenlogan · Pending Information Response · lodged Jul 2026
Shop (Liquor Store and Drive-through Facility)Jimboomba - Glenlogan · Pending Information Response · lodged Jul 2026
Multiple Dwelling (Townhouse x4)Jimboomba - Glenlogan · Pending Information Request · lodged Jun 2026
Multiple Dwellings (4 Town Houses)Jimboomba - Glenlogan · Pending Information Response · lodged May 2026
Development of a service stationGreenbank - North Maclean · Pending Information Request · lodged Jan 2026
Establishment of a service station with ancillary convenience retail and food and drink activities.Greenbank - North Maclean · On Notification · lodged Jan 2026
BuildingFORWARDMajor Projects & Infrastructure in Jimboomba
What is funded and moving — the projects large enough
to change how Jimboomba works, ranked by committed value and how close
they are to delivery.
AreaSearch tracks 54 current projects across Jimboomba. The largest is Greater Flagstone Priority Development Area at an estimated $12.0bn. That breaks down as 33 under construction, 3 approved and awaiting a start and 18 still in planning. The pipeline is weighted toward communities, precincts & urban renewal, transport & logistics and residential development.
Under construction$900mby 2028
Flagstone Logistics Estate
A 118-hectare masterplanned industrial and logistics estate in the Greater Flagstone Priority Development Area, North Maclean QLD, positioned adjacent to the Mount Lindesay Highway with direct diamond…
Major staged residential expansion within the Greater Flagstone Priority Development Area being delivered by Peet. The precinct will provide about 1,631 residential lots together with future retail, parks…
Master-planned residential community delivering 800+ lots with parks, walking trails and a future neighbourhood centre on the eastern edge of Beaudesert, approximately 35 minutes from Brisbane and 40 minutes…
Greater Flagstone Priority Development AreaUnder construction · Communities, Precincts & Urban Renewal · Flagstone (East) - Riverbend
$12.0bn
Kindira by Mirvac (Monarch Glen Master Planned Community)Under construction · Residential Development · by 2040 · Flagstone (East) - Riverbend
$2.50bn
Flinders LakesUnder construction · Communities, Precincts & Urban Renewal · by 2050 · Flagstone (West) - New Beith
$2.00bn
Flagstone Master Planned CommunityUnder construction · Communities, Precincts & Urban Renewal · by 2040 · Flagstone (West) - New Beith
$6.70bn
Everleigh Estate by MirvacUnder construction · Communities, Precincts & Urban Renewal · by 2035 · Greenbank - North Maclean
$850m
Yarrabilba Energy InfrastructureUnder construction · Energy · by 2027 · Jimboomba - Glenlogan
$100m
Flagstone CityUnder construction · Communities, Precincts & Urban Renewal · by 2050 · Flagstone (West) - New Beith
$12.0bn
Yarrabilba and Greater Flagstone Infrastructure Funding AgreementUnder construction · Precincts & Urban Renewal · Logan Village
$1.20bn
39 further projects in
Jimboomba are not listed here.
Combined values on this page exclude
5 records that appear to be
separate stages of a project already counted. Both are still listed
above with their own values.
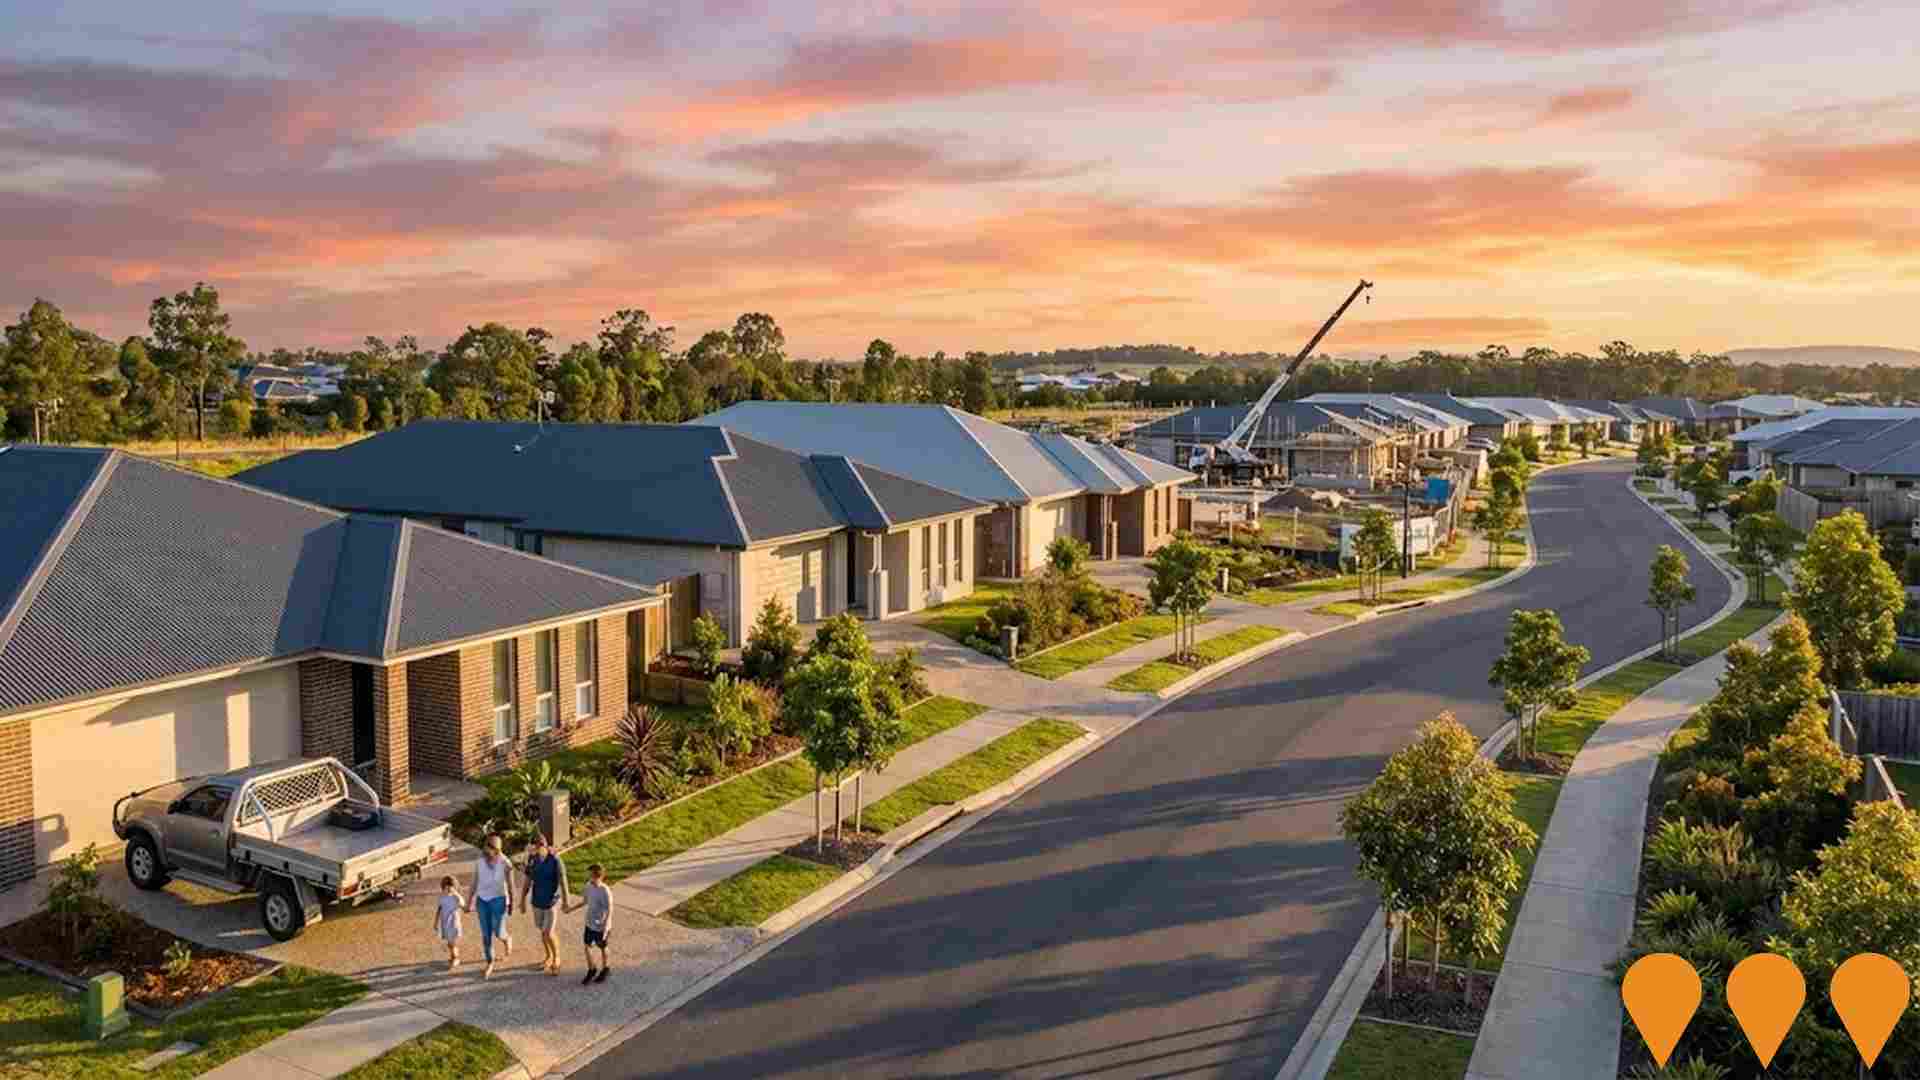
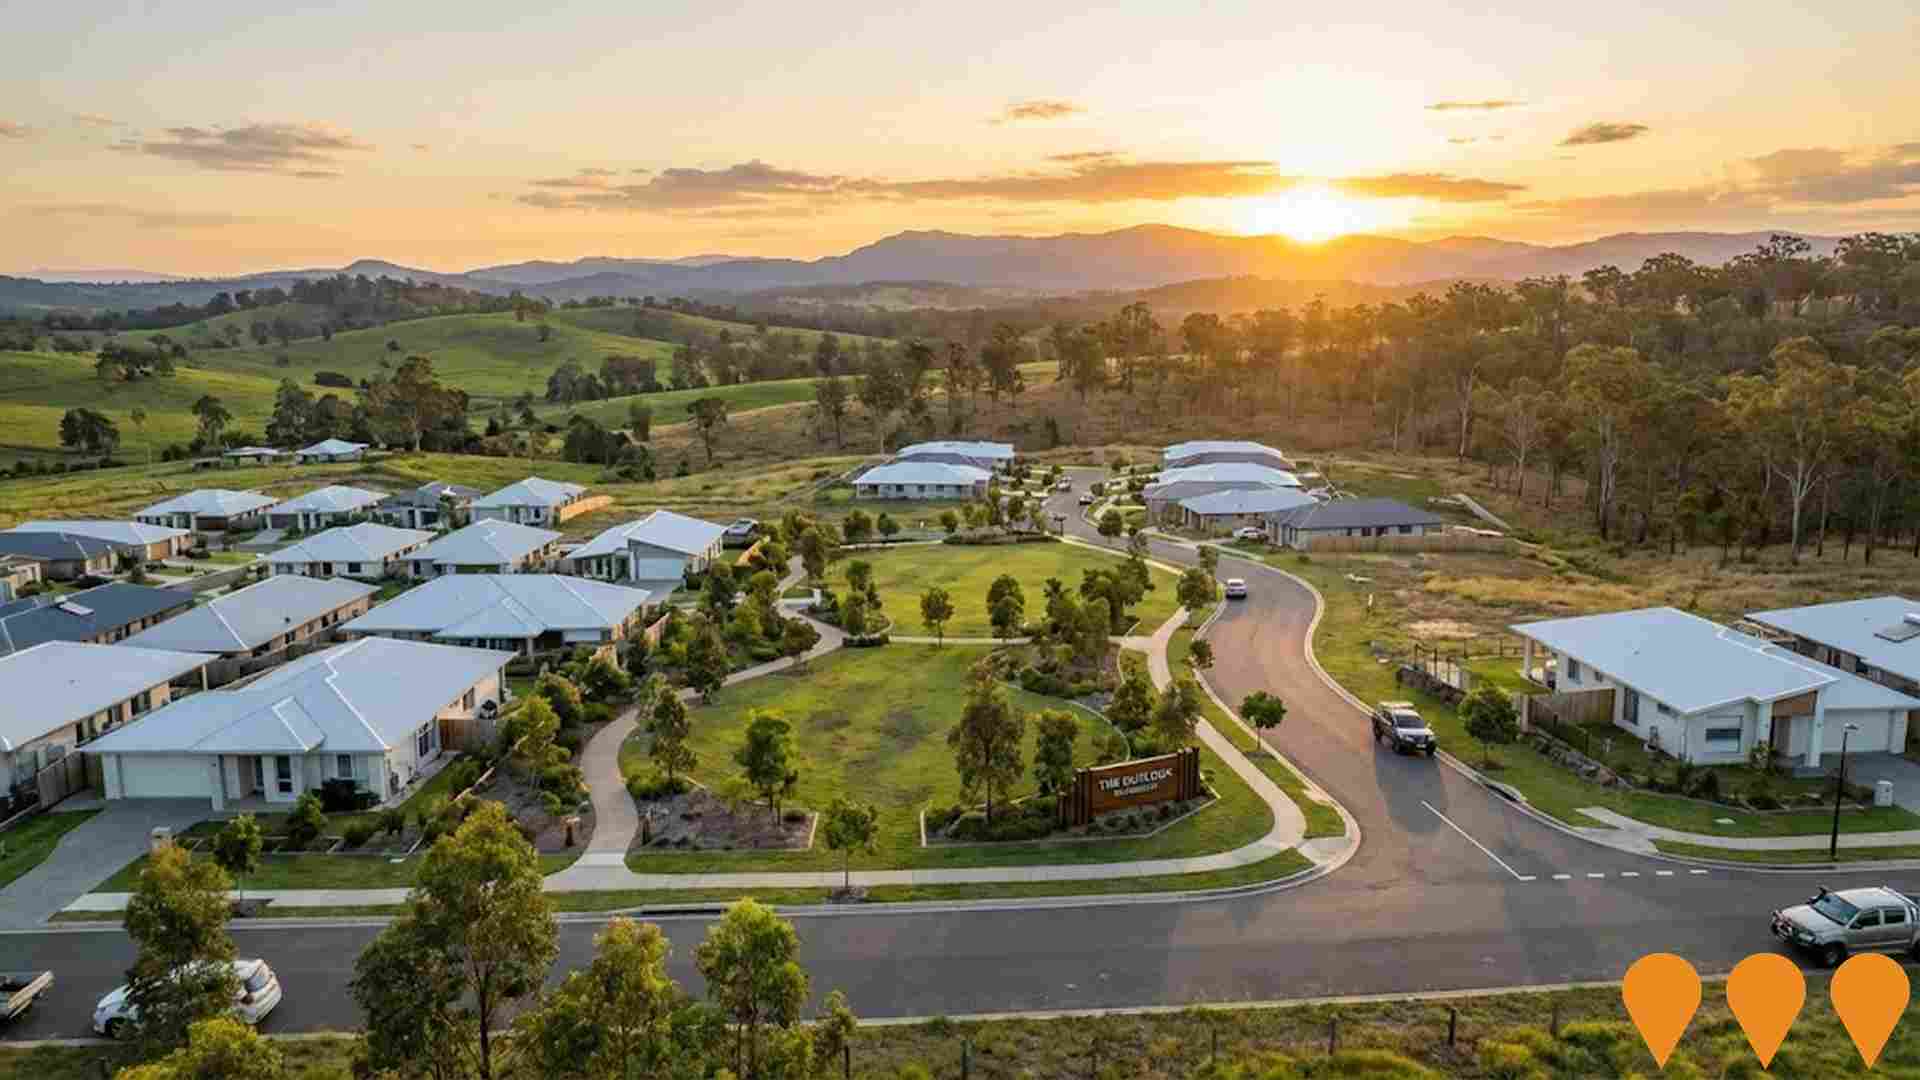
Denotes AI-based impression for illustrative purposes only, not to be taken as
definitive under any circumstances. Please follow links and conduct other
investigations from the project’s source for actual imagery. Developers and
project owners wishing us to use original imagery please Contact
Us and we will do so.
Beyond 2030:
a further $20.4bn across
13 projects with completion dates further out — mostly precinct-scale programs whose dates are
indicative. Kept out of the chart so the years you can act on stay readable.
Estimated value of tracked projects by the year they are due to
complete, stacked by how certain they are. The dark band is money already being spent;
the pale band is still an intention. Estimates are indicative and mix infrastructure
cost with whole-of-precinct development value, so read the shape rather than the totals.
Approvals PipelineDevelopment Applications in Jimboomba
Development applications around
Jimboomba
Development approvals is a new addition to AreaSearch.
We’re actively expanding council coverage and refining the dataset — details and statuses for some councils may be partial. Check back regularly for the latest pipeline.
Applications
—
In the local catchment
Est. Value
—
Where disclosed
Under Assessment
—
Awaiting determination
Determined
—
Approved or decided
Approvals pipelineStatus, location, timing and project scale
Loading development applications…
Lodged
Address
Description
Type
Distance
Status
SOURCE: Planning portals and council registers, compiled by AreaSearch. Distance & bearing measured from the suburb midpoint.
ProfessionalPRODevelopment Map for Jimboomba
Applications and major projects plotted where
they are actually proposed, with the
74 projects AreaSearch tracks here on their own tab — filterable by type, delivery stage,
area and committed value. To search every application on record rather
than this sample, use the section above.
DistributionWhere Development Is Happening in Jimboomba
Jimboomba covers 6 statistical areas, and development is not spread evenly between them. Greenbank - North Maclean alone accounted for 36% of the area’s dwelling approvals in 2025-26. The top three between them took 84% of the total.
Approvals per 100 existing homes in
2025-26, by statistical area, with the Jimboomba figure marked. Ranked
rather than stacked: rates cannot be added together.
Approvals per 1,000 residents in 2025-26,
by statistical area, against each area’s own estimated resident population, with the
Jimboomba figure marked. A small area building hard is invisible in
the totals view and obvious here.
Dwelling approvals each financial year, split by the statistical area they
fell in. Each column totals the whole Jimboomba figure from the
approvals chart above — SA2s nest exactly inside an SA3, so the two always reconcile.
Tap or click an area in the legend to hide it and compare the rest.
The smallest 1 areas are
grouped as one band.
Map builder
Each area below opens a map builder on its own page — a tool for
putting a map and a table into a report. Pick the place types you want plotted
(schools, supermarkets, medical, child care, transport and the rest of what
AreaSearch holds), add development applications as their own layer, drop your own
points, then recolour, renumber and export the result as a table or CSV.
A this area only toggle clips everything to the boundary you are looking at.
Searches are charged against your credit balance — 1 credit per 40
results from AreaSearch data — and setting filters costs nothing until
you search. The builder works on one suburb-sized area at a time, which is why it
opens per area rather than across the whole of
Jimboomba.
Development in Jimboomba is assessed within the Logan local government area. AreaSearch publishes development
figures at ABS statistical boundaries rather than council boundaries. That is deliberate: the ABS
issues a separate official building-approvals series for local government areas, and totals
built up from statistical areas would not match it. Reporting at SA3 keeps every figure on this page
reconcilable with the published ABS series.
CompareNearby Development Hubs
The same view of building approvals, applications and
major projects for areas neighbouring Jimboomba.
Collected from council planning portals. The
earliest signal available, but the least certain: many applications are amended,
withdrawn or refused, values are the applicant’s own estimate, and coverage
varies by council. This is a curated set, not the full council feed:
AreaSearch carries applications of material scale and does not track routine minor
works such as signage, fencing or small alterations, so the counts here are lower
than a council’s own total lodgement figure and should not be compared with it. Applications still shown as under assessment more than
18 months after lodgement are reported separately
and kept out of the live-queue figures: the age profile of open applications is
sharply split between a genuine queue under a year old and a long tail of records
councils never closed. Not every state publishes a cost of works — Queensland,
the Northern Territory and the ACT publish none at all — so on those pages
applications are counted rather than valued and no dollar figure is shown
rather than a partial one. Treated here as a snapshot of the current queue only —
AreaSearch does not chart application counts over time, because the history
reflects when each portal was collected rather than when development happened.
Approved — ABS building approvals
The official series, aggregated to SA3 from
ABS building approvals data, currently published to August 2026.
Counts dwelling units approved, not buildings and not completions. The most recent
financial year is annualised from nine months of data wherever it appears and is
labelled as such.
Building — major projects
Projects tracked individually by AreaSearch
from Infrastructure Australia, state infrastructure agencies, developer disclosures
and council records. Values are estimates and delivery dates are targets. Ranked on
this page by committed value and delivery stage rather than by distance.
Delivered — verified new addresses
New residential addresses verified in the national
address register since the 2021 Census. This is the closest available measure of what has
actually been built, though address creation can lead occupation and lags
construction. It is not a completions count.
Boundaries
Jimboomba is Statistical Area Level 3 31104 in the ABS Australian Statistical Geography Standard (2021 edition), made up of 6 Statistical Areas Level 2.
It has an estimated 85,410 residents, +38.6% since the 2021 Census.
Currency
Measure
Source
To
Dwelling approvals, five-year average
ABS / AreaSearch
July 2026
House share of approvals
ABS / AreaSearch
July 2026
Residents per approval
ABS / AreaSearch
July 2026
Value per approved dwelling
ABS / AreaSearch
July 2026
Commercial work approved
ABS / AreaSearch
July 2026
Verified new addresses since the Census
Address register / AreaSearch
August 2026
Development applications
Council planning portals
August 2026
Major projects
Infrastructure Australia / state agencies / AreaSearch
Ongoing
Figures on this page are read live from the
AreaSearch database each time it loads, so they update as soon as a source does.
Development in Jimboomba — common questions
How many new dwellings were approved in Jimboomba?
The ABS recorded 1,915 dwelling approvals across Jimboomba in the 2025-26 financial year, against a five-year average of 1,701 a year.
How many development applications are lodged in Jimboomba?
AreaSearch tracks 124 development applications of material scale across Jimboomba — routine minor works such as signage and fencing are not included, so this is not a count of every application lodged, of which 12 remain in assessment. Applications are assessed within the Logan local government area. The most recent application in our data was lodged in August 2026.
What major projects are planned for Jimboomba?
AreaSearch tracks 54 current major projects in Jimboomba, 33 of them under construction. The largest include Flagstone Logistics Estate, Flagstone East Residential Community and The Outlook Beaudesert.
Which council covers Jimboomba?
Jimboomba is an ABS Statistical Area Level 3. It is covered by the Logan local government area. AreaSearch publishes development figures at ABS statistical boundaries rather than council boundaries, so they reconcile with the official ABS series.
Is Jimboomba growing faster than the rest of Queensland?
On development approvals, Jimboomba is adding new dwellings faster than Queensland as a whole — 2.55 approvals per 100 existing dwellings a year against the state figure of 0.77.
How current is this development data?
ABS building approvals are published with a lag of roughly four months; this page carries the series to August 2026. Development applications are collected from council planning portals and refresh continuously, with the most recent application here lodged in August 2026. Major project records are reviewed on an ongoing basis. Each section carries its own currency label so the four are never confused.
Development data is provided for general information.
Estimated values, dwelling counts and delivery dates come from the lodging or delivering party and
are not independently verified by AreaSearch. Confirm anything material with the relevant council
or agency before relying on it.