Chart Color Schemes
This analysis uses ABS Statistical Areas Level 2 (SA2) boundaries, which can materially differ from Suburbs and Localities (SAL) even when sharing similar names.
SA2 boundaries are defined by the Australian Bureau of Statistics and are designed to represent communities for statistical reporting (e.g., census and ERP).
Suburbs and Localities (SAL) represent commonly-used suburb/locality names (postal-style areas) and may use different geographic boundaries. For comprehensive analysis, consider reviewing both boundary types if available.
est. as @ -- *
ABS ERP | -- people | --
2021 Census | -- people
Sales Activity
Curious about local property values? Filter the chart to assess the volume and appreciation (including resales) trends and regional comparisons, or scroll to the map below view this information at an individual property level.
Find a Recent Sale
Sales Detail
Population
Mallala has seen population growth performance typically on par with national averages when looking at short and medium term trends
Mallala's population was approximately 3,580 as of November 2025. This figure represents a growth of 245 people (7.3%) since the 2021 Census, which recorded a population of 3,335. The increase is inferred from an estimated resident population of 3,523 in June 2024 and an additional 42 validated new addresses since the Census date. This results in a population density ratio of 4.2 persons per square kilometer. Mallala's growth rate exceeded both non-metro areas (6.8%) and the state average during this period, making it a regional growth leader. Interstate migration contributed approximately 60.3% of overall population gains recently, with all drivers including natural growth and overseas migration being positive factors.
AreaSearch uses ABS/Geoscience Australia projections for each SA2 area, released in 2024 with a base year of 2022. For areas not covered by this data and years post-2032, the SA State Government's Regional/LGA projections by age category are adopted, based on 2021 data and adjusted using a method of weighted aggregation of population growth from LGA to SA2 levels. Demographically, locations outside capital cities are projected to have above median population growth. Mallala is expected to expand by 629 persons to reach 4,209 by 2041, reflecting an overall increase of 16.0% over the 17-year period based on the latest annual ERP population numbers.
Frequently Asked Questions - Population
Development
Residential development activity is slightly higher than average within Mallala when compared nationally
Mallala has seen approximately 23 new homes approved annually. Over the past five financial years, from FY-21 to FY-25, a total of 118 homes were approved, with an additional 8 approved so far in FY-26. On average, 1.7 people have moved to the area for each dwelling built over these five years.
This balance between supply and demand has created stable market conditions. The average expected construction cost value of new dwellings is $190,000, which is below regional levels, indicating more affordable housing options for buyers. In FY-26, commercial approvals totaling $10.9 million have been registered, demonstrating moderate commercial development activity in Mallala.
Compared to the Rest of SA, Mallala has seen slightly higher development levels, with 14.0% more per person over the past five years. This has maintained good buyer choice while supporting existing property values. All recent building activity consists of standalone homes, preserving Mallala's traditional low density character and appealing to those seeking family homes with space. The area currently has approximately 189 people per dwelling approval, indicating an expanding market. According to the latest AreaSearch quarterly estimate, Mallala is expected to grow by 572 residents through to 2041. At current development rates, new housing supply should comfortably meet demand, providing good conditions for buyers and potentially supporting growth beyond current population projections.
Frequently Asked Questions - Development
Infrastructure
Mallala has limited levels of nearby infrastructure activity, ranking in the 8thth percentile nationally
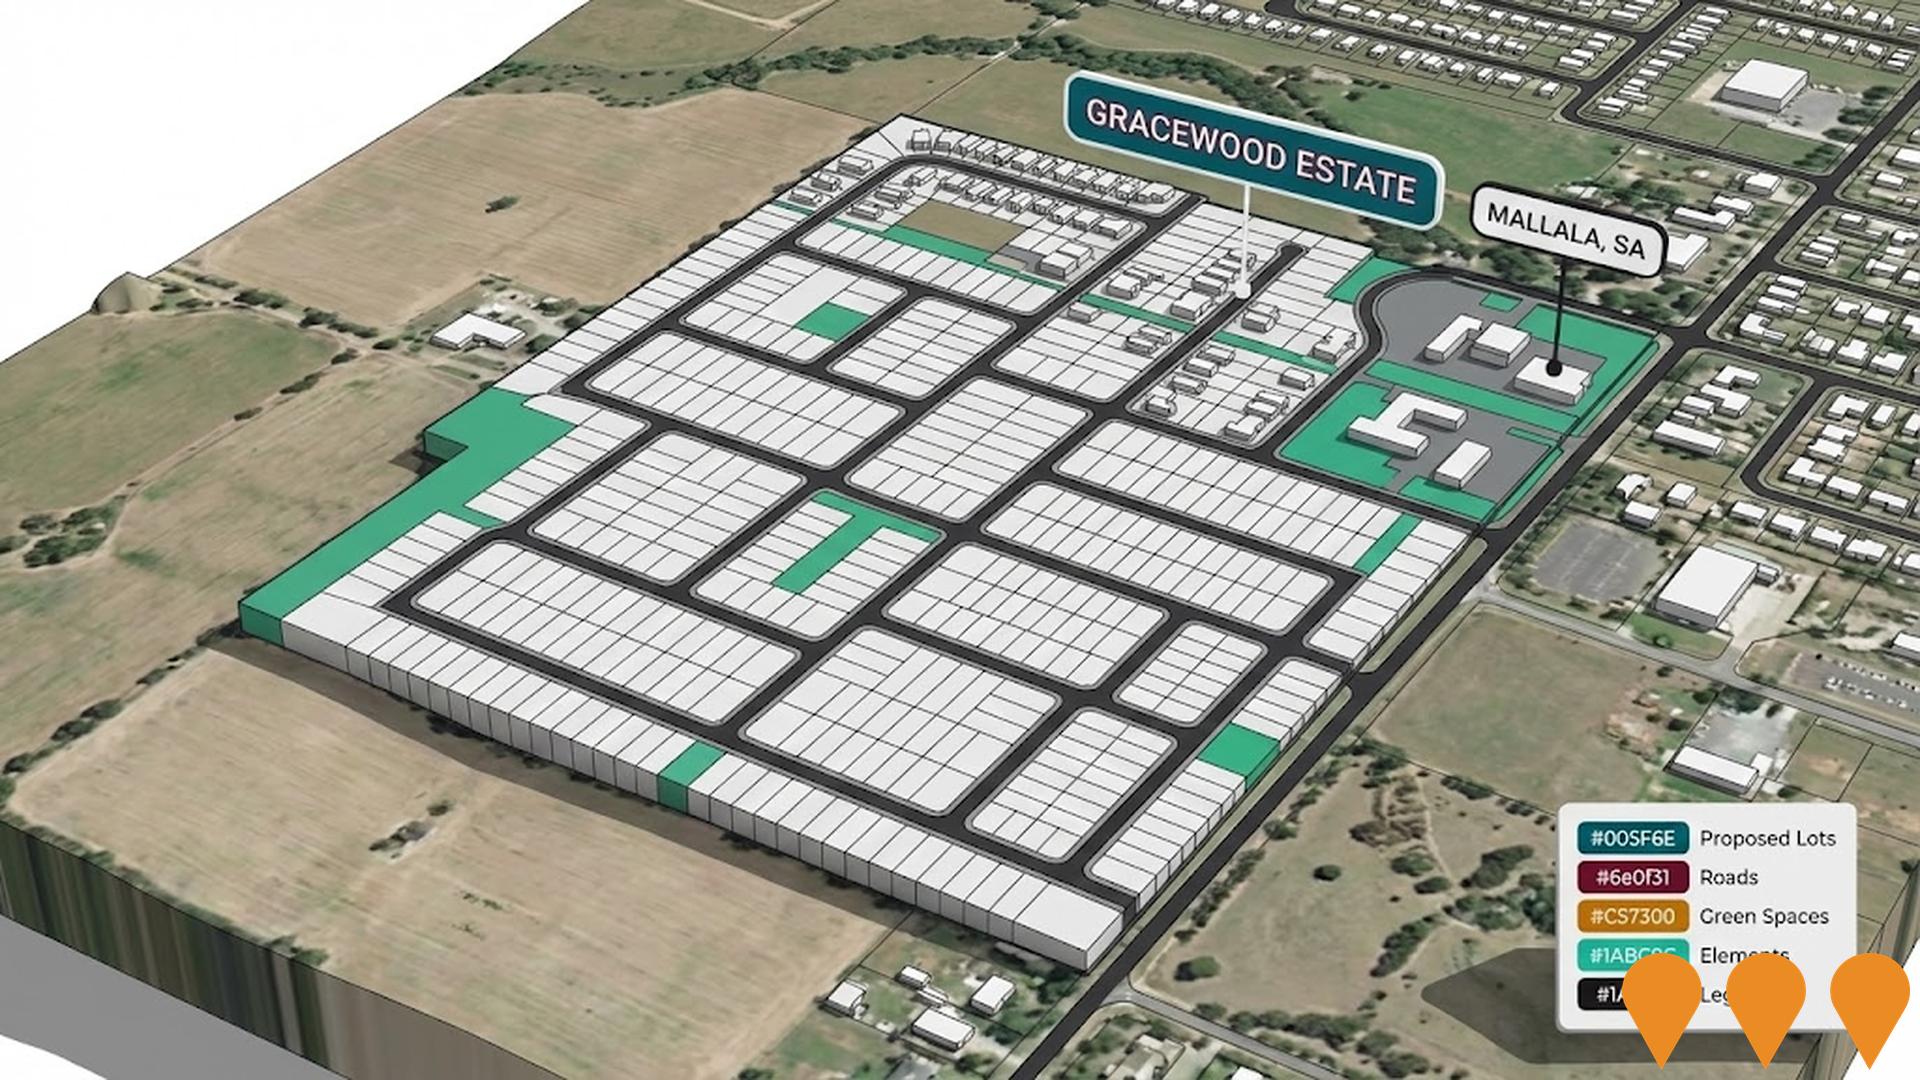
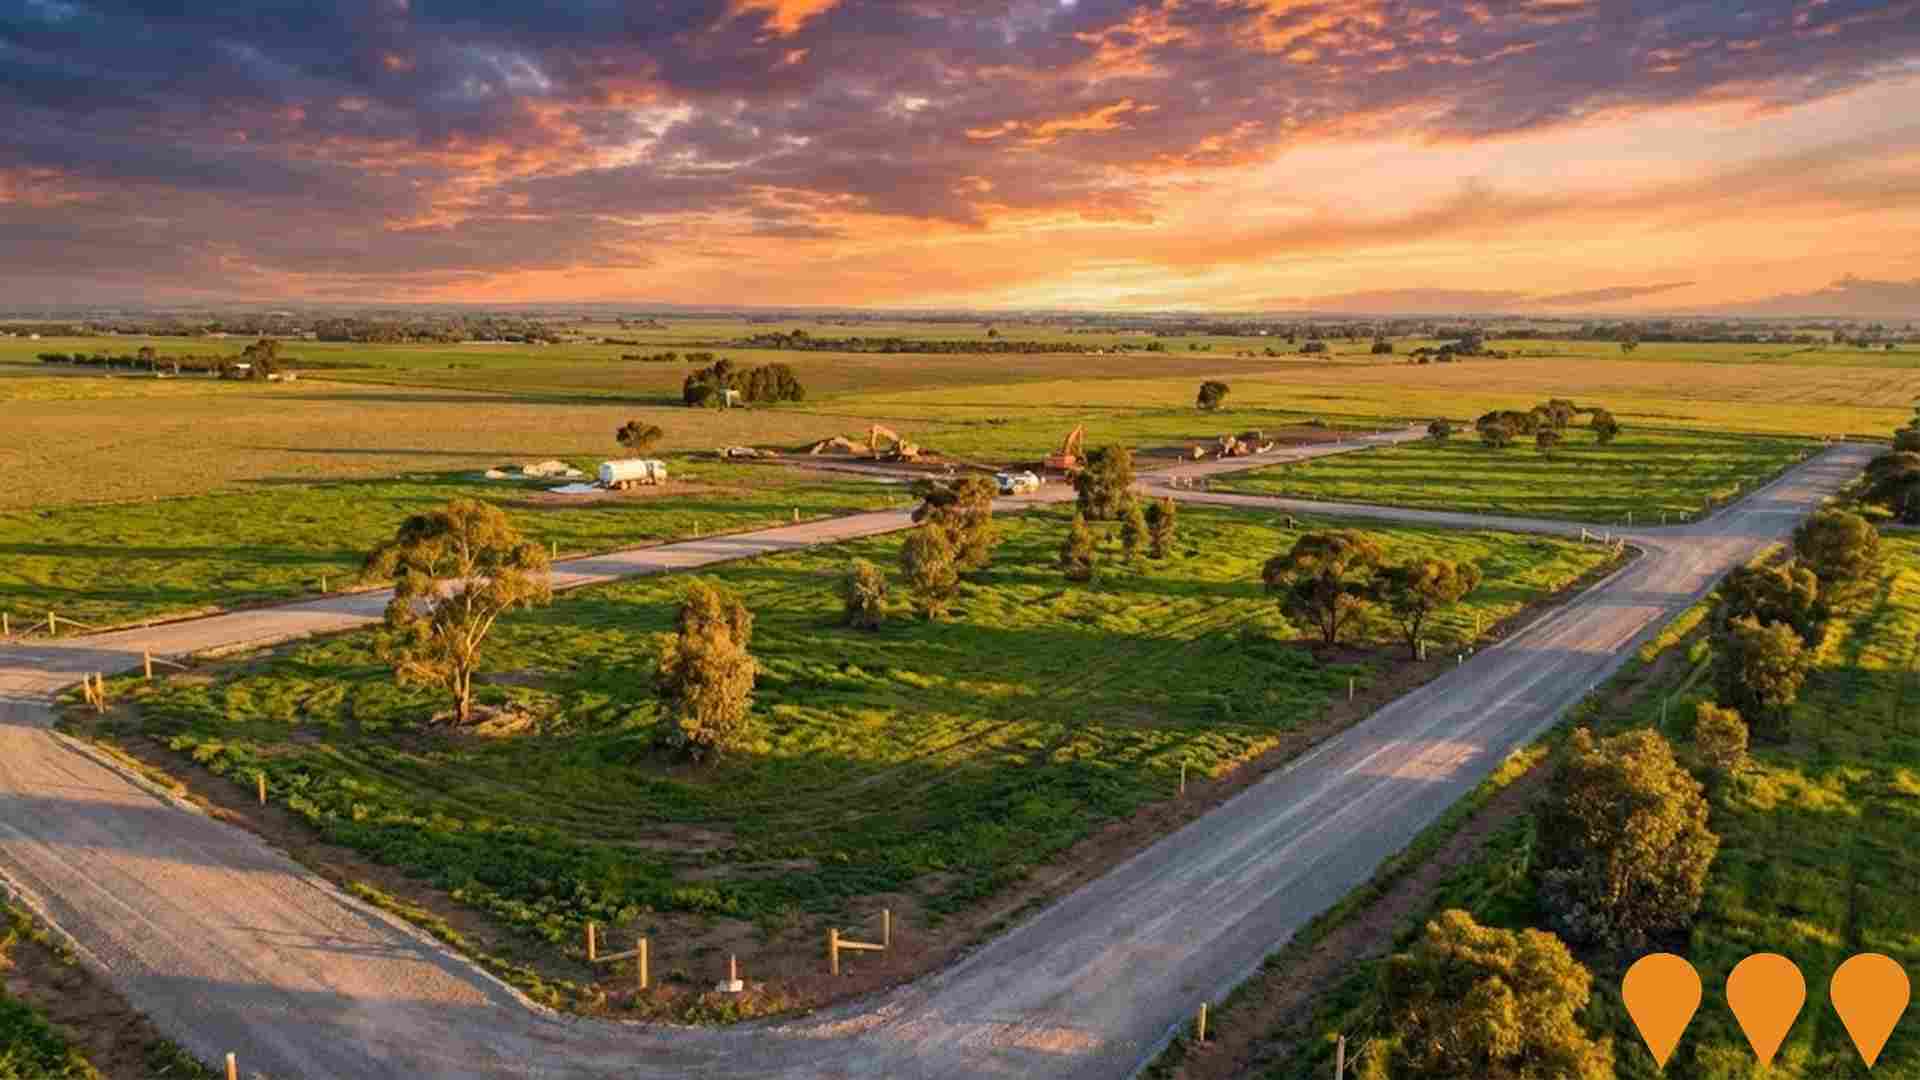
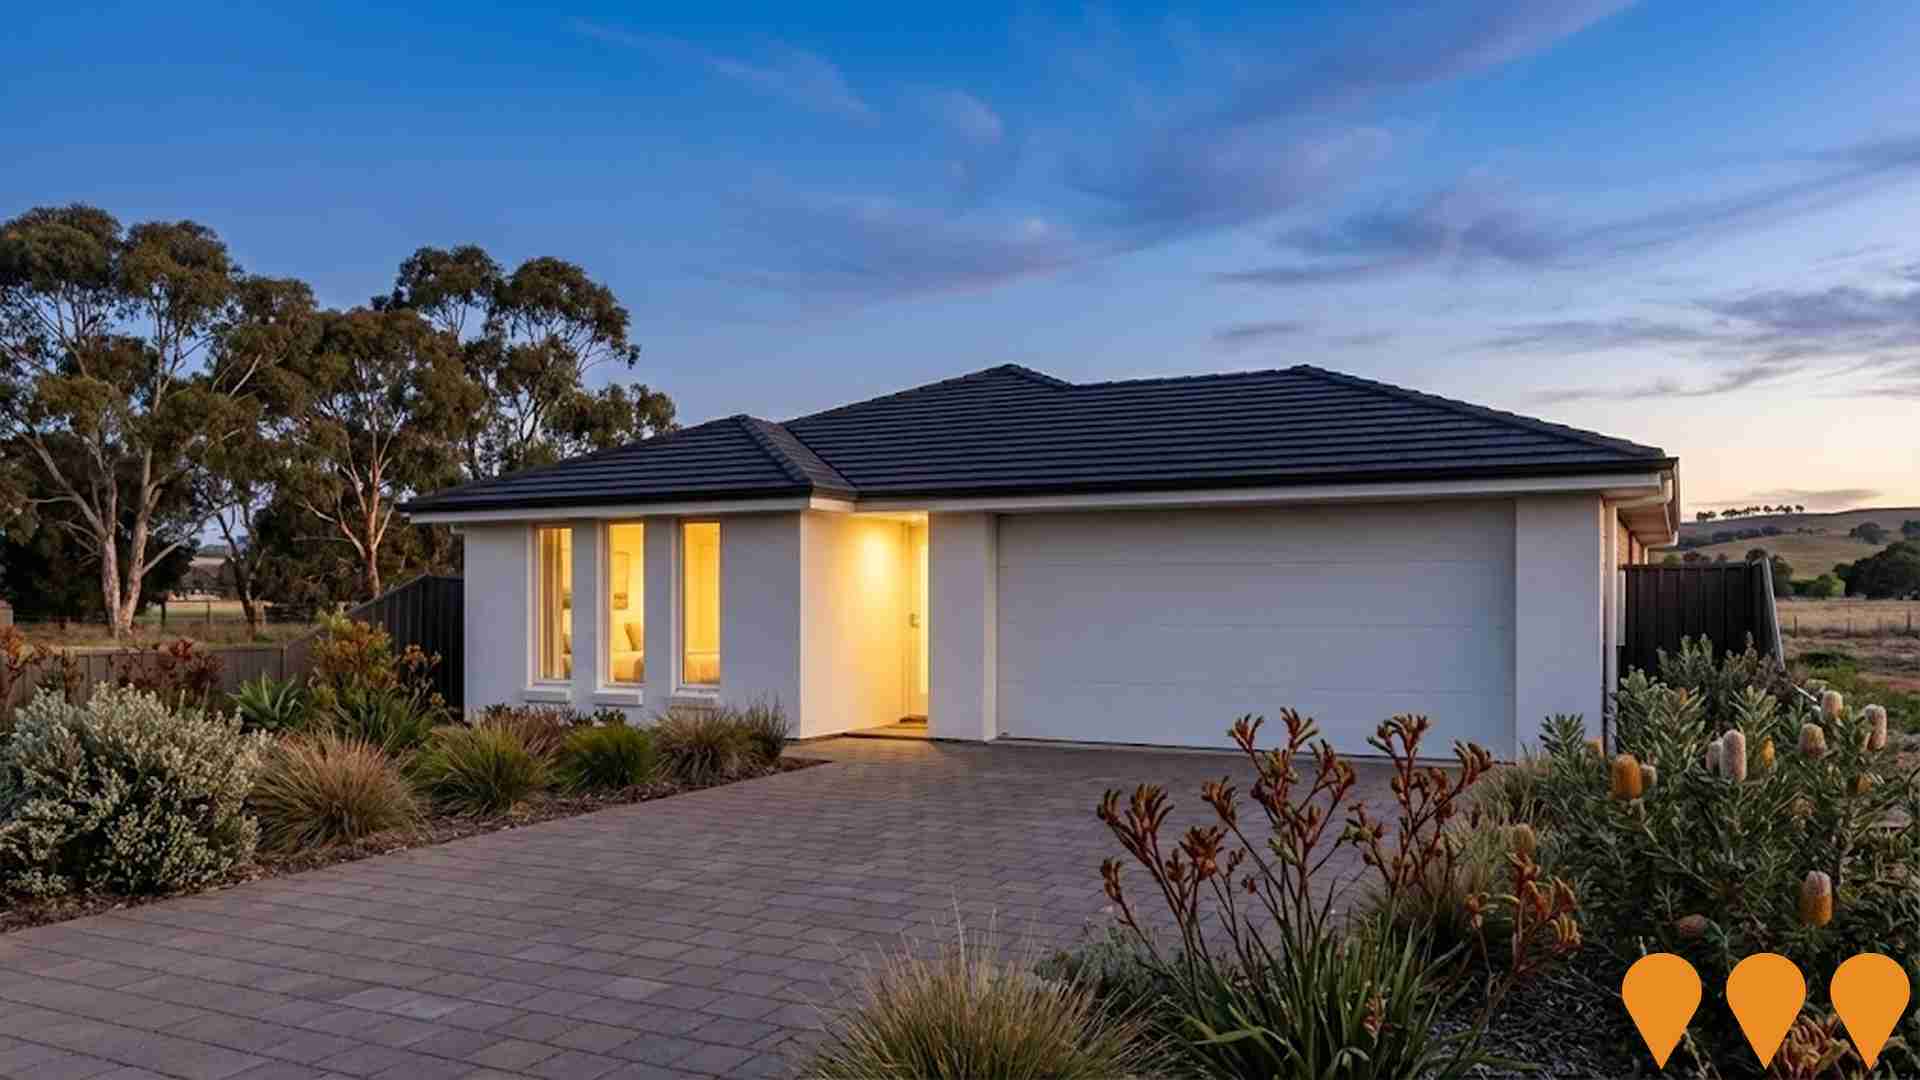
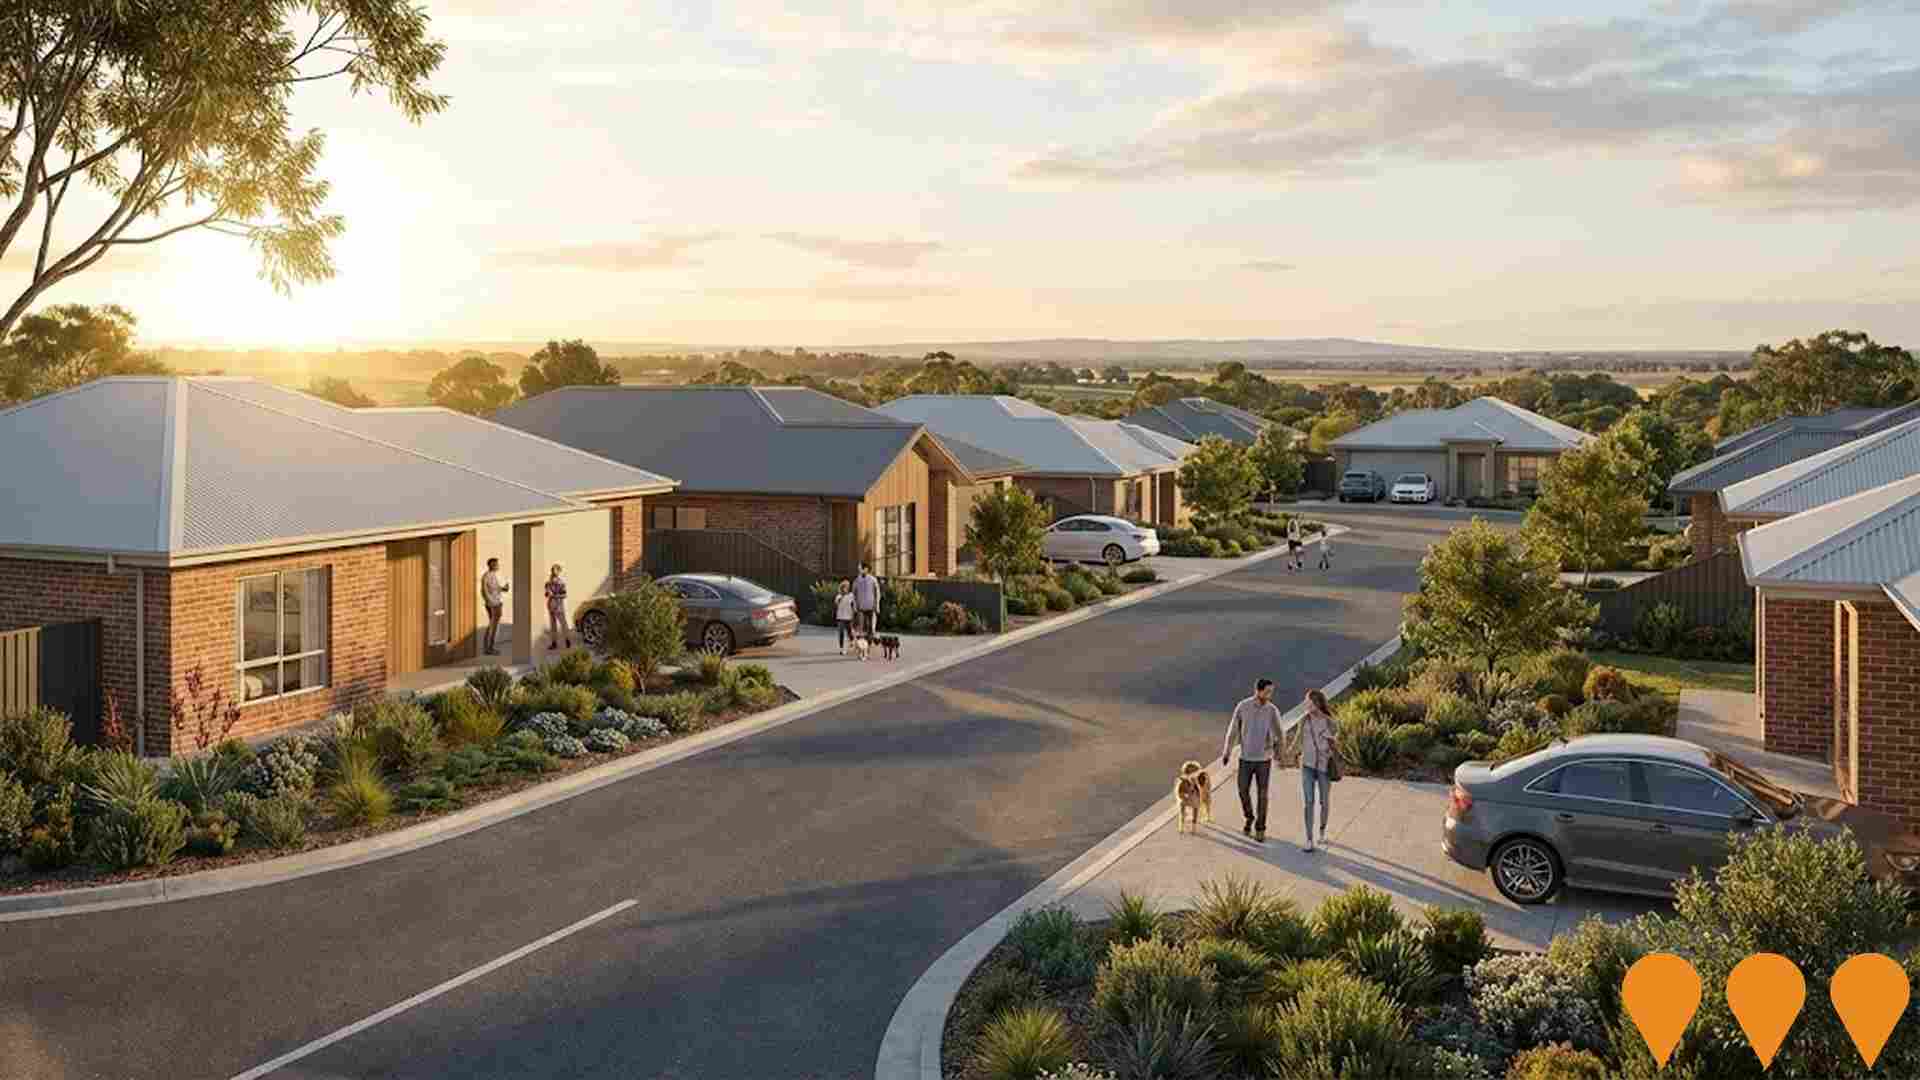
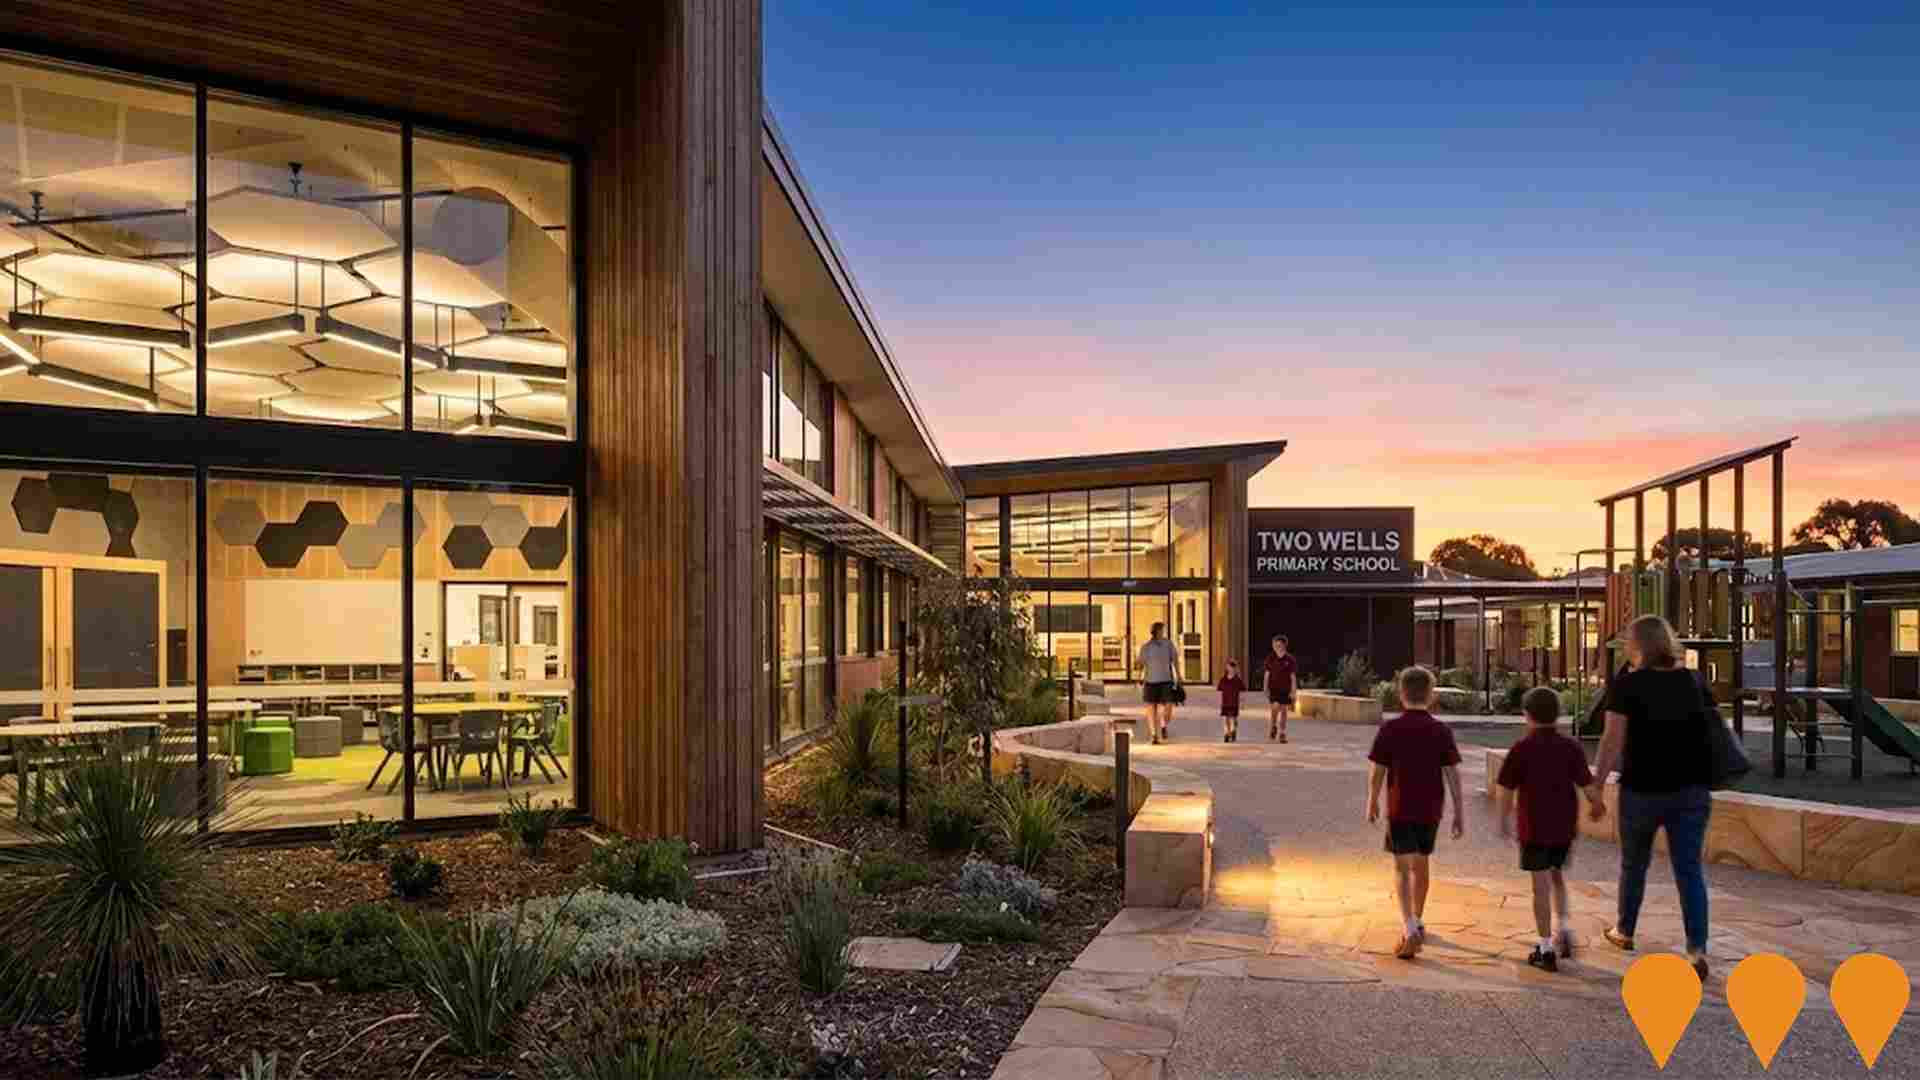
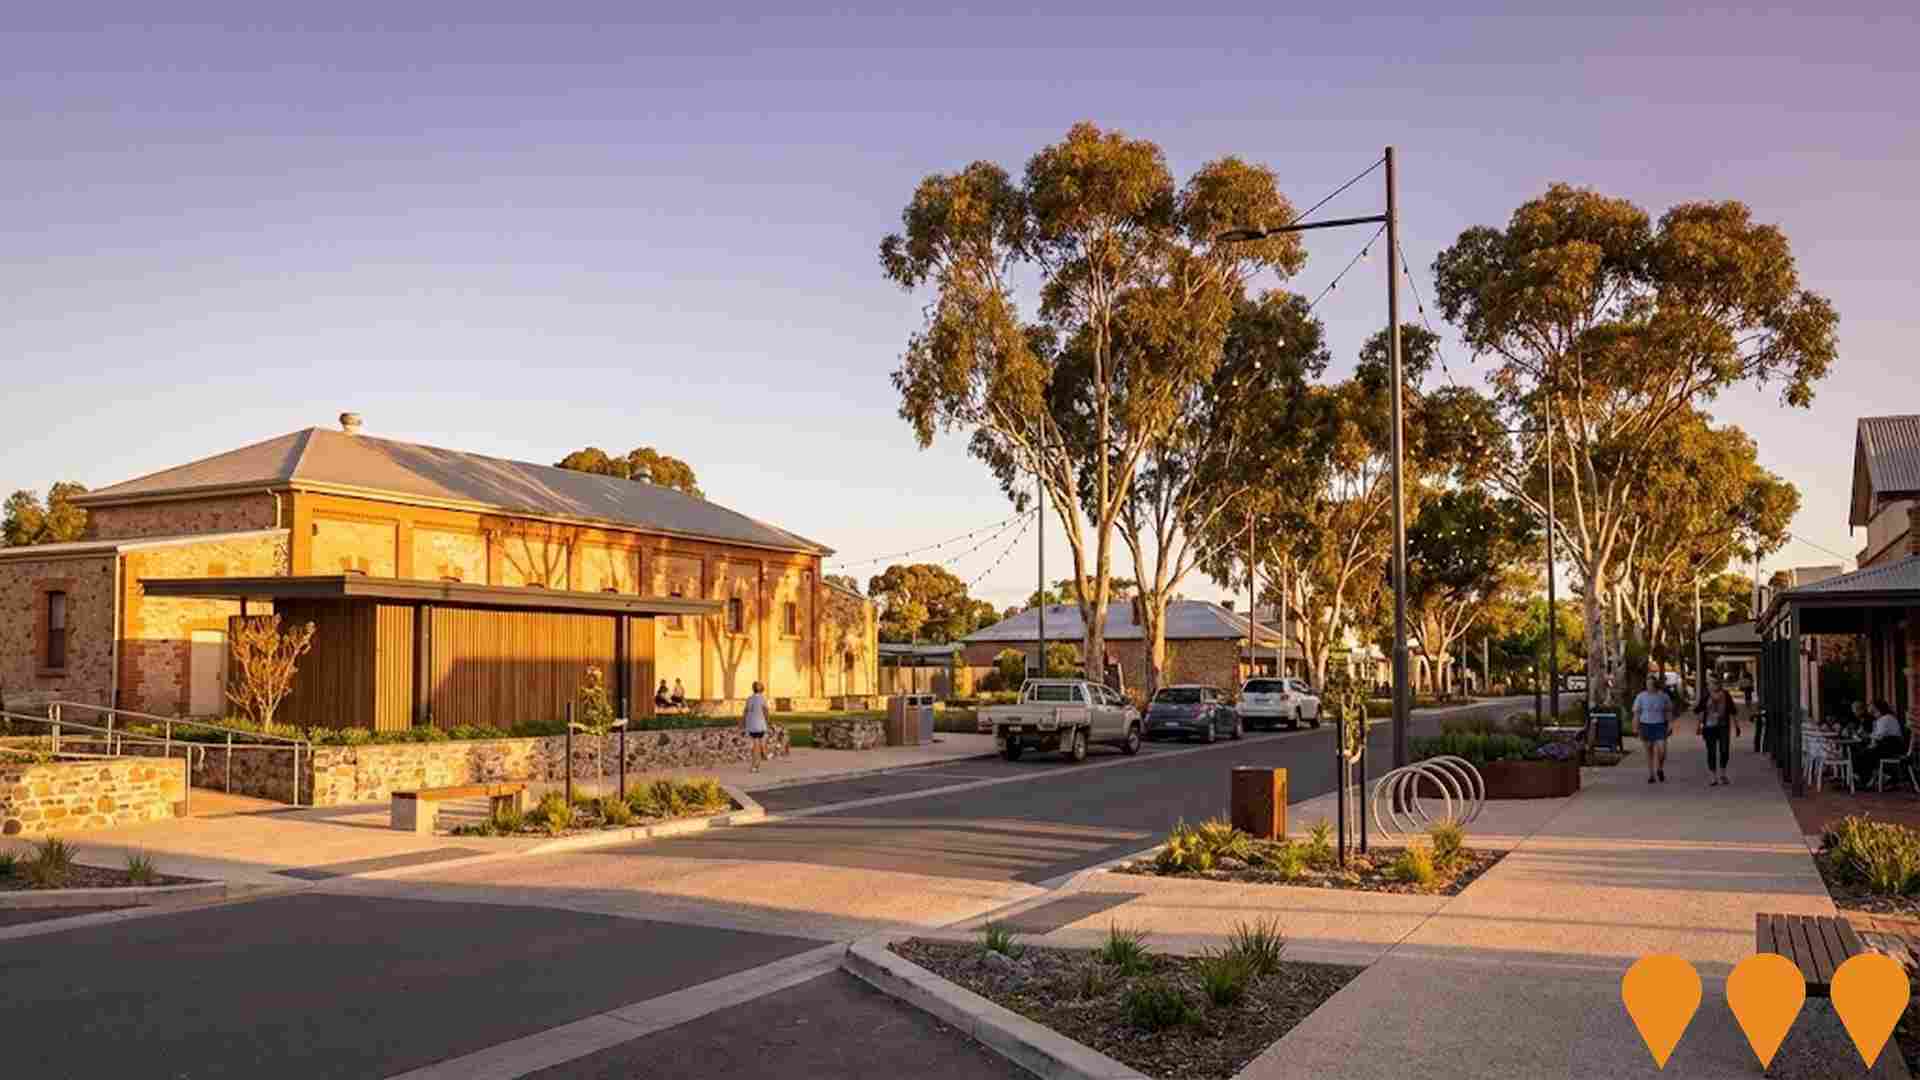
Changes to local infrastructure significantly impact an area's performance. AreaSearch has identified 15 projects likely affecting the region. Notable initiatives include Gracewood Estate, Eden Two Wells, Liberty Two Wells, and Grevillea Grove. The following details projects expected to have the most relevance.
Professional plan users can use the search below to filter and access additional projects.
INFRASTRUCTURE SEARCH
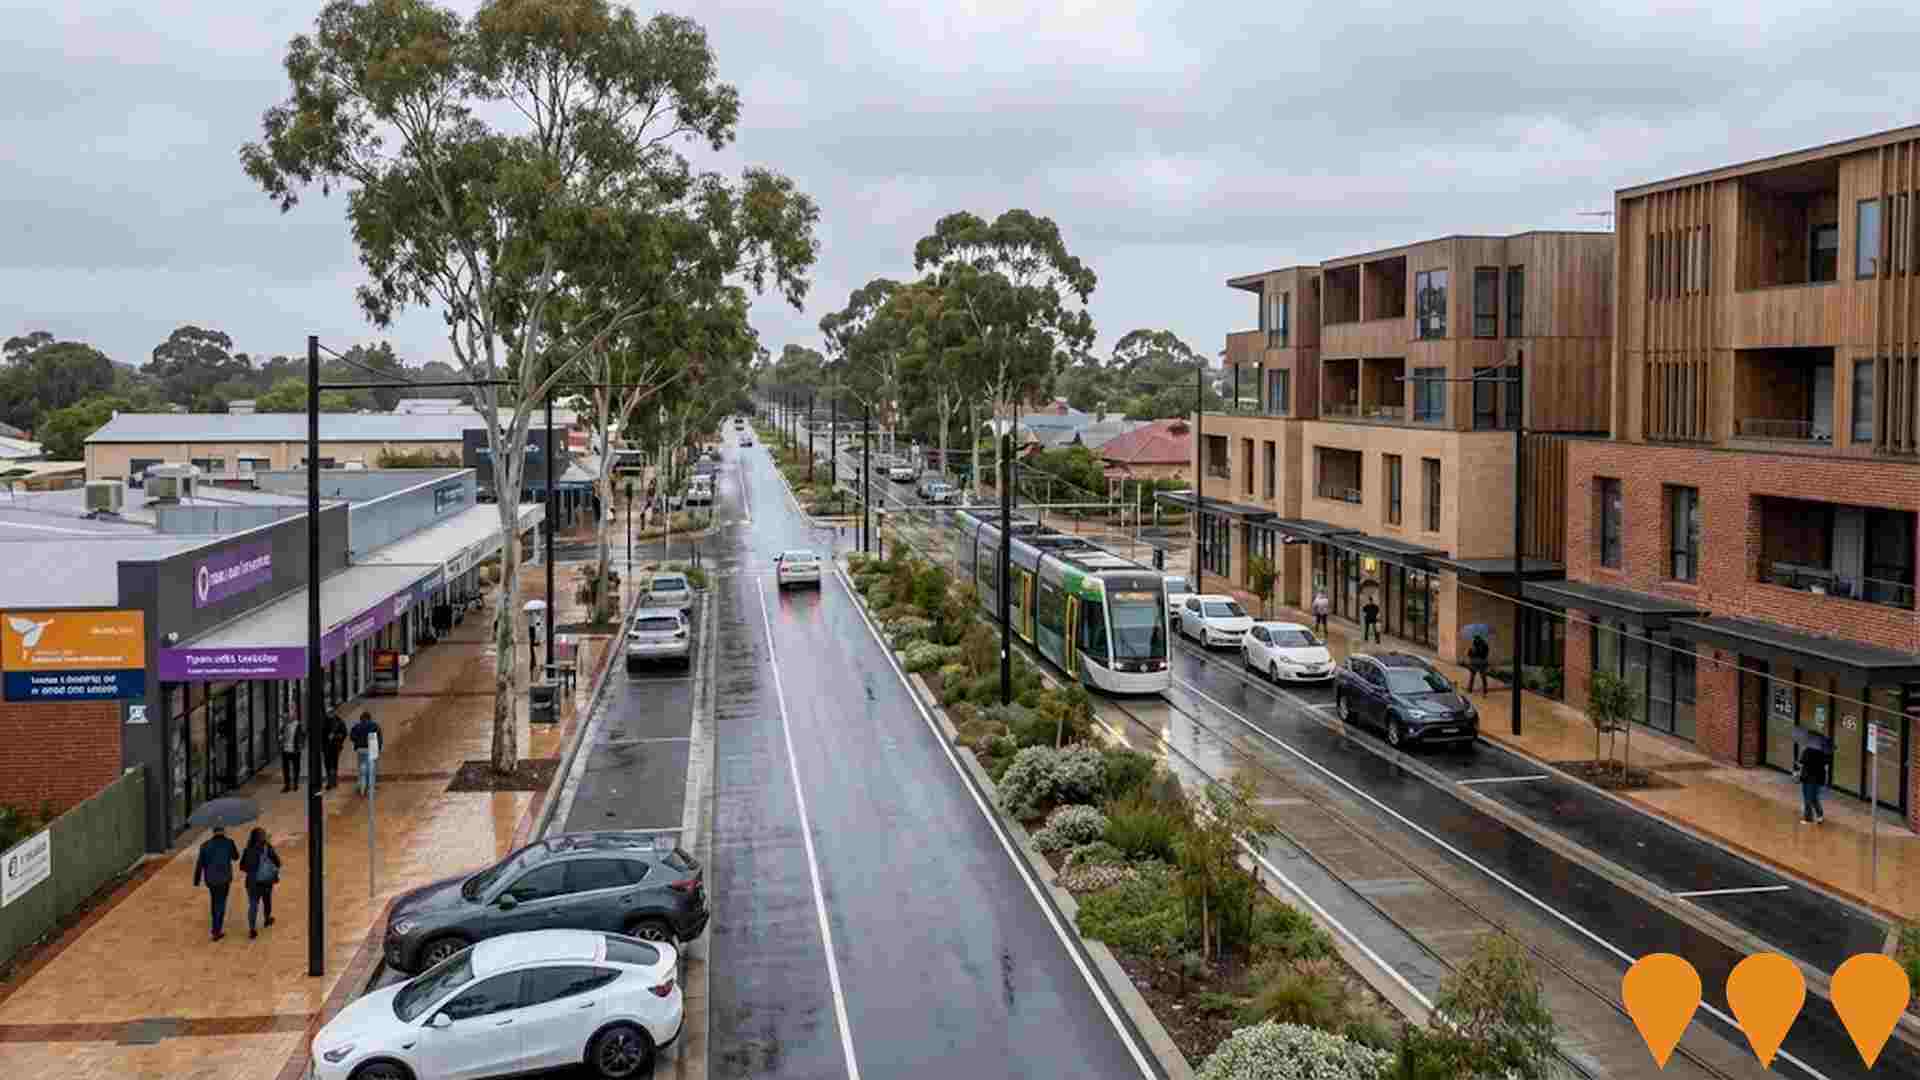
 Denotes AI-based impression for illustrative purposes only, not to be taken as definitive under any circumstances. Please follow links and conduct other investigations from the project's source for actual imagery. Developers and project owners wishing us to use original imagery please Contact Us and we will do so.
Frequently Asked Questions - Infrastructure
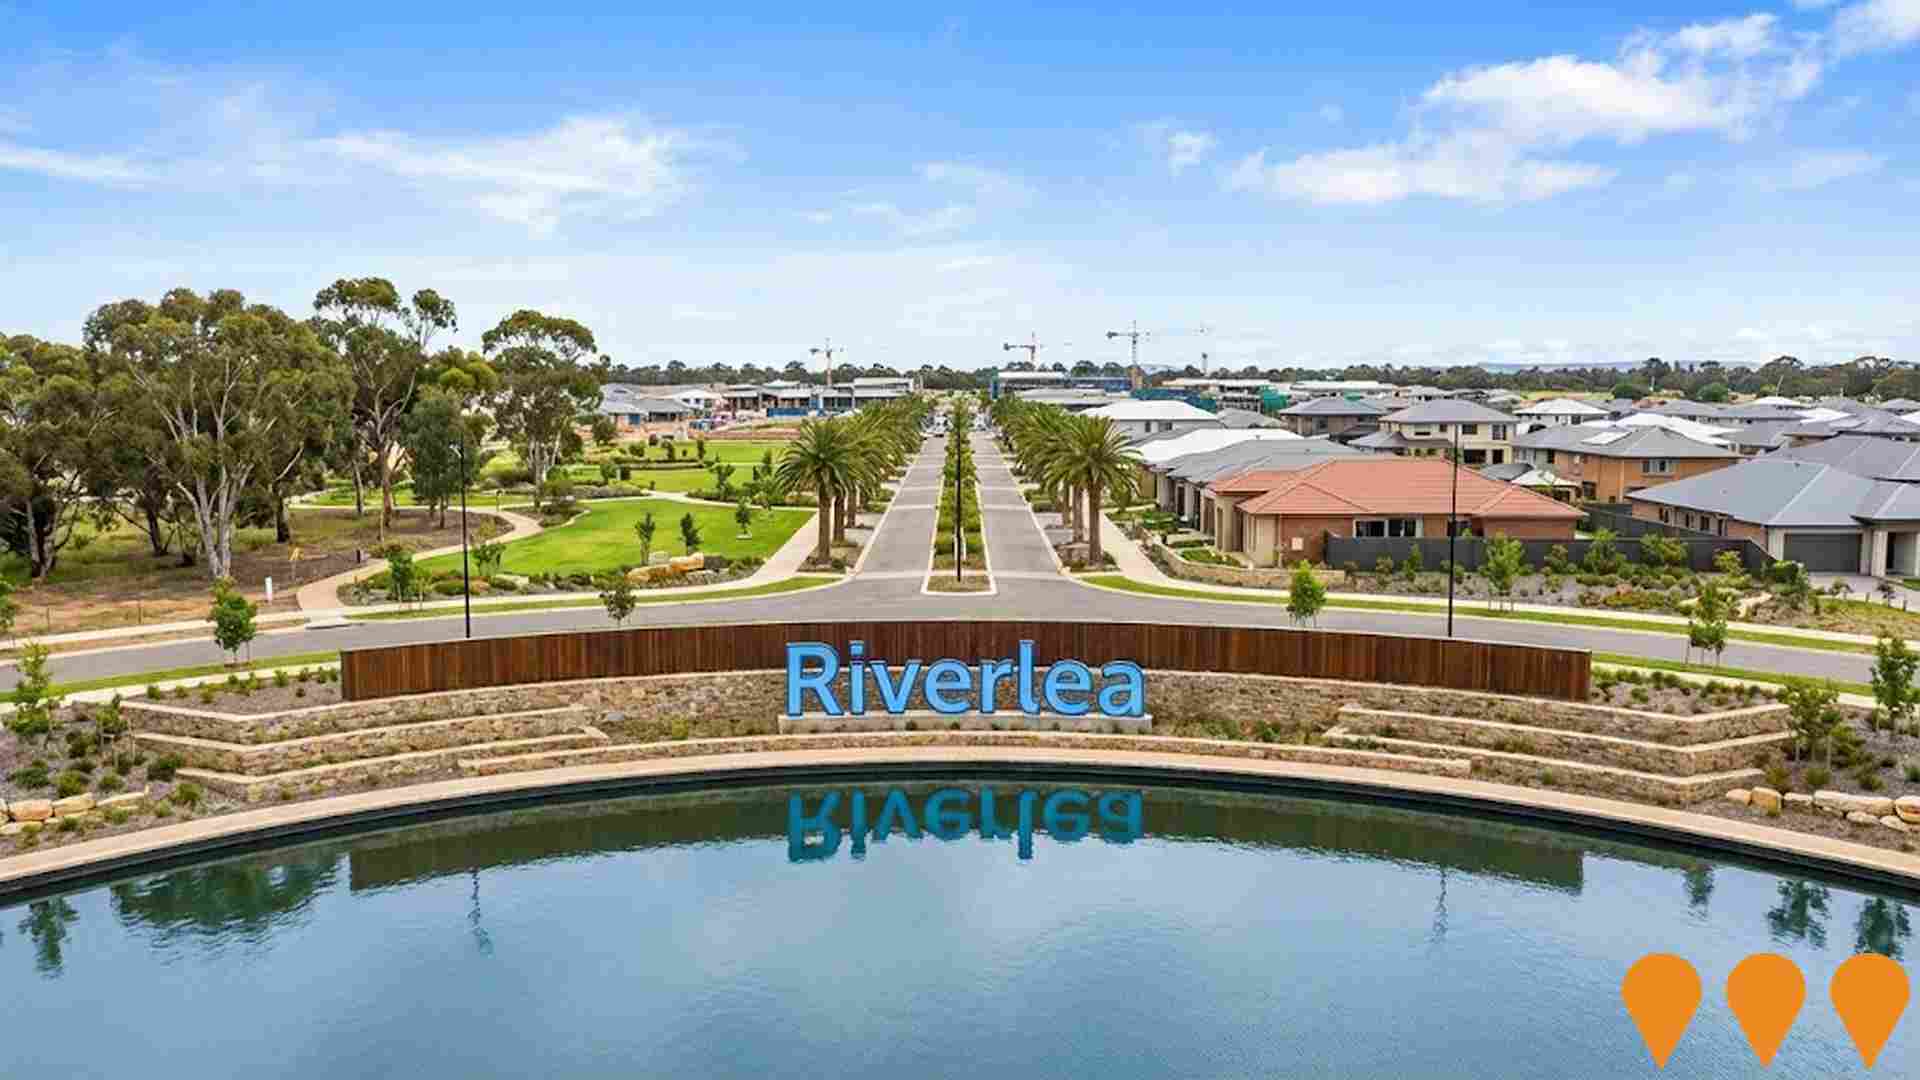
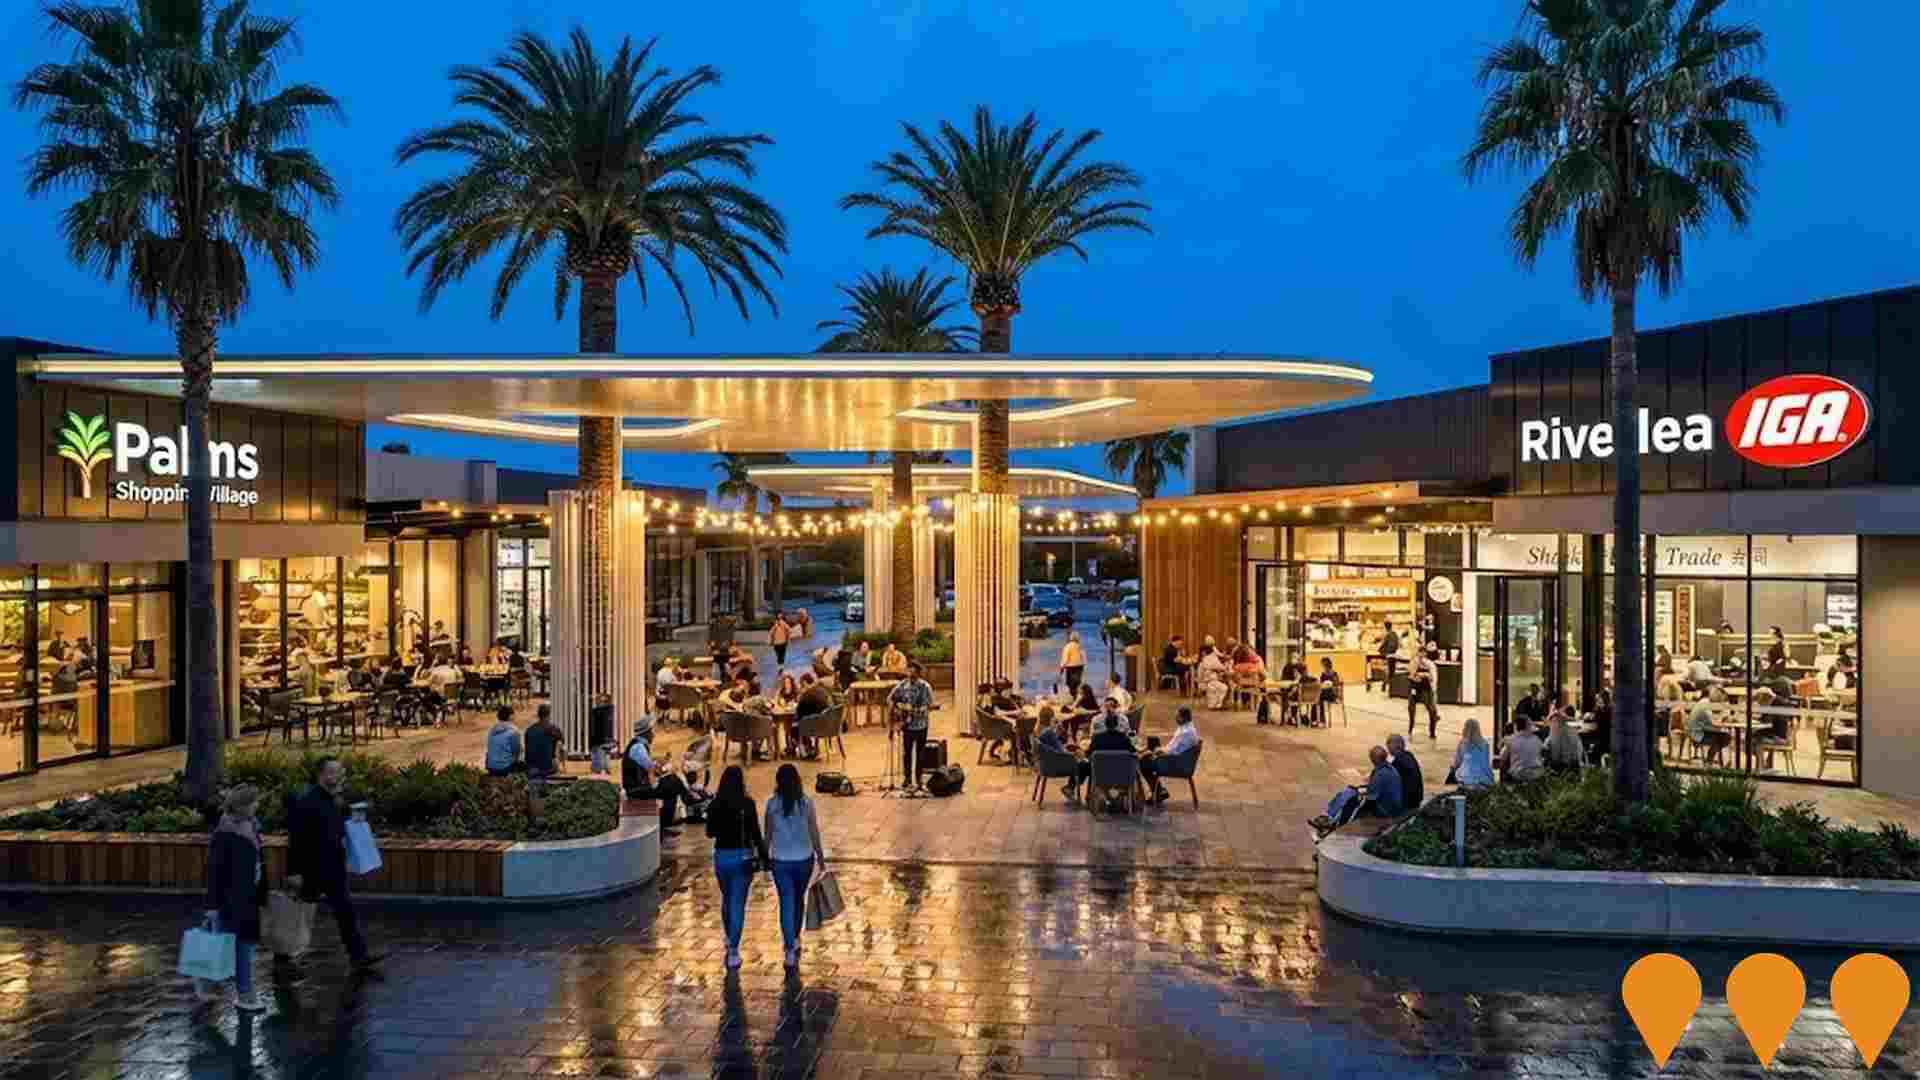
Riverlea Estate (Buckland Park Township)
South Australia's largest master-planned community, spanning over 1,300ha. The project is planned to deliver 12,000 homes and house over 40,000 people over the next 20 years. It will include a town centre, the $80M Palms Shopping Village, schools, community facilities, parks, lakes, and over 450ha of open space, aiming to create 10,000 jobs. Construction is underway with various stages in progress and some completed.
Northern Connector
Six-lane, 15.5 kilometre motorway providing vital freight and commuter link between Northern Expressway, South Road Superway and Port River Expressway. South Australia's first major concrete motorway and widest in the country. Includes 16 kilometres of shared cyclist and pedestrian paths connecting to Stuart O'Grady Bikeway. Features four major interchanges, intelligent transport systems, wetland restoration and Indigenous-inspired design elements. Opened March 7, 2020.

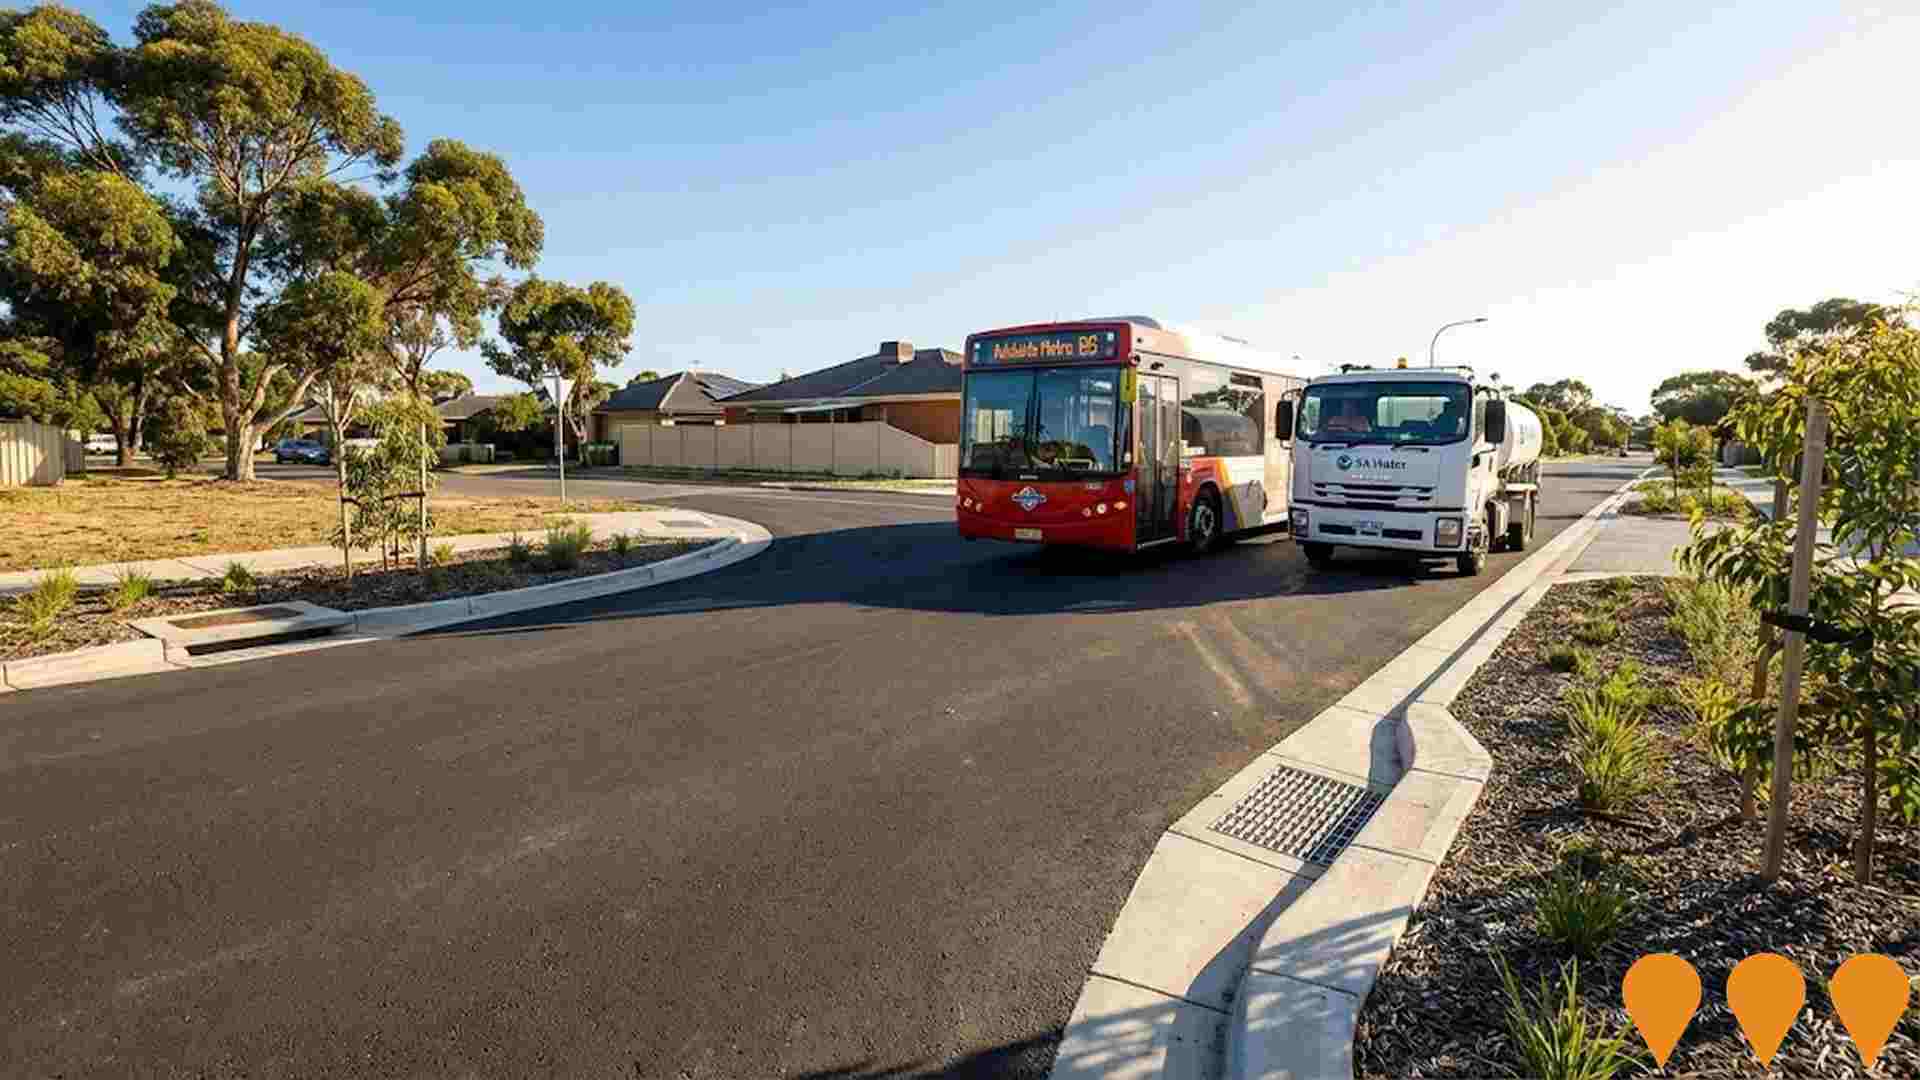
Angle Vale Water and Sewer Infrastructure
SA Water project to deliver permanent trunk water and sewer infrastructure to the Angle Vale / Riverlea growth area in Adelaide's north. Works include approximately 5.2 km of water mains and 0.8 km of sewer mains, pumping stations and rising mains to replace interim tankering arrangements and enable thousands of new homes.
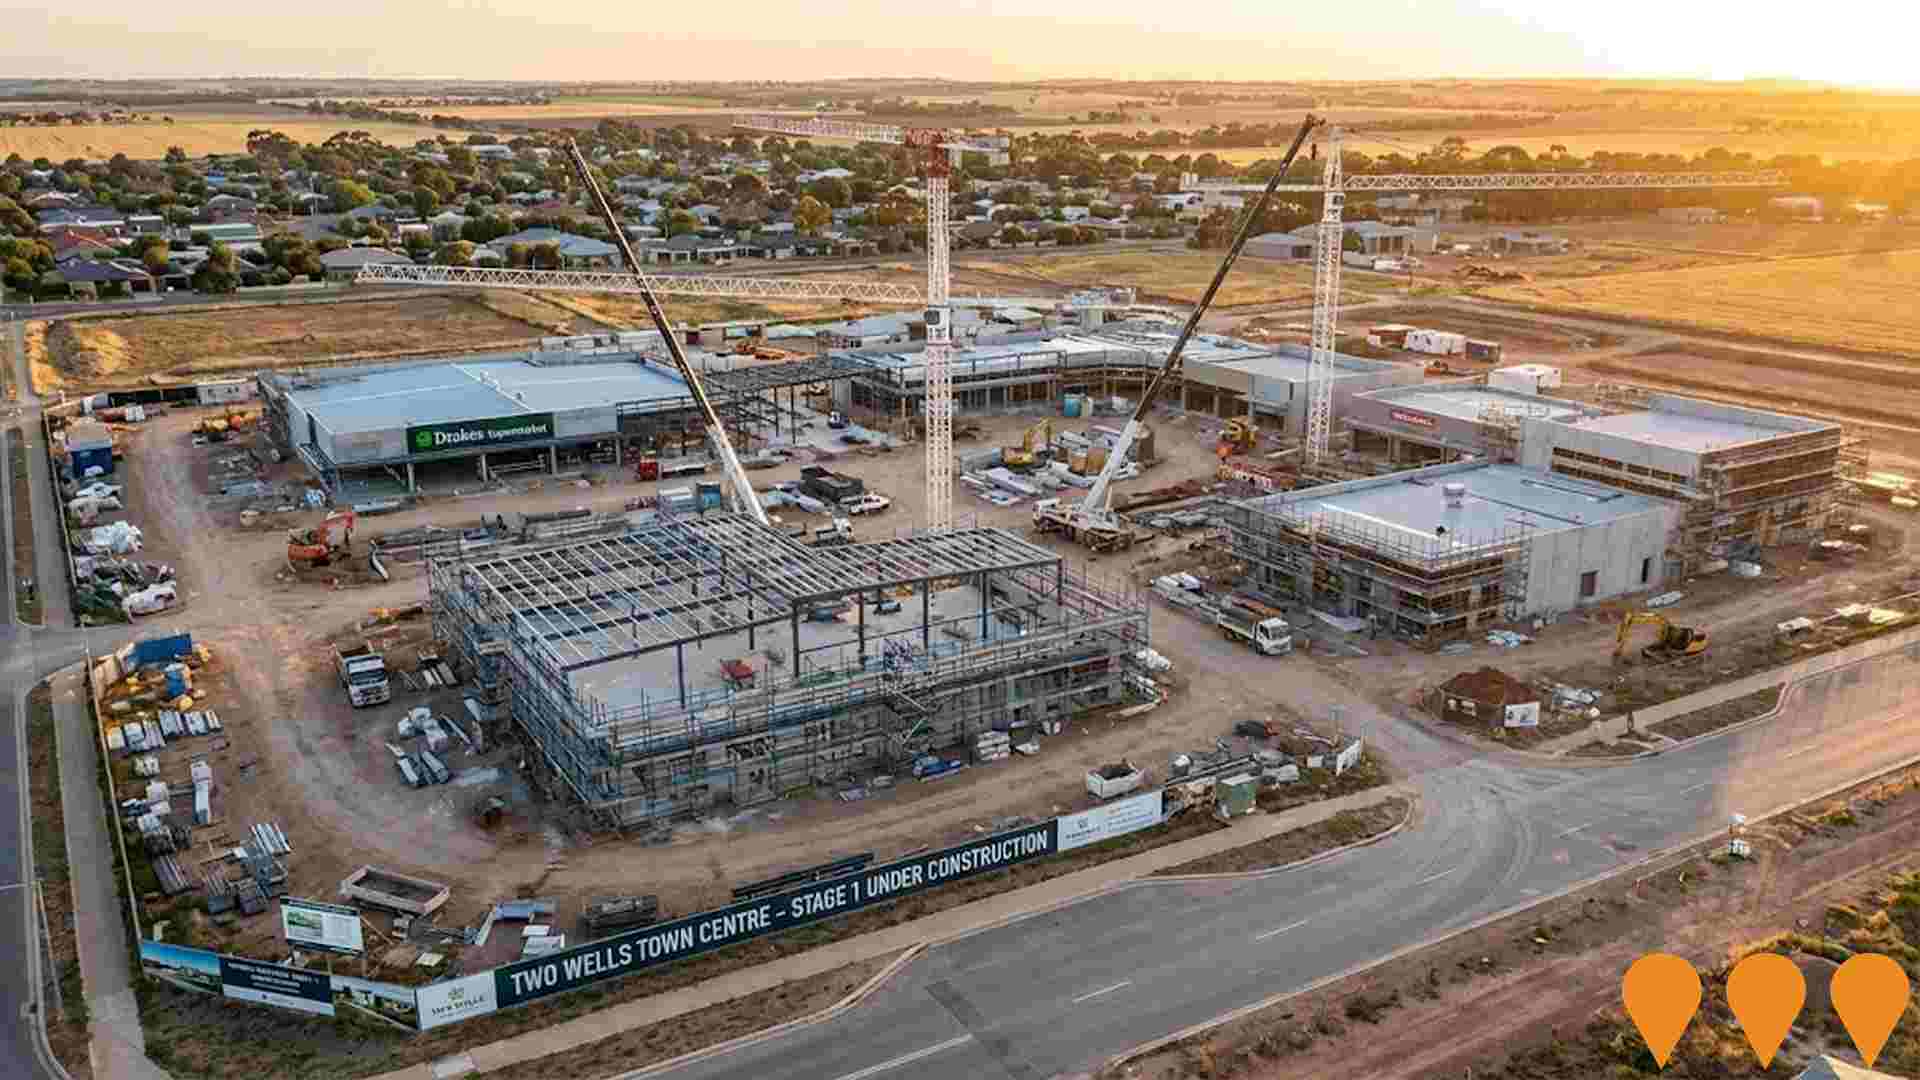
Two Wells Town Centre
A $150 million mixed-use town centre development by Leyton Property on an 8-ha site fronting Old Port Wakefield Road, Two Wells. Stage 1 (Drakes supermarket 3,500 sqm, specialty shops, medical centre, childcare, community facility and 400+ car parks) commenced construction in November 2025 following development approval in March 2025. Future stages will deliver main-street mixed-use retail, commercial and potential residential outcomes enabled by an approved Code Amendment. Staged completion expected 2026-2029.
Palms Shopping Village Riverlea
First retail center for Riverlea community featuring supermarkets, specialty stores, and community services. Part of the broader Riverlea masterplan development.
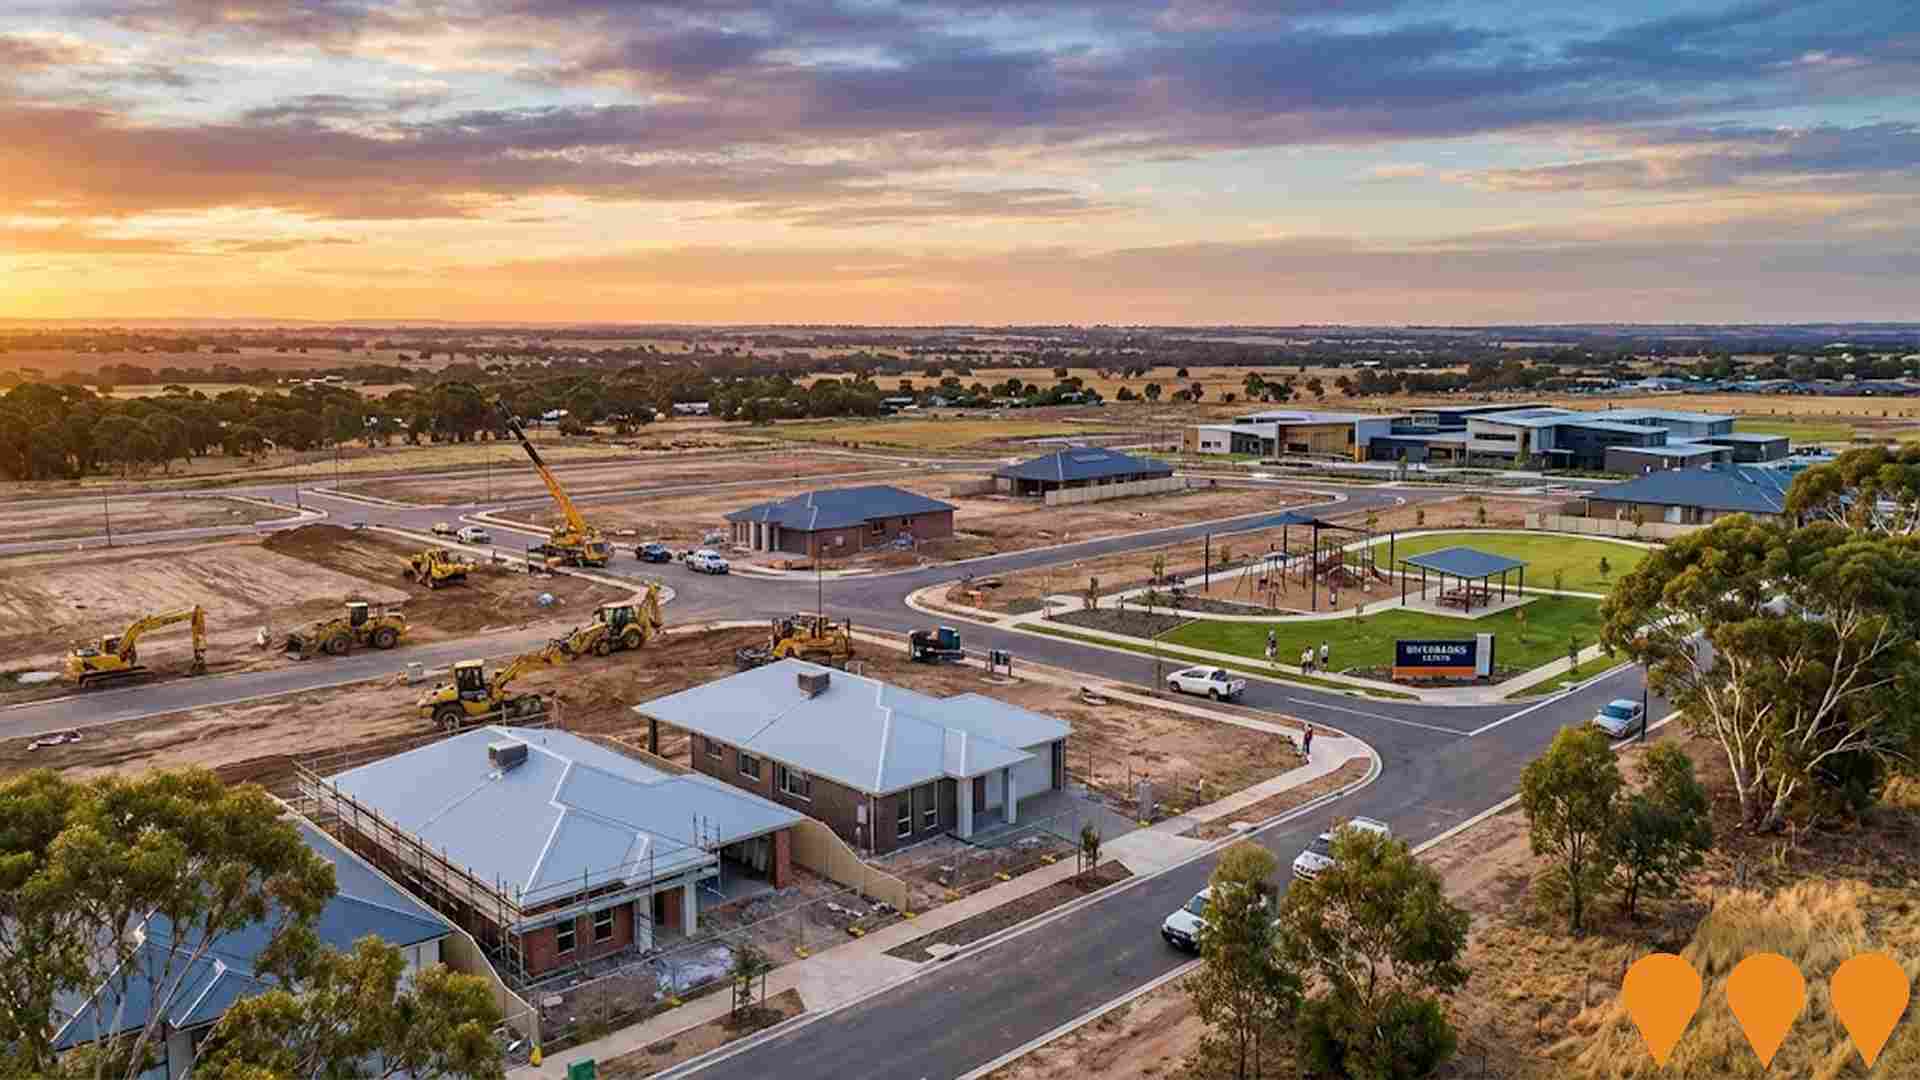
Riverbanks Estate, Angle Vale
Riverbanks is a large master planned house and land community in Angle Vale East, delivering more than 2,000 new homes, parks and open space within walking distance of Riverbanks College B-12 and the Angle Vale town centre. The estate is being delivered in stages with land now selling and civil and housing construction underway.
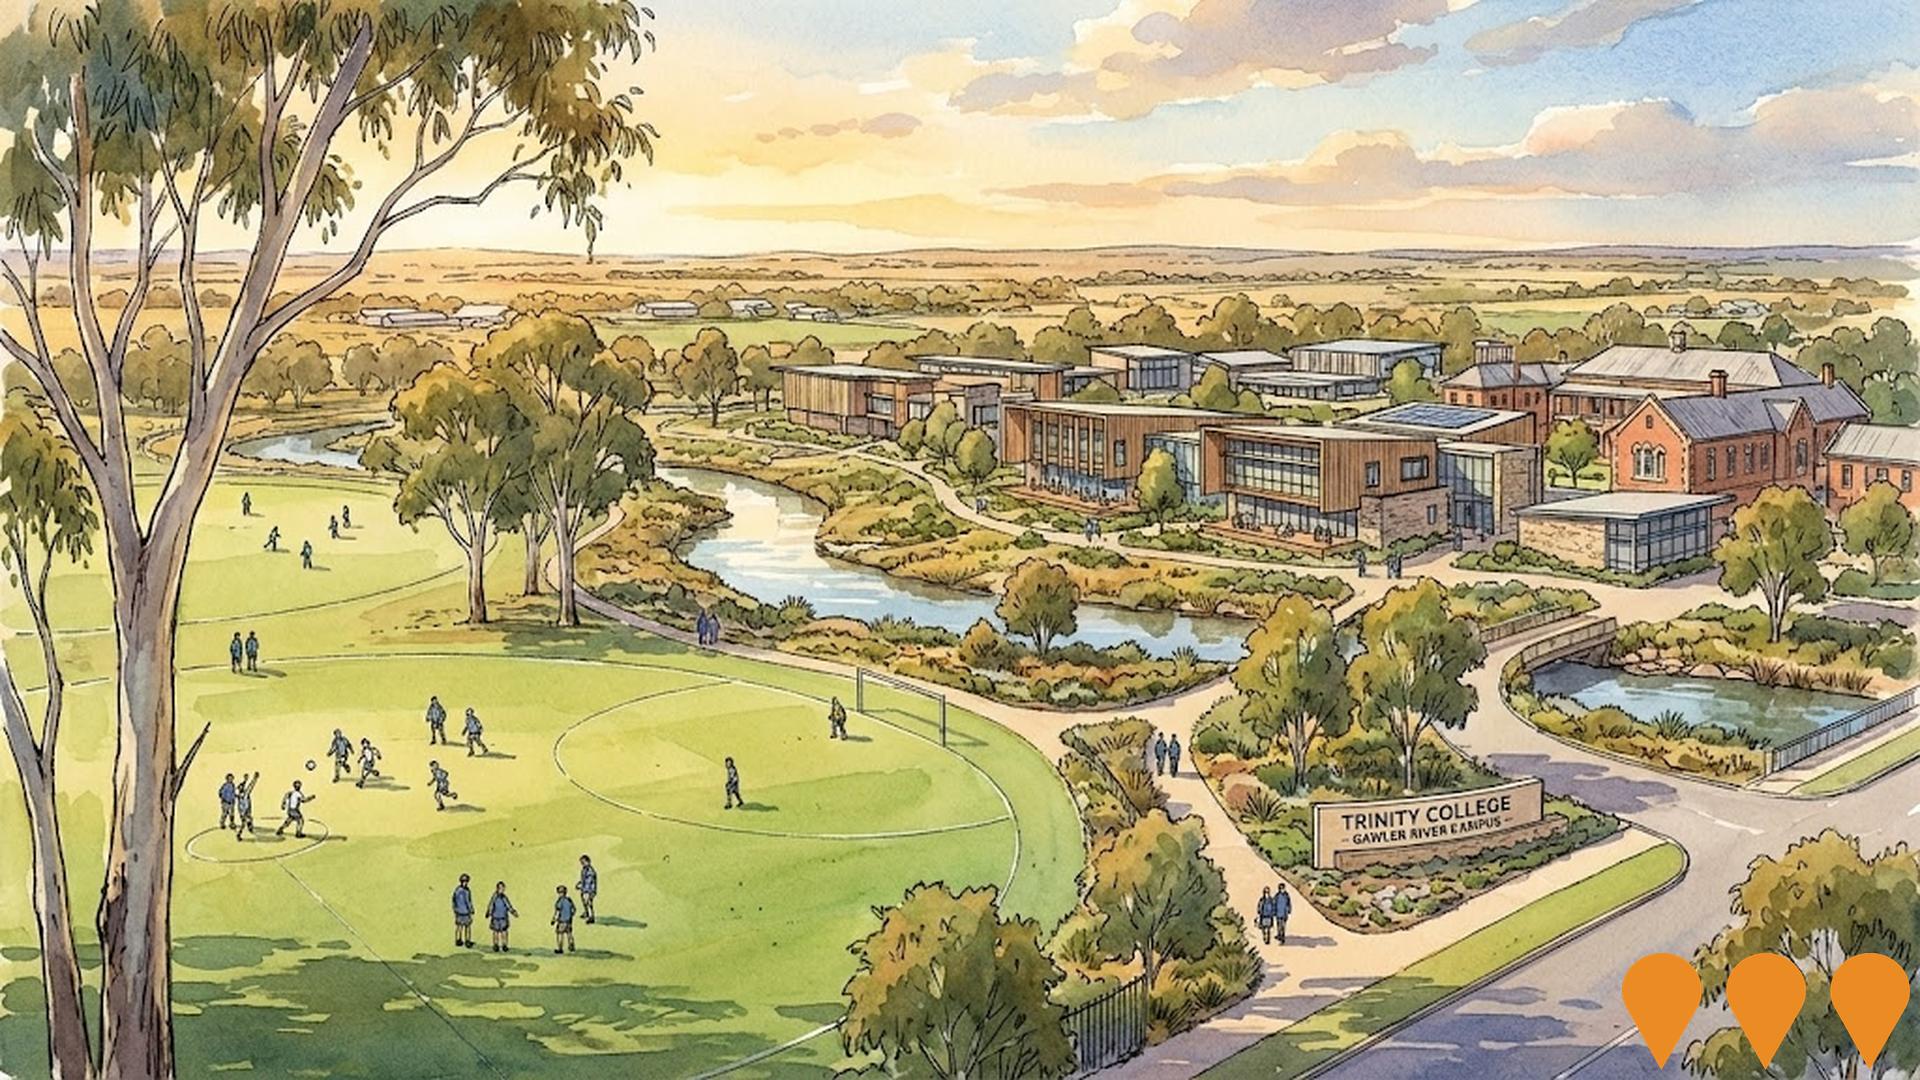
Trinity College Gawler River / Angle Vale Campus
Planning for the long term role of Trinity College's Gawler River campus in Angle Vale as a major northern education hub supporting the Riverbanks and Angle Vale growth areas, building on its existing Reception to Year 10 facilities and extensive grounds.
Virginia Township Expansion
Expansion of Virginia township with Playford Growth Area Structure Plan proposing up to 580 hectares to the north, west and south of existing township for development. Located in Northern Adelaide Plains positioned for intensive food production.
Employment
AreaSearch analysis reveals Mallala recording weaker employment conditions than most comparable areas nationwide
Mallala has a balanced workforce with both white and blue collar jobs, diverse sector representation, an unemployment rate of 5.2%, and stable employment over the past year. As of September 2025, 1765 residents are employed, with an unemployment rate 0.1% lower than Rest of SA's 5.3%.
Workforce participation is 57.6%, close to Rest of SA's 54.1%. Key employment sectors include agriculture, construction, and health care & social assistance. Notably, transport, postal & warehousing has high employment levels at 2.3 times the regional average. However, health care & social assistance has limited presence with 9.7% compared to 13.9% regionally.
The area may have limited local job opportunities, as indicated by Census data. Over a year (ending Sep-25), employment increased by 0.4%, labour force by 2.1%, leading to unemployment rise of 1.6 percentage points. In contrast, Rest of SA saw employment rise by 0.3%, labour force grow by 2.3%, and unemployment increase by 1.9 percentage points. National employment forecasts from Jobs and Skills Australia (May-25) project national growth at 6.6% over five years and 13.7% over ten years, with varying sector-specific rates. Applying these projections to Mallala's employment mix suggests local employment should increase by 5.1% over five years and 11.2% over ten years.
Frequently Asked Questions - Employment
Income
Income levels sit below national averages according to AreaSearch assessment
The Mallala SA2 had a median taxpayer income of $50,549 and an average income of $60,096 in the financial year 2022, according to postcode level ATO data aggregated by AreaSearch. This was lower than national averages, with Rest of SA's median income being $46,889 and average income being $56,582 during the same period. By September 2025, estimated incomes would be approximately $57,034 (median) and $67,806 (average), based on a 12.83% growth in wages since financial year 2022. In Mallala, household, family, and personal incomes ranked modestly between the 25th and 75th percentiles as per the 2021 Census data. The predominant income cohort comprised 32.6% of locals (1,167 people), falling within the $1,500 - $2,999 category, similar to surrounding regions where 27.5% occupied this bracket. Housing costs were manageable with 88.4% retained, but disposable income was below average at the 32nd percentile.
Frequently Asked Questions - Income
Housing
Mallala is characterized by a predominantly suburban housing profile, with above-average rates of outright home ownership
Mallala's dwelling structure, as per the latest Census, consisted of 96.0% houses and 4.0% other dwellings (semi-detached, apartments, 'other' dwellings). This compares to Non-Metro SA's 94.6% houses and 5.4% other dwellings. Home ownership in Mallala was 40.2%, similar to Non-Metro SA. Dwellings were either mortgaged (44.2%) or rented (15.6%). The median monthly mortgage repayment was $1,150, below the Non-Metro SA average of $1,400 and the national average of $1,863. The median weekly rent in Mallala was $265, lower than Non-Metro SA's $285 and the national figure of $375.
Frequently Asked Questions - Housing
Household Composition
Mallala features high concentrations of group households, with a fairly typical median household size
Family households constitute 67.9% of all households, including 28.7% couples with children, 28.8% couples without children, and 9.5% single parent families. Non-family households account for the remaining 32.1%, with lone person households at 26.8% and group households comprising 5.3%. The median household size is 2.5 people, which aligns with the average in the Rest of South Africa.
Frequently Asked Questions - Households
Local Schools & Education
Mallala faces educational challenges, with performance metrics placing it in the bottom quartile of areas assessed nationally
The area's university qualification rate is 10.0%, significantly lower than Australia's average of 30.4%. This disparity presents both a challenge and an opportunity for targeted educational initiatives. Bachelor degrees are the most prevalent at 7.4%, followed by postgraduate qualifications (1.4%) and graduate diplomas (1.2%). Vocational credentials are prominent, with 39.9% of residents aged 15+ holding them - advanced diplomas account for 7.4% while certificates make up 32.5%.
Educational participation is high at 29.1%, including 13.4% in primary education, 8.2% in secondary education, and 2.1% pursuing tertiary education.
Frequently Asked Questions - Education
Schools Detail
Nearby Services & Amenities
Transport
No public transport data available for this catchment area.
Frequently Asked Questions - Transport
Transport Stops Detail
Health
Health performance in Mallala is well below average with prevalence of common health conditions notable across both younger and older age cohorts
Health data shows significant issues in Mallala, with common health conditions prevalent across both younger and older age groups. Approximately 50% (~1,772 people) have private health cover, lower than the national average of 55.3%.
The most frequent medical conditions are arthritis (9.5%) and asthma (9.5%). 63.4% report no medical ailments, slightly less than Rest of SA's 64.6%. Mallala has 19.8% residents aged 65 and over (708 people), lower than Rest of SA's 22.8%. Senior health outcomes face challenges but perform better than the general population in health metrics.
Frequently Asked Questions - Health
Cultural Diversity
Mallala ranks below the Australian average when compared to other local markets across a number of language and cultural background related metrics
Mallala's cultural diversity was found to be below average, with 83.8% of its population being Australian citizens, born in Australia (85.0%), and speaking English only at home (93.5%). Christianity is the predominant religion in Mallala, making up 41.4% of its population. Notably, Buddhism is overrepresented in Mallala compared to the rest of South Australia, with 1.4% versus 0.5%.
The top three ancestry groups based on parents' country of birth are Australian (34.8%), English (34.2%), and Scottish (6.5%). Other ethnic groups show notable divergences: Welsh is overrepresented at 0.7% in Mallala compared to the regional average of 0.5%, German at 4.4% versus 14.2%, and Maltese at 0.4% versus 0.2%.
Frequently Asked Questions - Diversity
Age
Mallala's median age exceeds the national pattern
Mallala's median age is 43, which is significantly lower than the Rest of SA average of 47 but substantially higher than the national average of 38. The age profile shows that those aged 15-24 are particularly prominent, making up 12.6% of the population, while those aged 75-84 are comparatively smaller at 6.3%. Between 2021 and present, the percentage of 15 to 24-year-olds has grown from 10.1% to 12.6%, while the 45 to 54 cohort has declined from 13.4% to 12.0% and the 25 to 34 group has dropped from 11.7% to 10.4%. By 2041, Mallala is expected to see notable shifts in its age composition. The 15 to 24 group is projected to grow by 25%, adding 110 people and reaching a total of 560 from the current 449. The 55 to 64 group is expected to display more modest growth, with an addition of only 2 residents.
