Chart Color Schemes
This analysis uses ABS Statistical Areas Level 2 (SA2) boundaries, which can materially differ from Suburbs and Localities (SAL) even when sharing similar names.
SA2 boundaries are defined by the Australian Bureau of Statistics and are designed to represent communities for statistical reporting (e.g., census and ERP).
Suburbs and Localities (SAL) represent commonly-used suburb/locality names (postal-style areas) and may use different geographic boundaries. For comprehensive analysis, consider reviewing both boundary types if available.
est. as @ -- *
ABS ERP | -- people | --
2021 Census | -- people
Sales Activity
Curious about local property values? Filter the chart to assess the volume and appreciation (including resales) trends and regional comparisons, or scroll to the map below view this information at an individual property level.
Find a Recent Sale
Sales Detail
Population
An assessment of population growth drivers in Yarrabah reveals an overall ranking slightly below national averages considering recent, and medium term trends
Yarrabah's population, as per AreaSearch's analysis, was approximately 2,659 as of November 2025. This figure represents an increase of 154 people since the 2021 Census, which recorded a population of 2,505. The change is inferred from the estimated resident population of 2,659 in June 2024 and address validation since the Census date. This results in a population density ratio of 16.7 persons per square kilometer. Yarrabah's growth rate of 6.1% since the 2021 census exceeded the SA3 area average of 5.2%, indicating it as a regionally significant growth leader. Natural growth contributed approximately 97.5% of overall population gains during recent periods.
AreaSearch uses ABS/Geoscience Australia projections for each SA2 area, released in 2024 with a base year of 2022. For areas not covered by this data and years post-2032, Queensland State Government's SA2 area projections are adopted, released in 2023 based on 2021 data. However, these state projections do not provide age category splits, so proportional growth weightings aligned with ABS Greater Capital Region projections (released in 2023, based on 2022 data) are applied for each age cohort where necessary. Future demographic trends suggest a significant population increase in the top quartile of national non-metropolitan areas, with Yarrabah expected to increase by 746 persons to 2041, reflecting an overall increase of 28.1% over the 17-year period based on the latest annual ERP population numbers.
Frequently Asked Questions - Population
Development
Residential development activity is lower than average in Yarrabah according to AreaSearch's national comparison of local real estate markets
Yarrabah has seen approximately ten new homes approved annually over the past five financial years, totalling 53 homes. As of FY26, zero approvals have been recorded. The average population increase per dwelling built over these years is 0.7 people per year.
This supply meets or exceeds demand, offering more buyer choices and supporting potential population growth above projections. New properties are constructed at an average value of $476,000, which is somewhat higher than regional norms due to quality-focused development. Compared to the rest of Queensland, Yarrabah has similar development levels per person, maintaining market balance with the broader area.
Ninety percent of new developments consist of standalone homes, and ten percent are townhouses or apartments, preserving the area's low-density nature while attracting space-seeking buyers. This favours detached housing more than current patterns suggest, indicating robust demand for family homes despite increasing density pressures. The estimated population count per dwelling approval is 692 people, reflecting Yarrabah's quiet development environment. Population forecasts indicate a gain of 746 residents by 2041. Current development appears well-matched to future needs, supporting steady market conditions without extreme price pressure.
Frequently Asked Questions - Development
Infrastructure
Yarrabah has moderate levels of nearby infrastructure activity, ranking in the top 50% nationally
Ten projects have been identified by AreaSearch as potentially impacting the area's performance. These include: Cairns Smart Green Economy Initiative; Smart water meter program from 2023 to 2026; Leak Detection Program from 2022 to 2025; and CairnsPlan in 2016. The following list details those most likely to be relevant.
Professional plan users can use the search below to filter and access additional projects.
INFRASTRUCTURE SEARCH
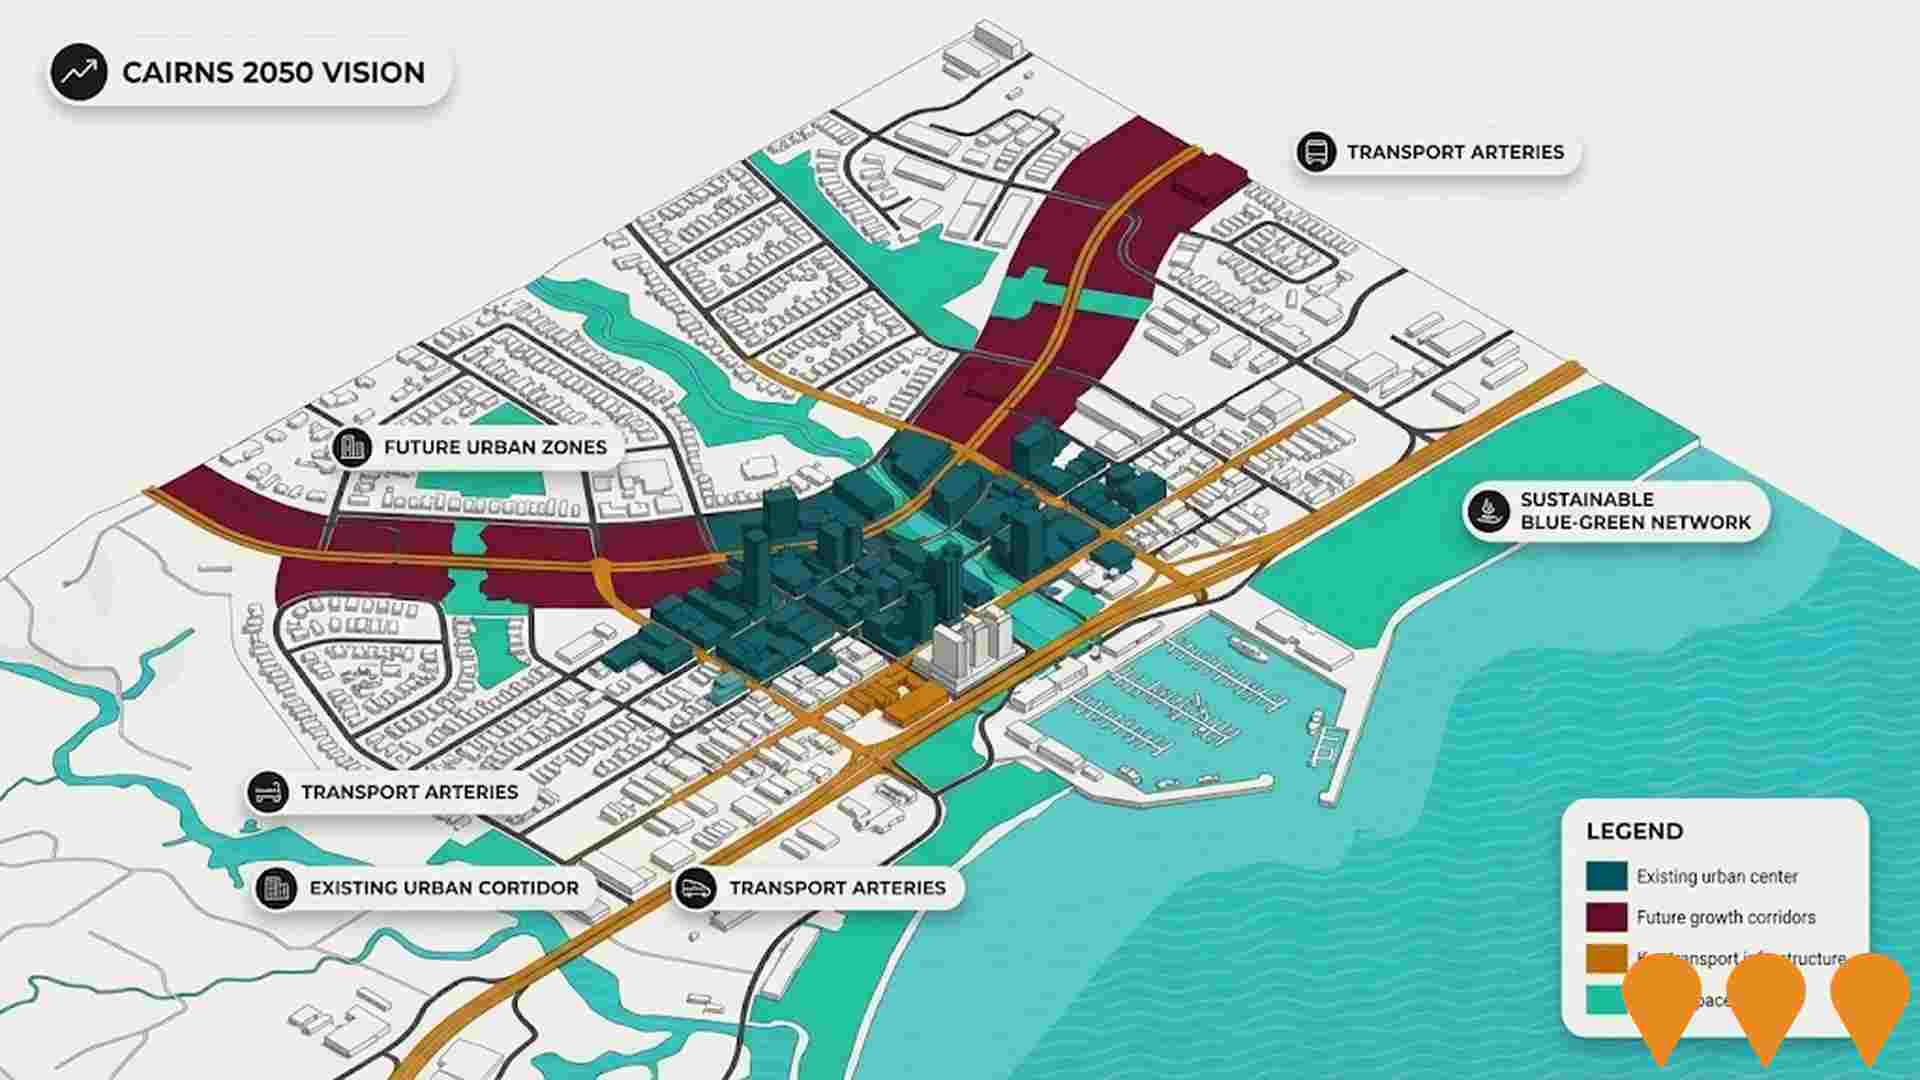
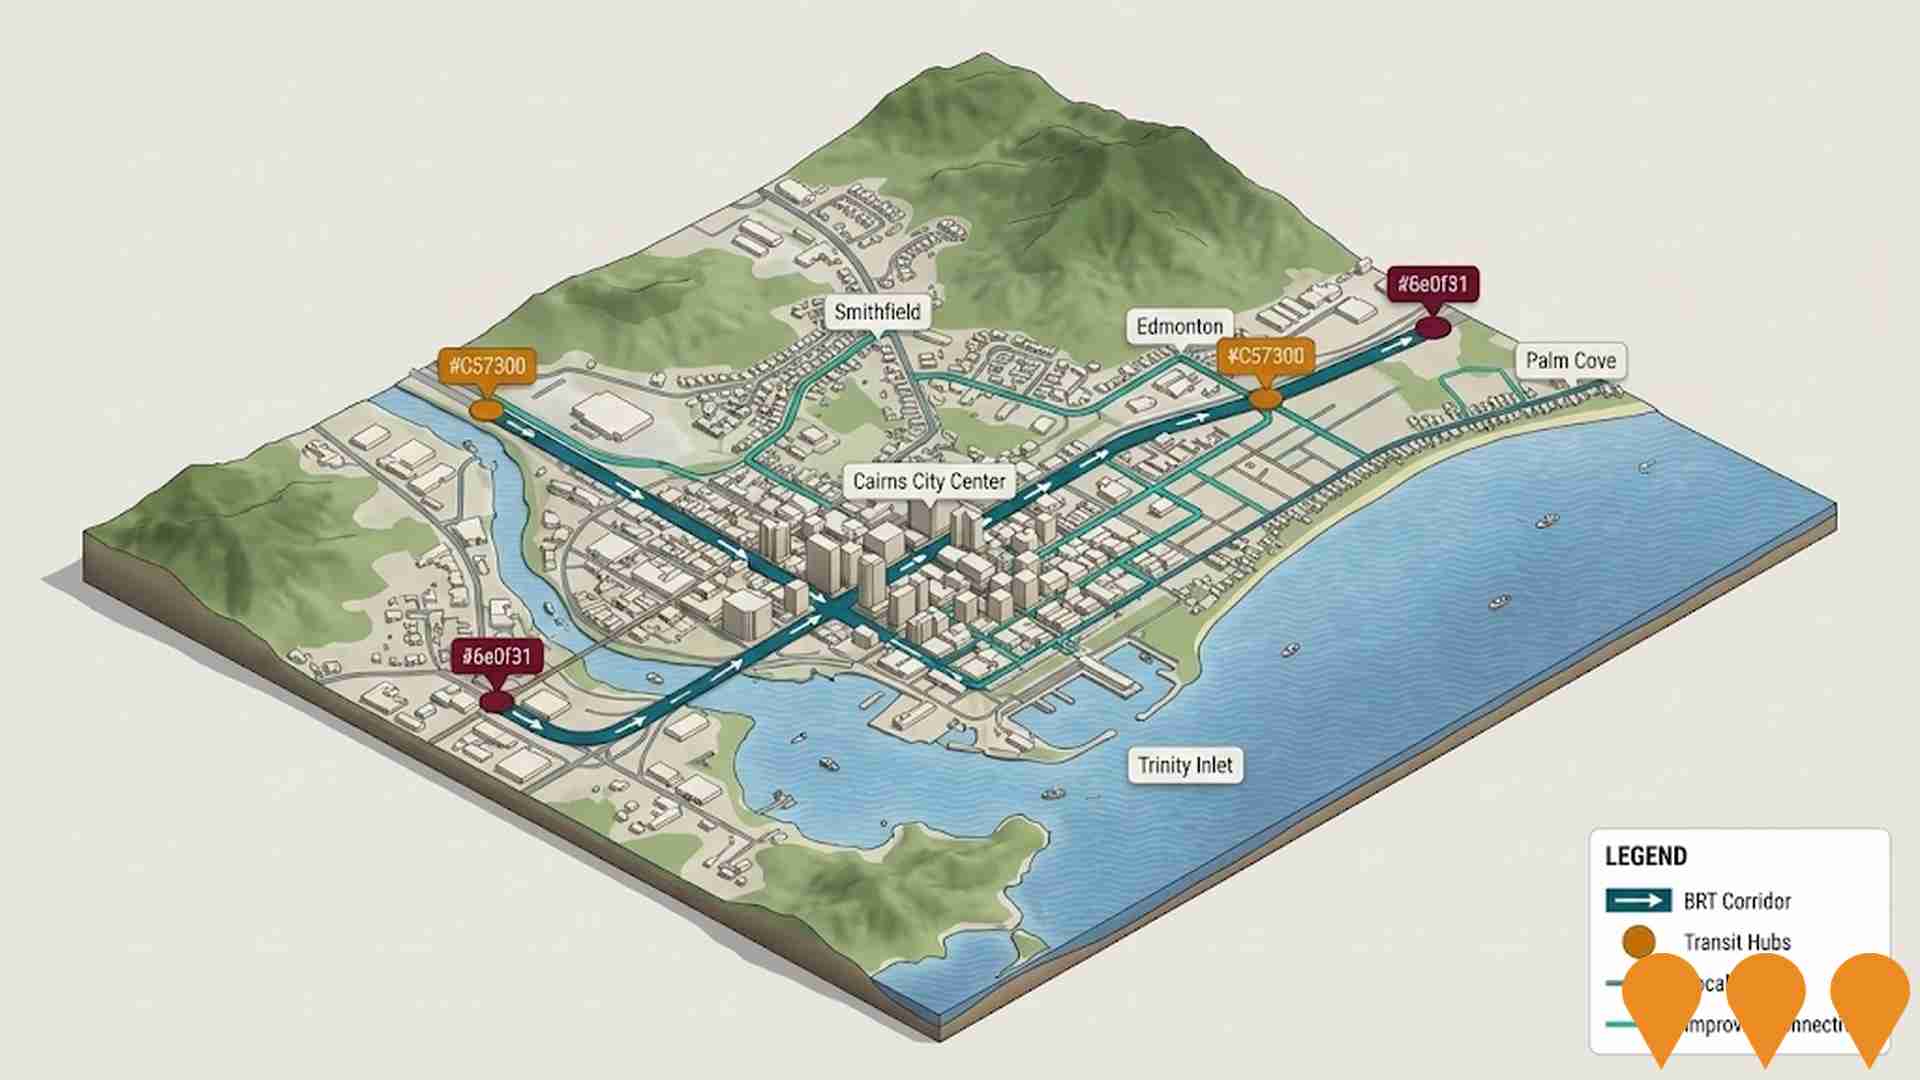
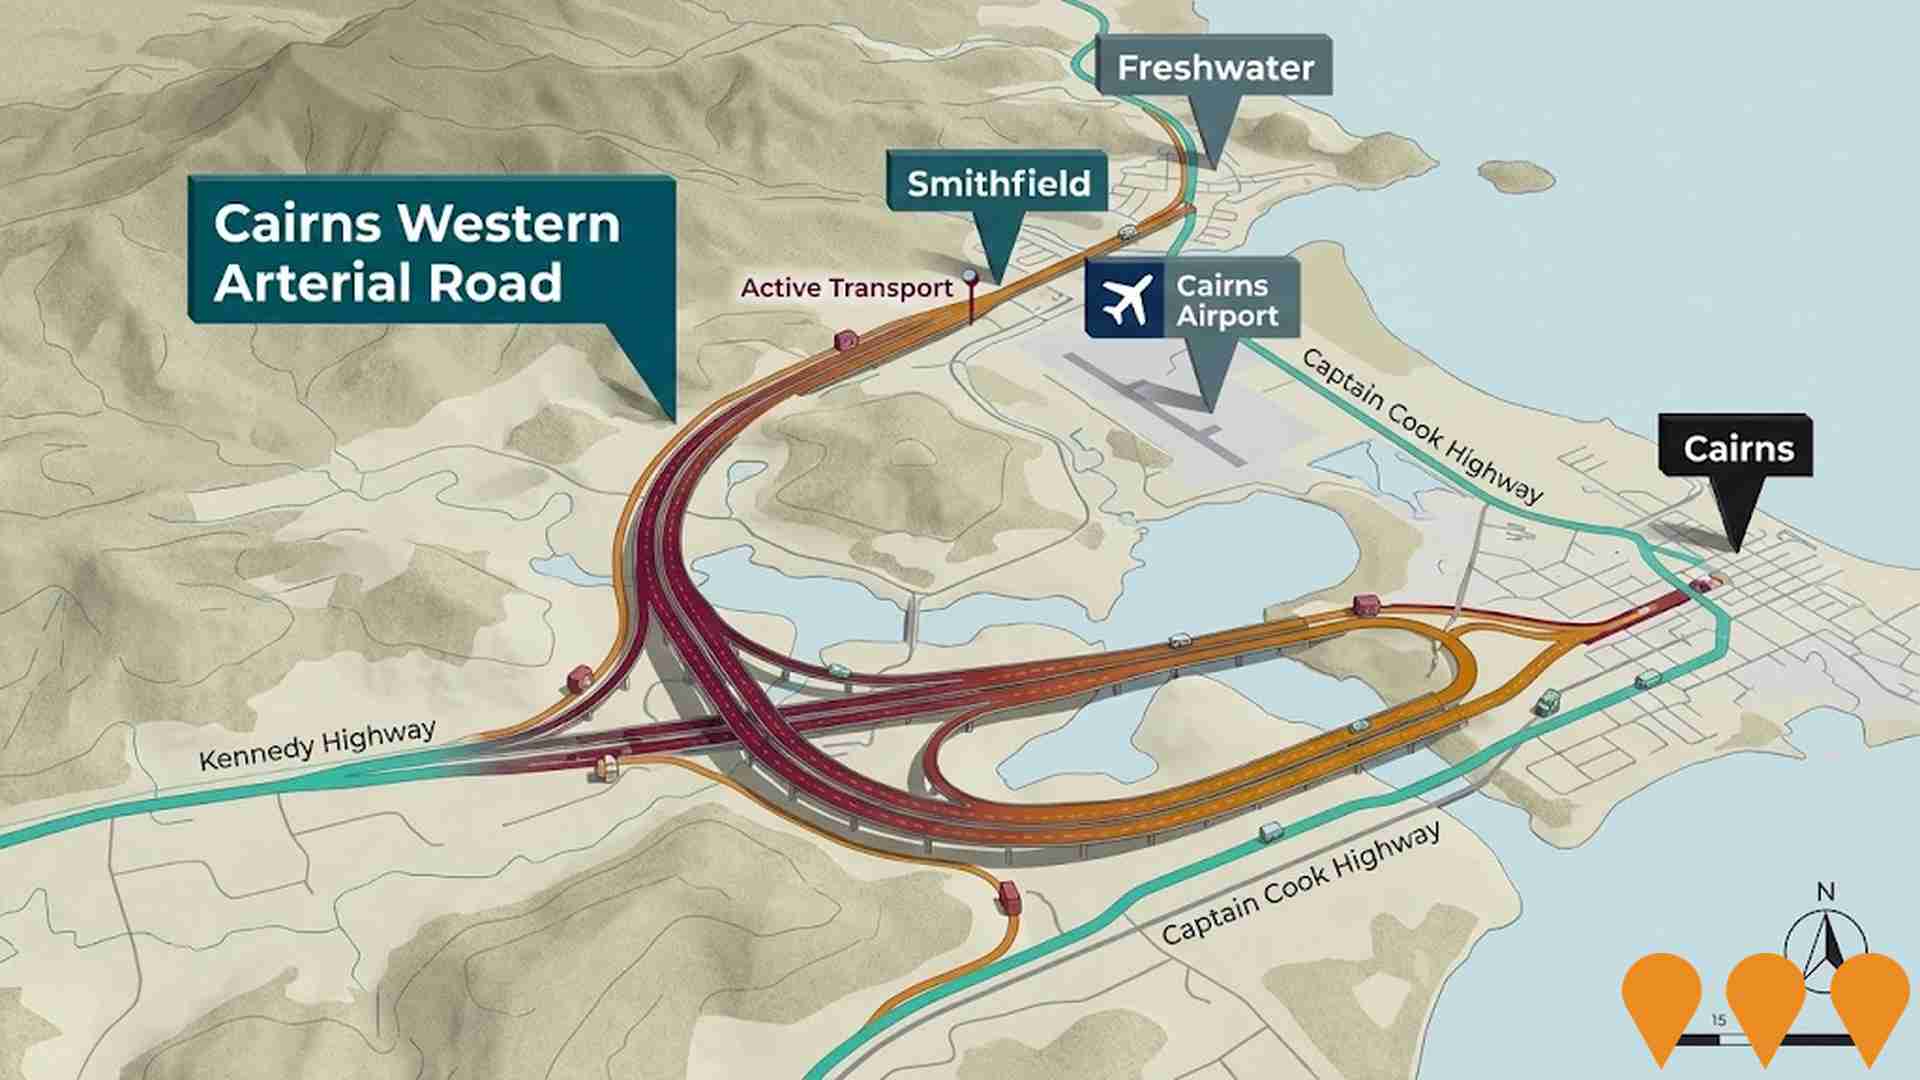
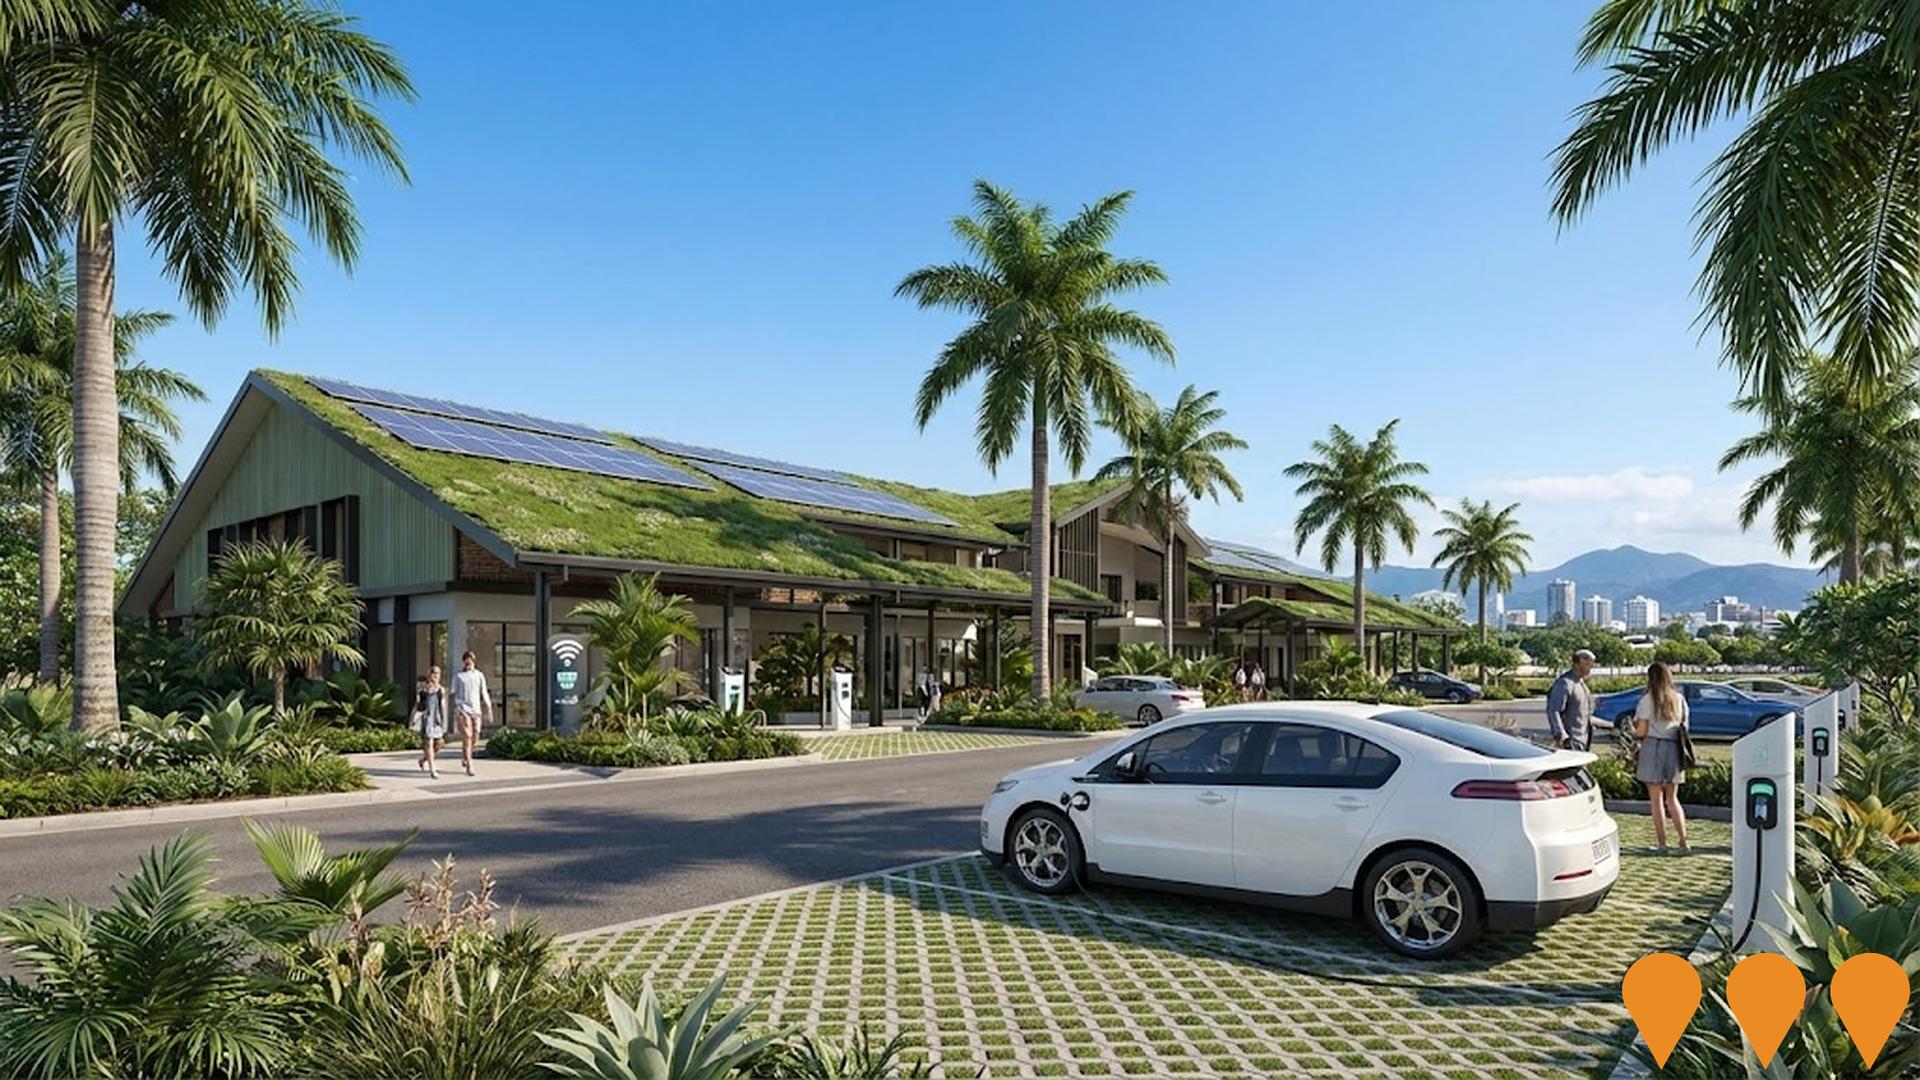
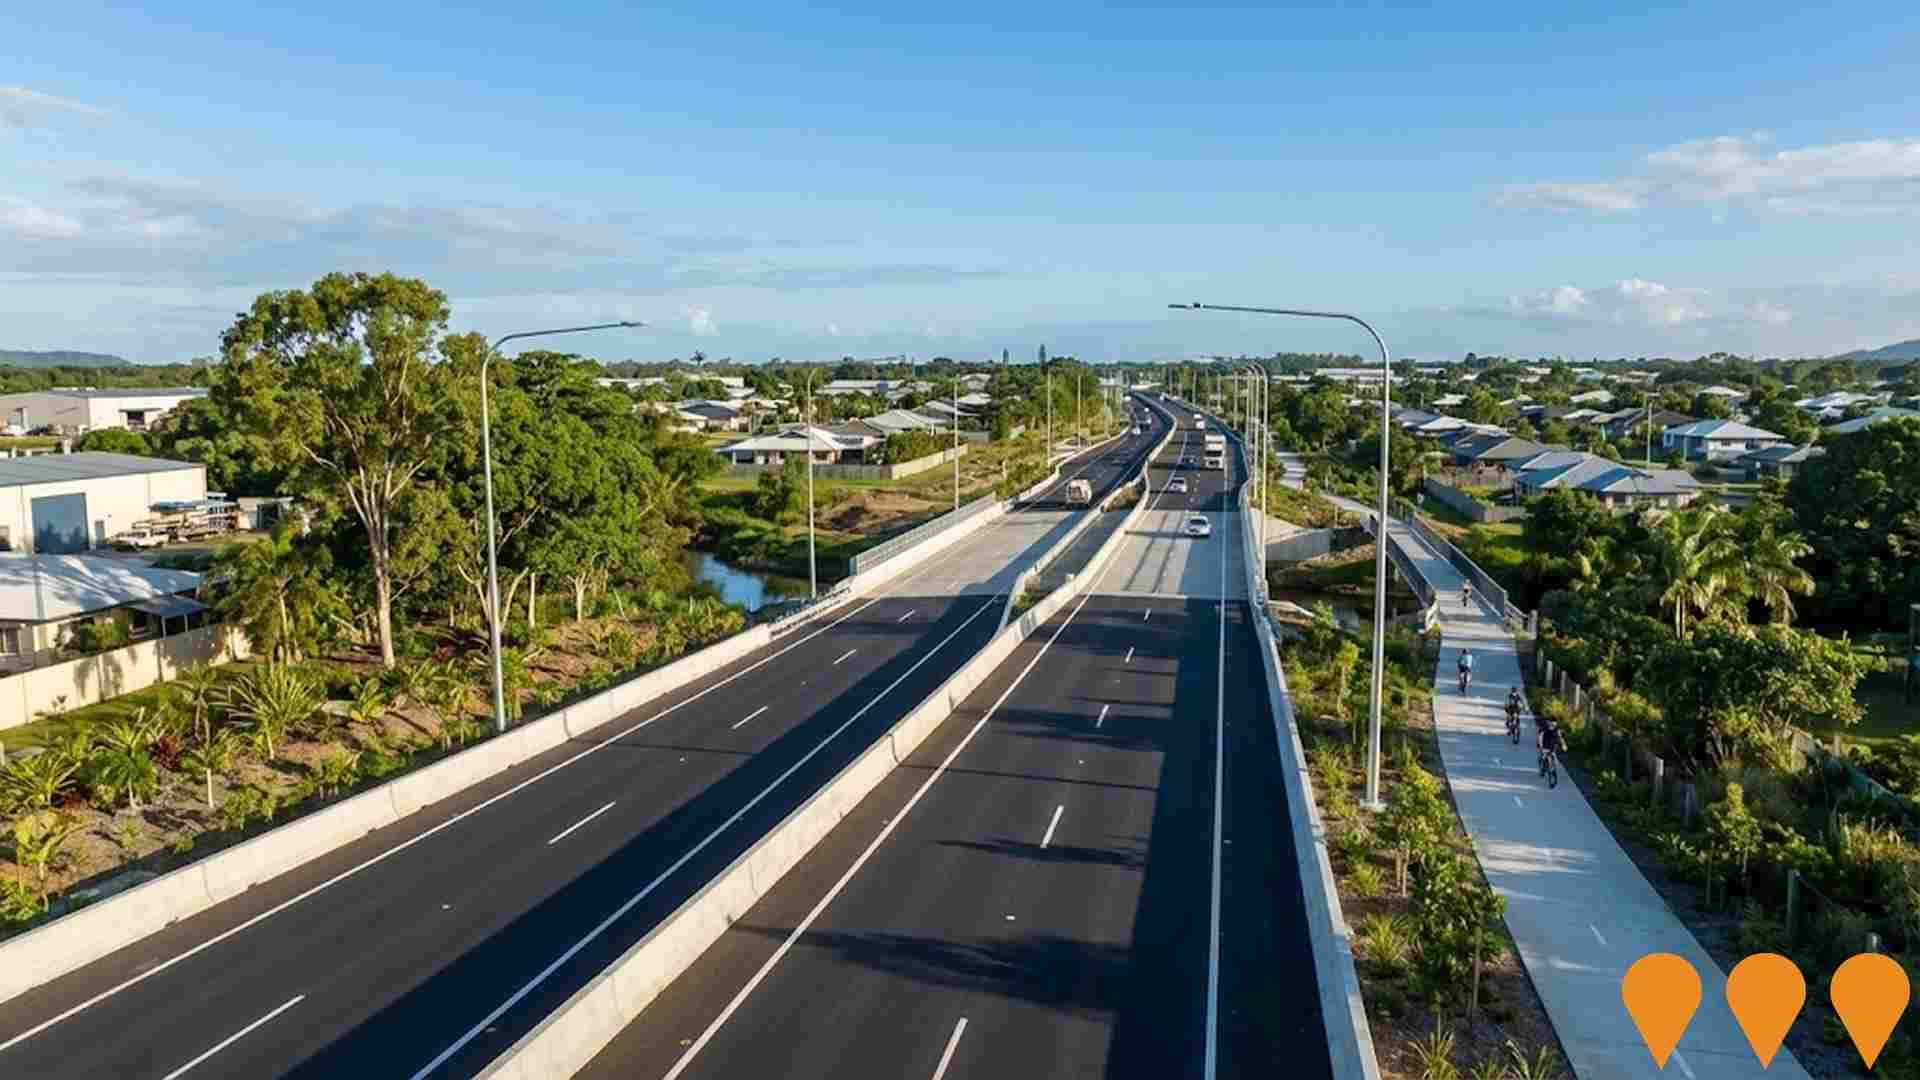
 Denotes AI-based impression for illustrative purposes only, not to be taken as definitive under any circumstances. Please follow links and conduct other investigations from the project's source for actual imagery. Developers and project owners wishing us to use original imagery please Contact Us and we will do so.
Frequently Asked Questions - Infrastructure
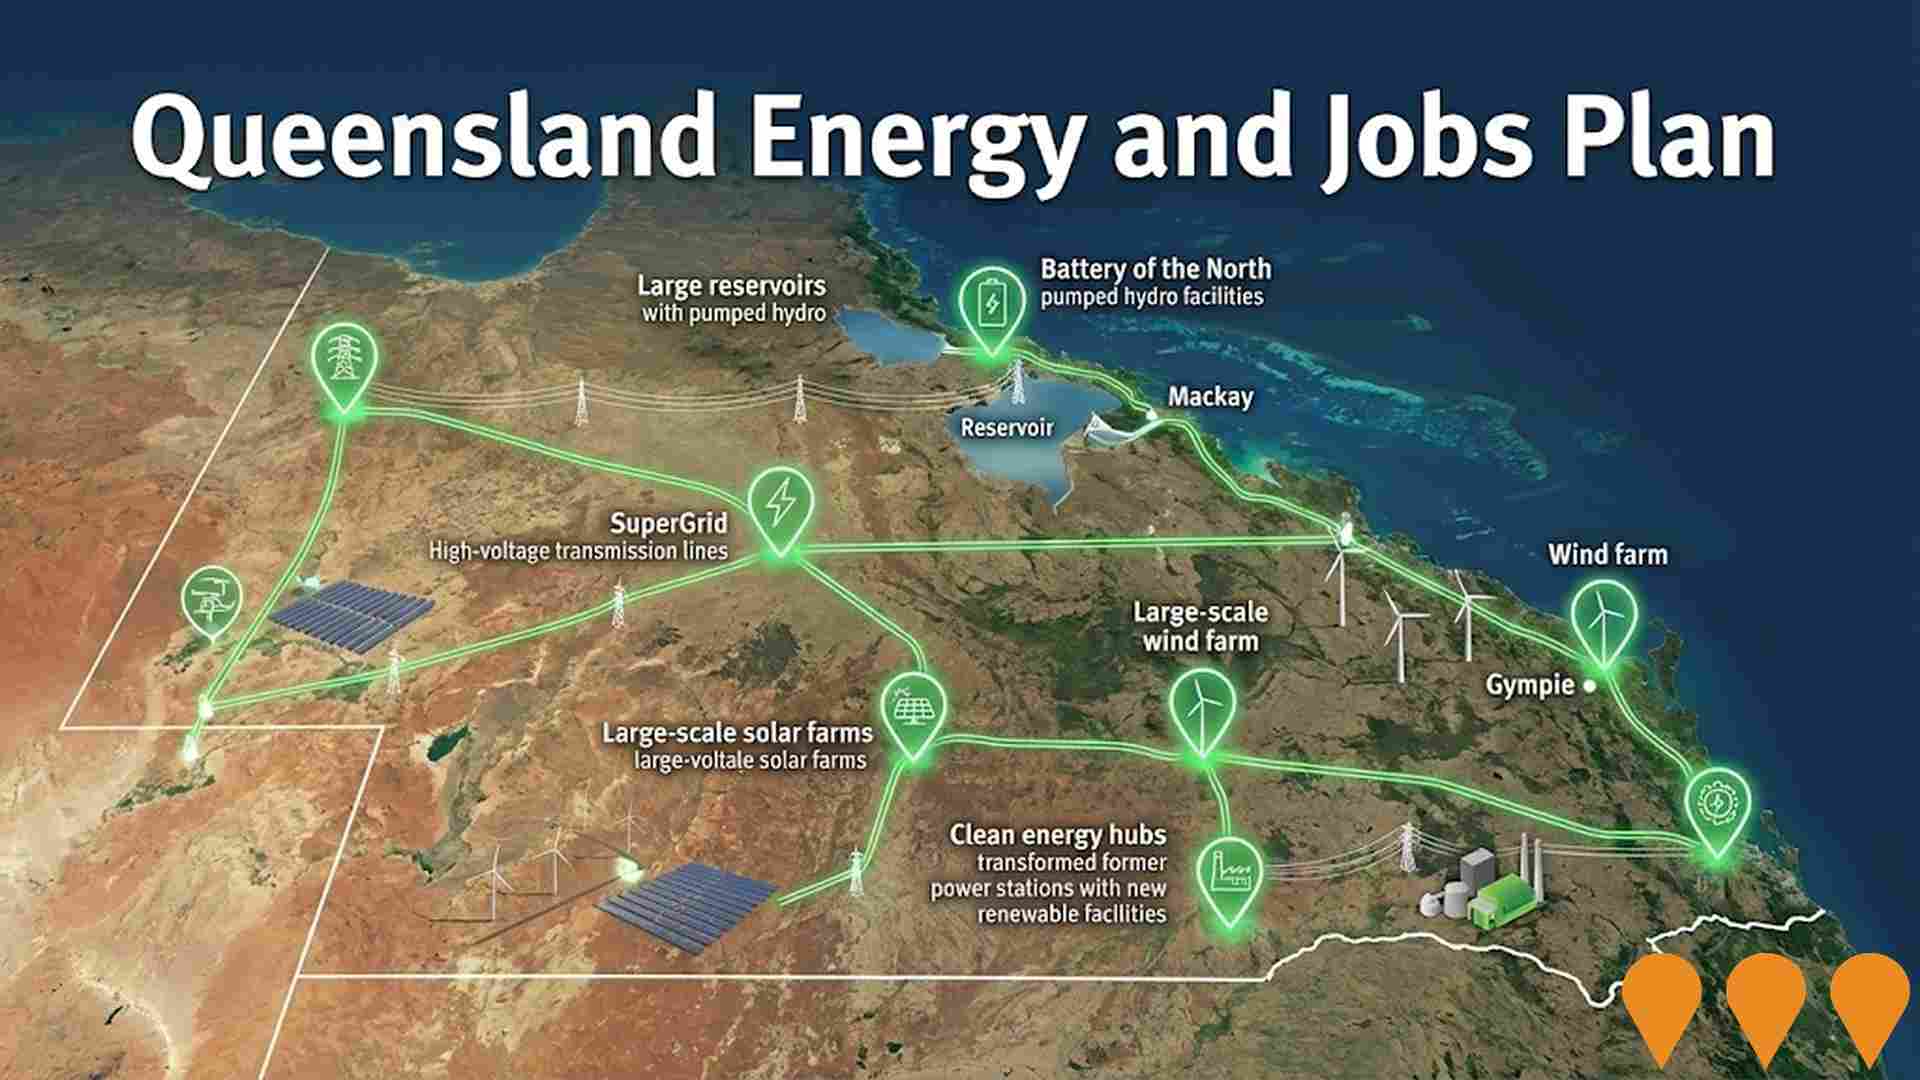
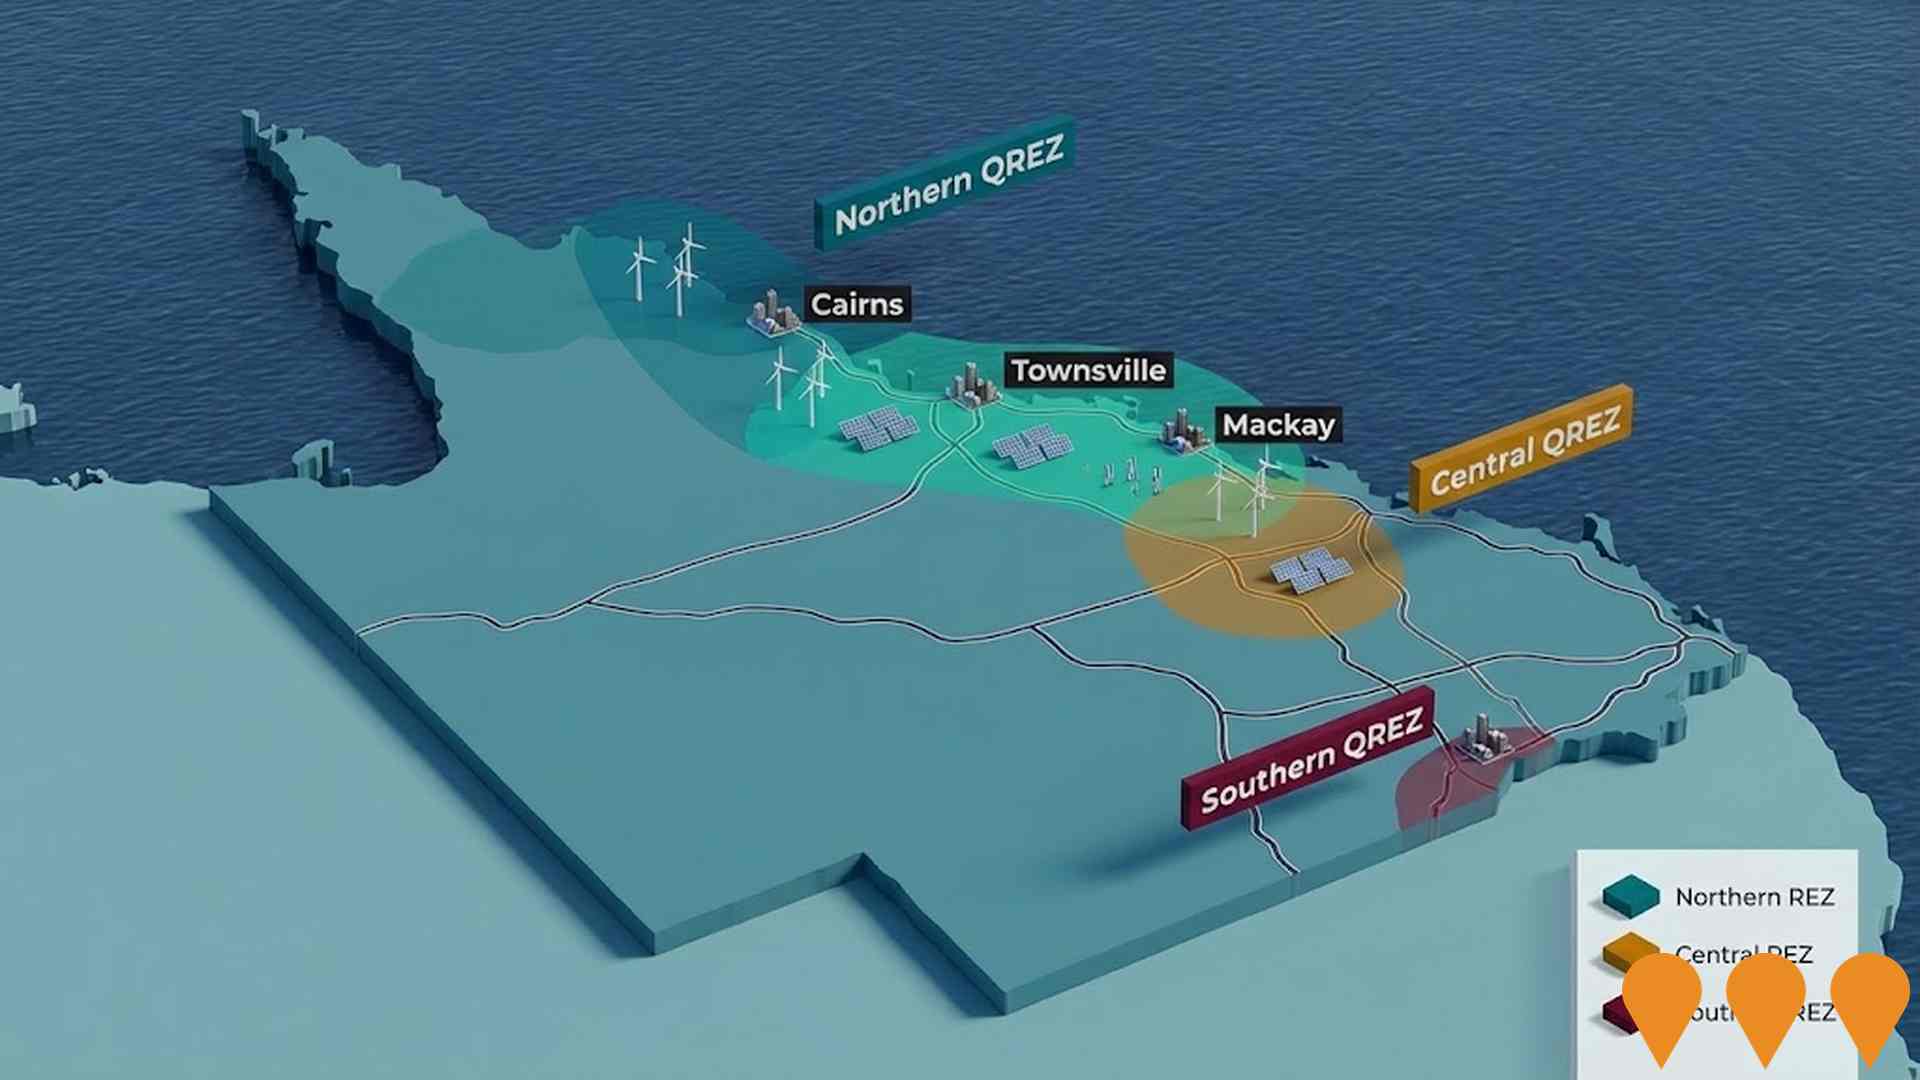
Queensland Energy and Jobs Plan
State-wide renewable energy transformation program delivering large-scale wind, solar, pumped hydro, battery storage and transmission infrastructure. Aims for 70% renewable energy by 2032 and 80% by 2035, supporting 100,000 jobs by 2040 across regional Queensland. Largest clean energy investment program in Australia.
Queensland Energy and Jobs Plan SuperGrid
The Queensland Energy and Jobs Plan is delivering the Queensland SuperGrid and 22 GW of new renewable energy capacity through Renewable Energy Zones (REZs) across the state. Legislated targets are 50% renewables by 2030, 70% by 2032 and 80% by 2035. Key delivery mechanisms include the Energy (Renewable Transformation and Jobs) Act 2024, the SuperGrid Infrastructure Blueprint, the Queensland REZ Roadmap and the Priority Transmission Investments (PTI) framework. Multiple transmission projects are now in construction including CopperString 2032, Gladstone PTI (Central Queensland SuperGrid), Southern Queensland SuperGrid reinforcements, and numerous grid-scale batteries and pumped hydro projects under active development.
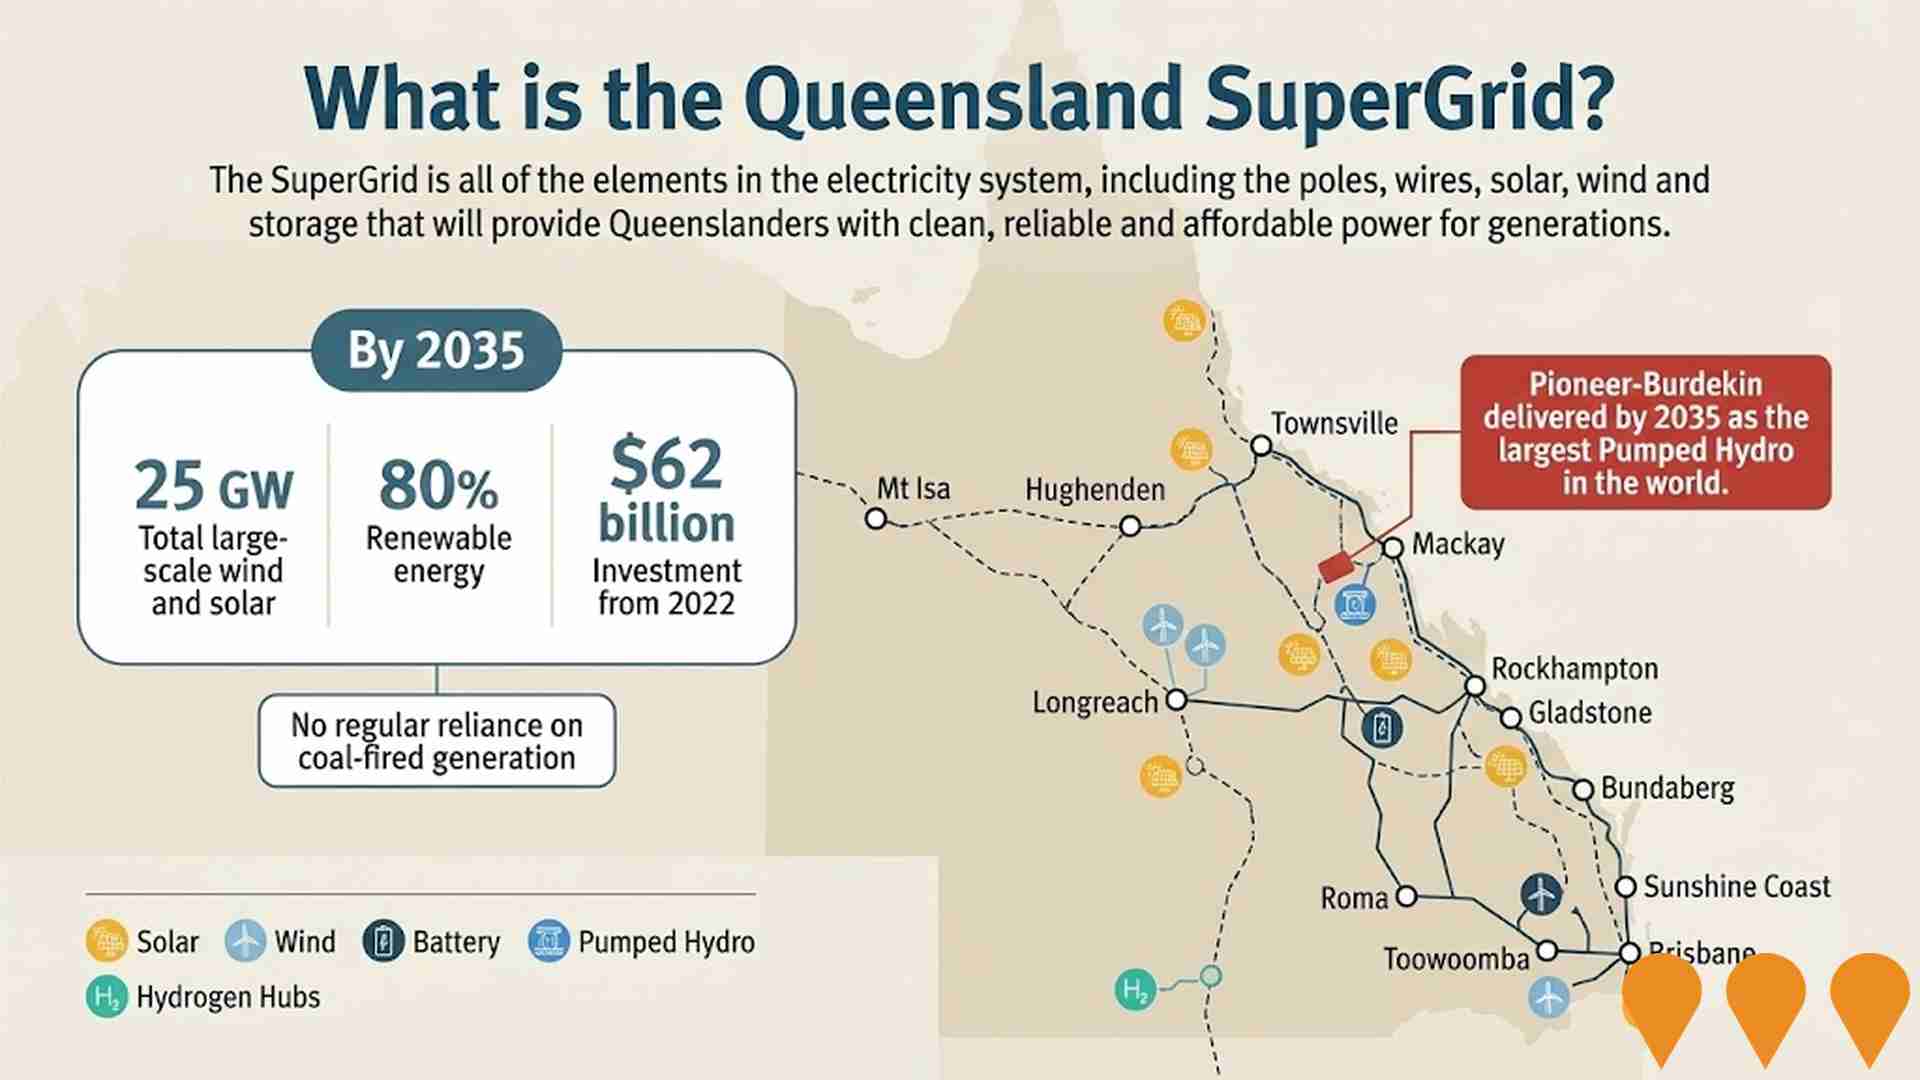
Queensland Energy and Jobs Plan
The Queensland Energy and Jobs Plan is a $62 billion+ statewide program to deliver publicly owned renewable energy generation, large-scale battery and pumped hydro storage, and the Queensland SuperGrid transmission backbone. Targets: 50% renewables by 2030, 70% by 2032, 80% by 2035. Multiple projects are now under construction including CopperString 2032, Pioneer-Burdekin Pumped Hydro, and numerous Renewable Energy Zones.
Cairns Smart Green Economy Initiative
Multi-year program led by Cairns Regional Council delivering renewable energy projects, smart waste and water systems, digital connectivity upgrades, EV charging network, and climate resilience infrastructure across the Cairns region.
Bruce Highway Cairns Southern Access Corridor Stage 3 - Edmonton to Gordonvale
Major highway duplication project involving 10.5km upgrade and duplication of the Bruce Highway between Edmonton and Gordonvale. Includes new signalised intersections, bridges at Wrights Creek and Stoney Creek, new overpass south of Maitland Road, realignment of Queensland Rail North Coast Line, and dedicated off-road cycleway. Part of the 15-year Bruce Highway Upgrade Program to improve safety and reduce congestion on this critical freight and tourism corridor. The largest infrastructure project in Far North Queensland history, now completed and operational.
North and Far North Queensland REZs
Queensland is progressing three potential Renewable Energy Zones (REZs) in the North and Far North region: Far North Queensland, Collinsville and Flinders. As at August 2025 these REZs have not been formally declared under the Energy (Renewable Transformation and Jobs) Act 2024. Powerlink Queensland has been appointed as the REZ Delivery Body to develop REZ management plans and lead planning and consultation ahead of any declaration. Government materials indicate early network upgrades south of Cairns to unlock up to 500 MW in the Far North as an initial step, with broader REZ design, access and community engagement to follow.
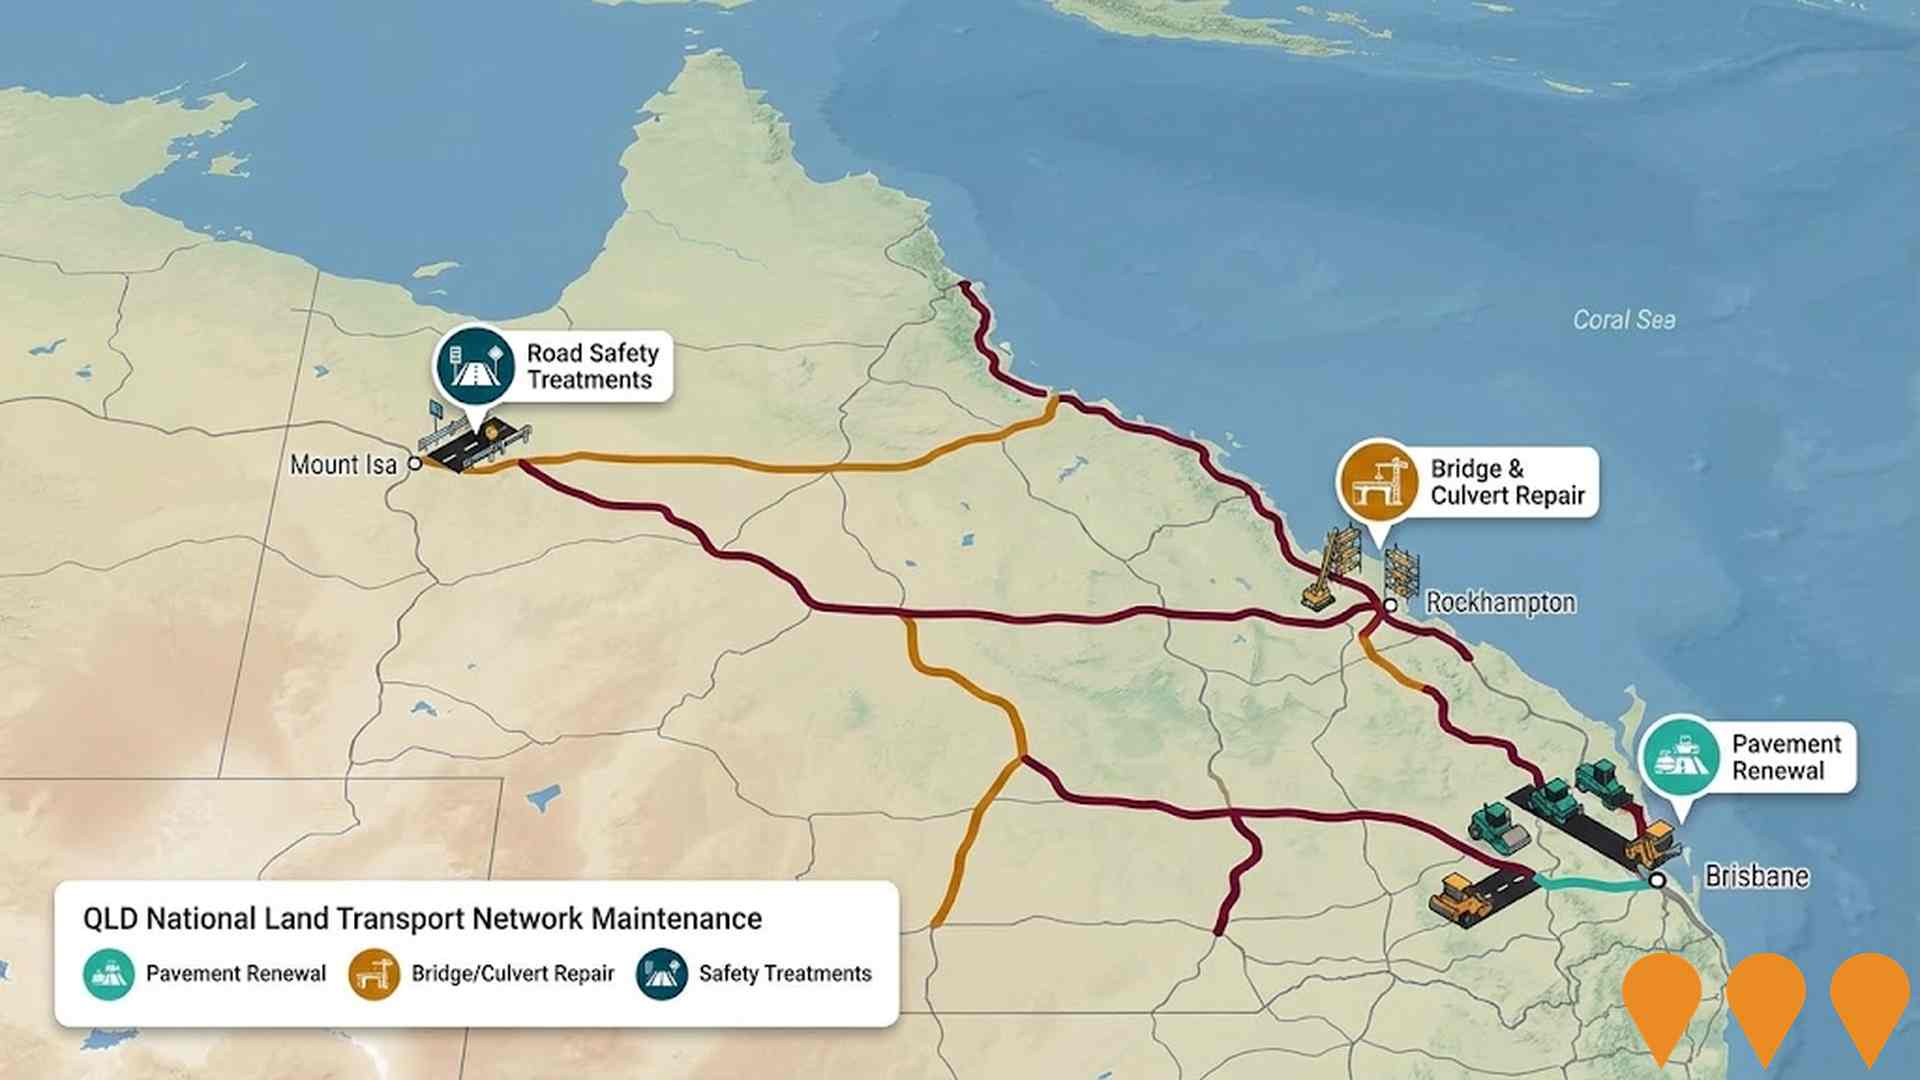
Queensland National Land Transport Network Maintenance
Program of maintenance and rehabilitation works across Queensland's National Land Transport Network to reduce the significant backlog, improve safety, lift freight efficiency and strengthen network resilience. Focus includes pavement renewal, bridge and culvert repairs, drainage, and road safety treatments delivered under TMR's maintenance programs and QTRIP.
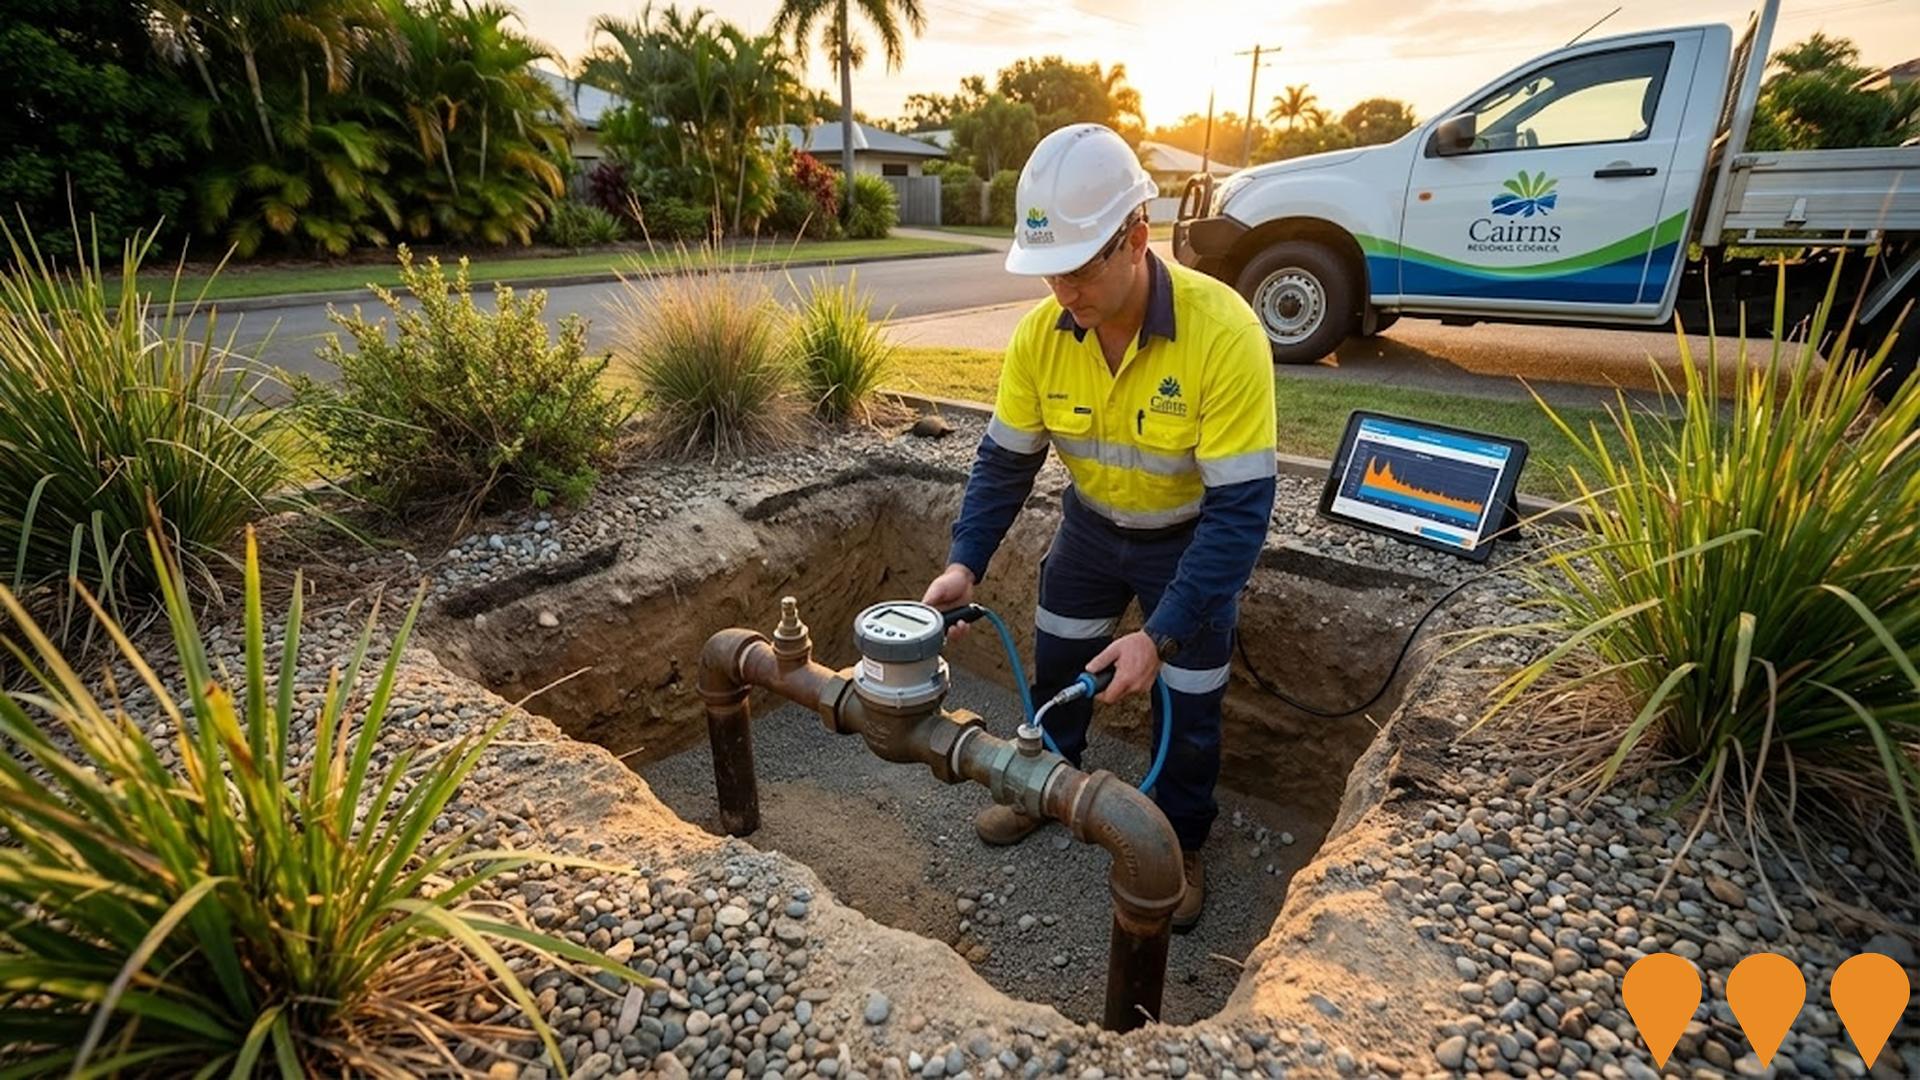
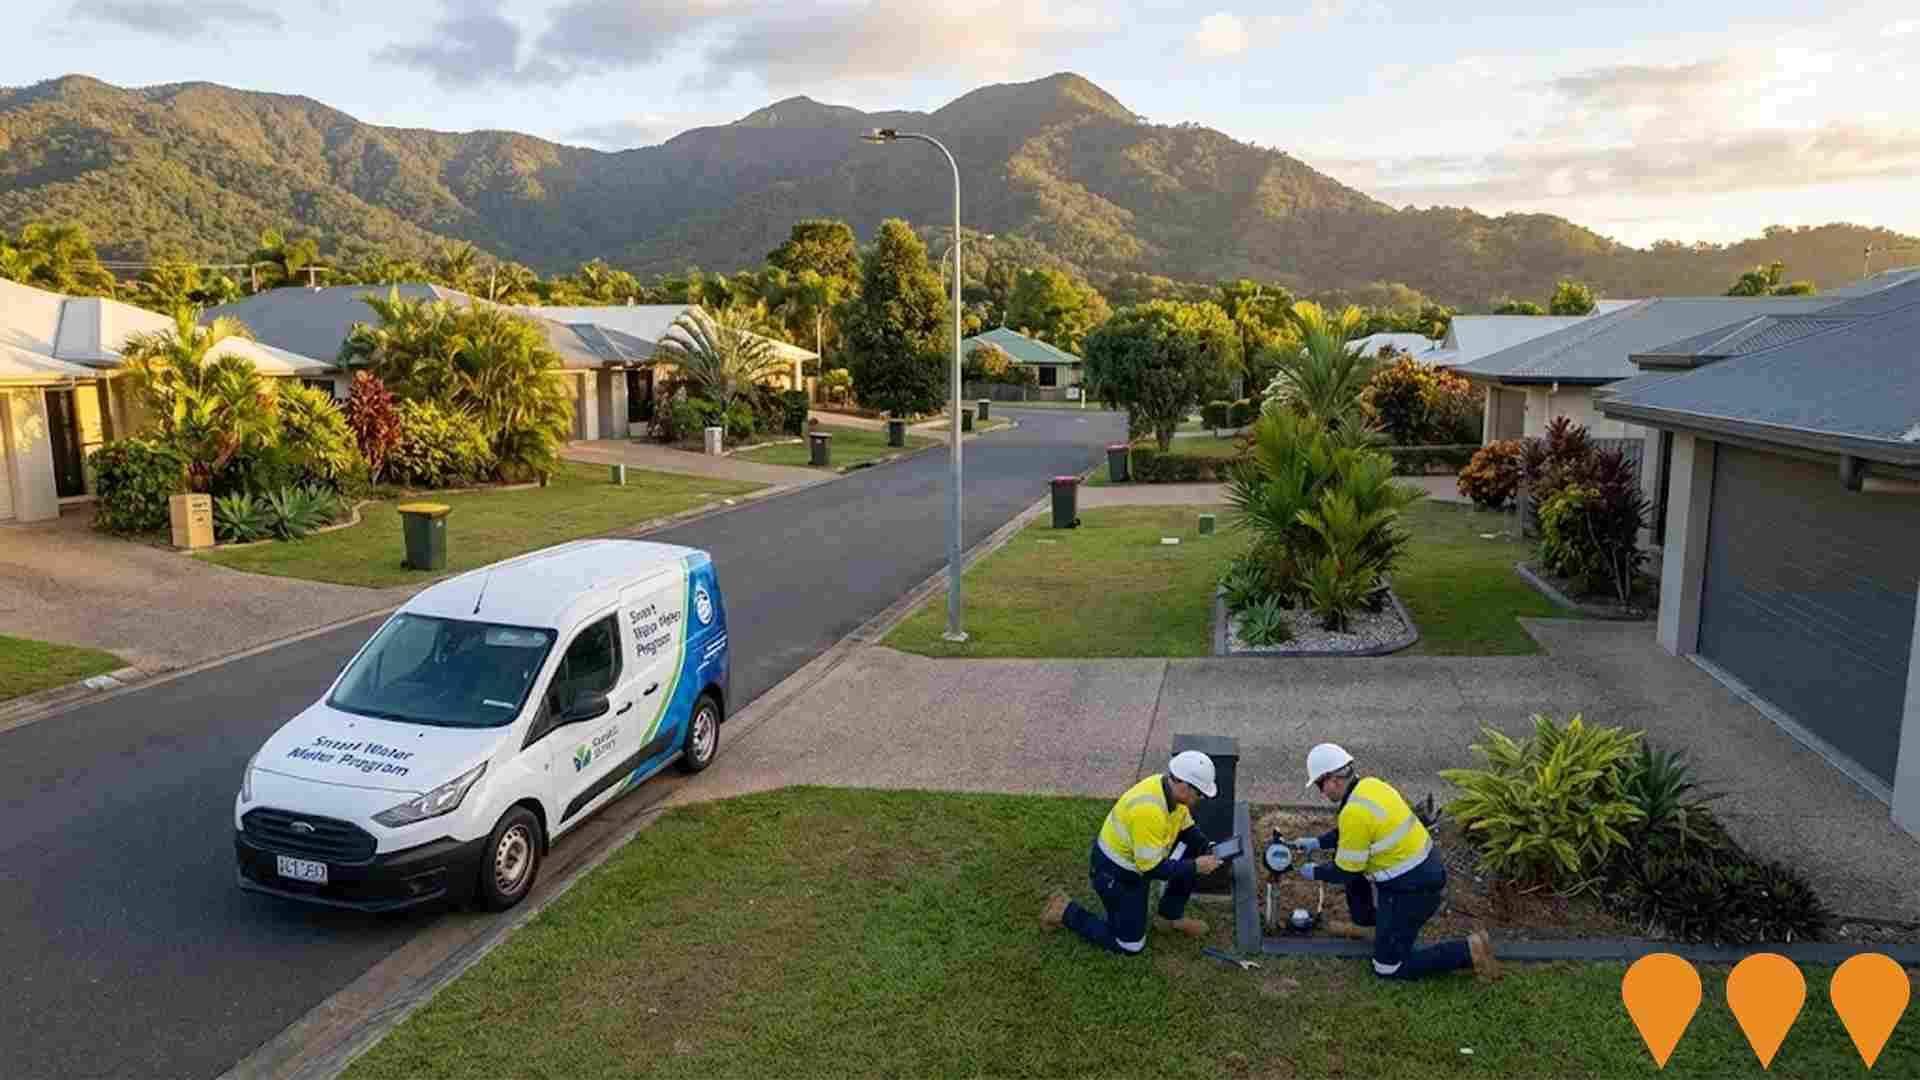
Smart water meter program 2023-2026
Council is replacing existing mechanical water meters with smart water meters throughout the Cairns region to improve the community's water network and achieve overall water savings.
Employment
Employment conditions in Yarrabah face significant challenges, ranking among the bottom 10% of areas assessed nationally
Yarrabah has a balanced workforce with white and blue collar jobs. Essential services sectors are well represented, but the unemployment rate is high at 67.1%.
As of September 2025233 residents are employed while the unemployment rate is 63.1% higher than Queensland's average of 4.1%. Workforce participation is lower in Yarrabah at 36.1%, compared to Queensland's 59.1%. Leading employment industries include health care & social assistance, public administration & safety, and education & training. Public administration & safety has a notable concentration with employment levels at 4.9 times the regional average.
Retail trade employs only 1.8% of local workers, below Queensland's 10.0%. The area may offer limited local employment opportunities as indicated by Census data. Between September 2024 and September 2025, labour force levels decreased by 1.8%, employment fell by 41.6%, leading to a rise in unemployment rate of 22.4 percentage points. In contrast, Queensland experienced employment growth of 1.7% and labour force growth of 2.1%. As of 25-November-2025, Queensland's employment contracted by 0.01%, with an unemployment rate of 4.2%, similar to the national rate of 4.3%. National employment forecasts from May-2025 project a 6.6% increase over five years and 13.7% over ten years. Applying these projections to Yarrabah's employment mix suggests local employment could grow by 7.9% over five years and 16.4% over ten years, though this is a simple extrapolation for illustrative purposes only.
Frequently Asked Questions - Employment
Income
Income metrics place the area in the bottom 10% of locations nationally according to AreaSearch analysis
The Yarrabah SA2's income level is lower than average on a national basis according to ATO data aggregated by AreaSearch for financial year 2022. The median income among taxpayers in Yarrabah SA2 was $41,380 and the average income stood at $51,961. These figures compare to those of Rest of Qld's which were $50,780 and $64,844 respectively. Based on Wage Price Index growth of 13.99% since financial year 2022, current estimates for income in Yarrabah SA2 would be approximately $47,169 (median) and $59,230 (average) as of September 2025. According to the 2021 Census figures, household income ranks at the 17th percentile with a weekly income of $1,254, while personal income sits at the 0th percentile. The income brackets indicate that 31.1% of the community (826 individuals) falls within the $800 - 1,499 earnings band, differing from patterns across the surrounding region where $1,500 - 2,999 dominates with 31.7%. Despite modest housing costs which allow for 89.3% of income to be retained, total disposable income ranks at just the 23rd percentile nationally.
Frequently Asked Questions - Income
Housing
Yarrabah is characterized by a predominantly suburban housing profile, with a higher proportion of rental properties than the broader region
Yarrabah's dwelling structure, as evaluated at the latest Census held in 2016, consisted of 71.4% houses and 28.6% other dwellings (semi-detached, apartments, 'other' dwellings). This compared to Non-Metro Qld's 87.1% houses and 12.9% other dwellings. Home ownership in Yarrabah was at 11.3%, with the rest either mortgaged (0.7%) or rented (88.0%). The median monthly mortgage repayment in the area, as of 2016 data, was $1,392, while the median weekly rent figure was recorded at $150. Nationally, Yarrabah's mortgage repayments were significantly lower than the Australian average of $1,863, reported in June 2021 ABS data, while rents were substantially below the national figure of $375 for the same period.
Frequently Asked Questions - Housing
Household Composition
Yarrabah features high concentrations of family households, with a higher-than-average median household size
Family households constitute 85.8% of all households, including 35.8% couples with children, 9.9% couples without children, and 36.2% single parent families. Non-family households account for the remaining 14.2%, with lone person households at 11.1% and group households comprising 1.9%. The median household size is 4.5 people, which is larger than the Rest of Qld average of 2.4.
Frequently Asked Questions - Households
Local Schools & Education
Yarrabah faces educational challenges, with performance metrics placing it in the bottom quartile of areas assessed nationally
The area's university qualification rate is 3.4%, significantly lower than the Australian average of 30.4%. This discrepancy presents both a challenge and an opportunity for targeted educational initiatives. Bachelor degrees are most common among qualified residents at 2.8%, followed by graduate diplomas (0.6%) and postgraduate qualifications (0%). Trade and technical skills are prevalent, with 38.1% of residents aged 15+ holding vocational credentials - advanced diplomas (5.2%) and certificates (32.9%).
Educational participation is high, with 30.6% of residents currently enrolled in formal education. This includes 16.1% in primary education, 10.6% in secondary education, and 0.5% pursuing tertiary education.
Frequently Asked Questions - Education
Schools Detail
Nearby Services & Amenities
Transport
No public transport data available for this catchment area.
Frequently Asked Questions - Transport
Transport Stops Detail
Health
Yarrabah's residents boast exceedingly positive health performance metrics with younger cohorts in particular seeing very low prevalence of common health conditions
Health outcomes data shows excellent results across Yarrabah, with younger cohorts having particularly low prevalence rates for common health conditions. Only approximately 46% of the total population (~1,228 people) has private health cover, compared to the national average of 55.3%.
The most prevalent medical conditions in the area are diabetes and heart disease, affecting 8.6% and 5.1% of residents respectively. In contrast, 77.5% of residents report being completely free from medical ailments, higher than the Rest of Qld's rate of 68.1%. The area has a lower proportion of seniors aged 65 and over, at 7.8% (206 people), compared to Rest of Qld's 23.6%. Despite this, health outcomes among seniors require more attention than the broader population.
Frequently Asked Questions - Health
Cultural Diversity
The level of cultural diversity witnessed in Yarrabah was found to be slightly above average when compared nationally for a number of language and cultural background related metrics
Yarrabah's cultural diversity was found to be above average, with 0.2% of its population born overseas and 81.6% speaking a language other than English at home. Christianity was the main religion in Yarrabah, comprising 88.8% of people, compared to 59.2% across Rest of Qld. The top three ancestry groups were Australian Aboriginal (89.7%), Other (7.0%), and Australian (1.2%).
This compares to regional averages of 11.3% for Australian Aboriginal and 23.0% for Australian.
Frequently Asked Questions - Diversity
Age
Yarrabah hosts a very young demographic, ranking in the bottom 10% of areas nationwide
Yarrabah has a median age of 25, which is significantly younger than the Rest of Qld figure of 41 and substantially under the Australian median of 38. Compared to Rest of Qld, Yarrabah has a higher concentration of residents aged 15-24 (18.9%) but fewer residents aged 65-74 (4.1%). This 15-24 concentration is well above the national figure of 12.5%. Between 2021 and present, the 75 to 84 age group has grown from 1.2% to 2.9% of the population, while the 35 to 44 cohort increased from 11.1% to 12.4%. Conversely, the 45 to 54 cohort has declined from 10.2% to 7.9%, and the 5 to 14 age group dropped from 20.7% to 18.5%. Looking ahead to 2041, demographic projections reveal significant shifts in Yarrabah's age structure. The 25 to 34 age cohort is projected to rise substantially, increasing by 232 people (56%) from 414 to 647. Meanwhile, numbers in the 5 to 14 age range are expected to fall by 12.
