
estimated as @ February 25 *
ABS ERP | 6,965 people | June 2024
180.4 Land Area (SqKm)39 Pop Density (P/SqKm)
2021 Census
6,876 People
-4.2% Growth from 2016c
3,296 Dwellings
2.1 Persons Per Dwelling
2016 Census
7,175 People
3.7% Growth from 2011c
3,250 Dwellings
The following analysis is undertaken for the Narrabri (SA2) area. AreaSearch estimates Narrabri's population to be approximately 6,974 as at February 25. Since the 2021 Census population result of 6,876 people, the area is estimated to have seen a slight 1.4% increase, which is driven by a combination of the estimated resident population figure of 6,965 from the ABS to June 2024 and an additional 4 validated new addresses since the Census date. Given the location's 180.4sq km land mass, Narrabri possesses an estimated population density of 39 persons per square kilometre, with the 2021 Census showing 2.1 persons per dwelling.
About the Area
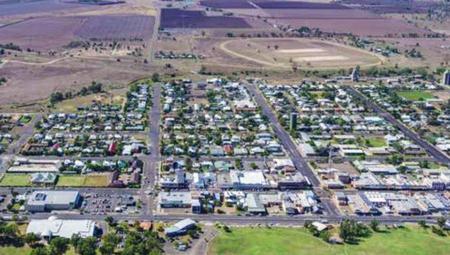
Located within the beautiful Namoi Valley, Narrabri in NSW, Australia, is best known for its stunning natural landscapes and rich agricultural and mining industries. The area boasts enchanting national parks, such as Mount Kaputar National Park and Pilliga Forest Reserve, which offers countless outdoor recreational opportunities for visitors and residents alike. Narrabri is also recognized for its abundant and diverse agricultural lands, where cotton, wheat, and other crops grow plentifully. Meanwhile, the region's thriving mining sector taps into rich resources such as coal and natural gas. Alongside its environmental and economic attributes, Narrabri hosts various cultural and sporting events, showcasing the strong community spirit and vibrant lifestyle that the area embodies.

Segmentation & Links
The Area's CompositionThe suburb of Narrabri hosts the entirety of the catchment's population, while Narrabri was found to be the only SA2 area falling within its bounds. Meanwhile, the entire catchment is within the Narrabri local government area.
["10534850000","10534860000","10534870000","10534880000","10534890000","10534910000","10535020000","10535030000","10535040000","10535061000","10535062000","10535070000","10535080000","10535090000","10535100000","10535210000","10535220000","10535230000","10535240000","10535250000","10535260000","10535270000","10535280000","10535290000","10535300000","10535310000","10535320000","10535330000","10535340000","10535350000","10535360000","10535370000","10535380000","10535390000","10535400000","10535410000","10535420000","10535430000","10535440000","10535450000","10535461000","10535462000","10535471000","10535472000","10535473000","10535480000","10535491000","10535492000","10535500000","10535510000","10535520000","10535530000","10535540000","10535550000","10535560000","10535570000","10535580000","10535590000","10535600000","10535610000","10535620000","10535630000","10535641000","10535642000","10535643000","10535644000","10535650000","10535660000","10535670000","10535680000","10535690000","10535700000","10535710000","10536120000","10536130000","10536141000","10536142000","10536150000","10536160000","10536250000","10536260000","10536270000","10536280000","10536290000","10536301000","10536302000","10536361000","10536362000","10536370000","10536380000","10536390000","10536400000","10536410000","10536420000","10536430000","10536440000","10536452000","10536453000","10536454000","10536455000","10536471000","10536472000","10536473000","10536481000","10536482000","10536490000","10536520000","10536530000","10536682000","10993870000","11225120000","11226120000"]STATISTICAL 2 |
LOCAL GOVERNMENT |
SUBURBS
| SA2 | Analysis Page | ABS Link | Persons 2016c | Persons 2021c | est. February 25 | Catchment % | View |
|---|
SA2 | Analysis Page | ABS Link | Persons 2016c | Persons 2021c | est. February 25 | Catchment % | View |
|---|---|---|---|---|---|---|---|
| Narrabri | Link | 7,175 | 6,876 | 6,974 | 100.0 |
Note: Persons shown represent those falling within the catchment, not necessarily the full SA2.
| LGA | ABS Link | Developments | Zoning | Persons 2016c | Persons 2021c | est. February 25 | Catchment % | View |
|---|
LGA | ABS Link | Developments | Zoning | Persons 2016c | Persons 2021c | est. February 25 | Catchment % | View |
|---|---|---|---|---|---|---|---|---|
| Narrabri | Link | 7,175 | 6,876 | 6,974 | 100.0 |
Note: Persons shown represent those falling within the catchment, not necessarily the full LGA.
| Suburb | AS Pages | Persons 2016c | Persons 2021c | est. February 25 | Catchment % | View |
|---|
Suburb | AS Pages | Persons 2016c | Persons 2021c | est. February 25 | Catchment % | View |
|---|---|---|---|---|---|---|
| Narrabri | Child Care | 7,175 | 6,876 | 6,974 | 100.0 |
Note: Persons shown represent those falling within the catchment, not necessarily the full suburb.

Transactions & Housing Trends
TRANSACTIONS | TRENDSOf the 50 residential sales shown in the suburb of Narrabri the average sale value equated to $603,080 with a median value of $480,000 between October 2024 and March 2025. Of the 39 resales analysed by AreaSearch, there was an average gain on sale of $203,750 from an aggregate holding period of 9.3 years. This reflects an annual appreciation rate of 5.7% p.a., or a typical gain of $21,927 for each year held.
SELECT DATA
| id | Address | Suburb | Sale Price | Sale Date | Type |
|---|
id | Address | Suburb | Sale Price | Sale Date | Type |
|---|---|---|---|---|---|
| ANNE STREET | NARRABRI | 4,000,000 | 2025-02-20 | RESIDENCE | |
| 53 RIVERSIDE DRIVE | NARRABRI | 1,150,000 | 2025-01-20 | RESIDENCE | |
| 476 KAPUTAR ROAD | NARRABRI | 910,000 | 2025-02-17 | RESIDENCE | |
| 639 YARRIE LAKE ROAD | NARRABRI | 890,000 | 2024-11-18 | RESIDENCE | |
| 62 WHITING DRIVE | NARRABRI | 880,000 | 2024-11-05 | RESIDENCE | |
| 497 OLD GUNNEDAH ROAD | NARRABRI | 870,000 | 2025-01-23 | RESIDENCE | |
| 242 JACKS CREEK ROAD | NARRABRI | 780,000 | 2024-10-14 | RESIDENCE | |
| 17 MANNING STREET | NARRABRI | 770,000 | 2025-02-11 | RESIDENCE | |
| 5 BARWAN STREET | NARRABRI | 760,000 | 2024-12-17 | RESIDENCE | |
| 247 KAPUTAR ROAD | NARRABRI | 735,000 | 2024-11-19 | RESIDENCE |
Download the Latest 100 Sales
Click the button to download the most recent sales data for Narrabri in CSV format.
Note: Sale data NSW Valuer General analysed by AreaSearch
SELECT DATA
Source: NSW Valuer General transactions analysed by AreaSearch
Download the Sale Trends
Click the button to download the annual sales trends in CSV format.
Sales Trends FAQ
How many total sales records are available for Narrabri?
There are currently 0 total sales records that AreaSearch has analysed from the NSW Valuer General that fall within Narrabri that can be refined and searched, with 0 available across broader Rest of NSW.
Why is your analysis for Narrabri focused only on houses?
With attached properties repesenting only (3.7%) of overall sales activity in the past decade, the low level of activity can make detailed analysis unreliable given the market's dominance of detached dwellings.
What is the median sale price for houses in Narrabri as of 2024?
As of 2024, the median sale price for houses in Narrabri is $465,000.
How has the median sale price for houses changed in Narrabri over the last 10 years?
Over the last 10 years, from 2014 to 2024, the median sale price for houses in Narrabri increased by 55.0%, from $300,000 to $465,000. This represents a compound annual growth rate (CAGR) of 4.5%.
What is the median number of years properties are held between sales for houses in Narrabri?
As at 2024, houses are held for a median of 7.5 years.
What are the typical resale gains for houses in Narrabri?
As at 2024, the median gain over the prior sale for houses in Narrabri is $145,000.

Summary
Narrabri is a vibrant regional town located 404 kilometers north of the Sydney CBD, characterized by its diverse community and unique economic landscape. The area has experienced fluctuations in population growth, averaging just 0.6% over recent census periods, which reflects a broader trend of underperformance compared to Regional NSW. Despite this volatility, residents typically exhibit a standard age composition with varying levels of educational attainment.
One of Narrabri's standout features is its robust employment market, boasting one of the lowest unemployment rates in Australia. The local economy is largely driven by resource industries, particularly agriculture and cotton production, contributing to significant employment growth that ranks among the highest nationally. Additionally, Narrabri offers an array of qualitative attributes such as natural gas reserves and attractions like the Taronga Western Plains Zoo and Big Sky Observatory. With historic buildings and landmarks enriching its cultural fabric alongside modern sporting facilities, Narrabri presents a friendly community atmosphere complemented by a desirable rural lifestyle.
- Population Growth5%
- Development Activity17%
- Employment Drivers95%
- Income47%
- Age47%
- Education7%
- Transport & Access10%
- Cultural Diversity5%
- Health25%
- Housing Cost23%
- Rate Sensitivity22%
- Infrastructure Drivers59%

Very low unemployment

Mining driven employment

High utilities employment

Affordable housing options
FAQ
INFRA
AMENITY
TRANSPORT
SURROUNDS
GET REPORT
POPULATION
DEVELOPMENT
EMPLOYMENT
LAND USE
AGE
INCOME
EDUCATION
HEALTH
HOUSEHOLDS
DIVERSITY
HOUSING
FAQ
INFRA
AMENITY
TRANSPORT
SURROUNDS
GET REPORT
POPULATION
DEVELOPMENT
EMPLOYMENT
LAND USE
AGE
INCOME
Population
The area has shown very soft population growth performance across periods assessed by AreaSearch. Total population for Narrabri was estimated by AreaSearch to be approximately 6,974 as at February 25 (~49.5% male and 50.5% female), which represented a 1.4% increase from the 6,876 recorded as at the 2021 Census period. This is based upon an estimated resident population of 6,965 from the ABS up to June 2024 and an additional 4 validated new addresses since the Census date. This level of population equates to a density ratio of 39 persons per square kilometer, a level providing ample space per person.
Population growth for the area was primarily driven by natural growth that contributed approximately 65% of overall population gains during recent periods. Over the census periods assessed Narrabri underperformed Regional NSW across each timeframe in terms of growth with the location's growth profile showing a very high level of volatility with an average growth level in each 5yr census period of 0.5%.
Moving forward with demographic trends, lower quartile growth of Australian statistical areas is anticipated, with the area expected to expand by 19 persons to 2041 based on the latest population numbers, recording a gain of 0.3% in total over the 17 years.
GROWTH |
HEATMAP |
TABLE |
FORECAST |
GRAPHIC
Note: The above heatmap details the distribution of the catchment's population at a mesh block level (the smallest level of data produced by the ABS) as at the 2021 Census.
| Metric | Catchment | Regional NSW |
|---|---|---|
| Totals | ||
| - Latest Estimate @ February 25 | 6,974 | 2,915,142 |
| - ABS ERP Estimate @ June-24 | 6,965 | 2,922,081 |
| - Pop 2021 c | 6,876 | 2,829,637 |
| - Pop 2016 c | 7,175 | 2,643,535 |
| - Pop 2011 c | 6,918 | 2,512,950 |
| - Pop 2006 c | 6,914 | 2,419,769 |
| - Pop 2001 erp | 7,541 | 2,427,769 |
| Census Growth Rates | ||
| - 2016 to 2021 Growth | -299 (-4.2%) | 186,102 (7.0%) |
| - 2011 to 2016 Growth | 257 (3.7%) | 130,585 (5.2%) |
| - 2006 to 2011 Growth | 4 (0.1%) | 93,181 (3.9%) |
| - 2001 to 2006 Growth | -282 (-3.7%) | 58,760 (2.4%) |

Note: Population figures above are provided on both Census periods (c) and Estimated Resident Population (erp) basis. ERP figures are calculated annually by the ABS as at June 30 and have been adjusted for new Census boundaries with the 2021 Census. As figures differ slightly, growth rates over periods have been calculated using the same basis. For example 2016 to 2021 growth is based on available Census data, while 2001 to 2006 has used an ERP basis due to mesh block level Census data being unavailable.
AreaSearch is adopting ABS/Geoscience Australia projections for each SA2 area, as released in 2024 with 2022 as the base year. For any SA2 areas not covered by this data, AreaSearch is utilising the NSW State Government's SA2 level projections, as released in 2022 with 2021 as the base year. Growth rates by age group from these aggregations are also applied to all areas for years 2032 to 2041.
Employment
Total resident employment within Narrabri equated to 4,047 as at Dec-2024, while the unemployment rate was 2.2%, compared to 3.5% for Regional NSW (please note local unemployment rates are calculated on a trend basis and lag more up-to-date state figures released by the ABS). Total employment increased 6.9% over the year to Dec-2024 in Narrabri, while labour force increased 7.3%, causing the unemployment rate to rise 0.4% over the same period. These figures can be compared to Regional NSW's performance, where total employment increased 1.8%, the region's labour force increased 2.4% and its unemployment rate rose 0.6%. Also noteworthy is Narrabri's participation rate, which leads the Regional NSW average at 61.1%.
The interest rate tightening cycle from the RBA is now having an effect on job advertisements growth, a positive for lowering inflation expectations, with a moderation seen over the past year as advertised roles in the Tamworth and North West NSW employment region remained relatively stable. Looking relative to longer term trends however, the 9,308 job advertisements recorded as at 2025-Feb were slightly above the longer term average of 9,218.
The key industries of employment are health care & social assistance, retail trade and mining, which make up 13.0%, 9.7% and 9.0%, respectively.
Jobs and Skills Australia provides national projections of growth expected by industry over five and 10 year periods from May 2024, which can be overlaid onto Narrabri's employment composition to get a gauge as to potential future employment demand. Nationally employment levels are expected to grow by 6.6% over the coming five years and 13.7% over the ten year period, but vary substantially across industry segments. When industry expectations are applied to Narrabri as described above, the area should increase 5.8% over the five year period and 12.5% over the ten year period. Please note this is a simple weighting extrapolation for illustrative purposes and does not take into account localised population projections.
EMPLOYMENT |
UNEMPLOYMENT |
TABLE |
GRAPHIC
| Metric | Catchment | Regional NSW |
|---|---|---|
| Totals | ||
| - Labour Force | 4,136 | 1,476,658 |
| - Employment | 4,047 | 1,424,678 |
| - Unemployment | 89 | 51,980 |
| - Unemployment Rate | 2.2% | 3.5% |
| Employment Percentages by Industry | ||
| - Agriculture Forestry & Fishing | 7.4% | 5.3% |
| - Mining | 9.0% | 2.5% |
| - Manufacturing | 2.3% | 5.8% |
| - Utilities & Waste Services | 1.8% | 1.3% |
| - Construction | 7.6% | 9.7% |
| - Wholesale Trade | 2.4% | 2.0% |
| - Retail Trade | 9.7% | 9.8% |
| - Accommodation & Food Services | 7.1% | 7.8% |
| - Logistics | 5.4% | 3.9% |
| - IT & Telecommunication | 0.8% | 0.8% |
| - Finance & Insurance | 1.4% | 2.0% |
| - Rental & Real Estate | 1.2% | 1.3% |
| - Professional & Technical Services | 4.8% | 5.1% |
| - Administration and Support | 4.0% | 3.3% |
| - Public Admin and Safety | 7.7% | 7.5% |
| - Education & Training | 8.5% | 9.6% |
| - Healthcare & Social Assistance | 13.0% | 16.9% |
| - Arts & Recreation | 1.1% | 1.3% |
| - Other Services | 4.9% | 4.0% |
Note: ○ Employment estimates based on population weighted averaging of figures published for SA2 areas that intersect the catchment ~ DESE data released quarterly with 3 month time-lag ○ Additional AreaSearch population-weighted estimates and backdating applied to SA2 areas formulated as at 2021 Census
Development
Dwelling approval activity in Narrabri has been low for a number of years, as despite the area's current population of 6,974, only 9 approvals have been recorded on average over recent years.
With just 27 dwelling approvals in the past two financial years, the evident shortfall in new housing supply indicates a significant challenge in meeting future demand. With the population expected to increase by 20 people by 2041, around 10 new dwellings will be necessary. Recent approval levels appear more than sufficient to meet these forecasts, considering the census average of 2.1 persons per dwelling. This suggests that population growth may exceed trend projections in the coming years, supported by a robust housing supply.
Such low levels of approvals, in a populated area with clear underlying demand drivers, present a clear opportunity for residential developers, provided they are able to attain appropriate sites and planning approvals.
APPROVALS |
TABLE |
GRAPHIC
| Metric | Catchment | Regional NSW |
|---|---|---|
| Totals | ||
| - Average Dwelling Approvals (5yr) | 9 | 16,404 |
| - Commercial Approvals ($000's) | 15,140 | 6,350,124 |
| - Densification Percentile | 14 | 0 |
| - Approvals (Annualised) | 3 | 13,951 |
| - Last FY | 10 | 15,330 |
| - Prior FY | 17 | 16,178 |
| Composition | ||
| - Approvals Per 100 Persons | 0.2 | 0.5 |
| - Persons Per Dev Approval | 526 | 185 |
| - Population Growth Per Dev Approval | -13.1 | 4.4 |
Note: ○ Dwelling approval estimates based on population weighted averaging of figures published for SA2 areas that intersect the catchment ~ ABS data released monthly with 3 month time-lag ○ Additional AreaSearch population-weighted backdating applied to SA2 areas formulated as at 2021 Census ○ DA to population relativities to help in assessment of supply and demand levels within an area ~ Approvals per 100 people is calculated over the the past 2 financial years, while population growth per approval is based on the past five years (to ABS ERP periods) to smooth volatility in population growth trends.
Age
The median ages within Narrabri and the Regional NSW region sit at 39 and 43, respectively, with Narrabri's most over and under-represented age cohorts in comparison to the Regional NSW average being the 25 - 34 (14.0% of the total population) and 65 - 74 (10.8% of the total population) age groups.
Looking at population forecasts by age brackets, the majority of the population increase is expected within the 75 to 84 age group, which is projected to expand by 206 people.
COHORTS |
FORECAST |
TABLE |
GRAPHIC
| Metric | Catchment | Regional NSW |
|---|---|---|
| Median Age | 39 | 43 |
| Age Cohorts | ||
| - 0 to 4 | 444 (6.4%) | 165,581 (5.7%) |
| - 5 to 14 | 890 (12.8%) | 352,150 (12.1%) |
| - 15 to 24 | 795 (11.4%) | 336,408 (11.5%) |
| - 25 to 34 | 975 (14.0%) | 336,116 (11.5%) |
| - 35 to 44 | 821 (11.8%) | 348,943 (12.0%) |
| - 45 to 54 | 733 (10.5%) | 337,865 (11.6%) |
| - 55 to 64 | 844 (12.1%) | 367,600 (12.6%) |
| - 65 to 74 | 752 (10.8%) | 356,814 (12.2%) |
| - 75 to 84 | 537 (7.7%) | 231,171 (7.9%) |
| - 85 + | 187 (2.7%) | 82,499 (2.8%) |
Note: See population section for forecast methodology and references.
Income
As per AreaSearch's latest postcode level ATO data released for FY-22, the catchment's median income among taxpayers is $52,353, with an average of $62,145. This is below the national average and compares to Regional NSW's median of $49,459 and average of $62,998.
Looking at 2021 Census income data (that is provided on a median only basis and takes into account all residents) the median incomes within Narrabri stand at $1,558 for households, $2,040 for families and $820 for personal compared to Regional NSW's results of $1,434, $1,852 and $722 for the same metrics. The income bracket containing the largest proportion (~28.5% / 1,987 persons) of Narrabri's population is the $1,500 - 2,999 grouping, similarly to Regional NSW where 30.2% of the population fits into this bracket.
COHORTS |
TABLE |
GRAPHIC
| Metric | Catchment | Regional NSW |
|---|---|---|
| SEIFA Score | 3.0 | n.a |
| ATO Weighted Taxable Income @ FY-22 | ||
| Average Taxable Income | 62,145 | 62,998 |
| Median Taxable Income | 52,353 | 49,459 |
| Census Median Incomes ($/wk) | ||
| Individual Income ($/wk) | 820 | 722 |
| Household Income ($/wk) | 1,558 | 1,434 |
| Family Income ($/wk) | 2,040 | 1,852 |
| Census Household Income Cohorts ($/wk) | ||
| - $0 to $399 | 361 (12.4%) | 96,201 (8.4%) |
| - $400 to $799 | 627 (21.5%) | 270,600 (23.6%) |
| - $800 to $1,499 | 726 (24.9%) | 314,172 (27.4%) |
| - $1,500 to $2,999 | 832 (28.5%) | 345,818 (30.2%) |
| - $3,000 to $3,999 | 202 (6.9%) | 68,109 (5.9%) |
| - $4,000+ | 174 (5.9%) | 51,942 (4.5%) |
Note: ○ ATO taxable income data is released at postcode level anually, this is then population weighted and income balanced by AreaSearch. ○ Census income estimates based on population weighted averaging of Census data released for SA2 areas that intersect the catchment ○ Post-housing cost income estimates based on based on median income to median monthly housing cost ratios calculated at Census.
Household Structure
There was an approximate total of 2,879 households within Narrabri recorded at the 2021 Census. Median household size stands at 2.4, a figure in line with the Regional NSW average of 2.4. Of these households, 61.2% are families, 27.1% are lone persons, 2.5% are group households, while 9% are 'other' households. Based on our latest estimates (see the population section) the total number of households has likely grown to 2,920.
The household type standing out as most clearly under-represented is family households, with 61.2% of Narrabri's total households compared to 64.3% across Regional NSW. Meanwhile, of Narrabri's families, 26.3% are couples with no children, 23.3% are couples with children and 10.8% are single parent families, compared to 27.7%, 24.8% and 10.9% for Regional NSW. Of Narrabri's population, 36% have never been married while 45.7% are currently married, in contrast to Regional NSW's results of 34.3% and 45.6% for the same metrics. Further, Narrabri leads the Regional NSW average of 1.8 children per family, recording a figure of 2.
TABLE |
GRAPHIC |
FAMILIES GRAPHIC
| Metric | Catchment | Regional NSW |
|---|---|---|
| Totals | ||
| Total Households February 25 (est) | 2,920 | 1,181,258 |
| Total Households 2021c | 2,879 | 1,146,610 |
| Median Household Size | 2.4 persons | 2.4 persons |
| Household Cohorts | ||
| - Family Households | 1,788 (61.2%) | 737,500 (64.3%) |
| of which: | ||
| - Couple With Children | 417 (23.3%) | 182,900 (24.8%) |
| - Couple No Children | 470 (26.3%) | 204,067 (27.7%) |
| - One Parent Family | 194 (10.8%) | 80,683 (10.9%) |
| - Lone Person Households | 793 (27.1%) | 299,036 (26.1%) |
| - Group Households | 75 (2.5%) | 35,087 (3.1%) |
| - Other Households | 264 (9.0%) | 74,989 (6.5%) |
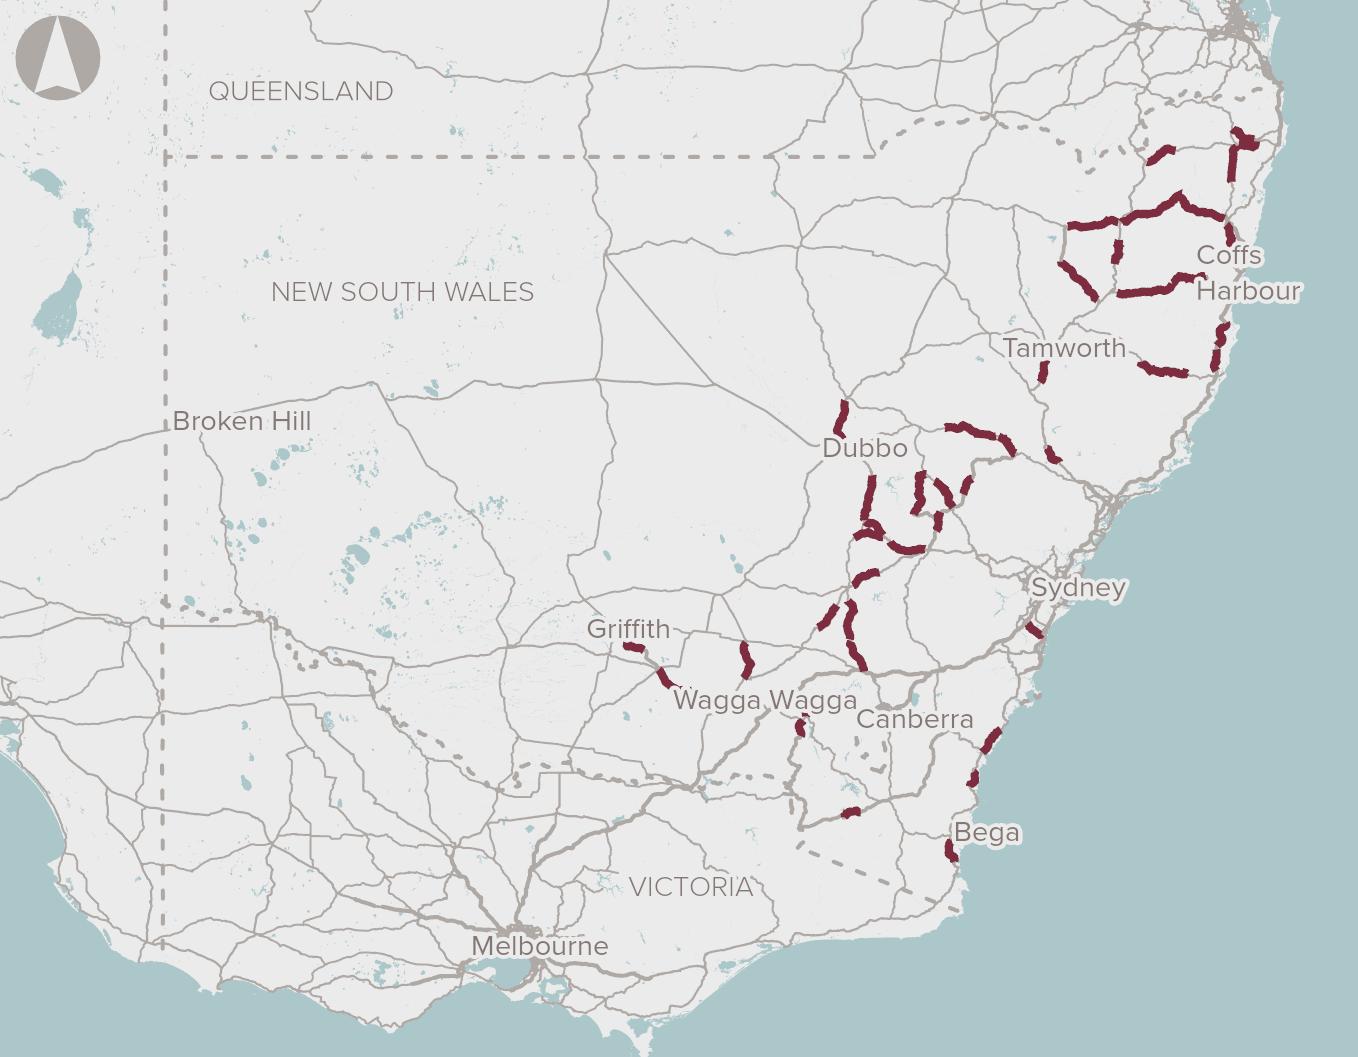
Infrastructure & Major Projects
The below list represents a summary of major planning, infrastructure and project announcements likely to impact upon the subject area. This data is compiled by AreaSearch from numerous sources for the benefit of our users, however, naturally, we can not guarantee to cover every project of interest. If there is a specific project you believe we have missed that warrants inclusion, please feel free to Contact Us and we will endeavour to incorporate your suggestion.
Narrabri Special Activation Precinct
Category: Communities, Precincts & Urban Renewal | Type: Major ProjectStage: Planning Source / Links: Link 1 Link 2 Admin ID: 3104
The precinct will attract employment and investment opportunities to the region, capitalising on Narrabris strategic location to Inland Rail, the Narrabri West Walgett Line and the Narrabri Northern NSW Inland Port.
Newell Highway Upgrade - Heavy Duty Pavement Upgrades
Category: Transport & Logistics | Type: Major ProjectStage: Under Delivery Source / Links: Link 1 Admin ID: 582
Upgrade four priority sections on Newell Highway between Narrabri and Moree with 27.3 km of new pavement, wider shoulders, intersection improvements, and five overtaking lanes.

Stoney Creek Bess
Category: Energy | Type: Major ProjectStage: Announced Source / Links: Link 1 Admin ID: 560
The Stoney Creek BESS is a 125 MW/1,000 MWh project in Narrabri, NSW, connecting to Transgrid's substation.

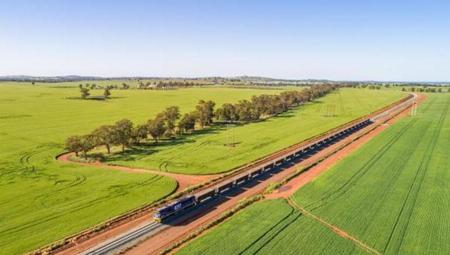
Inland Rail - Narrabri To North Star - Phase One
Category: Transport & Logistics | Type: Major ProjectStage: Operational Source / Links: Link 1 Admin ID: 521
The Inland Rail project's Narrabri to North Star section upgrades 185 km of rail and builds new tracks in NSW, including crossing loops and culverts, relocated utilities, and adjusted alignments.

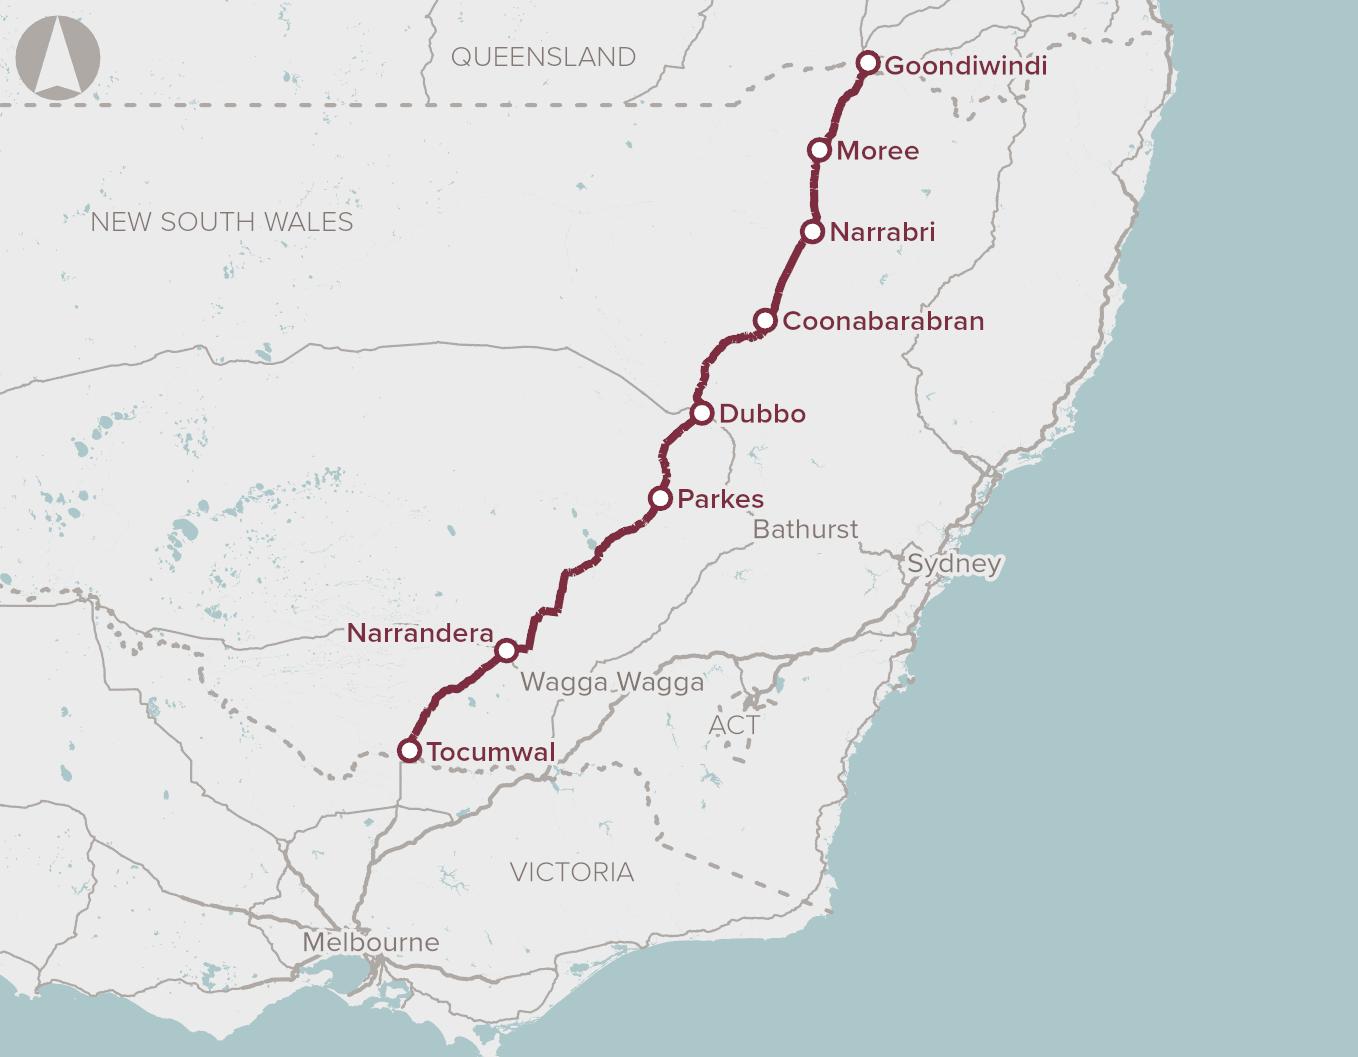
Inland Rail - Narromine To Narrabri
Category: Transport & Logistics | Type: Major ProjectStage: Awarded Source / Links: Link 1 Admin ID: 53
The Narromine to Narrabri section, pivotal in the Inland Rail Freight Corridor, covers 306 km of new railway, accommodating 1,800m double-stacked trains, with new bridges, viaducts, and infrastructure upgrades.
Nsw Renewable Energy Zones
Category: Energy | Type: Major ProjectStage: Announced Source / Links: Link 1 Admin ID: 234
The NSW Government plans to establish five Renewable Energy Zones, starting with Central-West Orana, followed by South-West, New England, Illawarra, and Hunter-Central Coast, aiming to boost renewable energy investment and necessitating transmission enhancements.

Newell Highway Upgrade
Category: Transport & Logistics | Type: Major ProjectSource / Links: Admin ID: 849
Upgrade of Newell Highway to enhance Melbourne-Brisbane freight route for safety, efficiency, and HPV access amidst growth in freight, tackling congestion, flooding, and road wear.
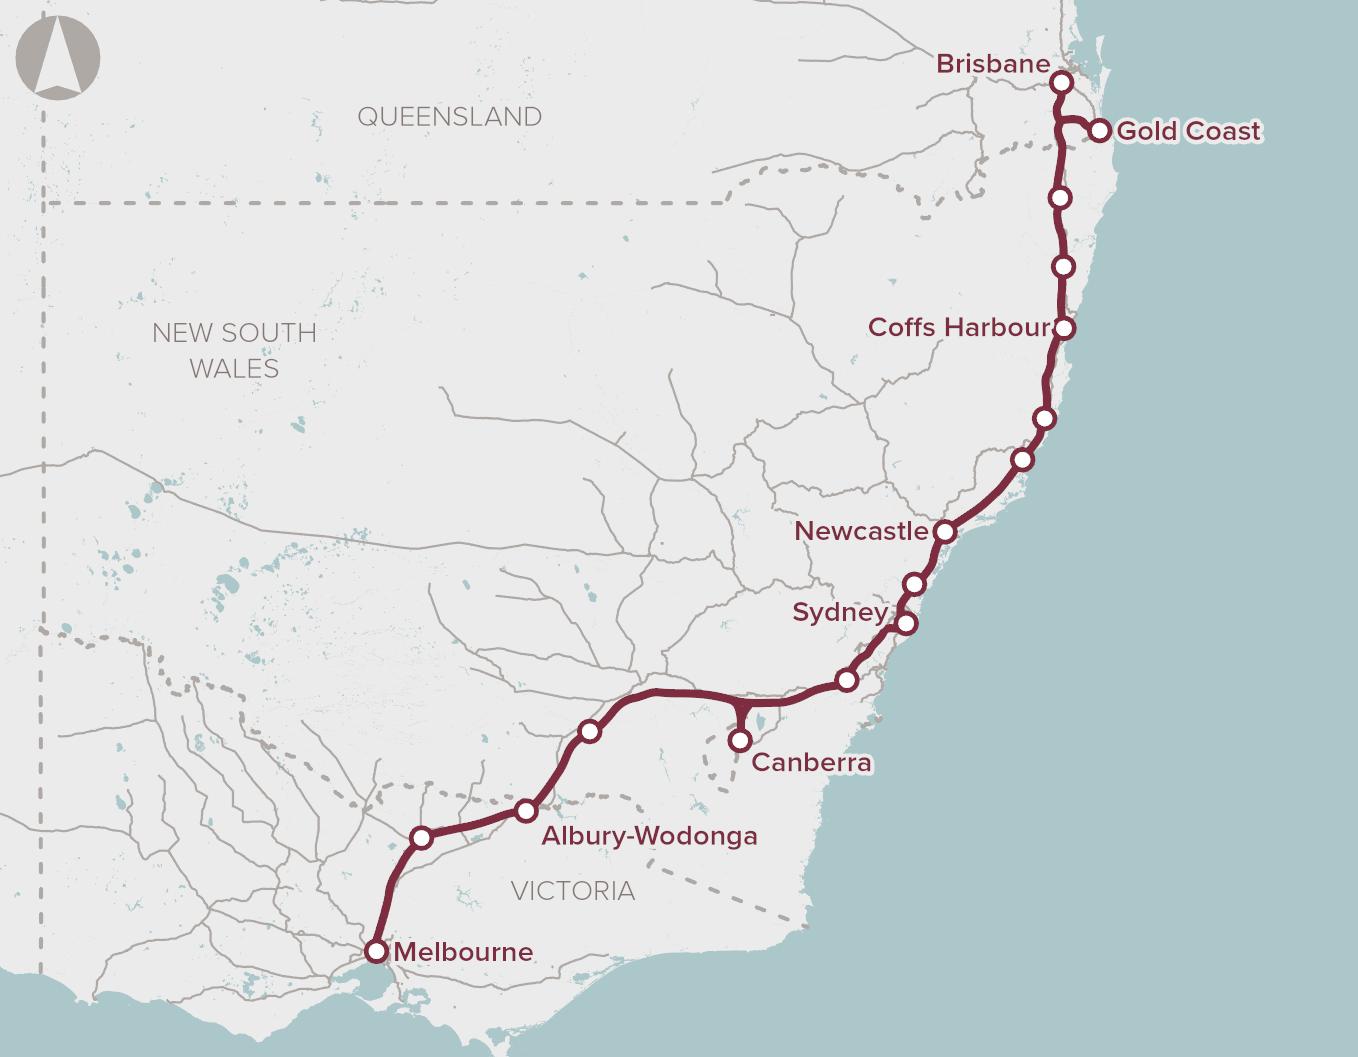
Corridor Preservation For East Coast High Speed Rail
Category: Transport & Logistics | Type: Major ProjectSource / Links: Admin ID: 862
Early-stage proposal for corridor preservation for a high-speed rail link between Melbourne, Sydney, and Brisbane to meet future travel demands, with a projected corridor cost of $2.8 billion.
Regional Nsw Road Network Safety Improvements
Category: Transport & Logistics | Type: Major ProjectSource / Links: Admin ID: 843
Enhancing safety on regional NSW roads through modern infrastructure technology and features at high-risk locations, aligned with national guidelines and targeting reductions in road fatalities and crashes.
Queensland New South Wales Interconnector
Category: Energy | Type: Major ProjectStage: Prospective Source / Links: Link 1 Admin ID: 693
The proposed Queensland New South Wales Interconnector (QNI Connect) aims to link New England's power to Queensland over approx. 600km, enhancing network capacity by up to 1,700 MW, with anticipated completion by FY2030-31.

Nsw Inland Rail Interface Improvements
Category: Transport & Logistics | Type: Major ProjectSource / Links: Admin ID: 726
Enhancing NSW regional rail's interoperability with Inland Rail to boost freight productivity and efficiency through infrastructure upgrades, targeting completion before 2027 for immediate benefits.

What is the latest population estimate for Narrabri?
Total population for Narrabri was estimated to be approximately 6,974 as at February 25. This is based upon an estimated resident population of 6,965 from the ABS up to June 2024 and an additional 4 validated new addresses since the Census date.
What is the ratio of males and females in Narrabri?
49.5% were recorded as male and 50.5% were identified as female as at the 2021 Census
How has the population in the Narrabri area changed since 2021?
Narrabri has added approximately 98 people and shown a slight 1.4% increase from the 6,876 people recorded at the 2021 Census period.
What is the population density in the Narrabri area?
The population density in the Narrabri area is estimated at 39 persons per square kilometer, this is based on the latest estimate for February 25 derived from a land area of 180.4sq km and population estimate of 6,974. At the 2021 Census the persons per square kilometer was estimated at 38.
What is the projected population growth in the Narrabri area?
Between 2024 and 2041, approximately 29 people are expected to be added, showing a projected growth rate of 0.42% in total, or an average of 0.02% per annum.
How much has the population grown in the Narrabri area over the past 10 years?
Over the past 10 years, on an ABS estimated resident population basis to June 2024 the population in the Narrabri area has grown by -348 people, which is a growth rate of -0.49% per annum.
How many dwelling approvals have occurred in the Narrabri area recently?
Dwelling approval activity in the Narrabri area has seen 27 residential approvals over the past two financial years, based on AreaSearch's SA2 aggregation method. Narrabri's current population of 6,974 has been supported by 9 approvals on average over recent years.
How does Narrabri's development activity compare to the broader region?
Narrabri has seen 0.19 approvals per 100 people in recent years, compared to 0.54 approvals in Regional NSW. This means that one dwelling has been approved for every 526 people in Narrabri, compared to one for every 185 in Regional NSW.
Is the Narrabri area keeping up with housing demand?
With the population expected to increase by 20 people by 2041, around 10 new dwellings will be necessary. Recent approval levels appear more than sufficient to meet these forecasts, considering the census average of 2.1 persons per dwelling. This suggests that population growth may exceed trend projections in the coming years, supported by a robust housing supply.
What has been the trend in development approvals over the past five years?
Looking at development activity over the past five years, Narrabri's approval levels have been above the yearly average of 9.
How many dwellings will be needed to accommodate future population growth?
The population in Narrabri is expected to grow by 20 people, necessitating approximately 10 new dwellings.
How does recent development compare to population growth in Narrabri?
Over the past five years, the population in Narrabri has grown by approximately -98 people, while 49 residential approvals were recorded. This equates to a ratio of -2 people added for each new dwelling approval.
Are there opportunities for residential developers in Narrabri?
With dwelling approval activity running at an average of 9 approvals per year and a population of 6,974, The market appears to be adequately supplied relative to projected housing demand in recent years, suggesting that developers should have a longer-term approach when considering new projects. With the population expected to increase by 20 people by 2041, around 10 new dwellings will be necessary. Recent approval levels appear more than sufficient to meet these forecasts, considering the census average of 2.1 persons per dwelling. This suggests that population growth may exceed trend projections in the coming years, supported by a robust housing supply.
What is the total employment in the Narrabri area?
As of Dec-2024, total employment in the Narrabri area was estimated at 4,047 according to AreaSearch's analysis of data from Jobs and Skills Australia.
What is the unemployment rate in the Narrabri area?
The unemployment rate in the Narrabri area as of Dec-2024 was estimated at 2.2%, compared to 3.5% in Regional NSW from Jobs and Skills Australia.
What is the participation rate in the Narrabri area?
The participation rate in the Narrabri area is 61.1%, which leads the Regional NSW average of 56.4% according to 2021 Census analysis.
How has employment changed in the past year in the Narrabri area?
Total employment in the Narrabri area has increased 6.9% over the past year, while the labor force has increased 7.3%, causing the unemployment rate to rise 0.4%.
What industry is most over-represented in the Narrabri area?
The most over-represented employment industry in Narrabri is mining, which makes up 9.0% of total employment compared to 2.5% in Regional NSW according to our analysis of 2021 Census Data.
Which industries are under-represented in the Narrabri area?
Health care & social assistance is under-represented in the Narrabri area, making up only 13.0% of the workforce compared to 16.9% in Regional NSW.
What are the key industries of employment in the Narrabri area?
The key industries of employment in the Narrabri area are health care & social assistance, retail trade and mining, which make up 13.0%, 9.7% and 9.0% of overall employment, respectively.
What is the median age in the Narrabri area?
According to the latest data, the median age in the Narrabri area is 39 years.
How does Narrabri's median age compare to the region?
The median age in the Narrabri area is 39 years, which is 4 years younger the median age of 43 years in the Regional NSW region.
What age groups are over-represented in the Narrabri area?
The most over-represented age group in the Narrabri area compared to the Regional NSW region is the 25 - 34 group, making up 14.0% of the population.
What age groups are under-represented in the Narrabri area?
The most under-represented age group in the Narrabri area compared to the Regional NSW region is the 65 - 74 group, making up 10.8% of the population.
Are there age groups with notable population variances?
No, the age distribution in the Narrabri area is broadly in line with the Regional NSW region.
What is the percentage of children (0-14 years) in the Narrabri area?
The percentage of children aged 0-14 years in the Narrabri area is 19.1%.
What is the percentage of older people (65+ years) in the Narrabri area?
The percentage of people aged 65 and over in the Narrabri area is 21.1%.
What is the median taxable income in the Narrabri area?
According to analysis of the latest ATO data as of FY-22, the median taxable income among taxpayers in the Narrabri area is estimated at $52,353.
What is the average taxable income in the Narrabri area?
According to analysis of the latest ATO data as of FY-22, the average taxable income among taxpayers in the Narrabri area is estimated at $62,145.
How does the median taxable income in Narrabri compare to the region?
The median taxable income in Narrabri is $52,353, while the median taxable income in Regional NSW is $49,459, according to the ATO data as of FY-22.
How does the average taxable income in Narrabri compare to the region?
The average taxable income in Narrabri is $62,145, while the average taxable income in Regional NSW is $62,998, based on the latest ATO data for FY-22.
What are the main income cohorts in the Narrabri area according to the 2021 Census?
As per the 2021 Census, the income bracket containing the largest proportion (~28.5% / 1,987 persons) of Narrabri's population is the $1,500 - 2,999 cohort.
How do the main income cohorts in Narrabri compare to the region?
The largest income cohort in Narrabri is the $1,500 - 2,999 group, representing about 28.5% of the population. In comparison, Regional NSW's largest income cohort is the $1,500 - 2,999 group, representing 30.2% of its population, according to the 2021 Census.
What is the median household income in the Narrabri area according to the 2021 Census?
The 2021 Census data indicates that the median household income in the Narrabri area is $1,558/wk.
What is the median family income in the Narrabri area according to the 2021 Census?
According to the 2021 Census, the median family income in the Narrabri area is $2,040/wk.
What is the median personal income in the Narrabri area according to the 2021 Census?
The 2021 Census shows that the median personal income in the Narrabri area is $820/wk.
How does Narrabri's income rank nationally?
AreaSearch's latest postcode level ATO data for FY-22 reveals that income in Narrabri is lower than average on a national basis, with the median assessed at $52,353 while the average income stands at $62,145. This contrasts to Regional NSW's figures of a median income of $49,459 and an average income of $62,998.
What percentage of the Narrabri area population holds a university-level qualification?
In the Narrabri area, 11.2% hold a Bachelor's degree, 1.2% hold a Graduate Diploma and 2.7% hold a Postgraduate qualification.
What percentage of the Narrabri area population holds a certificate or advanced diploma?
In the Narrabri area, 8.0% hold an Advanced Diploma and 30.9% hold a Certificate qualification.
What is the overall school attendance rate in the Narrabri area?
The overall school attendance rate in the Narrabri area is approximately 2.8% for preschool, 13.0% for primary school, 7.7% for secondary school, 3.3% for technical school and 2.3% for university.
What is the Narrabri area's overall education rank?
the Narrabri area ranks in the 7th percentile in terms of overall education performance on AreaSearch's analysis.
How many households are there in the Narrabri area?
There was an approximate total of 2,879 households within Narrabri at the 2021 Census. Based on our latest estimates (see the population section) the total number of households has likely grown to 2,920.
How does the median household size compare to the regional average?
The median household size in Narrabri is 2.4, which is in line with the regional average of 2.4.
What are the most common household types in Narrabri?
61.2% are families, 27.1% are lone persons, 2.5% are group households, while 9% are 'other' households. Based on our latest estimates (see the population section) the total number of households has likely grown to 2,920.
Which household type is most over or under-represented in Narrabri compared to the region?
The household type standing out as most clearly under-represented is family households, with 61.2% of Narrabri's total households compared to 64.3% across Regional NSW. Meanwhile, of Narrabri's families, 26.3% are couples with no children, 23.3% are couples with children and 10.8% are single parent families, compared to 27.7%, 24.8% and 10.9% for Regional NSW.
How many children per family are there in Narrabri compared to the regional average?
Narrabri leads the Regional NSW average of 1.8 children per family, recording a figure of 2.
What is the marriage status of Narrabri's population?
Of Narrabri's population, 36% have never been married while 45.7% are currently married, in contrast to Regional NSW's results of 34.3% and 45.6% for the same metrics.
What percentage of dwellings in the Narrabri area are houses?
According to the latest data, 84.4% of dwellings in the Narrabri area are houses.
What percentage of dwellings in the Narrabri area are semi-detached, apartments, or other types?
In the Narrabri area, 12.4% of dwellings are semi-detached, 1.1% are apartments and 2.1% are classified as 'other' dwellings.
What is the level of outright home ownership in the Narrabri area?
Outright home ownership in the Narrabri area stands at 34.2%.
What is the median monthly mortgage repayment in the Narrabri area?
The median monthly mortgage repayment in the Narrabri area is $1,443 according to the 2021 Census.
What is the median weekly rent in the Narrabri area?
The median weekly rent in the Narrabri area is $260 according to the 2021 Census.
How many people in the Narrabri area have private health insurance?
Around 50.6% of people in the Narrabri area are covered by private health insurance, which compares to 51.4% in the broader region of Regional NSW.
What percentage of the population requires ongoing medical assistance in the Narrabri area?
In the Narrabri area, 6.2% of the population is identified as requiring ongoing medical assistance. This figure is slightly different from the regional average, where 6.8% of people in Regional NSW require similar assistance.
How prevalent is asthma in the Narrabri area?
11.9% of people in the Narrabri area are diagnosed with asthma. In comparison, 10.6% of the population across Regional NSW is affected by asthma.
What percentage of people have diabetes in the Narrabri area?
Diabetes affects 6.7% of Narrabri population, while in the surrounding region, 5.9% of people are diagnosed with diabetes.
What is the percentage of people with heart disease in the Narrabri area?
5.3% of people in the Narrabri area have heart disease. Across the region of Regional NSW, 5.5% of the population is affected by heart disease.
How does Narrabri compare to the region in terms of overall private health coverage?
In the Narrabri area, 50.6% of the population are estimated to have private health insurance. Comparatively, Regional NSW sees an estimated private health coverage rate of 51.4%.
What is the level of cultural diversity in the Narrabri area?
Narrabri was found to be below average in terms of cultural diversity, with 94.5% of its population born in Australia, 90.1% being citizens and 96.5% speaking English only at home.
What is the most common religion in the Narrabri area?
The main religion in Narrabri was found to be Christianity, which makes up 64.6% of people in Narrabri. This compares to 55.6% across Regional NSW.
What are the top countries of origin in the Narrabri area?
In terms of country of origin, the top three represented groups in the Narrabri area are Australian, comprising 37.9% of the population, which is substantially higher than the regional average of 30.0%, English, comprising 28.3% of the population and Australian Aboriginal, comprising 10.6% of the population, which is substantially higher than the regional average of 4.5%.
How does the percentage of people born overseas compare to the regional average?
5.5% of Narrabri population was born overseas, compared to 13.0% regionally.
What percentage of Narrabri population speaks a language other than English at home?
3.5% of the population in Narrabri speaks a language other than English at home, compared to 7.1% in the wider region.
How many people in Narrabri identify as Australian Aboriginal?
10.6% of Narrabri population identifies as Australian Aboriginal, compared to 4.5% in the region.
What is the citizenship status of the population in Narrabri?
90.1% of Narrabri population holds citizenship, compared to 89.2% in the wider region.
Amenity
AreaSearch's amenity score assesses locational convenience by measuring the distance to closest access point and average distance to the nearest three access points, for critical community services. Please note for certain sectors this covers only major operators assessed regularly by AreaSearch. Amenity for the Narrabri population centre midpoint was found to be relatively middle-ground overall among non-metropolitan areas, particular standouts included banks and schools, while shopping centres and pharmacies lagged other categories in terms of convenience.
| Category | Number | Dist to 3 (km) |
|---|---|---|
| Supermarket | 2 | 12.86 km |
| Child Care | 8 | 1.39 km |
| GP | 4 | 1.61 km |
| Government Services | 10 | 2.01 km |
| Dentist | 2 | 29.14 km |
| Hospital | 1 | 28.1 km |
| Shopping Centre | 0 | 105.93 km |
| Banks | 4 | 1.55 km |
| Pharmacy | 2 | 12.71 km |
| Fitness Centre | 1 | 73.95 km |
| Schools | 4 | 1.26 km |
Schools
Amenity for schools in the area was high with the nearest operator located just 470 meters away from the location midpoint and the average distance to the nearest 3 operators standing at 1.26 kilometers according to AreaSearch's analysis. There were 4 schools operating within the specific catchment area assessed based on latest adopted data.
For a detailed assessment of schools within the catchment area, please refer to the education tab. For specialized reports or consultancy services, please Contact Us for further information.
Amenity for supermarkets in the area was moderate with the nearest operator located approximately 1.72 kilometers away from the location midpoint and the average distance to the nearest 3 operators standing at 12.86 kilometers according to AreaSearch's analysis. There were 2 supermarkets operating within the specific catchment area assessed based on latest adopted data.
Please be aware that the supermarket assessment primarily relies on simple distance metrics and may not fully capture demand and supply dynamics. See HERE for benchmarks or for a comprehensive evaluation that includes micro-level population statistics, adjusted competition catchments, and retail expenditure estimates, as well as information on major nearby competing and complementary retailers, we recommend accessing the detailed Retail section within MicroSearch. Alternatively, Contact Us for more information on obtaining sector access, detailed reports, or consulting services.
Amenity for child care centres in the area was moderate with the nearest operator located approximately 1.10 kilometers away from the location midpoint and the average distance to the nearest 3 operators standing at 1.39 kilometers according to AreaSearch's analysis. There were 8 child care centres operating within the specific catchment area assessed based on latest adopted data.
Note that our analysis of the Child Care amenities is based on straightforward distance measurements and does not address the full complexities of demand and supply. See HERE for benchmarks, or for specific insights into available spots, child-to-space ratios, proximity to schools, age of centers, and pricing details, please consult the Child Care section of MicroSearch. If further assistance is needed, Contact Us to discuss sector access, report customization, or our consulting services.
Amenity for general practitioners in the area was high with the nearest operator located approximately 1.45 kilometers away from the location midpoint and the average distance to the nearest 3 operators standing at 1.61 kilometers according to AreaSearch's analysis. There were 4 gp clinics operating within the specific catchment area assessed based on latest adopted data.
While our GP amenity assessment is informative, it is based only on proximity and might not adequately reflect market demand and supply conditions. For an in-depth analysis that includes data on private health insurance coverage, Medicare benefits scheme spending, and other relevant metrics across all significant medical service providers, professional plan users with sector access should view the Medical section within MicroSearch. For additional resources, Contact Us.
Amenity for government service locations in the area was very high with the nearest operator located approximately 1.64 kilometers away from the location midpoint and the average distance to the nearest 3 operators standing at 2.01 kilometers according to AreaSearch's analysis. There were 10 government service locations operating within the specific catchment area assessed based on latest adopted data.
Government services encompass a variety of facilities like post offices and Services Australia Centres. It's important to note that our location-based analysis may not adequately reflect the actual demand and supply. For a deeper dive into micro-level demographics, adjusted catchment areas, and spending behaviors, those with access should view the Retail analysis section within MicroSearch or Contact Us for more detailed access or personalized consulting.
Amenity for dental clinics in the area was quite low with the nearest operator located approximately 1.57 kilometers away from the location midpoint and the average distance to the nearest 3 operators standing at 29.14 kilometers according to AreaSearch's analysis. There were 2 dental clinics operating within the specific catchment area assessed based on latest adopted data.
Please consider that our distance-based assessment of dental clinics might not capture all dimensions of market demand and supply. For a more nuanced analysis that covers aspects like insurance coverage and spending within the dental sector, view the Medical section on MicroSearch. Should you require further information, Contact Us to access more detailed data or consultation services.
Amenity for hospitals in the area was moderate with the nearest operator located just 1.63 kilometers away from the location midpoint and the average distance to the nearest 3 operators standing at 28.10 kilometers according to AreaSearch's analysis. A single hospital was assessed as operating within the specific catchment area.
The assessment of hospital amenities provided here focuses on simple distance metrics and might not be sufficient for comprehensive demand and supply analysis. For detailed insights into hospital capacities, procedure volumes, waiting times, and broader health coverage metrics, visit the Medical section of MicroSearch. For further inquiries, Contact Us.
Amenity for shopping centres in the area was quite low with the nearest operator located approximately 83.83 kilometers away from the location midpoint and the average distance to the nearest 3 operators standing at 105.93 kilometers according to AreaSearch's analysis. There were no shopping centres operating within the specific catchment area based on the latest surveryed data.
Please note that, while hopefully useful, the shopping centre amenity here is based on a simple distance assessment and is insufficient for demand and supply analysis. For a detailed analysis that considers micro-level population counts, effective (competition-adjusted) catchments, retail spending estimates, and all major nearby retailers, both competing and complementary, please see the Retail section within MicroSearch for those with access. Alternatively Contact Us to inquire about sector access, reports, or consulting services.
Amenity for banks in the area was very high with the nearest operator located approximately 1.50 kilometers away from the location midpoint and the average distance to the nearest 3 operators standing at 1.55 kilometers according to AreaSearch's analysis. There were 4 banks operating within the specific catchment area assessed based on latest adopted data.
Amenity for pharmacies in the area was quite low with the nearest operator located approximately 1.56 kilometers away from the location midpoint and the average distance to the nearest 3 operators standing at 12.71 kilometers according to AreaSearch's analysis. There were 2 pharmacies operating within the specific catchment area assessed based on latest adopted data.
Please note that, while hopefully useful, the pharmacy amenity referenced here is based on a simple proximity assessment and is insufficient for demand and supply analysis. Pharmacies are covered across both our retail and medical category analysis enabling effective population catchment analysis and demand and supply analysis for all major primary and allied health provider types. Those with access should see the relevant sections within MicroSearch. Alternatively Contact Us to inquire about sector access, required reports, or consulting services.
Amenity for fitness centres in the area was quite low with the nearest operator located just 1.40 kilometers away from the location midpoint and the average distance to the nearest 3 operators standing at 73.95 kilometers according to AreaSearch's analysis. A single fitness centre was assessed as operating within the specific catchment area.
The current assessment of fitness centres is limited to proximity to major operators and lacks a detailed supply and demand analysis. For a thorough evaluation that considers demographic specifics and market competition, please refer to the Retail section of MicroSearch. For direct inquiries, Contact Us.
Amenity for schools in the area was high with the nearest operator located just 470 meters away from the location midpoint and the average distance to the nearest 3 operators standing at 1.26 kilometers according to AreaSearch's analysis. There were 4 schools operating within the specific catchment area assessed based on latest adopted data.
For a detailed assessment of schools within the catchment area, please refer to the education tab. For specialized reports or consultancy services, please Contact Us for further information.
Aged Care & SDA
AGED CARE MAP |
SDA FACILITIES |
DATA TABLES
| Id | Name | Address | Type | Places | Dist (Km) |
|---|
Note: ○ Places for retirement villages represent individual dwellings. Not all dwelling numbers are available at present.
| Name | Suburb | Build Type | NDIS Design | Rooms | Max Price / Rm |
|---|
Note: ○ Exact locations are not provided for NDIS facilities, the above list represents registered facilities in each suburb covered by the catchment
Retail Analysis
MAJOR BRANDS |
SPENDING |
INCOME |
MACRO
Education
The education ranking in the area was low, based on AreaSearch's broad range of educational achievement and performance statistics. 15.1% of residents in Narrabri have completed bachelor or postgraduate qualifications which is materially below the 21.3% recorded for Regional NSW, while 23.5% of the resident population reported to be attending school between pre-school and secondary level, while 3.3% were attending a technical college and 2.3% attending university.
There were a total of 4 schools identified in Narrabri, with a total attendance of approximately 1,256 students. The average ICSEA score (which bases off a national average of 1000) equated to 898, which is marginally under the average seen across Regional NSW of 960.
SCHOOLS |
TABLE |
GRAPHIC
| Id | Name | Type | Places | ICSEA | Dist (Km) | URL |
|---|
Id | Name | Type | Places | ICSEA | Dist (Km) | URL |
|---|---|---|---|---|---|---|
| Narrabri High School | Secondary | 448 | 873 | 2.75 | Link | |
| St Francis Xavier's Primary School | Primary | 291 | 995 | 3.30 | Link | |
| Narrabri Public School | Primary | 255 | 830 | 3.56 | Link | |
| Narrabri West Public School | Primary | 262 | 896 | 3.89 | Link |
| Metric | Catchment | Regional NSW |
|---|---|---|
| Highest Education Level Achieved | ||
| Reports Post-School Qualifications (15yrs+) | 54.1% | 60.9% |
| - Post Graduate Degree | 2.7 | 4.4 |
| - Graduate Diploma / Certificate | 1.2 | 2.3 |
| - Bachelor Degree | 11.2 | 14.6 |
| - Advanced Diploma | 8.0 | 10.5 |
| - Technical Certificate | 30.9 | 29.2 |
| Attending an Institution | ||
| Total Attending Percentage | 29.9 | 28.9 |
| of which: | ||
| - Attending Preschool | 2.8 | 2.7 |
| - Attending Primary School | 13.0 | 10.3 |
| - Attending Secondary School | 7.7 | 8.0 |
| - Attending Technical Institution | 3.3 | 3.2 |
| - Attending University | 2.3 | 4.0 |
| - Attending Other Institution | 0.8 | 0.7 |
Note: ○ School places and ICSEA performance based on latest ACARA data ○ Student and qualification splits based on population weighted averaging of Census data released for SA2 areas that intersect the catchment. * Estimated resident student population includes those attending tertiary education
Housing
Dwelling structure within Narrabri, as evaluated at the latest Census, comprised 84.4% houses and 15.6% other dwellings (semi-detached, apartments, 'other' dwellings), in comparison to Regional NSW's 81.8% houses and 18.2% other dwellings. Meanwhile, the level of home ownership within Narrabri was lagging that of Regional NSW, at 34.2%, with the remainder of dwellings either mortgaged (31.7%) or rented (34.2%). The median monthly mortgage repayment in Narrabri was below the Regional NSW average at $1,443, while the median weekly rent figure was recorded at $260, compared to Regional NSW's $1,733 and $330.
TABLE |
GRAPHIC
| Metric | Catchment | Regional NSW |
|---|---|---|
| Structures | ||
| - House | 84.4% | 81.8% |
| - Semi Detatched | 12.4% | 10.1% |
| - Apartments | 1.1% | 6.6% |
| Ownership | ||
| - Owned Outright | 34.2% | 39.7% |
| - Mortgaged | 31.7% | 32.2% |
| - Renting | 34.2% | 28.1% |
| Costs | ||
| Median Morgage Cost ($/mo) | $1,443 | $1,733 |
| Median Rental ($/wk) | $260 | $330 |
| - 0 to 149 ($/wk) | 8.0% | 8.1% |
| - 150 to 349 ($/wk) | 60.6% | 44.5% |
| - 350 to 649 ($/wk) | 31.0% | 43.5% |
| - 650 to 949 ($/wk) | 0.4% | 3.2% |
| - 950+ ($/wk) | 0.0% | 0.8% |
| Aggregate Housing Cost ($/mo) | $842 | $959 |
Diversity
Narrabri was found to be below average in terms of cultural diversity, with 94.5% of its population born in Australia, 90.1% being citizens, and 96.5% speaking English only at home.
The main religion in Narrabri was found to be Christianity, which makes up 64.6% of people in Narrabri. This compares to 55.6% across Regional NSW. In terms of country of origin, the top three represented groups in Narrabri area are Australian, comprising 37.9% of the population, which is substantially higher than the regional average of 30.0%, English, comprising 28.3% of the population, and Australian Aboriginal, comprising 10.6% of the population, which is substantially higher than the regional average of 4.5%.
TABLE |
GRAPHIC
| Metric | Catchment | Regional NSW |
|---|---|---|
| Culture | ||
| - Australian Born | 94.5% | 87.0% |
| - O/S Born | 5.5% | 13.0% |
| - Australian Citizen | 90.1% | 89.2% |
| - English Only | 96.5% | 92.9% |
| - Second Language At Home | 3.5% | 7.1% |
| Religion | ||
| - Buddhism | 0.5% | 0.8% |
| - Christian | 64.6% | 55.6% |
| - Hinduism | 0.5% | 0.8% |
| - Islam | 0.2% | 0.8% |
| - Judaism | 0.0% | 0.1% |
Health
Health performance in Narrabri is lower than average with prevalence of common health conditions notable across both younger and older age cohorts and the rate of private health cover was found to be relatively low at approximately 51% of the total population (~3,529 people). The most common medical conditions in the area were found to be asthma and arthritis, impacting 11.9 and 11.7% of residents, respectively, while 63.3% declared themselves as completely clear of medical ailments compared to 63.3% across Regional NSW. Overall 6.2% of the total population registered as requiring assistance with day to day activities, which is a higher than average .
For a far more detailed assessment of health metrics and drivers, including detailed hospital supply, admission and procedure data, Medicare expenditure across cohorts, practitioner locations, relativities and expenditure forecasts please see the medical section or enquire about access.
TABLE |
GRAPHIC
| Metric | Catchment | Catchment 65+ | Regional NSW | Regional NSW 65+ |
|---|---|---|---|---|
| General | ||||
| - Need for Assistance | 6.2% | n.a. | 6.8% | n.a. |
| - Private Health Cover Rate | 50.6% | n.a. | 51.4% | n.a. |
| Long Term Health Conditions | ||||
| - Zero L/T Health Conditions | 63.3% | 31.4% | 63.3% | 33.1% |
| - One Long Term Condition | 24.6% | 35.3% | 23.7% | 32.2% |
| - Two Long Term Conditions | 8.1% | 18.9% | 8.3% | 18.0% |
| - 3+ Long Term Conditions | 4.0% | 14.3% | 4.7% | 13.7% |
| Individual Conditions Detail | ||||
| - Arthritis | 11.7% | 35.0% | 12.8% | 35.3% |
| - Asthma | 11.9% | 9.9% | 10.6% | 10.4% |
| - Cancer | 3.7% | 11.0% | 4.0% | 11.5% |
| - Demential / Alzheimers | 1.3% | 6.0% | 1.1% | 4.4% |
| - Diabetes | 6.7% | 17.0% | 5.9% | 15.1% |
| - Heart Disease | 5.3% | 18.4% | 5.5% | 17.9% |
| - Kidney Disease | 1.5% | 5.1% | 1.4% | 4.2% |
| - Lung Condition | 2.6% | 8.7% | 2.8% | 8.4% |
| - Mental Health Issue | 9.1% | 7.9% | 11.7% | 9.3% |
| - Stroke | 1.3% | 3.4% | 1.3% | 4.3% |
| - Other Condition | 7.7% | 13.3% | 9.3% | 13.2% |
Note: ○ Private health cover estimated from percentile ranges of taxable income to private health coverage ratios by the ATO.
Land Use
There are a total of eight different land-use categories across Narrabri's 180.4 Sqkm land-mass, the most prominent being primary production, other and residential, which make up approximately 136.2 (75.5%), 30.3 (16.8%) and 7.5 (4.2%), Sqkm of land, respectively. Please note; totals and percentages based on sum of categorised mesh blocks that fall within Narrabri as opposed to total Narrabri land area - minor differences may exist between land-use category totals and total land area, as mesh blocks at the edges of Narrabri are unlikely to intersect perfectly along Narrabri boundary.
CHART |
MAP
Surrounds
Enter Search Term
The surrounds feature enables AreaSearch clients to quickly assess the catchment for nearby places of interest via our integration with the Google Places API.
Up to 60 results per search category can be attained. Please input, or select, a term to search. Please note 5 account credits are used per 100 results returned from this search, which accumulates on your account due to 3rd party data costs.
| Type | Name | Address | Distance | In Catch | G-Map | G-Search | Display |
|---|
Public Transport & Access
STOPS MAP | GRAPHIC

Total Stops

Trips

Routes / Wk

Population / Stop

Population / Trip

Population / Route

Avg Dist of Stops

Res Distance
Catchment / Regional NSW Avg
| Type | Name | Distance | Routes | Trips / Wk |
|---|
Child Care Analysis
| Id | Name | Type | Places | Approval | Distance (Km) | Day Rate | Availability |
|---|
Key Metrics
Catchment / Regional NSW

LDC Providers

Total LDC Places

Total Population

Persons Per Place

Persons Per Place (Comm Adj)

Population Aged 0-4

Pop Aged 0-4 Per LDC Place

Pop Aged 0-4 Per LDC Place (Comm Adj)

Total School Attendance

School Places Per LDC Place

Average LDC Fee($/day)

Other Places (PSK / OOSH)
Medical Analysis
MAP DATA |
SUPPLY RELATIVITIES |
MBS DEMAND DATA |
SUMMARY TEXT
| Map Ref | Name | Address | Services | Dist |
|---|
| Category | Count | Closest | Population Per | Avg Dist | Reg Pop Per | Reg. Avg Dist |
|---|
| Category | Count | Closest | Population Per | Pop. Per Comm Adj | Avg Dist | Reg Pop Per | Reg. Avg Dist |
|---|
Overview
Medical Services
Medical MBS Spending
SUMMARY TABLES
| POPULATION AGE SPLITS | 0-24 | 25-44 | 45-64 | 65+ | Total |
|---|---|---|---|---|---|
| 2022 Est | 888 | 123 | 123 | 123 | 123 |
| 2041 Fcst | 888 | 123 | 123 | 123 | 123 |
| Growth Fcst | 10% | 10% | 10% | 10% | 10% |
| Growth Rate | 10% | 10% | 10% | 10% | 10% |
| POPULATION GROWTH HISTORY | Catchment | Region | |||
|---|---|---|---|---|---|
| Growth From Census | 500 | 600 | |||
| 2016 to 2021 Growth | 500 | 600 | |||
| 2011 to 2016 Growth | 500 | 600 | |||
| 2006 to 2011 Growth | 500 | 600 | |||
| Metric | Catchment | Catchment 65+ | Regional NSW | Regional NSW 65+ |
|---|---|---|---|---|
| General | ||||
| - Need for Assistance | 6.2% | n.a. | 6.8% | n.a. |
| - Private Health Cover Rate | 50.6% | n.a. | 51.4% | n.a. |
| Long Term Health Conditions | ||||
| - Zero L/T Health Conditions | 63.3% | 31.4% | 63.3% | 33.1% |
| - One Long Term Condition | 24.6% | 35.3% | 23.7% | 32.2% |
| - Two Long Term Conditions | 8.1% | 18.9% | 8.3% | 18.0% |
| - 3+ Long Term Conditions | 4.0% | 14.3% | 4.7% | 13.7% |
| Individual Conditions Detail | ||||
| - Arthritis | 11.7% | 35.0% | 12.8% | 35.3% |
| - Asthma | 11.9% | 9.9% | 10.6% | 10.4% |
| - Cancer | 3.7% | 11.0% | 4.0% | 11.5% |
| - Demential / Alzheimers | 1.3% | 6.0% | 1.1% | 4.4% |
| - Diabetes | 6.7% | 17.0% | 5.9% | 15.1% |
| - Heart Disease | 5.3% | 18.4% | 5.5% | 17.9% |
| - Kidney Disease | 1.5% | 5.1% | 1.4% | 4.2% |
| - Lung Condition | 2.6% | 8.7% | 2.8% | 8.4% |
| - Mental Health Issue | 9.1% | 7.9% | 11.7% | 9.3% |
| - Stroke | 1.3% | 3.4% | 1.3% | 4.3% |
| - Other Condition | 7.7% | 13.3% | 9.3% | 13.2% |
| MBS DEMAND | Catchment | Region | |||
|---|---|---|---|---|---|
| All Ages | 65+ | All Ages | 65+ | ||
| GP Services per 100 | TBC | TBC | TBC | TBC | |
| GP Fees Per 100 | TBC | TBC | TBC | TBC | |
| Allied Services per 100 | TBC | TBC | TBC | TBC | |
| Allied Fees Per 100 | TBC | TBC | TBC | TBC | |
| AREA DRIVERS | Catchment | Percentile | |||
|---|---|---|---|---|---|
| Private Health Cover (% of Population) | TBC | TBC | |||
| SEIFA ranking - Income | TBC | TBC | |||
| SEIFA ranking - Education | TBC | TBC | |||
| Median Household Income | TBC | TBC | |||
| University Graduate % | TBC | TBC | |||
| Commercial / Residential Adjustment | TBC | TBC | |||
| Residential Development Activity (Per 100) | TBC | n.a. | |||
| Transport Activity (Pop per Trip) | TBC | TBC | |||
MBS DEMAND
| Category | Statistic | Cohort | Catchment | Region |
|---|

GENERATE REPORT

PPT / WORD
EXCEL
Please use the below form to get in touch
Join Browser
The Browser Plan provides access to the AreaSearch system for a single user, enabling area views and downloads in PDF format for quick and effective analysis and comparison of local markets. The 150 plan credits can be used at anytime throught the year.

Session Timeout Warning
Your session is about to expire in 30 seconds. Would you like to extend your session?

Join Pro
The Professional Plan provides access to the AreaSearch system for up to 5 users, enabling custom area analysis, downloads in PowerPoint that can be edited and recoloured to suit specific reporting needs, full economic dataset downloads and more. TargetSearch access is included within the annual plan and sector access can be added upon request.
$150/mo
150 credits per month
Cancel anytime
Plus GST
$1000/yr
1500 credits per year
Includes Target Search
Plus GST

Pro Monthly