
estimated as @ February 25 *
ABS ERP | 14,995 people | June 2024
2.2 Land Area (SqKm)6,867 Pop Density (P/SqKm)
2021 Census
13,034 People
15.1% Growth from 2016c
5,713 Dwellings
2.3 Persons Per Dwelling
2016 Census
11,323 People
17.8% Growth from 2011c
4,339 Dwellings
The following analysis is undertaken for the Kogarah (SA2) area. Based on AreaSearch's analysis, Kogarah's population is around 15,107 as of February 25. This reflects a significant 15.9% rise since the 2021 Census, which reported a population of 13,034 people. The change can be attributed to an estimated resident population of 14,995 from the ABS up to June 2024 and an additional 506 validated new addresses since the Census date. Given the location's 2.2sq km land mass, Kogarah possesses an estimated population density of 6,867 persons per square kilometre, with the 2021 Census showing 2.3 persons per dwelling.
About the Area
The location of Kogarah in NSW, Australia is well-regarded for its striking blend of natural beauty and urban conveniences. With serene parks, exquisite waterfronts, and pristine beaches adorning the area, residents and visitors can partake in both leisurely strolls and more engaging recreational activities. The vibrant community is also rich in culture and history, with various heritage sites and diverse culinary offerings. Excellent educational institutions, modern hospitals, and well-planned public transportation lines offer a high quality of life to those residing in this picturesque haven.

Segmentation & Links
The Area's CompositionThe suburb of Kogarah hosts the entirety of the catchment's population, while Kogarah was found to be the only SA2 area falling within its bounds. Meanwhile, Georges River and Bayside are the two Local Government Areas that intersect the catchment.
["10658180000","10658200000","10659120000","10659130000","10659140000","10659310000","10659320000","10659420000","10659650000","10659900000","10660880000","10660920000","10660960000","10660970000","10660980000","10660990000","10661000000","10663580000","10663811000","10663812000","10663813000","10663830000","10664432000","10664440000","10665240000","10665250000","10665260000","10665520000","10665910000","10665920000","10665940000","10666120000","10666230000","10667531000","10667532000","10667540000","10668250000","10668260000","10668270000","10668490000","10668500000","10668510000","10669020000","10669030000","10669200000","10669210000","10669740000","10669750000","10669810000","10669820000","10669830000","10669840000","10670150000","10670423000","10994740000","11204462600","11204815500","11204971300","11205529200","11205529400","11205529500","11205866500","11208620000","10409320000","10409340000","10409360000","10409390000","10409400000","10409460000","10409760000","10409770000","10409780000","10409790000","10409810000","10409822000","10409830000","10409840000","10409851000","10409852000","10409860000","10409891000","10409892000","10409901000","10409910000","10409920000","10409930000","10409950000","10409972000","10409980000","10409990000","10410002000","10410003000","10410011000","10410012000","10410032000","10410033000","10410040000","10410090000","10410100000","10410110000","10410120000","10410131000","10410132000","10410133000","10410134000","10410140000","10410160000","10410180000","10410190000","10410200000","10410230000","10410240000","10410250000","10410610000","10410620000","10415750000","11017560000","11017570000","11017580000","11017590000","11017670000","11017680000","11204460500","11204460600","11204460700","11204468500","11204468600","11204469800","11204471000","11204471100","11204472500","11204472600","11204473100","11204473600","11204715100","11204715300","11204761500","11204761600","11204761700","11204800500","11204879400","11204948800","11204971400","11205529300","11205529600","11205640400","11205866600","11214420000","11237790000","11237810000"]STATISTICAL 2 |
LOCAL GOVERNMENT |
SUBURBS
| SA2 | Analysis Page | ABS Link | Persons 2016c | Persons 2021c | est. February 25 | Catchment % | View |
|---|
SA2 | Analysis Page | ABS Link | Persons 2016c | Persons 2021c | est. February 25 | Catchment % | View |
|---|---|---|---|---|---|---|---|
| Kogarah | Link | 11,323 | 13,034 | 15,107 | 100.0 |
Note: Persons shown represent those falling within the catchment, not necessarily the full SA2.
Note: Persons shown represent those falling within the catchment, not necessarily the full LGA.
| Suburb | AS Pages | Persons 2016c | Persons 2021c | est. February 25 | Catchment % | View |
|---|
Suburb | AS Pages | Persons 2016c | Persons 2021c | est. February 25 | Catchment % | View |
|---|---|---|---|---|---|---|
| Kogarah | Child Care | 11,323 | 13,034 | 15,107 | 100.0 |
Note: Persons shown represent those falling within the catchment, not necessarily the full suburb.

Transactions & Housing Trends
TRANSACTIONS | TRENDSOf the 50 residential sales shown in the suburb of Kogarah the average sale value equated to $1,792,968 with a median value of $892,000 between December 2024 and March 2025. Of the 37 resales analysed by AreaSearch, there was an average gain on sale of $890,251 from an aggregate holding period of 9.6 years. This reflects an annual appreciation rate of 6.1% p.a., or a typical gain of $92,996 for each year held.
SELECT DATA
| id | Address | Suburb | Sale Price | Sale Date | Type |
|---|
id | Address | Suburb | Sale Price | Sale Date | Type |
|---|---|---|---|---|---|
| 22 VICTORIA STREET | KOGARAH | 8,800,000 | 2025-01-07 | RESIDENCE | |
| 20 VICTORIA STREET | KOGARAH | 8,800,000 | 2025-01-07 | RESIDENCE | |
| 24 A VICTORIA STREET | KOGARAH | 8,800,000 | 2025-01-07 | RESIDENCE | |
| 24 A VICTORIA STREET | KOGARAH | 8,800,000 | 2025-01-07 | RESIDENCE | |
| 18 VICTORIA STREET | KOGARAH | 8,800,000 | 2025-01-07 | RESIDENCE | |
| 4 MARSHALL STREET | KOGARAH | 3,000,000 | 2025-01-31 | RESIDENCE | |
| 25 FAIRWAY AVENUE | KOGARAH | 2,005,000 | 2025-02-27 | RESIDENCE | |
| 33 MOOREFIELD AVENUE | KOGARAH | 1,855,000 | 2025-02-06 | RESIDENCE | |
| 30 CROSS STREET | KOGARAH | 1,741,000 | 2025-01-13 | RESIDENCE | |
| 64 OCEAN STREET | KOGARAH | 1,575,000 | 2025-01-13 | RESIDENCE |
Download the Latest 100 Sales
Click the button to download the most recent sales data for Kogarah in CSV format.
Note: Sale data NSW Valuer General analysed by AreaSearch
SELECT DATA
Source: NSW Valuer General transactions analysed by AreaSearch
Download the Sale Trends
Click the button to download the annual sales trends in CSV format.
Sales Trends FAQ
How many total sales records are available for Kogarah?
There are currently 0 total sales records that AreaSearch has analysed from the NSW Valuer General that fall within Kogarah that can be refined and searched, with 0 available across broader Greater Sydney.
What is the median sale price in Kogarah as of 2024?
As of 2024, the median sale price overall in Kogarah is $770,000. The median sale price for houses is $1,880,000, and for attached dwellings is $740,000.
How has the median sale price changed in Kogarah over the last 10 years?
Over the last 10 years, from 2014 to 2024, the median sale price in Kogarah increased by 20.3%, from $640,000 to $770,000. This represents a compound annual growth rate (CAGR) of 1.9%. This can be influenced by varying sales compositions; however, the median sale price for houses increased by 96.9% (CAGR: 7.0%), and for attached dwellings it increased by 22.5% (CAGR: 2.1%).
What is the proportion of house and unit sales in Kogarah over the last 10 years?
Over the last 10 years, in Kogarah, approximately 14.9% of sales were houses, and 85.1% were attached dwellings.
What are the median number of years properties are held between sales for houses and units in Kogarah?
As at 2024, houses are held for a median of 9.6 years, while attached dwellings are held for a median of 4.7 years.
What are the typical resale gains for houses and units in Kogarah?
As at 2024, the median gain over the prior sale for houses in Kogarah is $1,137,500, and for attached dwellings it is $63,000.
Which property type, houses or attached dwellings, has shown higher growth in Kogarah over the last 10 years?
Over the last 10 years, Kogarah has seen higher growth in median sale prices for houses (96.9%) compared to attached dwellings (22.5%).
How does the mix of houses and attached dwellings affect the overall market trends in Kogarah?
The mix of dwelling types in Kogarah influences market trends. A higher proportion of attached dwelling sales (85.1%) may contribute to different growth rates compared to areas with more house sales. It's important to consider both segments when analyzing the market.

Summary
Kogarah is a vibrant suburb located 13 kilometers south-west of the Sydney Central Business District, characterized by its diverse and well-educated population. The area boasts a significant proportion of young adults and working-age residents, alongside a notable presence of elderly individuals living in group households. This demographic mix contributes to Kogarah's dynamic community atmosphere, making it one of the strongest areas for population growth in Australia.
Key standout factors for Kogarah include its impressive rates of population growth since the 2016 census, with projections indicating continued expansion among the highest in the country. The suburb also enjoys one of the lowest unemployment rates nationwide, supported by a strong and stable employment market that is predominantly white-collar driven. Qualitatively, Kogarah offers a multicultural community enriched by amenities such as well-regarded hospitals, recreational facilities like Kogarah Bay and Carss Park, and local attractions including the St George Leagues Club and Kogarah Golf Club. These features collectively enhance the quality of life for residents while fostering an inclusive environment.
- Population Growth93%
- Development Activity68%
- Employment Drivers81%
- Income65%
- Age21%
- Education78%
- Transport & Access74%
- Cultural Diversity97%
- Health89%
- Housing Cost81%
- Rate Sensitivity90%
- Infrastructure Drivers63%

Population density and growth drivers well above average
Population growth over the past year among the highest in the country

Population growth led by overseas migration

Very low unemployment
FAQ
INFRA
AMENITY
TRANSPORT
SURROUNDS
GET REPORT
POPULATION
DEVELOPMENT
EMPLOYMENT
LAND USE
AGE
INCOME
EDUCATION
HEALTH
HOUSEHOLDS
DIVERSITY
HOUSING
FAQ
INFRA
AMENITY
TRANSPORT
SURROUNDS
GET REPORT
POPULATION
DEVELOPMENT
EMPLOYMENT
LAND USE
AGE
INCOME
Population
The area lies within the top 10% of areas nationally in terms of population growth performance according to AreaSearch analysis of short and medium-term trends. Total population for Kogarah was estimated by AreaSearch to be approximately 15,107 as at February 25 (~49.5% male and 50.5% female), which represented an exceptional 15.9% rise from the 13,034 recorded as at the 2021 Census period. This is based upon an estimated resident population of 14,995 from the ABS up to June 2024 and an additional 506 validated new addresses since the Census date. This level of population equates to a density ratio of 6,867 persons per square kilometer, placing it among the most highly concentrated locations in Australia and highlighting the need for further land supply to facilitate population growth.
Population growth for the area was primarily driven by overseas migration that contributed approximately 92% of overall population gains during recent periods. Over the census periods assessed Kogarah outperformed Greater Sydney, although results varied between periods with the location's growth profile showing moderate volatility between periods with an average growth level in each 5yr census period of 14.6%.
Looking at population projections moving forward, exceptional growth, placing in the top 10 percent of statistical areas across the nation, is predicted over the period with the area expected to expand by 6,723 persons to 2041 based on the latest population numbers, with an increase of 46.7% in total over the 17 years.
GROWTH |
HEATMAP |
TABLE |
FORECAST |
GRAPHIC
Note: The above heatmap details the distribution of the catchment's population at a mesh block level (the smallest level of data produced by the ABS) as at the 2021 Census.
| Metric | Catchment | Greater Sydney |
|---|---|---|
| Totals | ||
| - Latest Estimate @ February 25 | 15,107 | 5,485,260 |
| - ABS ERP Estimate @ June-24 | 14,995 | 5,557,233 |
| - Pop 2021 c | 13,034 | 5,231,147 |
| - Pop 2016 c | 11,323 | 4,823,993 |
| - Pop 2011 c | 9,614 | 4,391,673 |
| - Pop 2006 c | 9,047 | 4,119,190 |
| - Pop 2001 erp | 7,883 | 4,102,580 |
| Census Growth Rates | ||
| - 2016 to 2021 Growth | 1,711 (15.1%) | 407,154 (8.4%) |
| - 2011 to 2016 Growth | 1,709 (17.8%) | 432,320 (9.8%) |
| - 2006 to 2011 Growth | 567 (6.3%) | 272,483 (6.6%) |
| - 2001 to 2006 Growth | 1,426 (18.1%) | 153,581 (3.7%) |

Note: Population figures above are provided on both Census periods (c) and Estimated Resident Population (erp) basis. ERP figures are calculated annually by the ABS as at June 30 and have been adjusted for new Census boundaries with the 2021 Census. As figures differ slightly, growth rates over periods have been calculated using the same basis. For example 2016 to 2021 growth is based on available Census data, while 2001 to 2006 has used an ERP basis due to mesh block level Census data being unavailable.
AreaSearch is adopting ABS/Geoscience Australia projections for each SA2 area, as released in 2024 with 2022 as the base year. For any SA2 areas not covered by this data, AreaSearch is utilising the NSW State Government's SA2 level projections, as released in 2022 with 2021 as the base year. Growth rates by age group from these aggregations are also applied to all areas for years 2032 to 2041.
Employment
Total resident employment within Kogarah equated to 9,563 as at Dec-2024, while the unemployment rate was 1.8%, compared to 4.1% for Greater Sydney (please note local unemployment rates are calculated on a trend basis and lag more up-to-date state figures released by the ABS). Total employment increased 0.7% over the year to Dec-2024 in Kogarah, while labour force increased 1.1%, causing the unemployment rate to rise 0.4% over the same period. These figures can be compared to Greater Sydney's performance, where total employment increased 1.6%, the region's labour force increased 2.3% and its unemployment rate rose 0.6%. Also noteworthy is Kogarah's participation rate, which leads the Greater Sydney average at 62.2%.
The interest rate tightening cycle from the RBA is now having an effect on job advertisements growth, a positive for lowering inflation expectations, with a moderation seen over the past year as advertised roles in the Sydney employment region remained relatively stable. Looking relative to longer term trends however, the 346,698 job advertisements recorded as at 2025-Feb were below the longer term average of 450,654.
The key industries of employment are health care & social assistance, professional & technical and retail trade, which make up 20.8%, 11.8% and 10.0%, respectively.
Jobs and Skills Australia provides national projections of growth expected by industry over five and 10 year periods from May 2024, which can be overlaid onto Kogarah's employment composition to get a gauge as to potential future employment demand. Nationally employment levels are expected to grow by 6.6% over the coming five years and 13.7% over the ten year period, but vary substantially across industry segments. When industry expectations are applied to Kogarah as described above, the area should increase 7.4% over the five year period and 15% over the ten year period. Please note this is a simple weighting extrapolation for illustrative purposes and does not take into account localised population projections.
EMPLOYMENT |
UNEMPLOYMENT |
TABLE |
GRAPHIC
| Metric | Catchment | Greater Sydney |
|---|---|---|
| Totals | ||
| - Labour Force | 9,742 | 3,144,383 |
| - Employment | 9,563 | 3,015,916 |
| - Unemployment | 179 | 128,467 |
| - Unemployment Rate | 1.8% | 4.1% |
| Employment Percentages by Industry | ||
| - Agriculture Forestry & Fishing | 0.2% | 0.5% |
| - Mining | 0.1% | 0.2% |
| - Manufacturing | 4.0% | 5.7% |
| - Utilities & Waste Services | 0.5% | 0.9% |
| - Construction | 6.1% | 8.6% |
| - Wholesale Trade | 2.6% | 3.4% |
| - Retail Trade | 10.0% | 9.3% |
| - Accommodation & Food Services | 7.5% | 5.8% |
| - Logistics | 6.3% | 5.3% |
| - IT & Telecommunication | 2.1% | 2.5% |
| - Finance & Insurance | 7.7% | 7.3% |
| - Rental & Real Estate | 1.6% | 2.0% |
| - Professional & Technical Services | 11.8% | 11.5% |
| - Administration and Support | 4.5% | 3.4% |
| - Public Admin and Safety | 4.3% | 5.8% |
| - Education & Training | 5.6% | 8.9% |
| - Healthcare & Social Assistance | 20.8% | 14.1% |
| - Arts & Recreation | 1.4% | 1.6% |
| - Other Services | 2.8% | 3.4% |
Note: ○ Employment estimates based on population weighted averaging of figures published for SA2 areas that intersect the catchment ~ DESE data released quarterly with 3 month time-lag ○ Additional AreaSearch population-weighted estimates and backdating applied to SA2 areas formulated as at 2021 Census
Development
Dwelling approval data is released monthly by the ABS, there was 75 residential approvals (6% Detached / 94% Attached) registered in Kogarah over the past two financial years, with FY-25 presently on track to deliver 85 on an annualised basis given the 50 recorded to date. Looking at development activity over the previous five financial years, Kogarah's approval levels are currently running below the yearly average of 230, with a clear downward tend in approvals apparent from historic rates.
Dwelling approval activity in Kogarah has been significantly lower than that seen across the broader region, with 0.26 approvals per 100 people, compared to 0.57 in Greater Sydney. This means one dwelling was approved for every 385 people in Kogarah, versus one for every 180 in Greater Sydney. With an anticipated population increase of 6,000 people by 2041, about 2,609 new dwellings will be necessary. The existing supply is considerably inadequate relative to these projections, indicating a growing risk of housing shortages. This situation could result in notable price appreciation and capital gains, particularly as demand is expected to outpace supply.
Another important driver of capital value is densification, as measured by AreaSearch. This involves comparing the ratio of house to attached and 'other' dwelling approvals in recent applications with the housing stock ratio recorded in the latest Census. According to this analysis, 6% of recent approvals in Kogarah were for houses, a figure 16.1% below the Census figure.
APPROVALS |
TABLE |
GRAPHIC
| Metric | Catchment | Greater Sydney |
|---|---|---|
| Totals | ||
| - Average Dwelling Approvals (5yr) | 230 | 35,080 |
| - Commercial Approvals ($000's) | 33,306 | 20,118,298 |
| - Densification Percentile | 97 | 0 |
| - Approvals (Annualised) | 86 | 32,370 |
| - Last FY | 15 | 26,702 |
| - Prior FY | 60 | 35,668 |
| Composition | ||
| - Approvals Per 100 Persons | 0.3 | 0.6 |
| - Persons Per Dev Approval | 385 | 180 |
| - Population Growth Per Dev Approval | 4.6 | 5.0 |
Note: ○ Dwelling approval estimates based on population weighted averaging of figures published for SA2 areas that intersect the catchment ~ ABS data released monthly with 3 month time-lag ○ Additional AreaSearch population-weighted backdating applied to SA2 areas formulated as at 2021 Census ○ DA to population relativities to help in assessment of supply and demand levels within an area ~ Approvals per 100 people is calculated over the the past 2 financial years, while population growth per approval is based on the past five years (to ABS ERP periods) to smooth volatility in population growth trends.
Age
The median ages within Kogarah and the Greater Sydney region sit at 35 and 37, respectively, with Kogarah's most over and under-represented age cohorts in comparison to the Greater Sydney average being the 25 - 34 (22.3% of the total population) and 5 - 14 (8.9% of the total population) age groups.
Looking at population forecasts by age brackets, the majority of the population increase is expected within the 45 to 54 age group, which is projected to expand by 1,032 people.
COHORTS |
FORECAST |
TABLE |
GRAPHIC
| Metric | Catchment | Greater Sydney |
|---|---|---|
| Median Age | 35 | 37 |
| Age Cohorts | ||
| - 0 to 4 | 877 (5.8%) | 320,340 (5.8%) |
| - 5 to 14 | 1,344 (8.9%) | 662,071 (12.1%) |
| - 15 to 24 | 1,865 (12.3%) | 714,181 (13.0%) |
| - 25 to 34 | 3,371 (22.3%) | 873,254 (15.9%) |
| - 35 to 44 | 2,721 (18.0%) | 834,857 (15.2%) |
| - 45 to 54 | 1,661 (11.0%) | 672,493 (12.3%) |
| - 55 to 64 | 1,331 (8.8%) | 571,016 (10.4%) |
| - 65 to 74 | 921 (6.1%) | 443,758 (8.1%) |
| - 75 to 84 | 638 (4.2%) | 283,040 (5.2%) |
| - 85 + | 386 (2.5%) | 110,254 (2.0%) |
Note: See population section for forecast methodology and references.
Income
The catchment's income level is higher than average nationally according to the latest ATO data aggregated by AreaSearch for FY-22. The catchment's median income among taxpayers is $53,633 and the average income stands at $67,997, which compares to figures for Greater Sydney's of $56,994 and $80,856 respectively.
Looking at 2021 Census income data (that is provided on a median only basis and takes into account all residents) the median incomes within Kogarah stand at $1,959 for households, $2,219 for families and $905 for personal compared to Greater Sydney's results of $2,077, $2,374 and $881 for the same metrics. The income bracket containing the largest proportion (~44.9% / 6,776 persons) of Kogarah's population is the $1,500 - 2,999 grouping, similarly to Greater Sydney where 34% of the population fits into this bracket.
COHORTS |
TABLE |
GRAPHIC
| Metric | Catchment | Greater Sydney |
|---|---|---|
| SEIFA Score | 5.0 | n.a |
| ATO Weighted Taxable Income @ FY-22 | ||
| Average Taxable Income | 67,997 | 80,856 |
| Median Taxable Income | 53,633 | 56,994 |
| Census Median Incomes ($/wk) | ||
| Individual Income ($/wk) | 905 | 881 |
| Household Income ($/wk) | 1,959 | 2,077 |
| Family Income ($/wk) | 2,219 | 2,374 |
| Census Household Income Cohorts ($/wk) | ||
| - $0 to $399 | 250 (4.2%) | 145,477 (7.6%) |
| - $400 to $799 | 508 (8.5%) | 259,985 (13.6%) |
| - $800 to $1,499 | 1,239 (20.8%) | 404,315 (21.1%) |
| - $1,500 to $2,999 | 2,678 (44.9%) | 649,963 (34.0%) |
| - $3,000 to $3,999 | 804 (13.5%) | 207,033 (10.8%) |
| - $4,000+ | 494 (8.3%) | 244,883 (12.8%) |
Note: ○ ATO taxable income data is released at postcode level anually, this is then population weighted and income balanced by AreaSearch. ○ Census income estimates based on population weighted averaging of Census data released for SA2 areas that intersect the catchment ○ Post-housing cost income estimates based on based on median income to median monthly housing cost ratios calculated at Census.
Household Structure
There was an approximate total of 5,152 households within Kogarah recorded at the 2021 Census. Median household size stands at 2.5, a figure below the Greater Sydney average of 2.7. Of these households, 64% are families, 25.3% are lone persons, 5.6% are group households, while 5.3% are 'other' households. Based on our latest estimates (see the population section) the total number of households has likely grown to 5,971.
The household type standing out as most clearly under-represented is family households, with 64% of Kogarah's total households compared to 69.5% across Greater Sydney. Meanwhile, of Kogarah's families, 23.9% are couples with no children, 29.5% are couples with children and 8.4% are single parent families, compared to 23.3%, 34.4% and 10.5% for Greater Sydney. Of Kogarah's population, 36% have never been married while 48.3% are currently married, in contrast to Greater Sydney's results of 36.4% and 48.3% for the same metrics. Further, Kogarah trails the Greater Sydney average of 1.5 children per family, recording a figure of 1.1.
TABLE |
GRAPHIC |
FAMILIES GRAPHIC
| Metric | Catchment | Greater Sydney |
|---|---|---|
| Totals | ||
| Total Households February 25 (est) | 5,971 | 2,004,515 |
| Total Households 2021c | 5,152 | 1,911,653 |
| Median Household Size | 2.5 persons | 2.7 persons |
| Household Cohorts | ||
| - Family Households | 3,820 (64.0%) | 1,327,644 (69.5%) |
| of which: | ||
| - Couple With Children | 1,127 (29.5%) | 456,975 (34.4%) |
| - Couple No Children | 914 (23.9%) | 309,740 (23.3%) |
| - One Parent Family | 322 (8.4%) | 139,005 (10.5%) |
| - Lone Person Households | 1,511 (25.3%) | 424,770 (22.2%) |
| - Group Households | 335 (5.6%) | 76,467 (4.0%) |
| - Other Households | 315 (5.3%) | 82,775 (4.3%) |
Infrastructure & Major Projects
The below list represents a summary of major planning, infrastructure and project announcements likely to impact upon the subject area. This data is compiled by AreaSearch from numerous sources for the benefit of our users, however, naturally, we can not guarantee to cover every project of interest. If there is a specific project you believe we have missed that warrants inclusion, please feel free to Contact Us and we will endeavour to incorporate your suggestion.
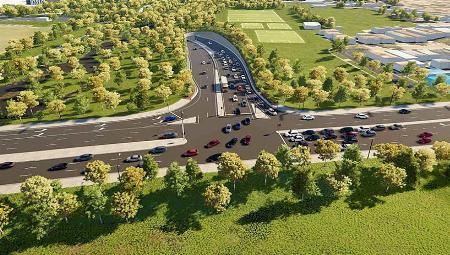
M6 - Stage One
Category: Transport & Logistics | Type: Major ProjectStage: Under Delivery Source / Links: Link 1 Admin ID: 341
The M6 Extension Stage One connects the New M5 at Arncliffe with President Avenue, Kogarah. It features 4km twin tunnels, ramps, future expansion stubs, road upgrades, shared pathways, and essential motorway support infrastructure.
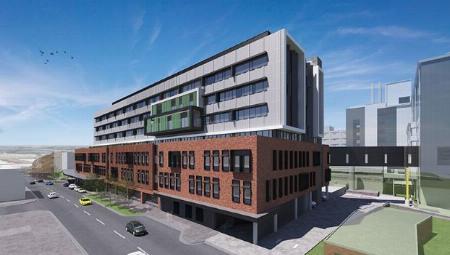
St George Hospital Redevelopment Stage Three
Category: Health | Type: Major ProjectStage: Under Delivery Source / Links: Link 1 Admin ID: 537
Stage Three of St George Hospital's redevelopment includes new outpatient, pathology, rehabilitation services, more beds, aged care, special units for brain injury, behavior management, palliative care, surgery, imaging, and a Clinical Skills Centre.
Sydney Metro
Category: Transport & Logistics | Type: Major ProjectStage: Announced Source / Links: Link 1 Admin ID: 198
Australia's largest public transport project, Sydney Metro, is an automated rail system boosting Sydney's capacity by 60% by 2024. It encompasses multiple stages, including the operational Northwest and upcoming City & Southwest and West lines.

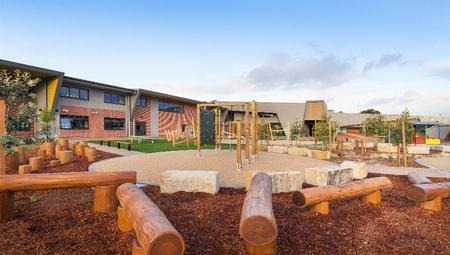
Kyeemagh Public School project
Category: Education & Training | Type: Local ProjectStage: Complete Source / Links: Link 1 Admin ID: 3173
School Infrastructure NSW has upgraded Kyeemagh Public School to bring students new and improved facilities and support the growing student community.
WestConnex
Category: Transport & Logistics | Type: Major ProjectStage: Construction Source / Links: Link 1 Link 2 Admin ID: 3127
WestConnex will provide 33km of motorway to link western and south-western Sydney with the city, Kingsford Smith Airport and Port Botany precincts.

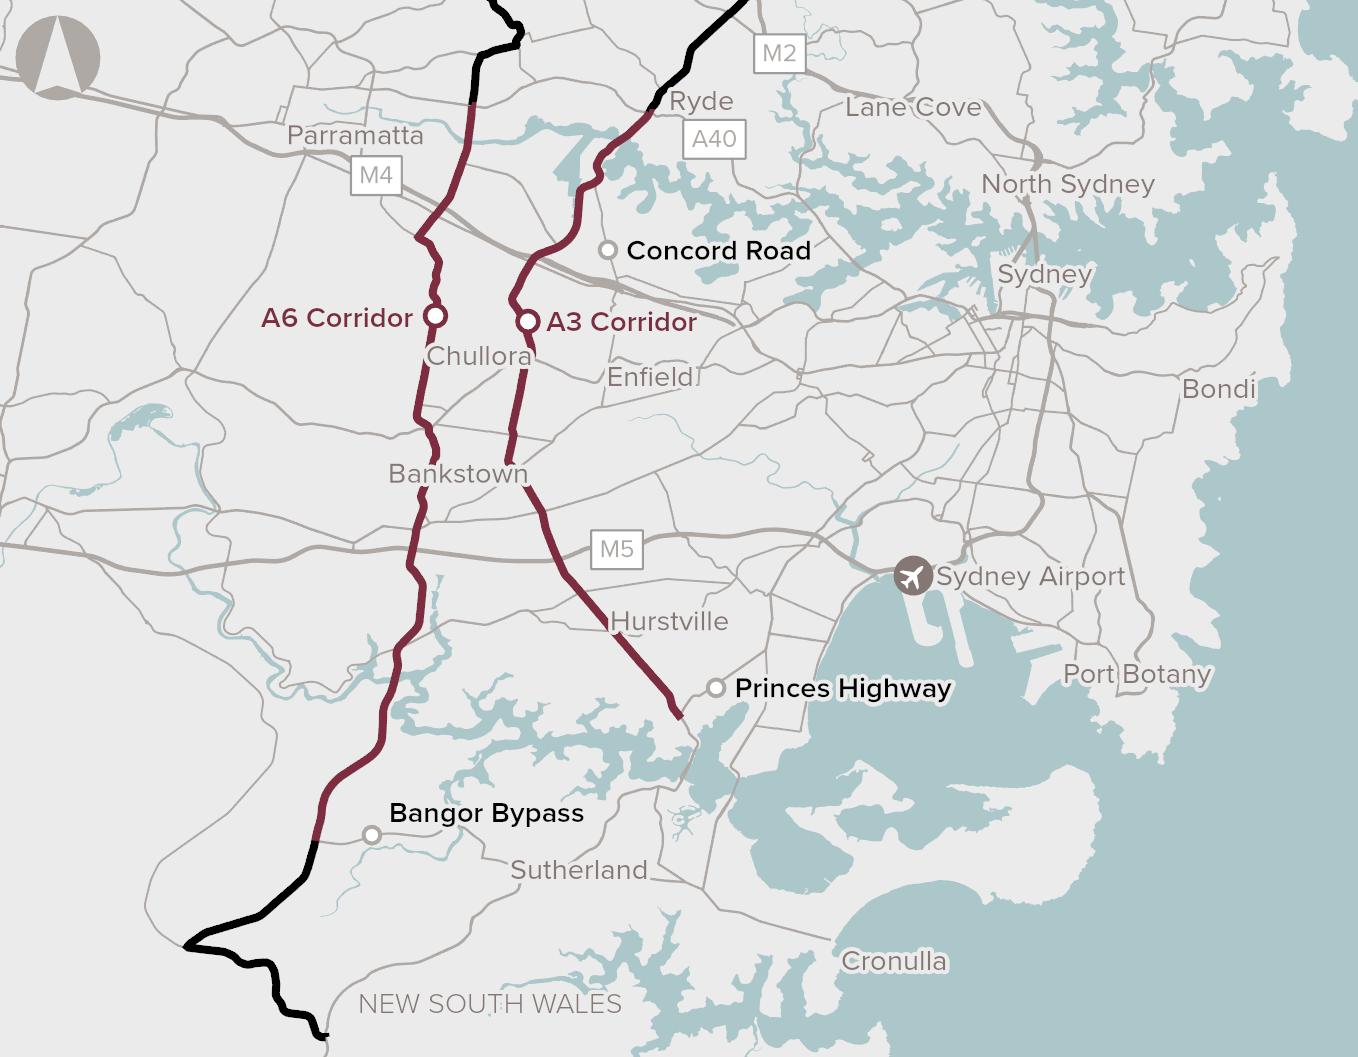
A3 And A6 Corridor Capacity
Category: Transport & Logistics | Type: Major ProjectSource / Links: Admin ID: 826
The A3 and A6 corridors in Sydney face high traffic, causing slow trips and impacting freight productivity, with proposed upgrades to address capacity constraints and promote modal shift to reduce emissions.
Western Sydney Freight Line And Intermodal Terminal
Category: Transport & Logistics | Type: Major ProjectSource / Links: Admin ID: 762
Proposal for a freight rail link and intermodal terminal in Western Sydney to address increased freight volume and reduce reliance on road transport, aimed at enhancing connectivity and reducing congestion.

Newcastle-Sydney And Wollongong-Sydney Rail Line Upgrades
Category: Transport & Logistics | Type: Major ProjectSource / Links: Admin ID: 834
Upgrades to improve rail speed and reduce travel times between Newcastle, Wollongong, and Sydney, enhancing connectivity and productivity. Includes operational, infrastructure improvements, and new rail crossings.

Sydney Southern Ring
Category: Energy | Type: Major ProjectStage: Prospective Source / Links: Link 1 Admin ID: 284
Transgrid's Sydney Southern Ring, a 500kV line project from Bannaby to South Creek, aims to support Sydney, Newcastle, Wollongong's demand. It includes new substations and line works to integrate renewable energy sources.

Victoria & George
Category: Communities, Precincts & Urban Renewal | Type: Local ProjectStage: Under Construction Source / Links: Link 1 Link 2 Admin ID: 2088
12-storey Kogarah residential building and adaptive reuse project, including the retention and reuse of adjoining heritage listed terraces.

Rocky Point Rd, Kogarah
Category: Communities, Precincts & Urban Renewal | Type: Local ProjectStage: Proposed Source / Links: Link 1 Link 2 Admin ID: 2161
Two new storage facilities are being built in Sydney: a 10-storey development in Mascot by Chapter and Co with Wilson Storage, and a six-storey facility in Kogarah by Abacus Group and Storage King.

Railway St, Rockdale
Category: Communities, Precincts & Urban Renewal | Type: Local ProjectStage: Proposed Source / Links: Link 1 Link 2 Admin ID: 1944
Eloura Developments plans to renovate Kadwell Chambers, a 1920s building in Rockdale, into a nine-storey mixed-use development with 140 apartments, commercial units, rooftop space, and basement parking.

Bay St, Brighton-Le-Sands
Category: Communities, Precincts & Urban Renewal | Type: Local ProjectStage: Proposed Source / Links: Link 1 Link 2 Admin ID: 2458
A 13-storey mid-rise apartment block with 130 apartments, majority two-bedroom units with retail spaces, communal areas, connected to Brighton Shores, offering views of North Sydney CBD, Botany Bay, Blue Mountains.

Rockdale Residences
Category: Communities, Precincts & Urban Renewal | Type: Local ProjectStage: Proposed Source / Links: Link 1 Link 2 Admin ID: 1012
Eight-storey building with 130 co-living rooms, a lobby, communal space, and ground floor cafe. Includes 15 car and 130 bicycle spaces, with plans for 200 units worth $65 million.

Princes Hwy, Banksia
Category: Communities, Precincts & Urban Renewal | Type: Local ProjectStage: Proposed Source / Links: Link 1 Link 2 Admin ID: 1841
The project involves developing two, 10-storey buildings comprising 86 shop-top apartments. This development aims to provide in-fill affordable housing next to Banksia Station, replacing aging commercial buildings.

The Grand Parade Ramsgate Road, Ramsgate Beach
Category: Communities, Precincts & Urban Renewal | Type: Local ProjectStage: Proposed Source / Links: Link 1 Link 2 Admin ID: 1397
Bronxx plans to redevelop a Coles supermarket into a six-storey building with retail outlets, food and drink premises, and 44 apartments. The project includes 2926sq m of retail space and quality residential accommodation.

More Trains, More Services Program
Category: Transport & Logistics | Type: Major ProjectStage: Under Delivery Source / Links: Link 1 Admin ID: 257
A program with over $1.5 billion funding aimed at upgrading Sydney's rail network by enhancing digital systems, improving service frequency, and increasing the capacity of several lines.

Arncliffe Central
Category: Communities, Precincts & Urban Renewal | Type: Local ProjectStage: Under Construction Source / Links: Link 1 Link 2 Admin ID: 1600
Four-tower, 804-apartment mixed-tenure housing project with retail podium, public park, childcare center, community center, and library.

Eden Street Arncliffe
Category: Communities, Precincts & Urban Renewal | Type: Local ProjectStage: Approved Source / Links: Link 1 Link 2 Admin ID: 1253
A four-tower residential precinct redevelopment including 744 apartments, with 180 social housing apartments. Features 3100sq m of retail space, a 240sq m childcare centre, and 813 carparking spaces.

Westconnex Stage Two - New M5
Category: Transport & Logistics | Type: Major ProjectStage: Operational Source / Links: Link 1 Admin ID: 686
The project involves a $4.3 billion duplication of the M5 East, including twin tunnels from Kingsgrove to St Peters and a $131 million upgrade of the King Georges Road Interchange.

What is the latest population estimate for Kogarah?
Total population for Kogarah was estimated to be approximately 15,107 as at February 25. This is based upon an estimated resident population of 14,995 from the ABS up to June 2024 and an additional 506 validated new addresses since the Census date.
What is the ratio of males and females in Kogarah?
49.5% were recorded as male and 50.5% were identified as female as at the 2021 Census
How has the population in the Kogarah area changed since 2021?
Kogarah has added approximately 2,073 people and shown an exceptional 15.9% rise from the 13,034 people recorded at the 2021 Census period.
What is the population density in the Kogarah area?
The population density in the Kogarah area is estimated at 6,867 persons per square kilometer, this is based on the latest estimate for February 25 derived from a land area of 2.2sq km and population estimate of 15,107. At the 2021 Census the persons per square kilometer was estimated at 5,925.
What is the projected population growth in the Kogarah area?
Between 2024 and 2041, approximately 6112 people are expected to be added, showing a projected growth rate of 40.76% in total, or an average of 2.40% per annum.
How much has the population grown in the Kogarah area over the past 10 years?
Over the past 10 years, on an ABS estimated resident population basis to June 2024 the population in the Kogarah area has grown by 3768 people, which is a growth rate of 2.94% per annum.
How many dwelling approvals have occurred in the Kogarah area recently?
Dwelling approval activity in the Kogarah area has seen 75 residential approvals over the past two financial years, based on AreaSearch's SA2 aggregation method. Kogarah's current population of 15,107 has been supported by 230 approvals on average over recent years.
How does Kogarah's development activity compare to the broader region?
Kogarah has seen 0.26 approvals per 100 people in recent years, compared to 0.57 approvals in Greater Sydney. This means that one dwelling has been approved for every 385 people in Kogarah, compared to one for every 180 in Greater Sydney.
Is the Kogarah area keeping up with housing demand?
With an anticipated population increase of 6,000 people by 2041, about 2,609 new dwellings will be necessary. The existing supply is considerably inadequate relative to these projections, indicating a growing risk of housing shortages. This situation could result in notable price appreciation and capital gains, particularly as demand is expected to outpace supply.
What has been the trend in development approvals over the past five years?
Looking at development activity over the past five years, Kogarah's approval levels have been below the yearly average of 230.
How many dwellings will be needed to accommodate future population growth?
The population in Kogarah is expected to grow by 6,000 people, necessitating approximately 2,609 new dwellings.
How does recent development compare to population growth in Kogarah?
Over the past five years, the population in Kogarah has grown by approximately 2,088 people, while 1,150 residential approvals were recorded. This equates to a ratio of 1.8 people added for each new dwelling approval.
Are there opportunities for residential developers in Kogarah?
With dwelling approval activity running at an average of 230 approvals per year and a population of 15,107, The current market is undersupplied over recent years, likely presenting significant opportunities for residential developers to meet housing demand. With an anticipated population increase of 6,000 people by 2041, about 2,609 new dwellings will be necessary. The existing supply is considerably inadequate relative to these projections, indicating a growing risk of housing shortages. This situation could result in notable price appreciation and capital gains, particularly as demand is expected to outpace supply.
What is the total employment in the Kogarah area?
As of Dec-2024, total employment in the Kogarah area was estimated at 9,563 according to AreaSearch's analysis of data from Jobs and Skills Australia.
What is the unemployment rate in the Kogarah area?
The unemployment rate in the Kogarah area as of Dec-2024 was estimated at 1.8%, compared to 4.1% in Greater Sydney from Jobs and Skills Australia.
What is the participation rate in the Kogarah area?
The participation rate in the Kogarah area is 62.2%, which leads the Greater Sydney average of 60.0% according to 2021 Census analysis.
How has employment changed in the past year in the Kogarah area?
Total employment in the Kogarah area has increased 0.7% over the past year, while the labor force has increased 1.1%, causing the unemployment rate to rise 0.4%.
What industry is most over-represented in the Kogarah area?
The most over-represented employment industry in Kogarah is health care & social assistance, which makes up 20.8% of total employment compared to 14.1% in Greater Sydney according to our analysis of 2021 Census Data.
Which industries are under-represented in the Kogarah area?
Education & training is under-represented in the Kogarah area, making up only 5.6% of the workforce compared to 8.9% in Greater Sydney.
What are the key industries of employment in the Kogarah area?
The key industries of employment in the Kogarah area are health care & social assistance, professional & technical and retail trade, which make up 20.8%, 11.8% and 10.0% of overall employment, respectively.
What is the median age in the Kogarah area?
According to the latest data, the median age in the Kogarah area is 35 years.
How does Kogarah's median age compare to the region?
The median age in the Kogarah area is 35 years, which is 2 years younger the median age of 37 years in the Greater Sydney region.
What age groups are over-represented in the Kogarah area?
The most over-represented age group in the Kogarah area compared to the Greater Sydney region is the 25 - 34 group, making up 22.3% of the population.
What age groups are under-represented in the Kogarah area?
The most under-represented age group in the Kogarah area compared to the Greater Sydney region is the 5 - 14 group, making up 8.9% of the population.
Are there age groups with notable population variances?
Yes, certain age groups in the Kogarah area show significant variance compared to the Greater Sydney region. The most over-represented age group is 25-34 year-olds (22.3% vs 15.9%).
What is the percentage of children (0-14 years) in the Kogarah area?
The percentage of children aged 0-14 years in the Kogarah area is 14.7%.
What is the percentage of older people (65+ years) in the Kogarah area?
The percentage of people aged 65 and over in the Kogarah area is 12.9%.
What is the median taxable income in the Kogarah area?
According to analysis of the latest ATO data as of FY-22, the median taxable income among taxpayers in the Kogarah area is estimated at $53,633.
What is the average taxable income in the Kogarah area?
According to analysis of the latest ATO data as of FY-22, the average taxable income among taxpayers in the Kogarah area is estimated at $67,997.
How does the median taxable income in Kogarah compare to the region?
The median taxable income in Kogarah is $53,633, while the median taxable income in Greater Sydney is $56,994, according to the ATO data as of FY-22.
How does the average taxable income in Kogarah compare to the region?
The average taxable income in Kogarah is $67,997, while the average taxable income in Greater Sydney is $80,856, based on the latest ATO data for FY-22.
What are the main income cohorts in the Kogarah area according to the 2021 Census?
As per the 2021 Census, the income bracket containing the largest proportion (~44.9% / 6,776 persons) of Kogarah's population is the $1,500 - 2,999 cohort.
How do the main income cohorts in Kogarah compare to the region?
The largest income cohort in Kogarah is the $1,500 - 2,999 group, representing about 44.9% of the population. In comparison, Greater Sydney's largest income cohort is the $1,500 - 2,999 group, representing 34% of its population, according to the 2021 Census.
What is the median household income in the Kogarah area according to the 2021 Census?
The 2021 Census data indicates that the median household income in the Kogarah area is $1,959/wk.
What is the median family income in the Kogarah area according to the 2021 Census?
According to the 2021 Census, the median family income in the Kogarah area is $2,219/wk.
What is the median personal income in the Kogarah area according to the 2021 Census?
The 2021 Census shows that the median personal income in the Kogarah area is $905/wk.
How does Kogarah's income rank nationally?
Kogarah's income level is above the national average according to the latest ATO data aggregated by AreaSearch for FY-22. Kogarah's median income among taxpayers is $53,633 and the average income stands at $67,997, which compares to figures for Greater Sydney's of $56,994 and $80,856 respectively.
What percentage of the Kogarah area population holds a university-level qualification?
In the Kogarah area, 30.3% hold a Bachelor's degree, 2.0% hold a Graduate Diploma and 14.2% hold a Postgraduate qualification.
What percentage of the Kogarah area population holds a certificate or advanced diploma?
In the Kogarah area, 12.8% hold an Advanced Diploma and 12.4% hold a Certificate qualification.
What is the overall school attendance rate in the Kogarah area?
The overall school attendance rate in the Kogarah area is approximately 2.5% for preschool, 8.4% for primary school, 5.5% for secondary school, 5.4% for technical school and 8.2% for university.
What is the Kogarah area's overall education rank?
the Kogarah area ranks in the 78th percentile in terms of overall education performance on AreaSearch's analysis.
How many households are there in the Kogarah area?
There was an approximate total of 5,152 households within Kogarah at the 2021 Census. Based on our latest estimates (see the population section) the total number of households has likely grown to 5,971.
How does the median household size compare to the regional average?
The median household size in Kogarah is 2.5, which is below the regional average of 2.7.
What are the most common household types in Kogarah?
64% are families, 25.3% are lone persons, 5.6% are group households, while 5.3% are 'other' households. Based on our latest estimates (see the population section) the total number of households has likely grown to 5,971.
Which household type is most over or under-represented in Kogarah compared to the region?
The household type standing out as most clearly under-represented is family households, with 64% of Kogarah's total households compared to 69.5% across Greater Sydney. Meanwhile, of Kogarah's families, 23.9% are couples with no children, 29.5% are couples with children and 8.4% are single parent families, compared to 23.3%, 34.4% and 10.5% for Greater Sydney.
How many children per family are there in Kogarah compared to the regional average?
Kogarah trails the Greater Sydney average of 1.5 children per family, recording a figure of 1.1.
What is the marriage status of Kogarah's population?
Of Kogarah's population, 36% have never been married while 48.3% are currently married, in contrast to Greater Sydney's results of 36.4% and 48.3% for the same metrics.
What percentage of dwellings in the Kogarah area are houses?
According to the latest data, 22.1% of dwellings in the Kogarah area are houses.
What percentage of dwellings in the Kogarah area are semi-detached, apartments, or other types?
In the Kogarah area, 7.5% of dwellings are semi-detached, 69.7% are apartments and 0.7% are classified as 'other' dwellings.
What is the level of outright home ownership in the Kogarah area?
Outright home ownership in the Kogarah area stands at 22.8%.
What is the median monthly mortgage repayment in the Kogarah area?
The median monthly mortgage repayment in the Kogarah area is $2,251 according to the 2021 Census.
What is the median weekly rent in the Kogarah area?
The median weekly rent in the Kogarah area is $464 according to the 2021 Census.
How many people in the Kogarah area have private health insurance?
Around 53.4% of people in the Kogarah area are covered by private health insurance, which compares to 59.3% in the broader region of Greater Sydney.
What percentage of the population requires ongoing medical assistance in the Kogarah area?
In the Kogarah area, 4.7% of the population is identified as requiring ongoing medical assistance. This figure is slightly different from the regional average, where 5.2% of people in Greater Sydney require similar assistance.
How prevalent is asthma in the Kogarah area?
5.2% of people in the Kogarah area are diagnosed with asthma. In comparison, 7.3% of the population across Greater Sydney is affected by asthma.
What percentage of people have diabetes in the Kogarah area?
Diabetes affects 4.4% of Kogarah population, while in the surrounding region, 4.9% of people are diagnosed with diabetes.
What is the percentage of people with heart disease in the Kogarah area?
3.5% of people in the Kogarah area have heart disease. Across the region of Greater Sydney, 3.6% of the population is affected by heart disease.
How does Kogarah compare to the region in terms of overall private health coverage?
In the Kogarah area, 53.4% of the population are estimated to have private health insurance. Comparatively, Greater Sydney sees an estimated private health coverage rate of 59.3%.
What is the level of cultural diversity in the Kogarah area?
Kogarah scores highly on cultural diversity, with 59.8% of its population born overseas and 65.0% speaking a language other than English at home.
What is the most common religion in the Kogarah area?
The main religion in Kogarah was found to be Christianity, which makes up 46.2% of people in Kogarah. However, the most apparent overrepresentation was in Hinduism, which comprises 16.0% of the population, substantially higher than the Greater Sydney average of 5.2%.
What are the top countries of origin in the Kogarah area?
In terms of country of origin, the top three represented groups in the Kogarah area are Other, comprising 26.5% of the population, which is substantially higher than the regional average of 16.0%, Chinese, comprising 14.4% of the population, which is substantially higher than the regional average of 8.4% and English, comprising 9.8% of the population, which is notably lower than the regional average of 18.9%. Additionally, there are notable divergences in the representation of certain other groups. Australian is notably lower than the regional average, comprising 8.9% of Kogarah population compared to 17.8% regionally. Greek is substantially higher than the regional average, comprising 6.9% of Kogarah population compared to 1.9% regionally.
How does the percentage of people born overseas compare to the regional average?
59.8% of Kogarah population was born overseas, compared to 40.5% regionally.
What percentage of Kogarah population speaks a language other than English at home?
65.0% of the population in Kogarah speaks a language other than English at home, compared to 39.5% in the wider region.
How many people in Kogarah identify as Australian Aboriginal?
0.4% of Kogarah population identifies as Australian Aboriginal, compared to 1.3% in the region.
What is the citizenship status of the population in Kogarah?
67.0% of Kogarah population holds citizenship, compared to 80.8% in the wider region.
Amenity
AreaSearch's amenity score assesses locational convenience by measuring the distance to closest access point and average distance to the nearest three access points, for critical community services. Please note for certain sectors this covers only major operators assessed regularly by AreaSearch. Amenity for the Kogarah population centre midpoint was found to be exptionally high overallsupermarkets and government service locations lagged other categories in terms of convenience.
| Category | Number | Dist to 3 (km) |
|---|---|---|
| Supermarket | 2 | 0.89 km |
| Child Care | 8 | 0.16 km |
| GP | 10 | 0.27 km |
| Government Services | 9 | 1.08 km |
| Dentist | 6 | 0.36 km |
| Hospital | 7 | 2.51 km |
| Shopping Centre | 1 | 1.41 km |
| Banks | 3 | 0.52 km |
| Pharmacy | 8 | 0.33 km |
| Fitness Centre | 3 | 0.62 km |
| Schools | 8 | 0.14 km |
Schools
Amenity for schools in the area was exceptional with the nearest operator located only 40 meters away from the location midpoint and the average distance to the nearest 3 operators standing at 140 meters according to AreaSearch's analysis. There were 8 schools operating within the specific catchment area assessed based on latest adopted data.
For a detailed assessment of schools within the catchment area, please refer to the education tab. For specialized reports or consultancy services, please Contact Us for further information.
Amenity for supermarkets in the area was very high with the nearest operator located approximately 740 meters away from the location midpoint and the average distance to the nearest 3 operators standing at 890 meters according to AreaSearch's analysis. There were 2 supermarkets operating within the specific catchment area assessed based on latest adopted data.
Please be aware that the supermarket assessment primarily relies on simple distance metrics and may not fully capture demand and supply dynamics. See HERE for benchmarks or for a comprehensive evaluation that includes micro-level population statistics, adjusted competition catchments, and retail expenditure estimates, as well as information on major nearby competing and complementary retailers, we recommend accessing the detailed Retail section within MicroSearch. Alternatively, Contact Us for more information on obtaining sector access, detailed reports, or consulting services.
Amenity for child care centres in the area was exceptional with the nearest operator located only 60 meters away from the location midpoint and the average distance to the nearest 3 operators standing at 160 meters according to AreaSearch's analysis. There were 8 child care centres operating within the specific catchment area assessed based on latest adopted data.
Note that our analysis of the Child Care amenities is based on straightforward distance measurements and does not address the full complexities of demand and supply. See HERE for benchmarks, or for specific insights into available spots, child-to-space ratios, proximity to schools, age of centers, and pricing details, please consult the Child Care section of MicroSearch. If further assistance is needed, Contact Us to discuss sector access, report customization, or our consulting services.
Amenity for general practitioners in the area was exceptional with the nearest operator located only 150 meters away from the location midpoint and the average distance to the nearest 3 operators standing at 270 meters according to AreaSearch's analysis. There were 10 gp clinics operating within the specific catchment area assessed based on latest adopted data.
While our GP amenity assessment is informative, it is based only on proximity and might not adequately reflect market demand and supply conditions. For an in-depth analysis that includes data on private health insurance coverage, Medicare benefits scheme spending, and other relevant metrics across all significant medical service providers, professional plan users with sector access should view the Medical section within MicroSearch. For additional resources, Contact Us.
Amenity for government service locations in the area was very high with the nearest operator located approximately 750 meters away from the location midpoint and the average distance to the nearest 3 operators standing at 1.08 kilometers according to AreaSearch's analysis. There were 9 government service locations operating within the specific catchment area assessed based on latest adopted data.
Government services encompass a variety of facilities like post offices and Services Australia Centres. It's important to note that our location-based analysis may not adequately reflect the actual demand and supply. For a deeper dive into micro-level demographics, adjusted catchment areas, and spending behaviors, those with access should view the Retail analysis section within MicroSearch or Contact Us for more detailed access or personalized consulting.
Amenity for dental clinics in the area was exceptional with the nearest operator located only 270 meters away from the location midpoint and the average distance to the nearest 3 operators standing at 360 meters according to AreaSearch's analysis. There were 6 dental clinics operating within the specific catchment area assessed based on latest adopted data.
Please consider that our distance-based assessment of dental clinics might not capture all dimensions of market demand and supply. For a more nuanced analysis that covers aspects like insurance coverage and spending within the dental sector, view the Medical section on MicroSearch. Should you require further information, Contact Us to access more detailed data or consultation services.
Amenity for hospitals in the area was exceptional with the nearest operator located only 230 meters away from the location midpoint and the average distance to the nearest 3 operators standing at 2.51 kilometers according to AreaSearch's analysis. There were 7 hospitals operating within the specific catchment area assessed based on latest adopted data.
The assessment of hospital amenities provided here focuses on simple distance metrics and might not be sufficient for comprehensive demand and supply analysis. For detailed insights into hospital capacities, procedure volumes, waiting times, and broader health coverage metrics, visit the Medical section of MicroSearch. For further inquiries, Contact Us.
Amenity for shopping centres in the area was exceptional with the nearest operator located just 710 meters away from the location midpoint and the average distance to the nearest 3 operators standing at 1.41 kilometers according to AreaSearch's analysis. A single shopping centre was assessed as operating within the specific catchment area.
Please note that, while hopefully useful, the shopping centre amenity here is based on a simple distance assessment and is insufficient for demand and supply analysis. For a detailed analysis that considers micro-level population counts, effective (competition-adjusted) catchments, retail spending estimates, and all major nearby retailers, both competing and complementary, please see the Retail section within MicroSearch for those with access. Alternatively Contact Us to inquire about sector access, reports, or consulting services.
Amenity for banks in the area was exceptional with the nearest operator located only 510 meters away from the location midpoint and the average distance to the nearest 3 operators standing at 520 meters according to AreaSearch's analysis. There were 3 banks operating within the specific catchment area assessed based on latest adopted data.
Amenity for pharmacies in the area was exceptional with the nearest operator located only 150 meters away from the location midpoint and the average distance to the nearest 3 operators standing at 330 meters according to AreaSearch's analysis. There were 8 pharmacies operating within the specific catchment area assessed based on latest adopted data.
Please note that, while hopefully useful, the pharmacy amenity referenced here is based on a simple proximity assessment and is insufficient for demand and supply analysis. Pharmacies are covered across both our retail and medical category analysis enabling effective population catchment analysis and demand and supply analysis for all major primary and allied health provider types. Those with access should see the relevant sections within MicroSearch. Alternatively Contact Us to inquire about sector access, required reports, or consulting services.
Amenity for fitness centres in the area was exceptional with the nearest operator located only 360 meters away from the location midpoint and the average distance to the nearest 3 operators standing at 620 meters according to AreaSearch's analysis. There were 3 fitness centres operating within the specific catchment area assessed based on latest adopted data.
The current assessment of fitness centres is limited to proximity to major operators and lacks a detailed supply and demand analysis. For a thorough evaluation that considers demographic specifics and market competition, please refer to the Retail section of MicroSearch. For direct inquiries, Contact Us.
Amenity for schools in the area was exceptional with the nearest operator located only 40 meters away from the location midpoint and the average distance to the nearest 3 operators standing at 140 meters according to AreaSearch's analysis. There were 8 schools operating within the specific catchment area assessed based on latest adopted data.
For a detailed assessment of schools within the catchment area, please refer to the education tab. For specialized reports or consultancy services, please Contact Us for further information.
Aged Care & SDA
AGED CARE MAP |
SDA FACILITIES |
DATA TABLES
| Id | Name | Address | Type | Places | Dist (Km) |
|---|
Note: ○ Places for retirement villages represent individual dwellings. Not all dwelling numbers are available at present.
| Name | Suburb | Build Type | NDIS Design | Rooms | Max Price / Rm |
|---|
Note: ○ Exact locations are not provided for NDIS facilities, the above list represents registered facilities in each suburb covered by the catchment
Retail Analysis
MAJOR BRANDS |
SPENDING |
INCOME |
MACRO
Education
Kogarah showed top quartile performance for education according to AreaSearch's broad ranking of educational achievement and performance statistics. 46.5% of residents in Kogarah have completed bachelor or postgraduate qualifications which is significantly beyond the 38.0% recorded for Greater Sydney, while 16.4% of the resident population reported to be attending school between pre-school and secondary level, while 5.4% were attending a technical college and 8.2% attending university.
There were a total of 8 schools identified in Kogarah, with a total attendance of approximately 3,510 students. The average ICSEA score (which bases off a national average of 1000) equated to 1,060, which is marginally above the average seen across Greater Sydney of 1,050.
SCHOOLS |
TABLE |
GRAPHIC
| Id | Name | Type | Places | ICSEA | Dist (Km) | URL |
|---|
Id | Name | Type | Places | ICSEA | Dist (Km) | URL |
|---|---|---|---|---|---|---|
| Moorefield Girls High School | Secondary | 387 | 1021 | 0.03 | Link | |
| St George School | Combined | 53 | 1046 | 0.09 | Link | |
| St Patrick's Catholic Primary School | Primary | 421 | 1116 | 0.19 | Link | |
| James Cook Boys High School | Secondary | 481 | 1020 | 0.20 | Link | |
| St George Hospital School | Combined | 0.36 | Link | |||
| Kogarah Public School | Primary | 466 | 1086 | 0.70 | Link | |
| Kogarah High School | Secondary | 809 | 993 | 0.84 | Link | |
| St George Girls High School | Secondary | 893 | 1143 | 1.03 | Link |
| Metric | Catchment | Greater Sydney |
|---|---|---|
| Highest Education Level Achieved | ||
| Reports Post-School Qualifications (15yrs+) | 71.8% | 65.8% |
| - Post Graduate Degree | 14.2 | 10.7 |
| - Graduate Diploma / Certificate | 2.0 | 2.4 |
| - Bachelor Degree | 30.3 | 24.9 |
| - Advanced Diploma | 12.8 | 11.0 |
| - Technical Certificate | 12.4 | 16.8 |
| Attending an Institution | ||
| Total Attending Percentage | 32.3 | 31.2 |
| of which: | ||
| - Attending Preschool | 2.5 | 2.5 |
| - Attending Primary School | 8.4 | 9.8 |
| - Attending Secondary School | 5.5 | 7.8 |
| - Attending Technical Institution | 5.4 | 3.2 |
| - Attending University | 8.2 | 6.6 |
| - Attending Other Institution | 2.4 | 1.3 |
Note: ○ School places and ICSEA performance based on latest ACARA data ○ Student and qualification splits based on population weighted averaging of Census data released for SA2 areas that intersect the catchment. * Estimated resident student population includes those attending tertiary education
Housing
Dwelling structure within Kogarah, as evaluated at the latest Census, comprised 22.1% houses and 77.9% other dwellings (semi-detached, apartments, 'other' dwellings), in comparison to Greater Sydney's 55.3% houses and 44.7% other dwellings. Meanwhile, the level of home ownership within Kogarah was lagging that of Greater Sydney, at 22.8%, with the remainder of dwellings either mortgaged (29.4%) or rented (47.8%). The median monthly mortgage repayment in Kogarah was below the Greater Sydney average at $2,251, while the median weekly rent figure was recorded at $464, compared to Greater Sydney's $2,427 and $470.
TABLE |
GRAPHIC
| Metric | Catchment | Greater Sydney |
|---|---|---|
| Structures | ||
| - House | 22.1% | 55.3% |
| - Semi Detatched | 7.5% | 12.8% |
| - Apartments | 69.7% | 31.3% |
| Ownership | ||
| - Owned Outright | 22.8% | 28.6% |
| - Mortgaged | 29.4% | 34.2% |
| - Renting | 47.8% | 37.2% |
| Costs | ||
| Median Morgage Cost ($/mo) | $2,251 | $2,427 |
| Median Rental ($/wk) | $464 | $470 |
| - 0 to 149 ($/wk) | 1.2% | 5.4% |
| - 150 to 349 ($/wk) | 11.0% | 16.1% |
| - 350 to 649 ($/wk) | 80.1% | 59.1% |
| - 650 to 949 ($/wk) | 7.4% | 14.9% |
| - 950+ ($/wk) | 0.3% | 4.5% |
| Aggregate Housing Cost ($/mo) | $1,623 | $1,587 |
Diversity
Kogarah scores highly on cultural diversity, with 59.8% of its population born overseas and 65.0% speaking a language other than English at home.
The main religion in Kogarah was found to be Christianity, which makes up 46.2% of people in Kogarah. However, the most apparent overrepresentation was in Hinduism, which comprises 16.0% of the population, substantially higher than the Greater Sydney average of 5.2%. In terms of country of origin, the top three represented groups in Kogarah area are Other, comprising 26.5% of the population, which is substantially higher than the regional average of 16.0%, Chinese, comprising 14.4% of the population, which is substantially higher than the regional average of 8.4%, and English, comprising 9.8% of the population, which is notably lower than the regional average of 18.9%. Additionally, there are notable divergences in the representation of certain other groups. Australian is notably lower than the regional average, comprising 8.9% of Kogarah population compared to 17.8% regionally. Greek is substantially higher than the regional average, comprising 6.9% of Kogarah population compared to 1.9% regionally..
TABLE |
GRAPHIC
| Metric | Catchment | Greater Sydney |
|---|---|---|
| Culture | ||
| - Australian Born | 40.3% | 59.5% |
| - O/S Born | 59.8% | 40.5% |
| - Australian Citizen | 67.0% | 80.8% |
| - English Only | 35.0% | 60.5% |
| - Second Language At Home | 65.0% | 39.5% |
| Religion | ||
| - Buddhism | 5.2% | 4.1% |
| - Christian | 46.2% | 49.0% |
| - Hinduism | 16.0% | 5.2% |
| - Islam | 6.0% | 6.7% |
| - Judaism | 0.2% | 0.8% |
Health
Kogarah's residents boast exceedingly positive health performance metrics with younger cohorts in particular seeing very low prevalence of common health conditions and the rate of private health cover was found to be fairly high at approximately 53% of the total population (~8,068 people). The most common medical conditions in the area were found to be arthritis and asthma, impacting 5.5 and 5.2% of residents, respectively, while 80.1% declared themselves as completely clear of medical ailments compared to 74.6% across Greater Sydney. Overall 4.7% of the total population registered as requiring assistance with day to day activities, which is below average .
For a far more detailed assessment of health metrics and drivers, including detailed hospital supply, admission and procedure data, Medicare expenditure across cohorts, practitioner locations, relativities and expenditure forecasts please see the medical section or enquire about access.
TABLE |
GRAPHIC
| Metric | Catchment | Catchment 65+ | Greater Sydney | Greater Sydney 65+ |
|---|---|---|---|---|
| General | ||||
| - Need for Assistance | 4.7% | n.a. | 5.2% | n.a. |
| - Private Health Cover Rate | 53.4% | n.a. | 59.3% | n.a. |
| Long Term Health Conditions | ||||
| - Zero L/T Health Conditions | 80.1% | 35.6% | 74.6% | 38.3% |
| - One Long Term Condition | 14.2% | 32.4% | 18.0% | 32.3% |
| - Two Long Term Conditions | 3.8% | 15.6% | 5.0% | 16.1% |
| - 3+ Long Term Conditions | 2.0% | 10.8% | 2.4% | 10.7% |
| Individual Conditions Detail | ||||
| - Arthritis | 5.5% | 28.1% | 7.3% | 28.7% |
| - Asthma | 5.2% | 6.7% | 7.3% | 7.9% |
| - Cancer | 1.9% | 9.2% | 2.6% | 10.2% |
| - Demential / Alzheimers | 0.9% | 6.5% | 0.7% | 4.6% |
| - Diabetes | 4.4% | 17.9% | 4.9% | 16.8% |
| - Heart Disease | 3.5% | 18.7% | 3.6% | 16.6% |
| - Kidney Disease | 0.8% | 4.1% | 0.9% | 3.4% |
| - Lung Condition | 0.9% | 4.9% | 1.3% | 5.7% |
| - Mental Health Issue | 5.1% | 8.3% | 7.1% | 7.4% |
| - Stroke | 0.6% | 3.7% | 0.8% | 3.8% |
| - Other Condition | 6.9% | 16.9% | 8.0% | 15.6% |
Note: ○ Private health cover estimated from percentile ranges of taxable income to private health coverage ratios by the ATO.
Land Use
There are a total of seven different land-use categories across Kogarah's 222 hectare land-mass, the most prominent being residential, parkland and education, which make up approximately 137.2 (61.8%), 34.7 (15.6%) and 20.2 (9.1%), hectares of land, respectively. Please note; totals and percentages based on sum of categorised mesh blocks that fall within Kogarah as opposed to total Kogarah land area - minor differences may exist between land-use category totals and total land area, as mesh blocks at the edges of Kogarah are unlikely to intersect perfectly along Kogarah boundary.
CHART |
MAP
Surrounds
Enter Search Term
The surrounds feature enables AreaSearch clients to quickly assess the catchment for nearby places of interest via our integration with the Google Places API.
Up to 60 results per search category can be attained. Please input, or select, a term to search. Please note 5 account credits are used per 100 results returned from this search, which accumulates on your account due to 3rd party data costs.
| Type | Name | Address | Distance | In Catch | G-Map | G-Search | Display |
|---|
Public Transport & Access
STOPS MAP | GRAPHIC

Total Stops

Trips

Routes / Wk

Population / Stop

Population / Trip

Population / Route

Avg Dist of Stops

Res Distance
Catchment / Greater Sydney Avg
| Type | Name | Distance | Routes | Trips / Wk |
|---|
Child Care Analysis
| Id | Name | Type | Places | Approval | Distance (Km) | Day Rate | Availability |
|---|
Key Metrics
Catchment / Greater Sydney

LDC Providers

Total LDC Places

Total Population

Persons Per Place

Persons Per Place (Comm Adj)

Population Aged 0-4

Pop Aged 0-4 Per LDC Place

Pop Aged 0-4 Per LDC Place (Comm Adj)

Total School Attendance

School Places Per LDC Place

Average LDC Fee($/day)

Other Places (PSK / OOSH)
Medical Analysis
MAP DATA |
SUPPLY RELATIVITIES |
MBS DEMAND DATA |
SUMMARY TEXT
| Map Ref | Name | Address | Services | Dist |
|---|
| Category | Count | Closest | Population Per | Avg Dist | Reg Pop Per | Reg. Avg Dist |
|---|
| Category | Count | Closest | Population Per | Pop. Per Comm Adj | Avg Dist | Reg Pop Per | Reg. Avg Dist |
|---|
Overview
Medical Services
Medical MBS Spending
SUMMARY TABLES
| POPULATION AGE SPLITS | 0-24 | 25-44 | 45-64 | 65+ | Total |
|---|---|---|---|---|---|
| 2022 Est | 888 | 123 | 123 | 123 | 123 |
| 2041 Fcst | 888 | 123 | 123 | 123 | 123 |
| Growth Fcst | 10% | 10% | 10% | 10% | 10% |
| Growth Rate | 10% | 10% | 10% | 10% | 10% |
| POPULATION GROWTH HISTORY | Catchment | Region | |||
|---|---|---|---|---|---|
| Growth From Census | 500 | 600 | |||
| 2016 to 2021 Growth | 500 | 600 | |||
| 2011 to 2016 Growth | 500 | 600 | |||
| 2006 to 2011 Growth | 500 | 600 | |||
| Metric | Catchment | Catchment 65+ | Greater Sydney | Greater Sydney 65+ |
|---|---|---|---|---|
| General | ||||
| - Need for Assistance | 4.7% | n.a. | 5.2% | n.a. |
| - Private Health Cover Rate | 53.4% | n.a. | 59.3% | n.a. |
| Long Term Health Conditions | ||||
| - Zero L/T Health Conditions | 80.1% | 35.6% | 74.6% | 38.3% |
| - One Long Term Condition | 14.2% | 32.4% | 18.0% | 32.3% |
| - Two Long Term Conditions | 3.8% | 15.6% | 5.0% | 16.1% |
| - 3+ Long Term Conditions | 2.0% | 10.8% | 2.4% | 10.7% |
| Individual Conditions Detail | ||||
| - Arthritis | 5.5% | 28.1% | 7.3% | 28.7% |
| - Asthma | 5.2% | 6.7% | 7.3% | 7.9% |
| - Cancer | 1.9% | 9.2% | 2.6% | 10.2% |
| - Demential / Alzheimers | 0.9% | 6.5% | 0.7% | 4.6% |
| - Diabetes | 4.4% | 17.9% | 4.9% | 16.8% |
| - Heart Disease | 3.5% | 18.7% | 3.6% | 16.6% |
| - Kidney Disease | 0.8% | 4.1% | 0.9% | 3.4% |
| - Lung Condition | 0.9% | 4.9% | 1.3% | 5.7% |
| - Mental Health Issue | 5.1% | 8.3% | 7.1% | 7.4% |
| - Stroke | 0.6% | 3.7% | 0.8% | 3.8% |
| - Other Condition | 6.9% | 16.9% | 8.0% | 15.6% |
| MBS DEMAND | Catchment | Region | |||
|---|---|---|---|---|---|
| All Ages | 65+ | All Ages | 65+ | ||
| GP Services per 100 | TBC | TBC | TBC | TBC | |
| GP Fees Per 100 | TBC | TBC | TBC | TBC | |
| Allied Services per 100 | TBC | TBC | TBC | TBC | |
| Allied Fees Per 100 | TBC | TBC | TBC | TBC | |
| AREA DRIVERS | Catchment | Percentile | |||
|---|---|---|---|---|---|
| Private Health Cover (% of Population) | TBC | TBC | |||
| SEIFA ranking - Income | TBC | TBC | |||
| SEIFA ranking - Education | TBC | TBC | |||
| Median Household Income | TBC | TBC | |||
| University Graduate % | TBC | TBC | |||
| Commercial / Residential Adjustment | TBC | TBC | |||
| Residential Development Activity (Per 100) | TBC | n.a. | |||
| Transport Activity (Pop per Trip) | TBC | TBC | |||
MBS DEMAND
| Category | Statistic | Cohort | Catchment | Region |
|---|

GENERATE REPORT

PPT / WORD
EXCEL
Please use the below form to get in touch
Join Browser
The Browser Plan provides access to the AreaSearch system for a single user, enabling area views and downloads in PDF format for quick and effective analysis and comparison of local markets. The 150 plan credits can be used at anytime throught the year.

Session Timeout Warning
Your session is about to expire in 30 seconds. Would you like to extend your session?

Join Pro
The Professional Plan provides access to the AreaSearch system for up to 5 users, enabling custom area analysis, downloads in PowerPoint that can be edited and recoloured to suit specific reporting needs, full economic dataset downloads and more. TargetSearch access is included within the annual plan and sector access can be added upon request.
$150/mo
150 credits per month
Cancel anytime
Plus GST
$1000/yr
1500 credits per year
Includes Target Search
Plus GST

Pro Monthly