
estimated as @ February 25 *
ABS ERP | 10,195 people | June 2024
3.1 Land Area (SqKm)3,291 Pop Density (P/SqKm)
2021 Census
10,292 People
5.5% Growth from 2016c
3,080 Dwellings
3.3 Persons Per Dwelling
2016 Census
9,751 People
3.4% Growth from 2011c
2,863 Dwellings
The following analysis is undertaken for the Edensor Park (SA2) area. As of February 25, AreaSearch has determined that Edensor Park's population is approximately 10,201. Comparing this to the 2021 Census population of 10,292 people, there has been a slight 0.9% decline . This change is due to an estimated resident population of 10,195 from the ABS as of June 2024 and an additional 11 validated new addresses since the Census date. Given the location's 3.1sq km land mass, Edensor Park possesses an estimated population density of 3,291 persons per square kilometre, with the 2021 Census showing 3.3 persons per dwelling.
About the Area
The location of Edensor Park, situated in New South Wales, Australia, is renowned for its delightful mix of nature and residential spaces, making it a preferred destination for those seeking a serene and peaceful environment. The area is well known for its lush parks, stunning landscapes, and recreational facilities, offering a plethora of activities for the residents, including walking tracks and sports grounds. Additionally, Edensor Park takes pride in its close-knit, multicultural community that brings vibrancy and diversity to the neighborhood through various cultural events and local festivities. Moreover, the location is equipped with excellent amenities such as schools, shopping centers, and dining options, catering to the convenience and lifestyle needs of its residents.

Segmentation & Links
The Area's CompositionThe suburb of Edensor Park hosts the entirety of the catchment's population, while Edensor Park was found to be the only SA2 area falling within its bounds. Meanwhile, the entire catchment is within the Fairfield local government area.
["10269850000","10269860000","10269890000","10269900000","10269910000","10269940000","10269960000","10269970000","10269980000","10269990000","10270020000","10270030000","10270080000","10270090000","10270101000","10270102000","10270103000","10270120000","10270130000","10270170000","10270180000","10270200000","10270230000","10270240000","10271080000","10272160000","10272170000","10272180000","10272190000","10272200000","10272210000","10272230000","10272250000","10272261000","10272262000","10272290000","10274940000","10275241000","10275242000","10275250000","10275261000","10275262000","10275270000","10275281000","10275282000","10275290000","10275300000","10275310000","10275320000","10275330000","10275340000","10275350000","10275360000","10275370000","10275380000","10275390000","10275400000","10275410000","10275420000","10275430000","10275440000","10275450000","10275470000","10275480000","10275490000","10275501000","10275511000","10275512000","10275513000","10275520000","10275530000","10275550000","10275560000","10275570000","10275580000","10275590000","10275600000","10275610000","10275620000","10275630000","10275640000","10275650000","10275660000","10275670000","10275680000","10275690000","10275701000","10275702000","10275710000","10275720000","10275730000","10275740000","10277042000","10923170000","10923180000","10923190000","10923200000","10923630000","10924680000","10924690000","10924700000","10924710000","10924720000","10924730000"]STATISTICAL 2 |
LOCAL GOVERNMENT |
SUBURBS
| SA2 | Analysis Page | ABS Link | Persons 2016c | Persons 2021c | est. February 25 | Catchment % | View |
|---|
SA2 | Analysis Page | ABS Link | Persons 2016c | Persons 2021c | est. February 25 | Catchment % | View |
|---|---|---|---|---|---|---|---|
| Edensor Park | Link | 9,751 | 10,292 | 10,201 | 100.0 |
Note: Persons shown represent those falling within the catchment, not necessarily the full SA2.
| LGA | ABS Link | Developments | Zoning | Persons 2016c | Persons 2021c | est. February 25 | Catchment % | View |
|---|
LGA | ABS Link | Developments | Zoning | Persons 2016c | Persons 2021c | est. February 25 | Catchment % | View |
|---|---|---|---|---|---|---|---|---|
| Fairfield | Link | 9,751 | 10,292 | 10,201 | 100.0 |
Note: Persons shown represent those falling within the catchment, not necessarily the full LGA.
| Suburb | AS Pages | Persons 2016c | Persons 2021c | est. February 25 | Catchment % | View |
|---|
Suburb | AS Pages | Persons 2016c | Persons 2021c | est. February 25 | Catchment % | View |
|---|---|---|---|---|---|---|
| Edensor Park | Child Care | 9,751 | 10,292 | 10,201 | 100.0 |
Note: Persons shown represent those falling within the catchment, not necessarily the full suburb.

Transactions & Housing Trends
TRANSACTIONS | TRENDSOf the 50 residential sales shown in the suburb of Edensor Park the average sale value equated to $1,472,988 with a median value of $1,400,000 between June 2024 and February 2025. Of the 28 resales analysed by AreaSearch, there was an average gain on sale of $712,000 from an aggregate holding period of 11.8 years. This reflects an annual appreciation rate of 5.7% p.a., or a typical gain of $60,376 for each year held.
SELECT DATA
| id | Address | Suburb | Sale Price | Sale Date | Type |
|---|
id | Address | Suburb | Sale Price | Sale Date | Type |
|---|---|---|---|---|---|
| 22 BOOMERANG ROAD | EDENSOR PARK | 2,352,000 | 2024-10-11 | RESIDENCE | |
| 2 MILDARA PLACE | EDENSOR PARK | 2,120,000 | 2025-02-10 | RESIDENCE | |
| 58 WEEROONA ROAD | EDENSOR PARK | 2,045,000 | 2024-08-12 | RESIDENCE | |
| 16 TUCKER PLACE | EDENSOR PARK | 1,975,000 | 2024-07-22 | RESIDENCE | |
| 22 YALUMBA PLACE | EDENSOR PARK | 1,891,000 | 2024-12-19 | RESIDENCE | |
| 8 KIRKTON PLACE | EDENSOR PARK | 1,875,000 | 2024-09-09 | RESIDENCE | |
| 18 TUCKER PLACE | EDENSOR PARK | 1,860,000 | 2024-11-29 | RESIDENCE | |
| 11 COONAWARRA STREET | EDENSOR PARK | 1,750,000 | 2025-01-31 | RESIDENCE | |
| 99 SWEETHAVEN ROAD | EDENSOR PARK | 1,670,000 | 2024-06-03 | RESIDENCE | |
| 22 WAGSTAFF STREET | EDENSOR PARK | 1,650,000 | 2024-11-06 | RESIDENCE |
Download the Latest 100 Sales
Click the button to download the most recent sales data for Edensor Park in CSV format.
Note: Sale data NSW Valuer General analysed by AreaSearch
SELECT DATA
Source: NSW Valuer General transactions analysed by AreaSearch
Download the Sale Trends
Click the button to download the annual sales trends in CSV format.
Sales Trends FAQ
How many total sales records are available for Edensor Park?
There are currently 0 total sales records that AreaSearch has analysed from the NSW Valuer General that fall within Edensor Park that can be refined and searched, with 0 available across broader Greater Sydney.
Why is your analysis for Edensor Park focused only on houses?
With attached properties repesenting only (6.6%) of overall sales activity in the past decade, the low level of activity can make detailed analysis unreliable given the market's dominance of detached dwellings.
What is the median sale price for houses in Edensor Park as of 2024?
As of 2024, the median sale price for houses in Edensor Park is $1,344,500.
How has the median sale price for houses changed in Edensor Park over the last 10 years?
Over the last 10 years, from 2014 to 2024, the median sale price for houses in Edensor Park increased by 118.6%, from $615,000 to $1,344,500. This represents a compound annual growth rate (CAGR) of 8.1%.
What is the median number of years properties are held between sales for houses in Edensor Park?
As at 2024, houses are held for a median of 9.4 years.
What are the typical resale gains for houses in Edensor Park?
As at 2024, the median gain over the prior sale for houses in Edensor Park is $654,000.

Summary
Edensor Park is a vibrant suburb located approximately 30 kilometers west of the Sydney CBD, characterized by its family-friendly atmosphere and culturally diverse community. The area is predominantly populated by families and couples with children, contributing to a lively environment filled with teenagers. Despite facing challenges in population growth compared to Greater Sydney, Edensor Park has shown resilience with an average growth rate of 1.7% over recent census periods. This volatility in growth reflects both the area's potential and the impact of planned major infrastructure projects that are expected to enhance its appeal and drive future performance.
A key standout factor for Edensor Park is its low relative development activity when compared to the national average, which presents opportunities for future investment and growth. The suburb boasts good schools, an abundance of parks and green spaces, as well as a quiet residential setting that appeals to families seeking a tranquil lifestyle. Additionally, residents benefit from close proximity to convenience stores and supermarkets, making daily life more accessible while fostering a strong sense of community among its culturally diverse population.
- Population Growth40%
- Development Activity39%
- Employment Drivers27%
- Income31%
- Age47%
- Education20%
- Transport & Access83%
- Cultural Diversity96%
- Health76%
- Housing Cost76%
- Rate Sensitivity55%
- Infrastructure Drivers78%

High population level born overseas

High median household size

High proportion 15 to 24yo

High industry employment forecasts
FAQ
INFRA
AMENITY
TRANSPORT
SURROUNDS
GET REPORT
POPULATION
DEVELOPMENT
EMPLOYMENT
LAND USE
AGE
INCOME
EDUCATION
HEALTH
HOUSEHOLDS
DIVERSITY
HOUSING
FAQ
INFRA
AMENITY
TRANSPORT
SURROUNDS
GET REPORT
POPULATION
DEVELOPMENT
EMPLOYMENT
LAND USE
AGE
INCOME
Population
An assessment of population growth drivers in Edensor Park reveals an overall ranking slightly below national averages considering recent and medium term trends. Total population for Edensor Park was estimated by AreaSearch to be approximately 10,201 as at February 25 (~48.2% male and 51.8% female), which represented a slight 0.9% decline from the 10,292 recorded as at the 2021 Census period. This is based upon an estimated resident population of 10,195 from the ABS up to June 2024 and an additional 11 validated new addresses since the Census date. This level of population equates to a density ratio of 3,291 persons per square kilometer, placing it in the upper quartile relative to national locations assessed by AreaSearch.
Population growth for the area was primarily driven by overseas migration that contributed approximately 78% of overall population gains during recent periods. Over the census periods assessed Edensor Park underperformed Greater Sydney across each timeframe in terms of growth with the location's growth profile showing a very high level of volatility with an average growth level in each 5yr census period of 1.7%.
Moving forward with demographic trends, a population increase just below the median of national areas is expected, with the area expected to grow by 498 persons to 2041 based on the latest population numbers, with an increase of 4.9% in total over the 17 years.
GROWTH |
HEATMAP |
TABLE |
FORECAST |
GRAPHIC
Note: The above heatmap details the distribution of the catchment's population at a mesh block level (the smallest level of data produced by the ABS) as at the 2021 Census.
| Metric | Catchment | Greater Sydney |
|---|---|---|
| Totals | ||
| - Latest Estimate @ February 25 | 10,201 | 5,485,260 |
| - ABS ERP Estimate @ June-24 | 10,195 | 5,557,233 |
| - Pop 2021 c | 10,292 | 5,231,147 |
| - Pop 2016 c | 9,751 | 4,823,993 |
| - Pop 2011 c | 9,427 | 4,391,673 |
| - Pop 2006 c | 9,368 | 4,119,190 |
| - Pop 2001 erp | 9,748 | 4,102,580 |
| Census Growth Rates | ||
| - 2016 to 2021 Growth | 541 (5.5%) | 407,154 (8.4%) |
| - 2011 to 2016 Growth | 324 (3.4%) | 432,320 (9.8%) |
| - 2006 to 2011 Growth | 59 (0.6%) | 272,483 (6.6%) |
| - 2001 to 2006 Growth | -28 (-0.3%) | 153,581 (3.7%) |

Note: Population figures above are provided on both Census periods (c) and Estimated Resident Population (erp) basis. ERP figures are calculated annually by the ABS as at June 30 and have been adjusted for new Census boundaries with the 2021 Census. As figures differ slightly, growth rates over periods have been calculated using the same basis. For example 2016 to 2021 growth is based on available Census data, while 2001 to 2006 has used an ERP basis due to mesh block level Census data being unavailable.
AreaSearch is adopting ABS/Geoscience Australia projections for each SA2 area, as released in 2024 with 2022 as the base year. For any SA2 areas not covered by this data, AreaSearch is utilising the NSW State Government's SA2 level projections, as released in 2022 with 2021 as the base year. Growth rates by age group from these aggregations are also applied to all areas for years 2032 to 2041.
Employment
Total resident employment within Edensor Park equated to 4,585 as at Dec-2024, while the unemployment rate was 5.9%, compared to 4.1% for Greater Sydney (please note local unemployment rates are calculated on a trend basis and lag more up-to-date state figures released by the ABS). Total employment increased 3.5% over the year to Dec-2024 in Edensor Park, while labour force increased 4.0%, causing the unemployment rate to rise 0.4% over the same period. These figures can be compared to Greater Sydney's performance, where total employment increased 1.6%, the region's labour force increased 2.3% and its unemployment rate rose 0.6%. Also noteworthy is Edensor Park's participation rate, which trails the Greater Sydney average at 45.7%.
The interest rate tightening cycle from the RBA is now having an effect on job advertisements growth, a positive for lowering inflation expectations, with a moderation seen over the past year as advertised roles in the Sydney employment region remained relatively stable. Looking relative to longer term trends however, the 346,698 job advertisements recorded as at 2025-Feb were below the longer term average of 450,654.
The key industries of employment are health care & social assistance, retail trade and construction, which make up 12.3%, 12.2% and 10.4%, respectively.
Jobs and Skills Australia provides national projections of growth expected by industry over five and 10 year periods from May 2024, which can be overlaid onto Edensor Park's employment composition to get a gauge as to potential future employment demand. Nationally employment levels are expected to grow by 6.6% over the coming five years and 13.7% over the ten year period, but vary substantially across industry segments. When industry expectations are applied to Edensor Park as described above, the area should increase 6.1% over the five year period and 12.8% over the ten year period. Please note this is a simple weighting extrapolation for illustrative purposes and does not take into account localised population projections.
EMPLOYMENT |
UNEMPLOYMENT |
TABLE |
GRAPHIC
| Metric | Catchment | Greater Sydney |
|---|---|---|
| Totals | ||
| - Labour Force | 4,870 | 3,144,383 |
| - Employment | 4,585 | 3,015,916 |
| - Unemployment | 285 | 128,467 |
| - Unemployment Rate | 5.9% | 4.1% |
| Employment Percentages by Industry | ||
| - Agriculture Forestry & Fishing | 0.6% | 0.5% |
| - Mining | 0.3% | 0.2% |
| - Manufacturing | 10.0% | 5.7% |
| - Utilities & Waste Services | 0.5% | 0.9% |
| - Construction | 10.4% | 8.6% |
| - Wholesale Trade | 3.5% | 3.4% |
| - Retail Trade | 12.2% | 9.3% |
| - Accommodation & Food Services | 5.4% | 5.8% |
| - Logistics | 7.3% | 5.3% |
| - IT & Telecommunication | 1.6% | 2.5% |
| - Finance & Insurance | 5.0% | 7.3% |
| - Rental & Real Estate | 1.6% | 2.0% |
| - Professional & Technical Services | 6.3% | 11.5% |
| - Administration and Support | 3.7% | 3.4% |
| - Public Admin and Safety | 5.6% | 5.8% |
| - Education & Training | 8.8% | 8.9% |
| - Healthcare & Social Assistance | 12.3% | 14.1% |
| - Arts & Recreation | 0.9% | 1.6% |
| - Other Services | 3.9% | 3.4% |
Note: ○ Employment estimates based on population weighted averaging of figures published for SA2 areas that intersect the catchment ~ DESE data released quarterly with 3 month time-lag ○ Additional AreaSearch population-weighted estimates and backdating applied to SA2 areas formulated as at 2021 Census
Development
Dwelling approval data is released monthly by the ABS, there was 59 residential approvals completely comrised of detached house approvals registered in Edensor Park over the past two financial years, with FY-25 presently on track to deliver 24 on an annualised basis given the 14 recorded to date. Looking at development activity over the previous five financial years, Edensor Park's approval levels are currently running above the yearly average of 26, with a clear downward tend in approvals apparent from historic rates.
Dwelling approval activity in Edensor Park has been lower than that observed across the broader region, with approval levels standing at 0.29 per 100 people, compared to 0.57 in Greater Sydney. This translates to one dwelling being approved for every 345 people in Edensor Park, against one for every 180 in Greater Sydney. With the population expected to increase by 487 people by 2041, around 148 new dwellings will be necessary. Recent approval levels appear more than sufficient to meet these forecasts, considering the census average of 3.3 persons per dwelling. This suggests that population growth may exceed trend projections in the coming years, supported by a robust housing supply.
Another important driver of capital value is densification, as measured by AreaSearch. This involves comparing the ratio of house to attached and 'other' dwelling approvals in recent applications with the housing stock ratio recorded in the latest Census. According to this analysis, 100% of recent approvals in Edensor Park were for houses, a figure 10.5% above the Census figure.
APPROVALS |
TABLE |
GRAPHIC
| Metric | Catchment | Greater Sydney |
|---|---|---|
| Totals | ||
| - Average Dwelling Approvals (5yr) | 26 | 35,080 |
| - Commercial Approvals ($000's) | 0 | 20,118,298 |
| - Densification Percentile | 50 | 0 |
| - Approvals (Annualised) | 24 | 32,370 |
| - Last FY | 29 | 26,702 |
| - Prior FY | 30 | 35,668 |
| Composition | ||
| - Approvals Per 100 Persons | 0.3 | 0.6 |
| - Persons Per Dev Approval | 345 | 180 |
| - Population Growth Per Dev Approval | -6.3 | 5.0 |
Note: ○ Dwelling approval estimates based on population weighted averaging of figures published for SA2 areas that intersect the catchment ~ ABS data released monthly with 3 month time-lag ○ Additional AreaSearch population-weighted backdating applied to SA2 areas formulated as at 2021 Census ○ DA to population relativities to help in assessment of supply and demand levels within an area ~ Approvals per 100 people is calculated over the the past 2 financial years, while population growth per approval is based on the past five years (to ABS ERP periods) to smooth volatility in population growth trends.
Age
The median ages within Edensor Park and the Greater Sydney region sit at 39 and 37, respectively, with Edensor Park's most over and under-represented age cohorts in comparison to the Greater Sydney average being the 65 - 74 (11.9% of the total population) and 35 - 44 (11.0% of the total population) age groups.
Looking at population forecasts by age brackets, the majority of the population increase is expected within the 75 to 84 age group, which is projected to expand by 626 people.
COHORTS |
FORECAST |
TABLE |
GRAPHIC
| Metric | Catchment | Greater Sydney |
|---|---|---|
| Median Age | 39 | 37 |
| Age Cohorts | ||
| - 0 to 4 | 512 (5.0%) | 320,340 (5.8%) |
| - 5 to 14 | 1,159 (11.4%) | 662,071 (12.1%) |
| - 15 to 24 | 1,521 (14.9%) | 714,181 (13.0%) |
| - 25 to 34 | 1,288 (12.6%) | 873,254 (15.9%) |
| - 35 to 44 | 1,121 (11.0%) | 834,857 (15.2%) |
| - 45 to 54 | 1,155 (11.3%) | 672,493 (12.3%) |
| - 55 to 64 | 1,421 (13.9%) | 571,016 (10.4%) |
| - 65 to 74 | 1,218 (11.9%) | 443,758 (8.1%) |
| - 75 to 84 | 593 (5.8%) | 283,040 (5.2%) |
| - 85 + | 218 (2.1%) | 110,254 (2.0%) |
Note: See population section for forecast methodology and references.
Income
The catchment area shows a median taxpayer income of $46,511 and an average of $59,561 according to the latest postcode level ATO data aggregated by AreaSearch for FY-22. This is lower than average on a national basis, contrasting with Greater Sydney's median income of $56,994 and average income of $80,856.
Looking at 2021 Census income data (that is provided on a median only basis and takes into account all residents) the median incomes within Edensor Park stand at $1,817 for households, $1,805 for families and $538 for personal compared to Greater Sydney's results of $2,077, $2,374 and $881 for the same metrics. The income bracket containing the largest proportion (~32% / 3,268 persons) of Edensor Park's population is the $1,500 - 2,999 grouping, similarly to Greater Sydney where 34% of the population fits into this bracket.
COHORTS |
TABLE |
GRAPHIC
| Metric | Catchment | Greater Sydney |
|---|---|---|
| SEIFA Score | 1.0 | n.a |
| ATO Weighted Taxable Income @ FY-22 | ||
| Average Taxable Income | 59,561 | 80,856 |
| Median Taxable Income | 46,511 | 56,994 |
| Census Median Incomes ($/wk) | ||
| Individual Income ($/wk) | 538 | 881 |
| Household Income ($/wk) | 1,817 | 2,077 |
| Family Income ($/wk) | 1,805 | 2,374 |
| Census Household Income Cohorts ($/wk) | ||
| - $0 to $399 | 289 (9.7%) | 145,477 (7.6%) |
| - $400 to $799 | 629 (21.2%) | 259,985 (13.6%) |
| - $800 to $1,499 | 789 (26.6%) | 404,315 (21.1%) |
| - $1,500 to $2,999 | 949 (32.0%) | 649,963 (34.0%) |
| - $3,000 to $3,999 | 201 (6.8%) | 207,033 (10.8%) |
| - $4,000+ | 109 (3.6%) | 244,883 (12.8%) |
Note: ○ ATO taxable income data is released at postcode level anually, this is then population weighted and income balanced by AreaSearch. ○ Census income estimates based on population weighted averaging of Census data released for SA2 areas that intersect the catchment ○ Post-housing cost income estimates based on based on median income to median monthly housing cost ratios calculated at Census.
Household Structure
There was an approximate total of 2,988 households within Edensor Park recorded at the 2021 Census. Median household size stands at 3.4, a figure above the Greater Sydney average of 2.7. Of these households, 85.6% are families, 10.3% are lone persons, 0.7% are group households, while 3.1% are 'other' households. Based on our latest estimates (see the population section) the total number of households has likely shrunk to 2,962.
The household type standing out as most clearly over-represented is family households, with 85.6% of Edensor Park's total households compared to 69.5% across Greater Sydney. Meanwhile, of Edensor Park's families, 19.6% are couples with no children, 49.1% are couples with children and 15.5% are single parent families, compared to 23.3%, 34.4% and 10.5% for Greater Sydney. Of Edensor Park's population, 33.3% have never been married while 52.3% are currently married, in contrast to Greater Sydney's results of 36.4% and 48.3% for the same metrics. Further, Edensor Park leads the Greater Sydney average of 1.5 children per family, recording a figure of 1.8.
TABLE |
GRAPHIC |
FAMILIES GRAPHIC
| Metric | Catchment | Greater Sydney |
|---|---|---|
| Totals | ||
| Total Households February 25 (est) | 2,962 | 2,004,515 |
| Total Households 2021c | 2,988 | 1,911,653 |
| Median Household Size | 3.4 persons | 2.7 persons |
| Household Cohorts | ||
| - Family Households | 2,536 (85.6%) | 1,327,644 (69.5%) |
| of which: | ||
| - Couple With Children | 1,245 (49.1%) | 456,975 (34.4%) |
| - Couple No Children | 497 (19.6%) | 309,740 (23.3%) |
| - One Parent Family | 393 (15.5%) | 139,005 (10.5%) |
| - Lone Person Households | 304 (10.3%) | 424,770 (22.2%) |
| - Group Households | 20 (0.7%) | 76,467 (4.0%) |
| - Other Households | 93 (3.1%) | 82,775 (4.3%) |
Infrastructure & Major Projects
The below list represents a summary of major planning, infrastructure and project announcements likely to impact upon the subject area. This data is compiled by AreaSearch from numerous sources for the benefit of our users, however, naturally, we can not guarantee to cover every project of interest. If there is a specific project you believe we have missed that warrants inclusion, please feel free to Contact Us and we will endeavour to incorporate your suggestion.
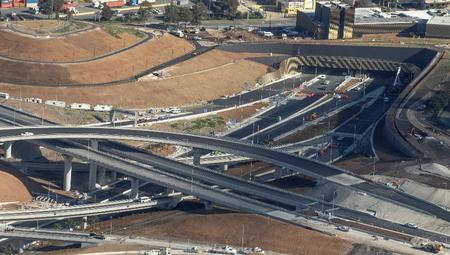
M7-M12 Integration And Delivery
Category: Transport & Logistics | Type: Major ProjectStage: Under Delivery Source / Links: Link 1 Admin ID: 145
The M7-M12 Integration and Delivery proposal, by the WSO Co joint venture, aims to widen the M7 and link it to the Western Sydney Airport via the M12, also managing the M12's operations.
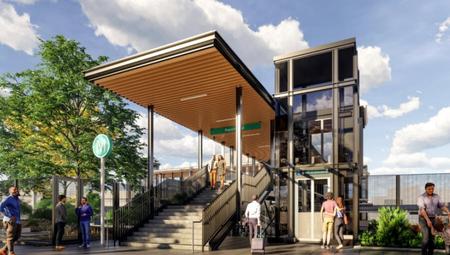
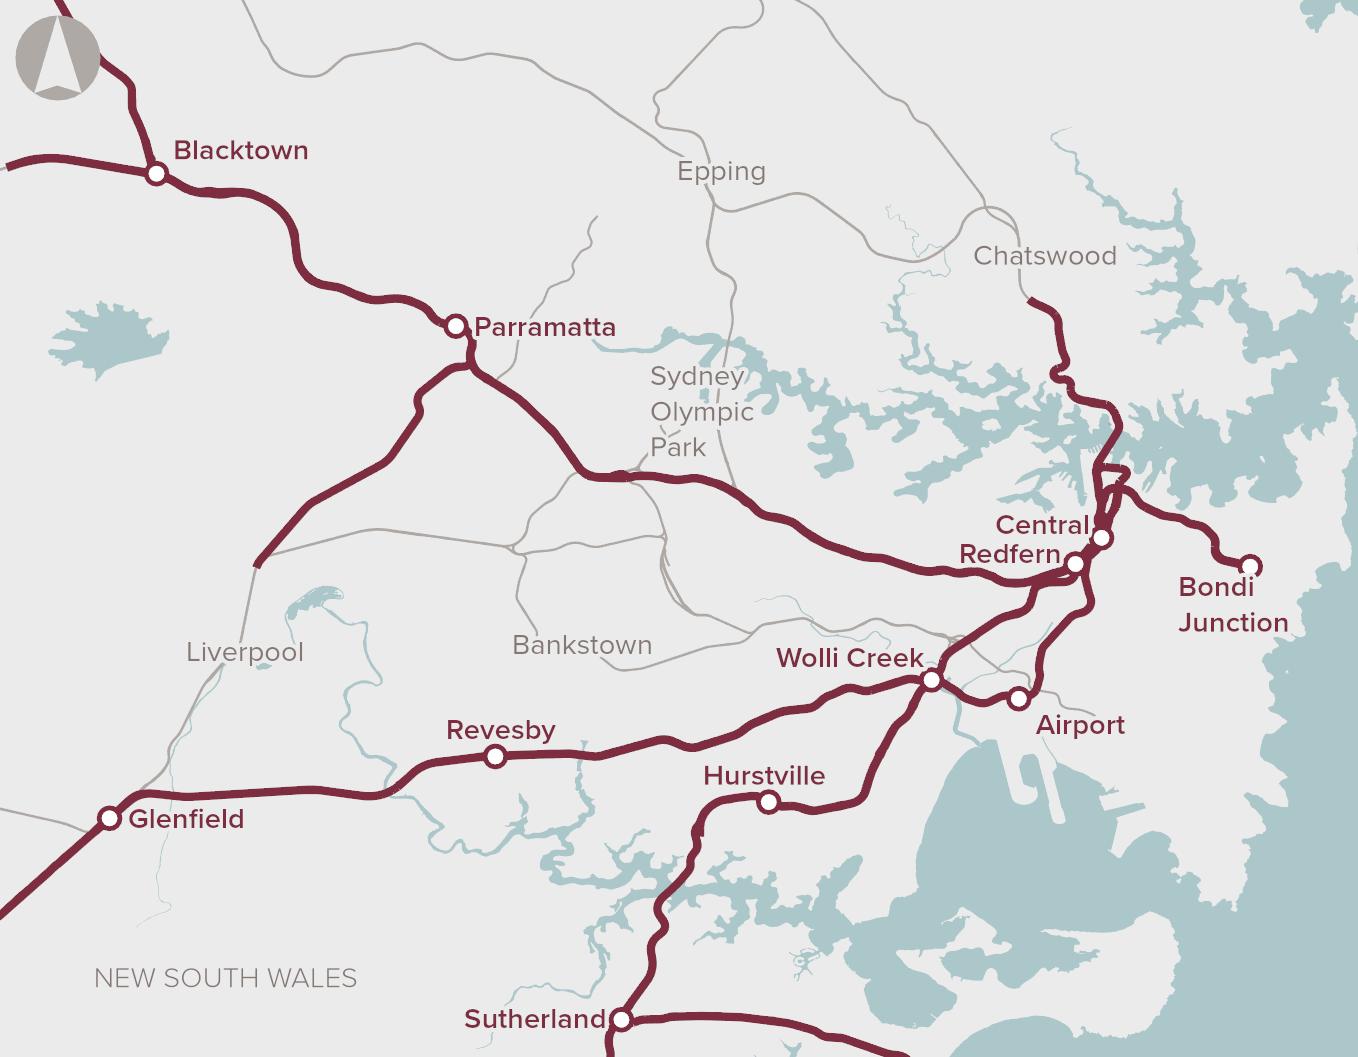
Sydney Metro Development
Category: Transport & Logistics | Type: Major ProjectStage: Under Delivery Source / Links: Link 1 Admin ID: 173
Australia's most extensive public transport initiative, Sydney Metro, aims to boost Sydney's rail capacity by 60% by 2024, adding new lines and stations across the city.
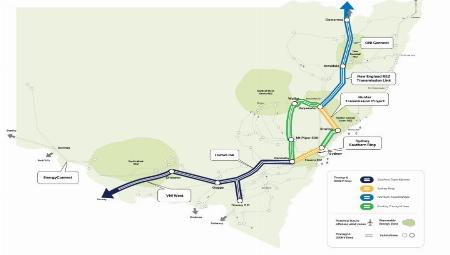
Sydney Southern Ring
Category: Energy | Type: Major ProjectStage: Prospective Source / Links: Link 1 Admin ID: 284
Transgrid's Sydney Southern Ring, a 500kV line project from Bannaby to South Creek, aims to support Sydney, Newcastle, Wollongong's demand. It includes new substations and line works to integrate renewable energy sources.
Mainsbridge School relocation
Category: Education & Training | Type: Local ProjectStage: Complete Source / Links: Link 1 Admin ID: 2953
The relocation of Mainsbridge School for Specific Purposes (SSP) to be part of the existing Warwick Farm Public School.
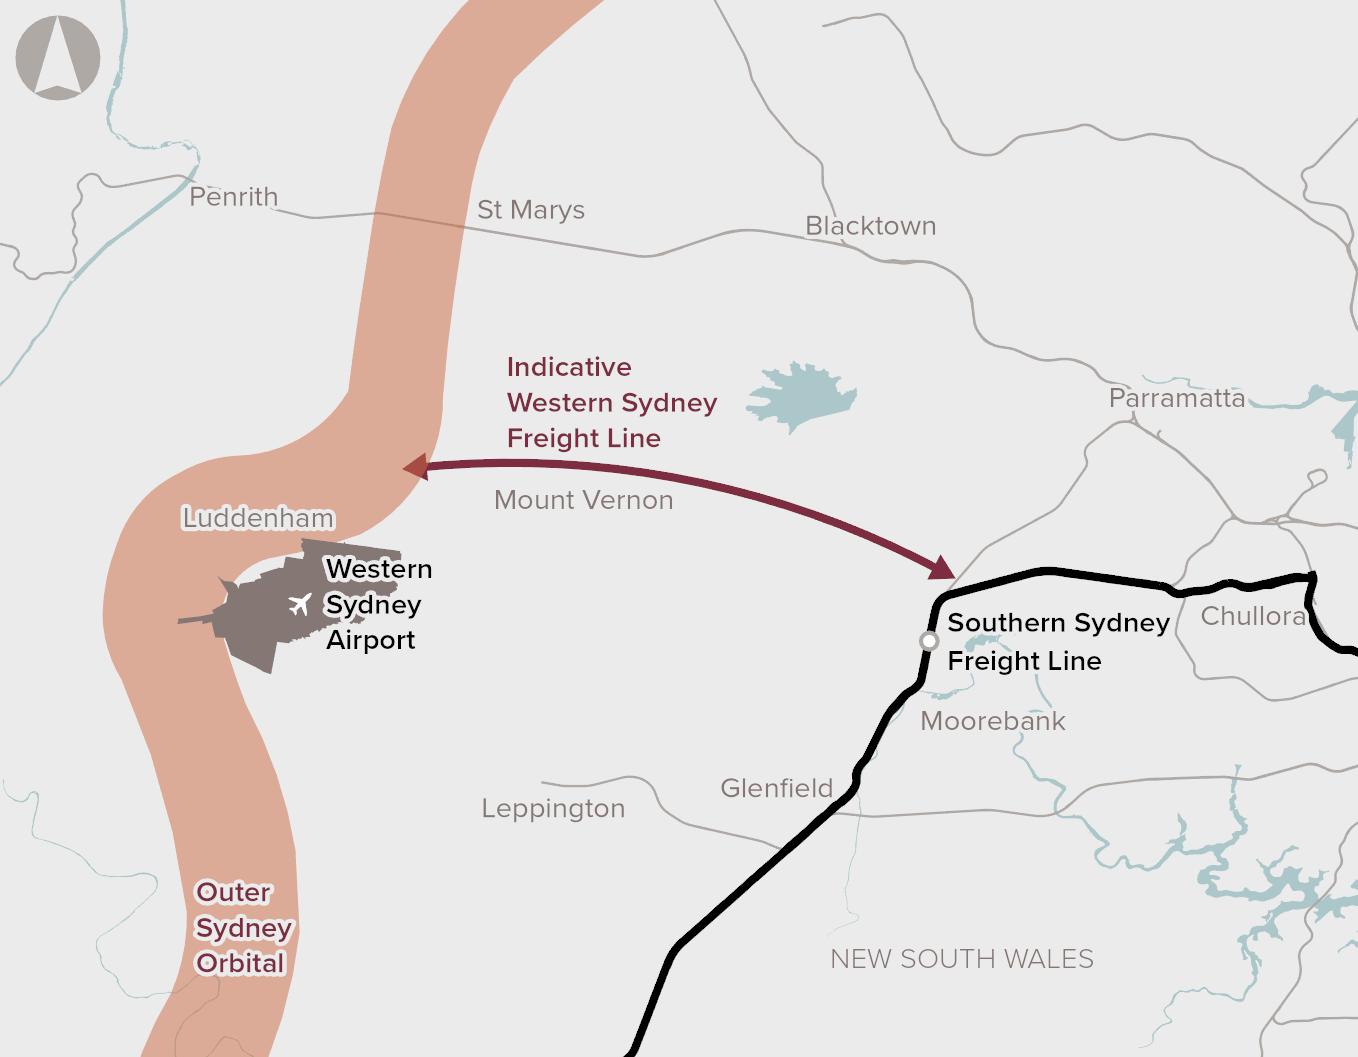
Corridor Preservation For Western Sydney Freight Line And Intermodal Terminal Access
Category: Transport & Logistics | Type: Major ProjectSource / Links: Admin ID: 797
Early proposal for a dedicated freight rail line in Sydney to connect Western Sydney with Port Botany, aiming to shift container freight from road to rail, reducing congestion and stimulating employment.

Liverpool City Centre Public Domain
Category: Communities, Precincts & Urban Renewal | Type: Major ProjectStage: Planning Source / Links: Link 1 Link 2 Admin ID: 3137
Liverpool Council's 10-year vision toguide the development of public space and pave the way to a greener, more vibrant andactivecity centre while fostering an 18-hour economy.
Western Sydney Freight Line And Intermodal Terminal
Category: Transport & Logistics | Type: Major ProjectSource / Links: Admin ID: 762
Proposal for a freight rail link and intermodal terminal in Western Sydney to address increased freight volume and reduce reliance on road transport, aimed at enhancing connectivity and reducing congestion.
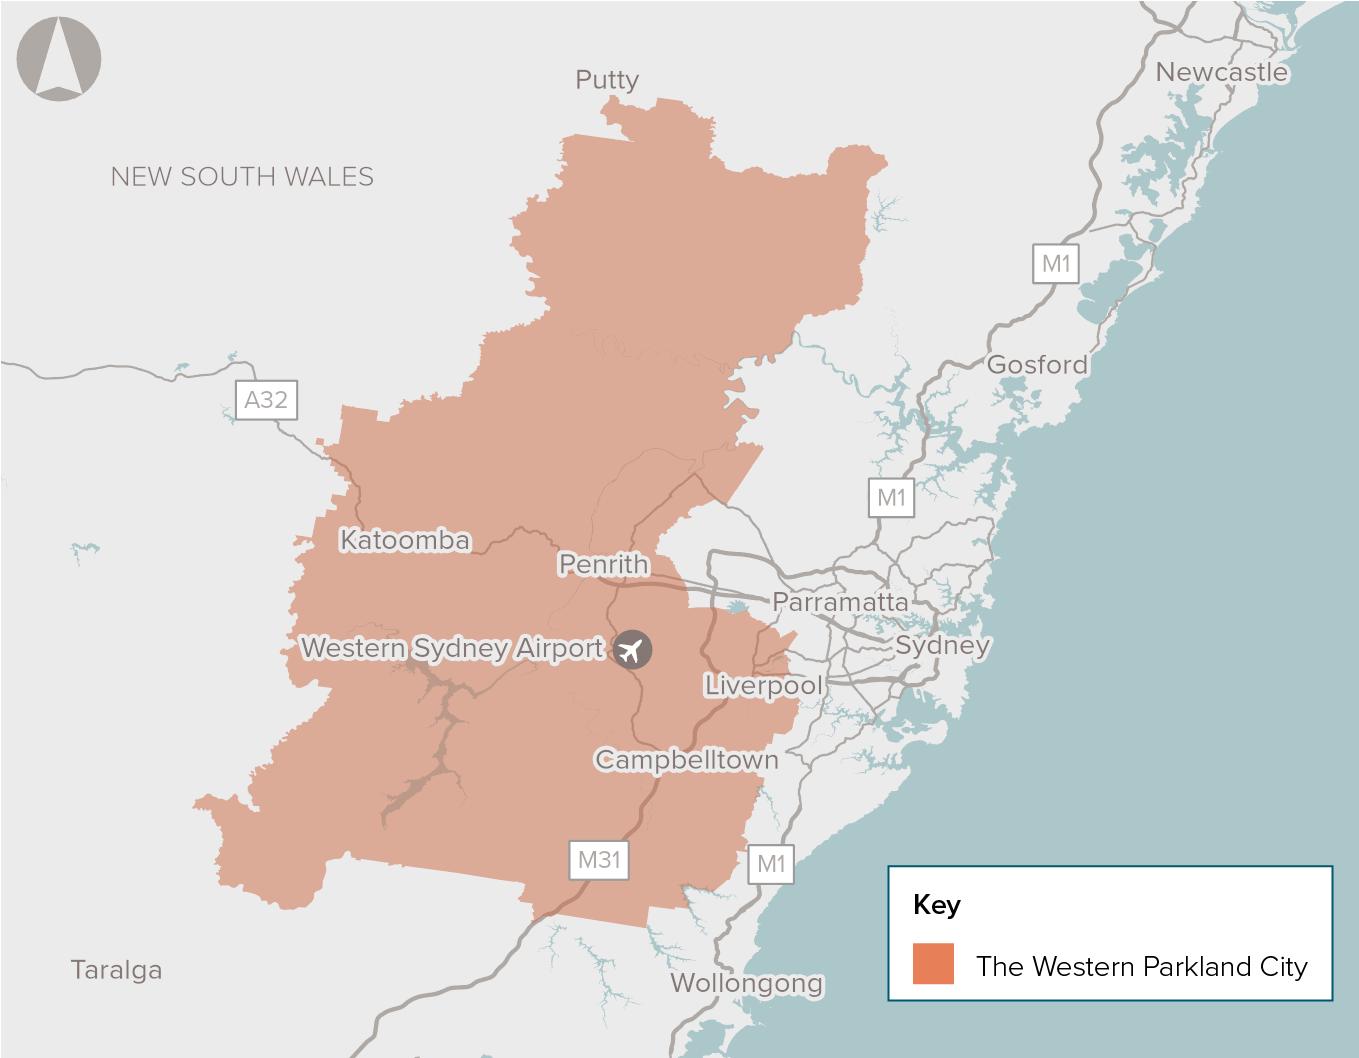
Digital Infrastructure To Enable Smart Technologies In The Western Parkland City
Category: Communities, Precincts & Urban Renewal | Type: Major ProjectSource / Links: Admin ID: 768
Investing in digital infrastructure to transform Western Parkland City into a digitally connected city, enhancing quality of life and service delivery through smart technologies.
WestConnex
Category: Transport & Logistics | Type: Major ProjectStage: Construction Source / Links: Link 1 Link 2 Admin ID: 3127
WestConnex will provide 33km of motorway to link western and south-western Sydney with the city, Kingsford Smith Airport and Port Botany precincts.
Bradfield City Centre
Category: Communities, Precincts & Urban Renewal | Type: Major ProjectStage: Planning Source / Links: Link 1 Link 2 Admin ID: 3131
This billion dollar investment will deliver a key Indo-Pacific hub for advanced manufacturing, aerospace and defence, agribusiness and pharma, freight and logistics, health and education.
New selective high school in South West Sydney
Category: Education & Training | Type: Local ProjectStage: Planning Source / Links: Link 1 Admin ID: 2962
A new selective high school in South West Sydney. Further updates will be released as the project progresses.
Woodward Place
Category: Communities, Precincts & Urban Renewal | Type: Major ProjectStage: Planning Source / Links: Link 1 Admin ID: 3138
The new lifestyle precinct will be known as Woodward Place. Council is beginning to develop a masterplan to deliver world-class facilities to support a healthy connected and diverse population.
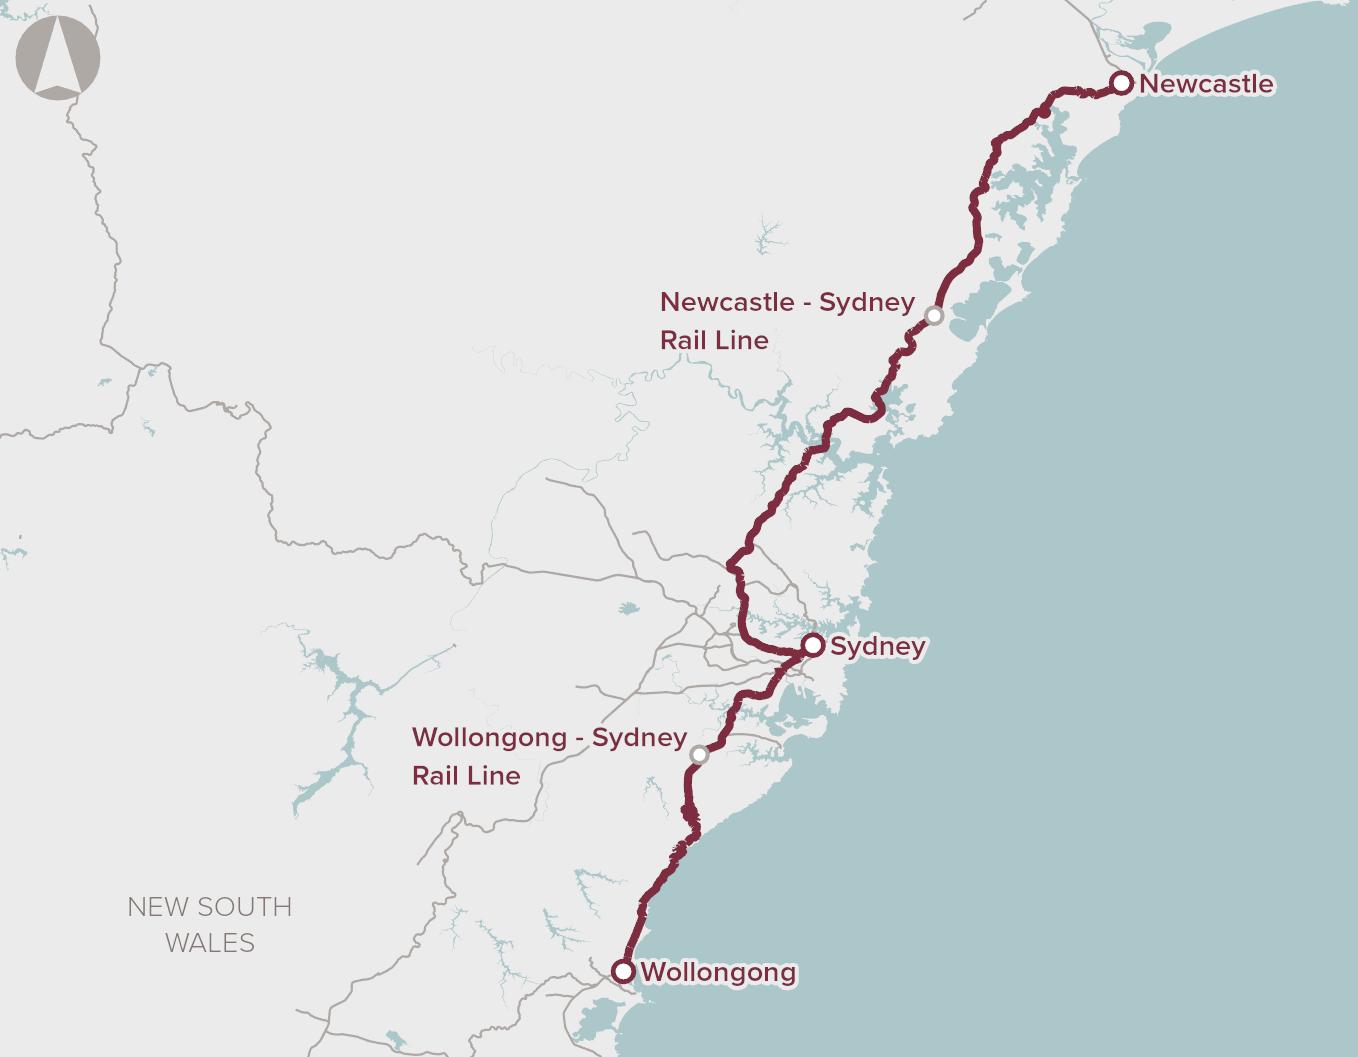
Newcastle-Sydney And Wollongong-Sydney Rail Line Upgrades
Category: Transport & Logistics | Type: Major ProjectSource / Links: Admin ID: 834
Upgrades to improve rail speed and reduce travel times between Newcastle, Wollongong, and Sydney, enhancing connectivity and productivity. Includes operational, infrastructure improvements, and new rail crossings.
Bonnyrigg Renewal
Category: Communities, Precincts & Urban Renewal | Type: Local ProjectStage: Under Construction Source / Links: Link 1 Link 2 Admin ID: 1184
The $855-million masterplan in Bonnyrigg Estate includes the development of Stages 8 to 11, known as the Humphries Precinct, with 30% social and 70% private housing, aiming for 3000 homes with community amenities.

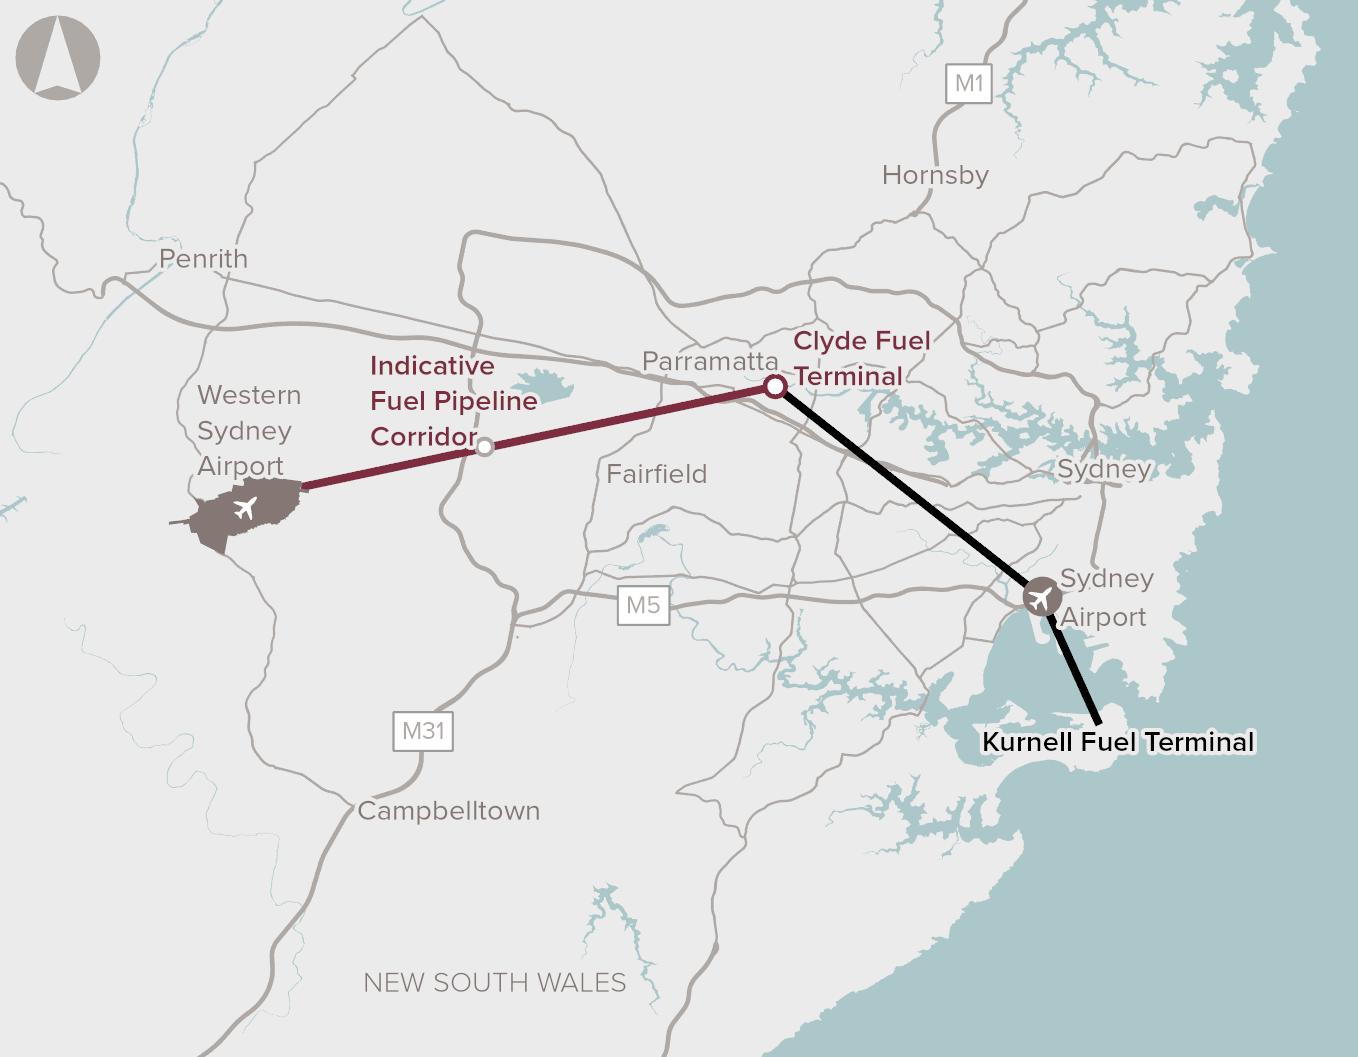
Corridor Preservation For Western Sydney Airport Fuel Pipeline
Category: Energy | Type: Major ProjectSource / Links: Admin ID: 855
Early-stage proposal for a fuel pipeline between Sydney's network and Western Sydney Airport to reduce congestion and ensure efficient fuel transport. Identifies key next steps.
Greater Sydney Cycling Network Improvements
Category: Transport & Logistics | Type: Major ProjectSource / Links: Admin ID: 701
Improving Sydney's cycling infrastructure can convert over 2m short car trips to cycling, reducing congestion and emissions while promoting health and decarbonisation of the transport sector.

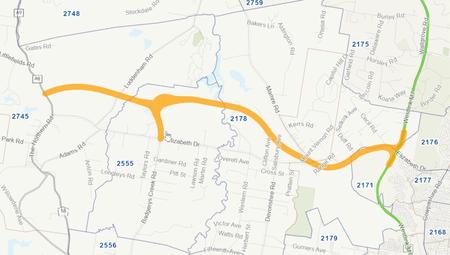
Elizabeth Drive Upgrade
Category: Transport & Logistics | Type: Major ProjectStage: Prospective Source / Links: Link 1 Admin ID: 475
The NSW Government plans to enhance Elizabeth Drive, stretching from M7 Motorway at Cecil Hills to The Northern Road at Luddenham, parallel to the proposed M12 Motorway, covering around 14 kilometres.

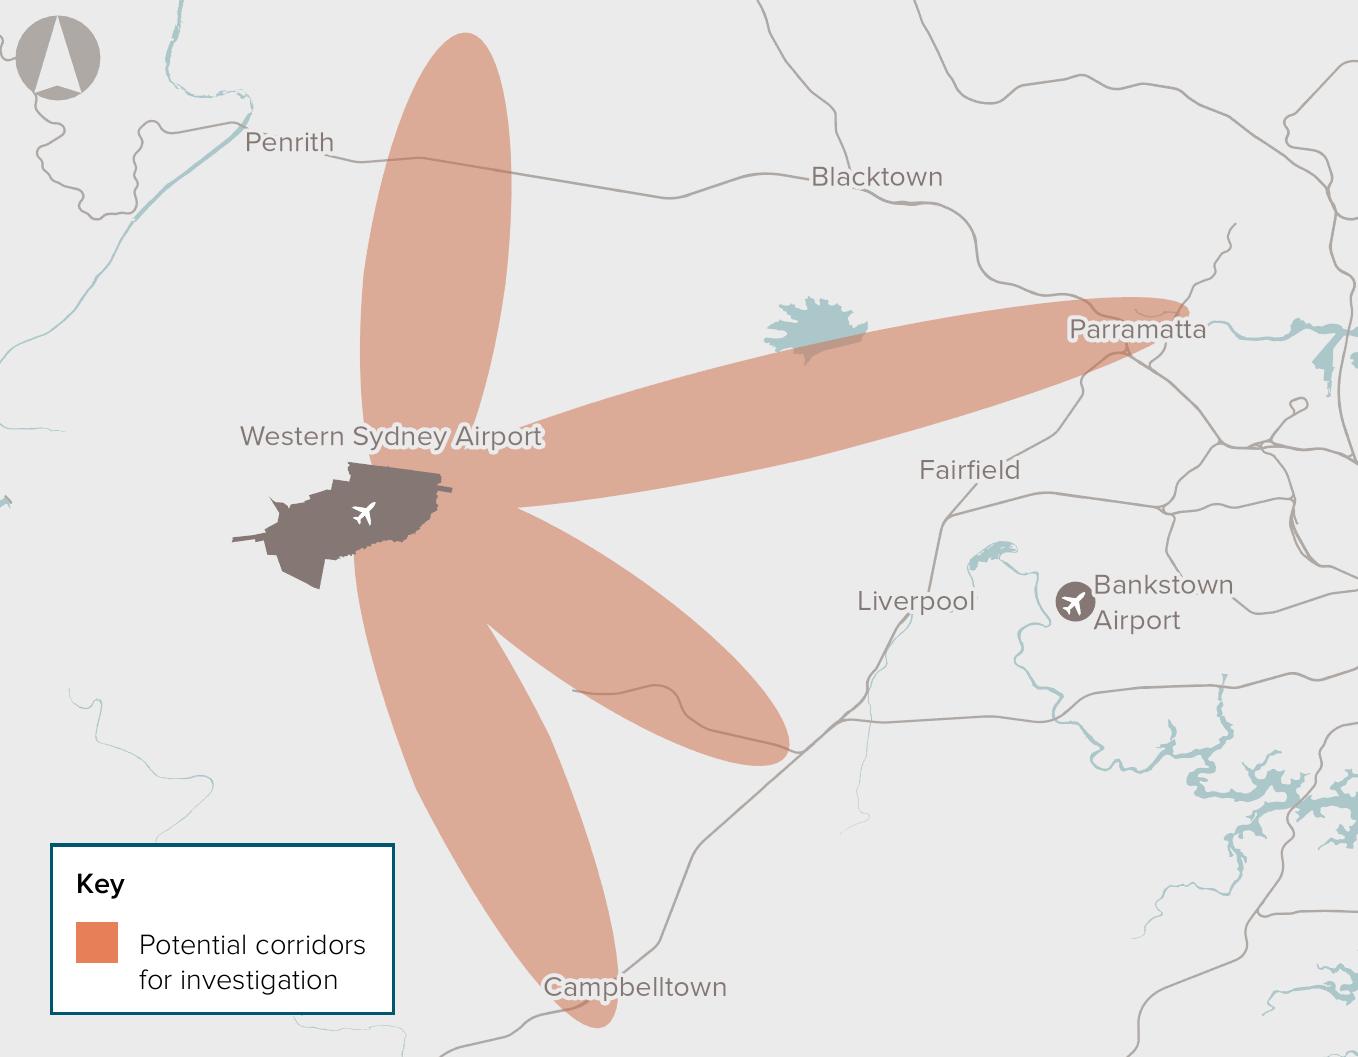
Corridor Preservation For Western Sydney Airport Rail Connections
Category: Transport & Logistics | Type: Major ProjectSource / Links: Admin ID: 853
Early proposal to preserve rail corridors for future Western Sydney Airport connections, enhancing transport to support regional growth and airport accessibility. Focuses on planning and early-stage options for a developing infrastructure.
Upper South Creek Advanced Water Recycling Centre - Stage One
Category: Environmental & Disaster Management | Type: Major ProjectStage: Under Delivery Source / Links: Link 1 Admin ID: 494
The Upper South Creek Water Recycling Centre in Western Sydney will treat up to 70 megalitres/day, starting with 35 megalitres/day by 2025. It features multiple pipelines and supports recycling and renewable energy.

Sydney Rail Network Capacity
Category: Transport & Logistics | Type: Major ProjectSource / Links: Admin ID: 807
Project aims to upgrade Sydney's rail network, addressing crowding by enhancing capacity and improving signalling, considering flexible post-pandemic travel patterns to ensure reliability and productivity.
What is the latest population estimate for Edensor Park?
Total population for Edensor Park was estimated to be approximately 10,201 as at February 25. This is based upon an estimated resident population of 10,195 from the ABS up to June 2024 and an additional 11 validated new addresses since the Census date.
What is the ratio of males and females in Edensor Park?
48.2% were recorded as male and 51.8% were identified as female as at the 2021 Census
How has the population in the Edensor Park area changed since 2021?
Edensor Park has lost approximately 91 people and shown a slight 0.9% decrease from the 10,292 people recorded at the 2021 Census period.
What is the population density in the Edensor Park area?
The population density in the Edensor Park area is estimated at 3,291 persons per square kilometer, this is based on the latest estimate for February 25 derived from a land area of 3.1sq km and population estimate of 10,201. At the 2021 Census the persons per square kilometer was estimated at 3,320.
What is the projected population growth in the Edensor Park area?
Between 2024 and 2041, approximately 493 people are expected to be added, showing a projected growth rate of 4.84% in total, or an average of 0.28% per annum.
How much has the population grown in the Edensor Park area over the past 10 years?
Over the past 10 years, on an ABS estimated resident population basis to June 2024 the population in the Edensor Park area has grown by 93 people, which is a growth rate of 0.09% per annum.
How many dwelling approvals have occurred in the Edensor Park area recently?
Dwelling approval activity in the Edensor Park area has seen 59 residential approvals over the past two financial years, based on AreaSearch's SA2 aggregation method. Edensor Park's current population of 10,201 has been supported by 26 approvals on average over recent years.
How does Edensor Park's development activity compare to the broader region?
Edensor Park has seen 0.29 approvals per 100 people in recent years, compared to 0.57 approvals in Greater Sydney. This means that one dwelling has been approved for every 345 people in Edensor Park, compared to one for every 180 in Greater Sydney.
Is the Edensor Park area keeping up with housing demand?
With the population expected to increase by 487 people by 2041, around 148 new dwellings will be necessary. Recent approval levels appear more than sufficient to meet these forecasts, considering the census average of 3.3 persons per dwelling. This suggests that population growth may exceed trend projections in the coming years, supported by a robust housing supply.
What has been the trend in development approvals over the past five years?
Looking at development activity over the past five years, Edensor Park's approval levels have been above the yearly average of 26.
How many dwellings will be needed to accommodate future population growth?
The population in Edensor Park is expected to grow by 487 people, necessitating approximately 148 new dwellings.
How does recent development compare to population growth in Edensor Park?
Over the past five years, the population in Edensor Park has grown by approximately -255 people, while 133 residential approvals were recorded. This equates to a ratio of -1.9 people added for each new dwelling approval.
Are there opportunities for residential developers in Edensor Park?
With dwelling approval activity running at an average of 26 approvals per year and a population of 10,201, The market appears to be adequately supplied relative to projected housing demand in recent years, suggesting that developers should have a longer-term approach when considering new projects. With the population expected to increase by 487 people by 2041, around 148 new dwellings will be necessary. Recent approval levels appear more than sufficient to meet these forecasts, considering the census average of 3.3 persons per dwelling. This suggests that population growth may exceed trend projections in the coming years, supported by a robust housing supply.
What is the total employment in the Edensor Park area?
As of Dec-2024, total employment in the Edensor Park area was estimated at 4,585 according to AreaSearch's analysis of data from Jobs and Skills Australia.
What is the unemployment rate in the Edensor Park area?
The unemployment rate in the Edensor Park area as of Dec-2024 was estimated at 5.9%, compared to 4.1% in Greater Sydney from Jobs and Skills Australia.
What is the participation rate in the Edensor Park area?
The participation rate in the Edensor Park area is 45.7%, which trails the Greater Sydney average of 60.0% according to 2021 Census analysis.
How has employment changed in the past year in the Edensor Park area?
Total employment in the Edensor Park area has increased 3.5% over the past year, while the labor force has increased 4.0%, causing the unemployment rate to rise 0.4%.
What industry is most over-represented in the Edensor Park area?
The most over-represented employment industry in Edensor Park is manufacturing, which makes up 10.0% of total employment compared to 5.7% in Greater Sydney according to our analysis of 2021 Census Data.
Which industries are under-represented in the Edensor Park area?
Professional & technical is under-represented in the Edensor Park area, making up only 6.3% of the workforce compared to 11.5% in Greater Sydney.
What are the key industries of employment in the Edensor Park area?
The key industries of employment in the Edensor Park area are health care & social assistance, retail trade and construction, which make up 12.3%, 12.2% and 10.4% of overall employment, respectively.
What is the median age in the Edensor Park area?
According to the latest data, the median age in the Edensor Park area is 39 years.
How does Edensor Park's median age compare to the region?
The median age in the Edensor Park area is 39 years, which is 2 years older the median age of 37 years in the Greater Sydney region.
What age groups are over-represented in the Edensor Park area?
The most over-represented age group in the Edensor Park area compared to the Greater Sydney region is the 65 - 74 group, making up 11.9% of the population.
What age groups are under-represented in the Edensor Park area?
The most under-represented age group in the Edensor Park area compared to the Greater Sydney region is the 35 - 44 group, making up 11.0% of the population.
Are there age groups with notable population variances?
Yes, certain age groups in the Edensor Park area show significant variance compared to the Greater Sydney region. The most over-represented age group is 65-74 year-olds (11.9% vs 8.1%).
What is the percentage of children (0-14 years) in the Edensor Park area?
The percentage of children aged 0-14 years in the Edensor Park area is 16.4%.
What is the percentage of older people (65+ years) in the Edensor Park area?
The percentage of people aged 65 and over in the Edensor Park area is 19.9%.
What is the median taxable income in the Edensor Park area?
According to analysis of the latest ATO data as of FY-22, the median taxable income among taxpayers in the Edensor Park area is estimated at $46,511.
What is the average taxable income in the Edensor Park area?
According to analysis of the latest ATO data as of FY-22, the average taxable income among taxpayers in the Edensor Park area is estimated at $59,561.
How does the median taxable income in Edensor Park compare to the region?
The median taxable income in Edensor Park is $46,511, while the median taxable income in Greater Sydney is $56,994, according to the ATO data as of FY-22.
How does the average taxable income in Edensor Park compare to the region?
The average taxable income in Edensor Park is $59,561, while the average taxable income in Greater Sydney is $80,856, based on the latest ATO data for FY-22.
What are the main income cohorts in the Edensor Park area according to the 2021 Census?
As per the 2021 Census, the income bracket containing the largest proportion (~32% / 3,268 persons) of Edensor Park's population is the $1,500 - 2,999 cohort.
How do the main income cohorts in Edensor Park compare to the region?
The largest income cohort in Edensor Park is the $1,500 - 2,999 group, representing about 32% of the population. In comparison, Greater Sydney's largest income cohort is the $1,500 - 2,999 group, representing 34% of its population, according to the 2021 Census.
What is the median household income in the Edensor Park area according to the 2021 Census?
The 2021 Census data indicates that the median household income in the Edensor Park area is $1,817/wk.
What is the median family income in the Edensor Park area according to the 2021 Census?
According to the 2021 Census, the median family income in the Edensor Park area is $1,805/wk.
What is the median personal income in the Edensor Park area according to the 2021 Census?
The 2021 Census shows that the median personal income in the Edensor Park area is $538/wk.
How does Edensor Park's income rank nationally?
According to AreaSearch's aggregation of the latest postcode level ATO data released for FY-22, Edensor Park had a median income among taxpayers of $46,511 with the average level standing at $59,561. This is lower than average on a national basis and compares to levels of $56,994 and $80,856 across Greater Sydney respectively.
What percentage of the Edensor Park area population holds a university-level qualification?
In the Edensor Park area, 14.9% hold a Bachelor's degree, 0.9% hold a Graduate Diploma and 2.5% hold a Postgraduate qualification.
What percentage of the Edensor Park area population holds a certificate or advanced diploma?
In the Edensor Park area, 9.4% hold an Advanced Diploma and 17.9% hold a Certificate qualification.
What is the overall school attendance rate in the Edensor Park area?
The overall school attendance rate in the Edensor Park area is approximately 1.8% for preschool, 9.3% for primary school, 8.9% for secondary school, 2.8% for technical school and 5.3% for university.
What is the Edensor Park area's overall education rank?
the Edensor Park area ranks in the 20th percentile in terms of overall education performance on AreaSearch's analysis.
How many households are there in the Edensor Park area?
There was an approximate total of 2,988 households within Edensor Park at the 2021 Census. Based on our latest estimates (see the population section) the total number of households has likely shrunk to 2,962.
How does the median household size compare to the regional average?
The median household size in Edensor Park is 3.4, which is above the regional average of 2.7.
What are the most common household types in Edensor Park?
85.6% are families, 10.3% are lone persons, 0.7% are group households, while 3.1% are 'other' households. Based on our latest estimates (see the population section) the total number of households has likely shrunk to 2,962.
Which household type is most over or under-represented in Edensor Park compared to the region?
The household type standing out as most clearly over-represented is family households, with 85.6% of Edensor Park's total households compared to 69.5% across Greater Sydney. Meanwhile, of Edensor Park's families, 19.6% are couples with no children, 49.1% are couples with children and 15.5% are single parent families, compared to 23.3%, 34.4% and 10.5% for Greater Sydney.
How many children per family are there in Edensor Park compared to the regional average?
Edensor Park leads the Greater Sydney average of 1.5 children per family, recording a figure of 1.8.
What is the marriage status of Edensor Park's population?
Of Edensor Park's population, 33.3% have never been married while 52.3% are currently married, in contrast to Greater Sydney's results of 36.4% and 48.3% for the same metrics.
What percentage of dwellings in the Edensor Park area are houses?
According to the latest data, 89.5% of dwellings in the Edensor Park area are houses.
What percentage of dwellings in the Edensor Park area are semi-detached, apartments, or other types?
In the Edensor Park area, 8.5% of dwellings are semi-detached, 1.9% are apartments and 0.0% are classified as 'other' dwellings.
What is the level of outright home ownership in the Edensor Park area?
Outright home ownership in the Edensor Park area stands at 39.3%.
What is the median monthly mortgage repayment in the Edensor Park area?
The median monthly mortgage repayment in the Edensor Park area is $2,167 according to the 2021 Census.
What is the median weekly rent in the Edensor Park area?
The median weekly rent in the Edensor Park area is $450 according to the 2021 Census.
How many people in the Edensor Park area have private health insurance?
Around 49.5% of people in the Edensor Park area are covered by private health insurance, which compares to 59.3% in the broader region of Greater Sydney.
What percentage of the population requires ongoing medical assistance in the Edensor Park area?
In the Edensor Park area, 8.8% of the population is identified as requiring ongoing medical assistance. This figure is slightly different from the regional average, where 5.2% of people in Greater Sydney require similar assistance.
How prevalent is asthma in the Edensor Park area?
5.7% of people in the Edensor Park area are diagnosed with asthma. In comparison, 7.3% of the population across Greater Sydney is affected by asthma.
What percentage of people have diabetes in the Edensor Park area?
Diabetes affects 7.3% of Edensor Park population, while in the surrounding region, 4.9% of people are diagnosed with diabetes.
What is the percentage of people with heart disease in the Edensor Park area?
3.6% of people in the Edensor Park area have heart disease. Across the region of Greater Sydney, 3.6% of the population is affected by heart disease.
How does Edensor Park compare to the region in terms of overall private health coverage?
In the Edensor Park area, 49.5% of the population are estimated to have private health insurance. Comparatively, Greater Sydney sees an estimated private health coverage rate of 59.3%.
What is the level of cultural diversity in the Edensor Park area?
Edensor Park scores highly on cultural diversity, with 70.2% of its population speaking a language other than English at home and 54.6% born overseas.
What is the most common religion in the Edensor Park area?
The main religion in Edensor Park was found to be Christianity, which makes up 71.1% of people in Edensor Park. However, the most apparent overrepresentation was in Buddhism, which comprises 13.9% of the population, substantially higher than the Greater Sydney average of 4.1%.
What are the top countries of origin in the Edensor Park area?
In terms of country of origin, the top three represented groups in the Edensor Park area are Other, comprising 39.6% of the population, which is substantially higher than the regional average of 16.0%, Italian, comprising 9.3% of the population, which is substantially higher than the regional average of 3.4% and Vietnamese, comprising 9.2% of the population, which is substantially higher than the regional average of 1.8%. Additionally, there are notable divergences in the representation of certain other groups. Australian is notably lower than the regional average, comprising 8.2% of Edensor Park population compared to 17.8% regionally. English is notably lower than the regional average, comprising 5.8% of Edensor Park population compared to 18.9% regionally.
How does the percentage of people born overseas compare to the regional average?
54.6% of Edensor Park population was born overseas, compared to 40.5% regionally.
What percentage of Edensor Park population speaks a language other than English at home?
70.2% of the population in Edensor Park speaks a language other than English at home, compared to 39.5% in the wider region.
How many people in Edensor Park identify as Australian Aboriginal?
0.4% of Edensor Park population identifies as Australian Aboriginal, compared to 1.3% in the region.
What is the citizenship status of the population in Edensor Park?
84.4% of Edensor Park population holds citizenship, compared to 80.8% in the wider region.
Amenity
AreaSearch's amenity score assesses locational convenience by measuring the distance to closest access point and average distance to the nearest three access points, for critical community services. Please note for certain sectors this covers only major operators assessed regularly by AreaSearch. Amenity for the Edensor Park population centre midpoint was found to be outstanding overallbanks and schools lagged other categories in terms of convenience.
| Category | Number | Dist to 3 (km) |
|---|---|---|
| Supermarket | 1 | 0.97 km |
| Child Care | 8 | 0.26 km |
| GP | 2 | 0.74 km |
| Government Services | 2 | 1.01 km |
| Dentist | 1 | 1.02 km |
| Hospital | 0 | 4.31 km |
| Shopping Centre | 0 | 1.93 km |
| Banks | 0 | 2.44 km |
| Pharmacy | 1 | 1.03 km |
| Fitness Centre | 0 | 1.39 km |
| Schools | 2 | 0.84 km |
Schools
Amenity for schools in the area was moderate with the nearest operator located approximately 420 meters away from the location midpoint and the average distance to the nearest 3 operators standing at 840 meters according to AreaSearch's analysis. There were 2 schools operating within the specific catchment area assessed based on latest adopted data.
For a detailed assessment of schools within the catchment area, please refer to the education tab. For specialized reports or consultancy services, please Contact Us for further information.
Amenity for supermarkets in the area was very high with the nearest operator located only 220 meters away from the location midpoint and the average distance to the nearest 3 operators standing at 970 meters according to AreaSearch's analysis. A single supermarket was assessed as operating within the specific catchment area.
Please be aware that the supermarket assessment primarily relies on simple distance metrics and may not fully capture demand and supply dynamics. See HERE for benchmarks or for a comprehensive evaluation that includes micro-level population statistics, adjusted competition catchments, and retail expenditure estimates, as well as information on major nearby competing and complementary retailers, we recommend accessing the detailed Retail section within MicroSearch. Alternatively, Contact Us for more information on obtaining sector access, detailed reports, or consulting services.
Amenity for child care centres in the area was exceptional with the nearest operator located just 250 meters away from the location midpoint and the average distance to the nearest 3 operators standing at 260 meters according to AreaSearch's analysis. There were 8 child care centres operating within the specific catchment area assessed based on latest adopted data.
Note that our analysis of the Child Care amenities is based on straightforward distance measurements and does not address the full complexities of demand and supply. See HERE for benchmarks, or for specific insights into available spots, child-to-space ratios, proximity to schools, age of centers, and pricing details, please consult the Child Care section of MicroSearch. If further assistance is needed, Contact Us to discuss sector access, report customization, or our consulting services.
Amenity for general practitioners in the area was very high with the nearest operator located just 340 meters away from the location midpoint and the average distance to the nearest 3 operators standing at 740 meters according to AreaSearch's analysis. There were 2 gp clinics operating within the specific catchment area assessed based on latest adopted data.
While our GP amenity assessment is informative, it is based only on proximity and might not adequately reflect market demand and supply conditions. For an in-depth analysis that includes data on private health insurance coverage, Medicare benefits scheme spending, and other relevant metrics across all significant medical service providers, professional plan users with sector access should view the Medical section within MicroSearch. For additional resources, Contact Us.
Amenity for government service locations in the area was exceptional with the nearest operator located only 250 meters away from the location midpoint and the average distance to the nearest 3 operators standing at 1.01 kilometers according to AreaSearch's analysis. There were 2 government service locations operating within the specific catchment area assessed based on latest adopted data.
Government services encompass a variety of facilities like post offices and Services Australia Centres. It's important to note that our location-based analysis may not adequately reflect the actual demand and supply. For a deeper dive into micro-level demographics, adjusted catchment areas, and spending behaviors, those with access should view the Retail analysis section within MicroSearch or Contact Us for more detailed access or personalized consulting.
Amenity for dental clinics in the area was high with the nearest operator located only 260 meters away from the location midpoint and the average distance to the nearest 3 operators standing at 1.02 kilometers according to AreaSearch's analysis. A single dental clinic was assessed as operating within the specific catchment area.
Please consider that our distance-based assessment of dental clinics might not capture all dimensions of market demand and supply. For a more nuanced analysis that covers aspects like insurance coverage and spending within the dental sector, view the Medical section on MicroSearch. Should you require further information, Contact Us to access more detailed data or consultation services.
Amenity for hospitals in the area was very high with the nearest operator located approximately 2.94 kilometers away from the location midpoint and the average distance to the nearest 3 operators standing at 4.31 kilometers according to AreaSearch's analysis. While nearby access to hospitals is above average, none were based within the specific catchment area according to the latest surveryed data.
The assessment of hospital amenities provided here focuses on simple distance metrics and might not be sufficient for comprehensive demand and supply analysis. For detailed insights into hospital capacities, procedure volumes, waiting times, and broader health coverage metrics, visit the Medical section of MicroSearch. For further inquiries, Contact Us.
Amenity for shopping centres in the area was high with the nearest operator located approximately 1.38 kilometers away from the location midpoint and the average distance to the nearest 3 operators standing at 1.93 kilometers according to AreaSearch's analysis. While nearby access to shopping centres is above average, none were based within the specific catchment area according to the latest surveryed data.
Please note that, while hopefully useful, the shopping centre amenity here is based on a simple distance assessment and is insufficient for demand and supply analysis. For a detailed analysis that considers micro-level population counts, effective (competition-adjusted) catchments, retail spending estimates, and all major nearby retailers, both competing and complementary, please see the Retail section within MicroSearch for those with access. Alternatively Contact Us to inquire about sector access, reports, or consulting services.
Amenity for banks in the area was moderate with the nearest operator located approximately 1.44 kilometers away from the location midpoint and the average distance to the nearest 3 operators standing at 2.44 kilometers according to AreaSearch's analysis. There were no banks operating within the specific catchment area based on the latest surveryed data.
Amenity for pharmacies in the area was high with the nearest operator located only 250 meters away from the location midpoint and the average distance to the nearest 3 operators standing at 1.03 kilometers according to AreaSearch's analysis. A single pharmacie was assessed as operating within the specific catchment area.
Please note that, while hopefully useful, the pharmacy amenity referenced here is based on a simple proximity assessment and is insufficient for demand and supply analysis. Pharmacies are covered across both our retail and medical category analysis enabling effective population catchment analysis and demand and supply analysis for all major primary and allied health provider types. Those with access should see the relevant sections within MicroSearch. Alternatively Contact Us to inquire about sector access, required reports, or consulting services.
Amenity for fitness centres in the area was high with the nearest operator located only 260 meters away from the location midpoint and the average distance to the nearest 3 operators standing at 1.39 kilometers according to AreaSearch's analysis. While nearby access to fitness centres is above average, none were based within the specific catchment area according to the latest surveryed data.
The current assessment of fitness centres is limited to proximity to major operators and lacks a detailed supply and demand analysis. For a thorough evaluation that considers demographic specifics and market competition, please refer to the Retail section of MicroSearch. For direct inquiries, Contact Us.
Amenity for schools in the area was moderate with the nearest operator located approximately 420 meters away from the location midpoint and the average distance to the nearest 3 operators standing at 840 meters according to AreaSearch's analysis. There were 2 schools operating within the specific catchment area assessed based on latest adopted data.
For a detailed assessment of schools within the catchment area, please refer to the education tab. For specialized reports or consultancy services, please Contact Us for further information.
Aged Care & SDA
AGED CARE MAP |
SDA FACILITIES |
DATA TABLES
| Id | Name | Address | Type | Places | Dist (Km) |
|---|
Note: ○ Places for retirement villages represent individual dwellings. Not all dwelling numbers are available at present.
| Name | Suburb | Build Type | NDIS Design | Rooms | Max Price / Rm |
|---|
Note: ○ Exact locations are not provided for NDIS facilities, the above list represents registered facilities in each suburb covered by the catchment
Retail Analysis
MAJOR BRANDS |
SPENDING |
INCOME |
MACRO
Education
Edensor Park showed a lower quartile ranking for education, based on AreaSearch's broad range of educational achievement and performance statistics. 18.3% of residents in Edensor Park have completed bachelor or postgraduate qualifications which is materially below the 38.0% recorded for Greater Sydney, while 20.0% of the resident population reported to be attending school between pre-school and secondary level, while 2.8% were attending a technical college and 5.3% attending university.
Two schools were identified in Edensor Park, being Edensor Park Public School and Governor Philip King Public School, which had total combined places of 811. The average ICSEA score (which bases off a national average of 1000) equated to 974, which is marginally under the average seen across Greater Sydney of 1,050.
SCHOOLS |
TABLE |
GRAPHIC
| Id | Name | Type | Places | ICSEA | Dist (Km) | URL |
|---|
Id | Name | Type | Places | ICSEA | Dist (Km) | URL |
|---|---|---|---|---|---|---|
| Edensor Park Public School | Primary | 281 | 969 | 0.30 | Link | |
| Governor Philip King Public School | Primary | 530 | 980 | 0.76 | Link |
| Metric | Catchment | Greater Sydney |
|---|---|---|
| Highest Education Level Achieved | ||
| Reports Post-School Qualifications (15yrs+) | 45.6% | 65.8% |
| - Post Graduate Degree | 2.5 | 10.7 |
| - Graduate Diploma / Certificate | 0.9 | 2.4 |
| - Bachelor Degree | 14.9 | 24.9 |
| - Advanced Diploma | 9.4 | 11.0 |
| - Technical Certificate | 17.9 | 16.8 |
| Attending an Institution | ||
| Total Attending Percentage | 29.2 | 31.2 |
| of which: | ||
| - Attending Preschool | 1.8 | 2.5 |
| - Attending Primary School | 9.3 | 9.8 |
| - Attending Secondary School | 8.9 | 7.8 |
| - Attending Technical Institution | 2.8 | 3.2 |
| - Attending University | 5.3 | 6.6 |
| - Attending Other Institution | 1.1 | 1.3 |
Note: ○ School places and ICSEA performance based on latest ACARA data ○ Student and qualification splits based on population weighted averaging of Census data released for SA2 areas that intersect the catchment. * Estimated resident student population includes those attending tertiary education
Housing
Dwelling structure within Edensor Park, as evaluated at the latest Census, comprised 89.5% houses and 10.5% other dwellings (semi-detached, apartments, 'other' dwellings), in comparison to Greater Sydney's 55.3% houses and 44.7% other dwellings. Meanwhile, the level of home ownership within Edensor Park was beyond that of Greater Sydney, at 39.3%, with the remainder of dwellings either mortgaged (33.5%) or rented (27.2%). The median monthly mortgage repayment in Edensor Park was below the Greater Sydney average at $2,167, while the median weekly rent figure was recorded at $450, compared to Greater Sydney's $2,427 and $470.
TABLE |
GRAPHIC
| Metric | Catchment | Greater Sydney |
|---|---|---|
| Structures | ||
| - House | 89.5% | 55.3% |
| - Semi Detatched | 8.5% | 12.8% |
| - Apartments | 1.9% | 31.3% |
| Ownership | ||
| - Owned Outright | 39.3% | 28.6% |
| - Mortgaged | 33.5% | 34.2% |
| - Renting | 27.2% | 37.2% |
| Costs | ||
| Median Morgage Cost ($/mo) | $2,167 | $2,427 |
| Median Rental ($/wk) | $450 | $470 |
| - 0 to 149 ($/wk) | 4.7% | 5.4% |
| - 150 to 349 ($/wk) | 17.8% | 16.1% |
| - 350 to 649 ($/wk) | 72.8% | 59.1% |
| - 650 to 949 ($/wk) | 4.0% | 14.9% |
| - 950+ ($/wk) | 0.7% | 4.5% |
| Aggregate Housing Cost ($/mo) | $1,255 | $1,587 |
Diversity
Edensor Park scores highly on cultural diversity, with 70.2% of its population speaking a language other than English at home and 54.6% born overseas.
The main religion in Edensor Park was found to be Christianity, which makes up 71.1% of people in Edensor Park. However, the most apparent overrepresentation was in Buddhism, which comprises 13.9% of the population, substantially higher than the Greater Sydney average of 4.1%. In terms of country of origin, the top three represented groups in Edensor Park area are Other, comprising 39.6% of the population, which is substantially higher than the regional average of 16.0%, Italian, comprising 9.3% of the population, which is substantially higher than the regional average of 3.4%, and Vietnamese, comprising 9.2% of the population, which is substantially higher than the regional average of 1.8%. Additionally, there are notable divergences in the representation of certain other groups. Australian is notably lower than the regional average, comprising 8.2% of Edensor Park population compared to 17.8% regionally. English is notably lower than the regional average, comprising 5.8% of Edensor Park population compared to 18.9% regionally..
TABLE |
GRAPHIC
| Metric | Catchment | Greater Sydney |
|---|---|---|
| Culture | ||
| - Australian Born | 45.4% | 59.5% |
| - O/S Born | 54.6% | 40.5% |
| - Australian Citizen | 84.4% | 80.8% |
| - English Only | 29.8% | 60.5% |
| - Second Language At Home | 70.2% | 39.5% |
| Religion | ||
| - Buddhism | 13.9% | 4.1% |
| - Christian | 71.1% | 49.0% |
| - Hinduism | 0.8% | 5.2% |
| - Islam | 2.4% | 6.7% |
| - Judaism | 0.0% | 0.8% |
Health
Edensor Park's residents are extremely healthy with very low prevalence of common health conditions across all age groups and the rate of private health cover was found to be relatively low at approximately 50% of the total population (~5,050 people). The most common medical conditions in the area were found to be arthritis and diabetes, impacting 7.7 and 7.3% of residents, respectively, while 76.2% declared themselves as completely clear of medical ailments compared to 74.6% across Greater Sydney. Overall 8.8% of the total population registered as requiring assistance with day to day activities, which is considerably higher than the national average .
For a far more detailed assessment of health metrics and drivers, including detailed hospital supply, admission and procedure data, Medicare expenditure across cohorts, practitioner locations, relativities and expenditure forecasts please see the medical section or enquire about access.
TABLE |
GRAPHIC
| Metric | Catchment | Catchment 65+ | Greater Sydney | Greater Sydney 65+ |
|---|---|---|---|---|
| General | ||||
| - Need for Assistance | 8.8% | n.a. | 5.2% | n.a. |
| - Private Health Cover Rate | 49.5% | n.a. | 59.3% | n.a. |
| Long Term Health Conditions | ||||
| - Zero L/T Health Conditions | 76.2% | 42.1% | 74.6% | 38.3% |
| - One Long Term Condition | 16.9% | 32.2% | 18.0% | 32.3% |
| - Two Long Term Conditions | 4.5% | 13.4% | 5.0% | 16.1% |
| - 3+ Long Term Conditions | 2.5% | 9.6% | 2.4% | 10.7% |
| Individual Conditions Detail | ||||
| - Arthritis | 7.7% | 25.1% | 7.3% | 28.7% |
| - Asthma | 5.7% | 5.7% | 7.3% | 7.9% |
| - Cancer | 2.2% | 6.8% | 2.6% | 10.2% |
| - Demential / Alzheimers | 0.8% | 3.6% | 0.7% | 4.6% |
| - Diabetes | 7.3% | 24.7% | 4.9% | 16.8% |
| - Heart Disease | 3.6% | 14.4% | 3.6% | 16.6% |
| - Kidney Disease | 0.6% | 2.4% | 0.9% | 3.4% |
| - Lung Condition | 1.0% | 3.6% | 1.3% | 5.7% |
| - Mental Health Issue | 4.8% | 6.1% | 7.1% | 7.4% |
| - Stroke | 0.8% | 3.1% | 0.8% | 3.8% |
| - Other Condition | 9.2% | 17.0% | 8.0% | 15.6% |
Note: ○ Private health cover estimated from percentile ranges of taxable income to private health coverage ratios by the ATO.
Land Use
Residential, parkland and education are the only land-use categories within Edensor Park, making up approximately 2.6 (83.6%), 0.4 (14.3%) and 0.1 (2.1%) Sqkm of land, respectively. Please note; totals and percentages based on sum of categorised mesh blocks that fall within Edensor Park as opposed to total Edensor Park land area - minor differences may exist between land-use category totals and total land area, as mesh blocks at the edges of Edensor Park are unlikely to intersect perfectly along Edensor Park boundary.
CHART |
MAP
Surrounds
Enter Search Term
The surrounds feature enables AreaSearch clients to quickly assess the catchment for nearby places of interest via our integration with the Google Places API.
Up to 60 results per search category can be attained. Please input, or select, a term to search. Please note 5 account credits are used per 100 results returned from this search, which accumulates on your account due to 3rd party data costs.
| Type | Name | Address | Distance | In Catch | G-Map | G-Search | Display |
|---|
Public Transport & Access
STOPS MAP | GRAPHIC

Total Stops

Trips

Routes / Wk

Population / Stop

Population / Trip

Population / Route

Avg Dist of Stops

Res Distance
Catchment / Greater Sydney Avg
| Type | Name | Distance | Routes | Trips / Wk |
|---|
Child Care Analysis
| Id | Name | Type | Places | Approval | Distance (Km) | Day Rate | Availability |
|---|
Key Metrics
Catchment / Greater Sydney

LDC Providers

Total LDC Places

Total Population

Persons Per Place

Persons Per Place (Comm Adj)

Population Aged 0-4

Pop Aged 0-4 Per LDC Place

Pop Aged 0-4 Per LDC Place (Comm Adj)

Total School Attendance

School Places Per LDC Place

Average LDC Fee($/day)

Other Places (PSK / OOSH)
Medical Analysis
MAP DATA |
SUPPLY RELATIVITIES |
MBS DEMAND DATA |
SUMMARY TEXT
| Map Ref | Name | Address | Services | Dist |
|---|
| Category | Count | Closest | Population Per | Avg Dist | Reg Pop Per | Reg. Avg Dist |
|---|
| Category | Count | Closest | Population Per | Pop. Per Comm Adj | Avg Dist | Reg Pop Per | Reg. Avg Dist |
|---|
Overview
Medical Services
Medical MBS Spending
SUMMARY TABLES
| POPULATION AGE SPLITS | 0-24 | 25-44 | 45-64 | 65+ | Total |
|---|---|---|---|---|---|
| 2022 Est | 888 | 123 | 123 | 123 | 123 |
| 2041 Fcst | 888 | 123 | 123 | 123 | 123 |
| Growth Fcst | 10% | 10% | 10% | 10% | 10% |
| Growth Rate | 10% | 10% | 10% | 10% | 10% |
| POPULATION GROWTH HISTORY | Catchment | Region | |||
|---|---|---|---|---|---|
| Growth From Census | 500 | 600 | |||
| 2016 to 2021 Growth | 500 | 600 | |||
| 2011 to 2016 Growth | 500 | 600 | |||
| 2006 to 2011 Growth | 500 | 600 | |||
| Metric | Catchment | Catchment 65+ | Greater Sydney | Greater Sydney 65+ |
|---|---|---|---|---|
| General | ||||
| - Need for Assistance | 8.8% | n.a. | 5.2% | n.a. |
| - Private Health Cover Rate | 49.5% | n.a. | 59.3% | n.a. |
| Long Term Health Conditions | ||||
| - Zero L/T Health Conditions | 76.2% | 42.1% | 74.6% | 38.3% |
| - One Long Term Condition | 16.9% | 32.2% | 18.0% | 32.3% |
| - Two Long Term Conditions | 4.5% | 13.4% | 5.0% | 16.1% |
| - 3+ Long Term Conditions | 2.5% | 9.6% | 2.4% | 10.7% |
| Individual Conditions Detail | ||||
| - Arthritis | 7.7% | 25.1% | 7.3% | 28.7% |
| - Asthma | 5.7% | 5.7% | 7.3% | 7.9% |
| - Cancer | 2.2% | 6.8% | 2.6% | 10.2% |
| - Demential / Alzheimers | 0.8% | 3.6% | 0.7% | 4.6% |
| - Diabetes | 7.3% | 24.7% | 4.9% | 16.8% |
| - Heart Disease | 3.6% | 14.4% | 3.6% | 16.6% |
| - Kidney Disease | 0.6% | 2.4% | 0.9% | 3.4% |
| - Lung Condition | 1.0% | 3.6% | 1.3% | 5.7% |
| - Mental Health Issue | 4.8% | 6.1% | 7.1% | 7.4% |
| - Stroke | 0.8% | 3.1% | 0.8% | 3.8% |
| - Other Condition | 9.2% | 17.0% | 8.0% | 15.6% |
| MBS DEMAND | Catchment | Region | |||
|---|---|---|---|---|---|
| All Ages | 65+ | All Ages | 65+ | ||
| GP Services per 100 | TBC | TBC | TBC | TBC | |
| GP Fees Per 100 | TBC | TBC | TBC | TBC | |
| Allied Services per 100 | TBC | TBC | TBC | TBC | |
| Allied Fees Per 100 | TBC | TBC | TBC | TBC | |
| AREA DRIVERS | Catchment | Percentile | |||
|---|---|---|---|---|---|
| Private Health Cover (% of Population) | TBC | TBC | |||
| SEIFA ranking - Income | TBC | TBC | |||
| SEIFA ranking - Education | TBC | TBC | |||
| Median Household Income | TBC | TBC | |||
| University Graduate % | TBC | TBC | |||
| Commercial / Residential Adjustment | TBC | TBC | |||
| Residential Development Activity (Per 100) | TBC | n.a. | |||
| Transport Activity (Pop per Trip) | TBC | TBC | |||
MBS DEMAND
| Category | Statistic | Cohort | Catchment | Region |
|---|

GENERATE REPORT

PPT / WORD
EXCEL
Please use the below form to get in touch
Join Browser
The Browser Plan provides access to the AreaSearch system for a single user, enabling area views and downloads in PDF format for quick and effective analysis and comparison of local markets. The 150 plan credits can be used at anytime throught the year.

Session Timeout Warning
Your session is about to expire in 30 seconds. Would you like to extend your session?

Join Pro
The Professional Plan provides access to the AreaSearch system for up to 5 users, enabling custom area analysis, downloads in PowerPoint that can be edited and recoloured to suit specific reporting needs, full economic dataset downloads and more. TargetSearch access is included within the annual plan and sector access can be added upon request.
$150/mo
150 credits per month
Cancel anytime
Plus GST
$1000/yr
1500 credits per year
Includes Target Search
Plus GST

Pro Monthly